Market Minds Advisory
North America Naval Vessels Market

North America Naval Vessels Market: North America Naval Vessels: Trades Retention, Supplier Base Depth and Schedule Reality

This market is not short of money, it is short of welders, and yards that hire thousands a year while losing most of them inside twelve months cannot convert budget into hulls.

Lead Analyst

Published

September 2026

Make Smarter Decisions with Customized Research Insights

Request a free sample report and evaluate market opportunities, growth trends, and competitive dynamics relevant to your business needs.

2025 MARKET VALUE$46.0BMarket Size 2025
2036 FORECAST VALUE$92.8BBase Case , 2026 to 2036
CAGR 2026 TO 20366.6 %Bull 7.8% / Bear 5.4%
INCREMENTAL OPPORTUNITY$43.8BNet 10- year value creation
EXPANSION MULTIPLE1.89x2036 value over 2026 base
Strategic Levers
M&A Pipeline
Regional Outlook
Country Rankings
Competitive Intelligence
Segmental Deep-dive
Call-Us : 91 93563 13602

Executive Snapshot and Market Trajectory.

This market is not short of money. It is short of welders. Yards can hire thousands a year and still lose most of them inside twelve months, which means headcount growth has repeatedly failed to become output growth, and every schedule built on hiring assumptions alone has slipped.
Two things decide delivery, and neither appears in a budget line. First-year retention determines whether hiring produces throughput. Below the yards, castings, forgings and large components sit with single qualified suppliers on multi-year leads, and that is where schedules actually break. Nuclear submarines grow fastest at 9.9%, half again the market rate of 6.6%, and they are also the hardest to build.
Five organisations hold 88% of contracted programme value, which is the most concentrated position in any defence market, and consolidation is not the reason. There is simply nowhere else in North America that can build a nuclear submarine or a destroyer. That leaves the customer with no competitive lever at all, which is why it has turned to funding supplier base development and workforce programmes directly rather than expecting competition to fix anything at all.
Market Definition
This report covers naval vessels constructed for North American navies and the systems content delivered into them. Scope includes nuclear attack and ballistic missile submarines, guided missile destroyers and cruisers, frigates and small surface combatants, amphibious warfare vessels, aircraft carriers, and auxiliary or support vessels, together with propulsion, combat systems and major equipment supplied into those programmes. Excluded are vessel sustainment and overhaul work, coast guard cutters procured outside naval programmes, commercial shipbuilding, unmanned surface and underwater vessels, weapons and munitions, and shore infrastructure.
Base Year Value
$46.0B in 2025 (MMA Primary Research Dataset, September 2026)
Forecast Period
2026 to 2036, eleven discrete annual values
CAGR
6.6% base case. Bull 7.8%. Bear 5.4%.
Fastest Growth Segment
Nuclear Attack And Ballistic Missile Submarines: 9.9% CAGR
Fastest Growth Country
Canada: 8.9% CAGR
Fastest Growth Region
South Asia and Pacific: 8.5% CAGR
Largest Region
North America: 81% of 2025 global value
Market Leaders
Huntington Ingalls Industries, General Dynamics, Fincantieri Marinette Marine, Irving Shipbuilding, Austal USA. Source: MMA Analysis based on contracted programme value and delivered vessel content, July 2026.
Primary Survey
n=3,800 procurement and R&D decision-makers, Q4 2025, six countries
Methodology
Demand-side build-up, cross-validated against public data, 47 expert interviews

North America Naval Vessels Market Forecast Scenarios

north-america-naval-vessels-market-size-forecast-scenario-1790026093369
Growth averaged 5.6% across 2020 to 2025 and appropriations ran well ahead of deliveries throughout. Funding rose steadily across submarine, destroyer and frigate programmes while actual output fell short of plan in almost every year, as yards lost skilled workers during the pandemic and struggled to rebuild trades capacity afterwards. The gap between money authorised and hulls delivered widened rather than closed.
Base case growth of 6.6% rests on three mechanisms. Submarine programmes carry the largest and most protected funding lines, with construction rates that policy commitments require regardless of yard performance. Canadian surface combatant construction reaches full rate during the forecast period, adding a substantial second national programme. And supplier base investment, funded directly by the customer rather than the yards, begins converting into component availability that has constrained schedules for years.
The bull case at 7.8% assumes workforce retention improves materially and supplier base funding delivers component availability on the timelines intended, both of which would let appropriated money convert into delivered vessels. The bear case at 5.4% follows from retention staying where it is, in which case funding accumulates against schedules that keep moving right and delivered value grows more slowly than budgets.

Appropriations Ahead of Hulls

Appropriations have run ahead of deliveries for years and the gap is not financial. Yards have money, order books and political support, and they still deliver late because warship trades take years to develop and leave faster than they arrive. First-year attrition among new shipyard hires runs around 41%, so a yard adding two thousand keeps perhaps twelve hundred, none of them yet productive.
FIVE-FIRM CONCENTRATION88%No alternative capability exists for the largest vessel classes
FIRST-YEAR TRADES ATTRITION41%New shipyard hires leaving within their first twelve months
AVERAGE SCHEDULE SLIP16 monthsDelivery delay against contract dates across major surface programmes
SINGLE-SOURCE COMPONENT SHARE37%Major components available from only one qualified domestic supplier
TRADES LABOUR COST SHARE44%Skilled labour portion of delivered vessel construction cost
CASTING LEAD TIME32 monthsTypical wait for large submarine-quality castings and forgings
Below the yards sits a supplier base that thinned across decades when naval construction was cheaper to shrink than sustain. Around 37% of major components now come from a single qualified domestic supplier, and large submarine-quality castings and forgings run on lead times near 32 months. Those suppliers, not the yards, determine when many vessels complete, which is why the customer funds supplier base expansion directly.
Concentration here is absolute rather than merely high. Five organisations hold 88% of contracted programme value and there is no alternative source for a nuclear submarine, an aircraft carrier or a guided missile destroyer anywhere in North America. That removes competition as a tool entirely, so the customer manages cost and schedule through programme design, industrial base investment and workforce funding rather than any threat of going elsewhere.
"Everybody debates the shipbuilding budget. The number that actually determines how many ships get built is how many first-year welders are still there at Christmas."
Director, Naval Systems and Shipbuilding Practice · MMA Defence / Naval Shipbuilding Practice · September 2026

Market Trends

Customers Fund Industrial Base Directly Rather Than Through Contracts

Government has moved from buying vessels and expecting yards to arrange their own capacity toward funding supplier expansion, workforce development and facility investment directly. That reflects an acceptance that a market with five participants and no alternative sources cannot be improved by competitive pressure. The money flows to second and third tier suppliers as well as to prime yards, targeting the castings, forgings and components that actually gate schedules. Direct industrial base investment now runs at several billion dollars annually across regional programmes. Competitive pressure was never going to fix this.
Market Impact: Submarines reach 34% of value
Wage Competition Redraws Yard Cost Structures Permanently

Shipyards compete for welders, pipefitters and electricians against construction, energy and manufacturing employers in the same local labour markets, and shipyard work is physically harder in worse conditions. Yards have responded with substantial wage increases and hiring bonuses that reset cost structures permanently rather than temporarily. Trades labour already represents around 44% of delivered vessel cost, so those increases flow straight into programme pricing. Fixed-price contracts signed before the escalation have produced losses that several participants have disclosed publicly. Losses on that work have been disclosed publicly by more than one participant.
Market Impact: Delivers 15 planned Canadian vessels

Market Opportunities and Growth Drivers

Submarine Programmes Carry Protected And Growing Funding Lines

Attack and ballistic missile submarine construction holds the most protected funding in regional naval procurement, with build rates set by policy commitments rather than by annual budget debate. Additional international undertakings have raised required output above historical rates, which drives investment in both yard capacity and the specialised supplier base that submarine construction depends on. Nothing else in this market enjoys comparable political insulation. Submarine construction now accounts for roughly 34% of regional naval vessel value and rising. Yard capacity and specialised supplier investment both follow directly from that commitment.
Market Impact: Loses 41% of hires annually

Canadian Surface Combatant Construction Reaches Full Production Rate

Canada's surface combatant programme, the largest defence procurement in the country's history, moves into full rate construction during the forecast period after years of design adaptation. It creates a second substantial national programme in the region with its own yard, supply chain and workforce demands, drawing on some of the same component suppliers that constrain United States schedules. Canadian content requirements shape sourcing decisions throughout. Roughly 15 vessels are planned across the programme, delivered over more than a decade. Overlapping component suppliers mean one constraint is felt on both sides of the border.
Market Impact: Sets 32 month component leads

Market Restraints and Challenges

First-Year Trades Attrition Breaks Every Hiring-Based Schedule

Around 41% of new shipyard hires leave within twelve months, so headcount growth translates into output growth far more slowly than any plan assumes. The root cause is that shipyard work is physically demanding in poor conditions against employers offering easier jobs at comparable pay in the same towns. Commercially this means schedules built on recruitment targets slip regardless of how many people are hired. Participants are responding with structured apprenticeships, retention bonuses at twelve and twenty-four months, and facility improvements aimed squarely at the conditions driving departures. Recruitment targets are not output forecasts.
Market Impact: Directs billions into 37% single-source base

Single-Source Components Determine When Vessels Can Complete

Roughly 37% of major components come from one qualified domestic supplier, and large submarine-quality castings and forgings carry lead times around 32 months. The root cause is decades of supplier base contraction during periods when naval construction volumes did not sustain multiple qualified sources. The commercial effect is that a yard's schedule belongs to its suppliers rather than to its own production planning. Mitigation is running through direct customer funding of supplier expansion, qualification of second sources, and additive manufacturing for selected components where certification permits. The yard's own production planning is not the limiting factor.
Market Impact: Labour reaches 44% of vessel cost
3 additional market trends, 4 additional growth drivers, and 2 additional restraints and challenges are covered in the full report. Contact sales@marketmindsadvisory.com to access the complete intelligence.

Segment CAGR and Growth Architecture

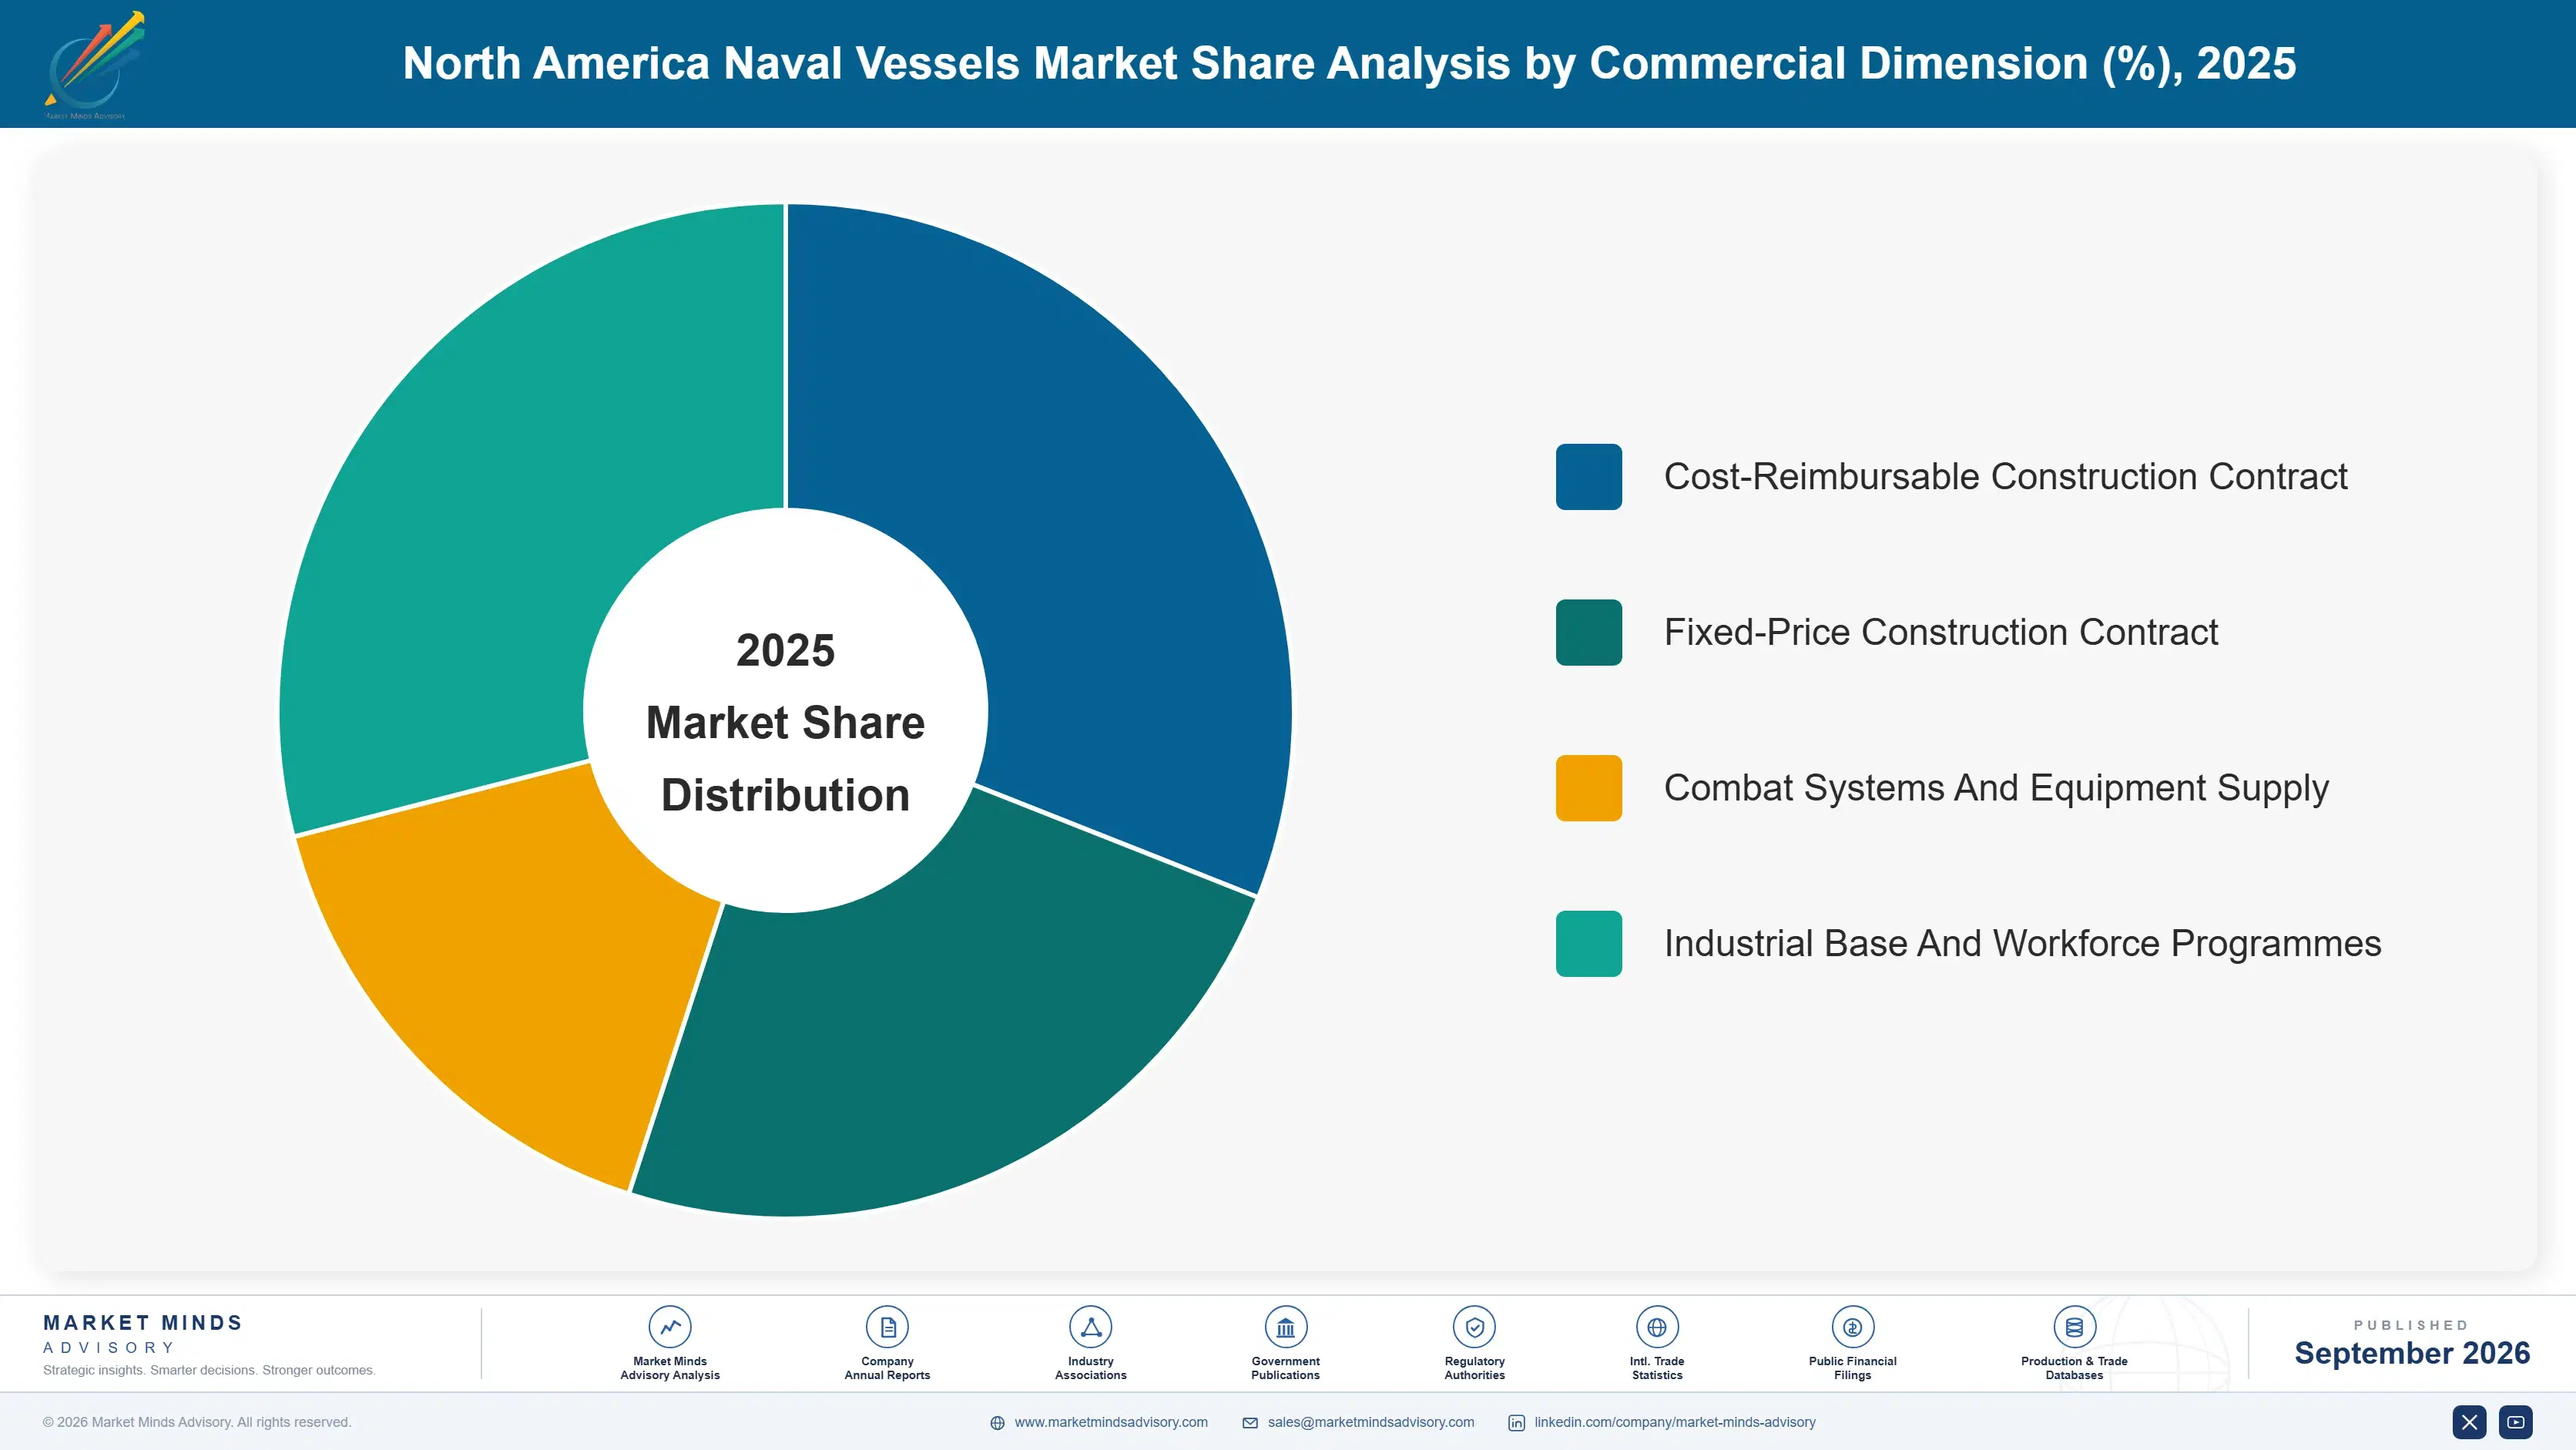
Vessels are segmented here by class, because class determines which yards can build it, which suppliers gate it and how the programme is funded. Mixing vessel class with mission role or propulsion type produces categories that no programme office would recognise. Six classes cover the field from auxiliary vessels through to nuclear submarines, and industrial constraints differ sharply between them.
north-america-naval-vessels-market-market-share-analysis-1790026093942

Nuclear Attack And Ballistic Missile Submarines

Growing at 9.9%, half again the market rate of 6.6%, submarine construction combines the most protected funding in regional naval procurement with the most constrained industrial base serving it. Build rates are set by policy commitment rather than annual appropriation debate, and international undertakings have raised required output above historical levels. The constraint is entirely industrial: nuclear-qualified welders, submarine-quality castings and a supplier base that cannot expand faster than qualification permits. Roughly 34% of regional naval vessel value now sits here. No other class enjoys comparable funding protection, and no other class has schedules under comparable pressure. Funding protection and schedule pressure sit together here in a way nothing else in the market matches.
CAGR 9.9%

Frigates And Small Surface Combatants

Frigate construction grows at 7.8% across both national programmes in the region, and it has been the hardest lesson in recent naval shipbuilding. Adapting proven foreign designs to national requirements proved far more disruptive than anticipated, with design changes cascading into construction delays that the original business cases never contemplated. The commercial lesson has registered: design maturity at construction start now receives attention it did not previously get. Canadian and United States programmes both fall in this class, and both draw on overlapping component suppliers, which means a constraint affecting one is felt by the other. A component constraint affecting one national programme is immediately felt by the other one too.
CAGR 7.8%
Full segment breakdown across 6 segments available in the complete report.

Regional Architecture and Country Demand Map

This is a region-scoped report, so the regional table records where the vessels and their major content serving North American navies are built rather than where demand sits. Domestic construction is close to total, because naval vessels are built domestically by law and by policy rather than by commercial preference.

North America

Domestic construction accounts for 81% of delivered content, far above the 22 to 32% band used for this region elsewhere in this report, and statute rather than competitiveness is the reason. United States naval vessels are built in domestic yards by law, and Canadian programmes carry their own national content requirements that produce a similar outcome. Combat systems, propulsion and the overwhelming majority of major equipment are also domestically sourced. Growth of 6.7% tracks the regional market rate closely, reflecting programme funding growth rather than any change in where construction happens or could happen. Statute rather than competitiveness decides where any of this construction is permitted to happen at all today.
Share: 81% | CAGR: 6.7% (2026 to 2036)

Western Europe

European supply holds 12%, below the 18 to 26% band applied elsewhere, and its composition is interesting rather than large. European ship designs underpin significant regional frigate programmes in both countries, licensed and adapted for domestic construction, and European propulsion, gearing and specialist marine equipment reaches regional vessels where no qualified domestic alternative exists. Design licensing is the most commercially significant part of this. Growth of 5.2% trails the regional market rate, partly because design adaptation difficulties have made programme offices more cautious about foreign baselines than they were a decade ago. Design licensing is the most commercially significant element of the European position by some distance, and it is what programme offices now weigh most carefully.
Share: 12% | CAGR: 5.2% (2026 to 2036)
Regional intelligence for 5 additional markets available in the complete report: East Asia, South Asia and Pacific, Eastern Europe, Middle East and Africa, Latin America. Contact sales@marketmindsadvisory.com.
north-america-naval-vessels-market-country-cagr-analysis-1790026094472

Where Naval Programmes Recover Margin

Contract value is the visible number in this market and a poor guide to what a yard actually earns. Retention, design maturity at construction start and supplier qualification decide programme margin instead. The four levers below reflect positions participants have used to improve outcomes measurably rather than to win awards. Labour underpins all of them.

Attack First-Year Attrition Before Expanding Hiring

Around 41% of new shipyard hires leave within twelve months, which means a yard hiring aggressively into poor retention burns recruitment and training cost to stand still. Yards that improved facilities, structured apprenticeships and placed retention incentives at twelve and twenty-four months have raised productive headcount roughly 2.2 times faster than those simply hiring harder. The investment is unglamorous and slow, and it competes for capital against production facilities that show a visible return considerably sooner than any of this does. Production facilities show a visible return much sooner, which is why retention spending loses the argument.
Market Impact: Productive headcount grows roughly 2.2 times faster overall

Refuse Construction Start Without Design Maturity

Starting construction against an immature design cascades changes through build sequences, and regional frigate programmes have demonstrated the cost of that at considerable expense. Yards insisting on defined design completion thresholds before construction start report schedule performance roughly 19 months better than those beginning early under customer pressure. Holding that line means declining to start when a programme office wants visible progress, which is commercially difficult and has cost yards goodwill before it saved them money. Programme offices want visible progress, and refusing them costs goodwill before it saves money.
Market Impact: Schedule performance improves by roughly 19 months overall

Qualify Second Sources On Gating Components

Roughly 37% of major components come from a single qualified supplier and large castings run to 32 month lead times, which hands schedule control to parties outside the yard entirely. Yards and customers jointly funding second source qualification on the most constraining items have cut component-driven delay substantially. Qualification takes years and costs money that produces nothing until a supply interruption occurs, which is exactly why it has been deferred for decades and is only now being funded properly. Schedule control belongs to parties outside the yard entirely until this is done.
Market Impact: Cuts component-driven delay against 32 month lead times

Price Fixed-Price Work Against Real Wage Escalation

Trades labour is around 44% of delivered vessel cost and wage escalation has reset cost structures permanently rather than cyclically. Yards that repriced fixed-price work against observed local labour market movement rather than against general inflation indices avoided the losses several competitors have disclosed publicly. The commercial difficulty is that customers resist escalation assumptions above published indices, and winning that argument requires labour market evidence yards have not traditionally assembled or presented. Labour market evidence of the kind required has never really been part of any shipbuilding bid submission before now.
Market Impact: Avoids disclosed losses across a 44% cost base

Who Controls the Margin Pool

Concentration is 88% for the top five, measured on contracted programme value and delivered vessel content, the basis used throughout this section. This is not consolidation producing concentration; it is the absence of any alternative. No other organisation in North America can build a nuclear submarine, an aircraft carrier or a guided missile destroyer, and the capability to do so cannot be established within any relevant commercial timeframe.
Competition, in the ordinary sense, barely operates. What determines outcomes is execution against schedule, workforce retention and supplier qualification, none of which a competitor can influence. Yards compete far more for welders and pipefitters in overlapping local labour markets than they do for contracts, and in several cases the same supplier constrains two competing yards simultaneously on different programmes.

Positions will shift on delivery performance rather than on capture. A yard that solves retention and holds schedule earns follow-on work and better contract terms, while one that slips absorbs cost and political attention in equal measure. Customer-funded industrial base investment adds a second dynamic, because the yards and suppliers that use that money effectively will emerge with capacity advantages their competitors funded taxpayers to provide as well.
north-america-naval-vessels-market-company-positioning-matrix-1790026095001

Competitive Moat and Risk Dimensions

HUNTINGTON INGALLS INDUSTRIES

Moat: Sole Source Carrier Capability

The company is the only builder of nuclear aircraft carriers in the region and one of only two able to construct nuclear submarines, capabilities embodied in facilities, nuclear qualification and a workforce that took generations to assemble. No competitor can establish equivalent capability within any commercially relevant timeframe, which makes these positions effectively permanent rather than merely defensible.
HUNTINGTON INGALLS INDUSTRIES

Risk: Workforce Retention Exposure

Delivery performance depends on trades retention in regional labour markets where the company competes against easier employers offering comparable pay, and first-year attrition near 41% undermines every schedule built on recruitment. That exposure sits largely outside management control, since it turns on local wage competition and the physical nature of the work rather than anything a yard can quickly change.
GENERAL DYNAMICS

Moat: Submarine Programme Lead Position

General Dynamics holds the lead position on the region's most protected and fastest-growing programmes, with submarine construction funding insulated from ordinary budget debate by policy commitment. That lead role gives the company influence over design, supplier qualification and build sequencing across a programme that will run for decades, which no partner or competitor can replicate.
GENERAL DYNAMICS

Risk: Supplier Base Dependency Risk

Submarine construction depends on a specialised supplier base with single qualified sources and lead times near 32 months on large castings and forgings. The company's schedule therefore belongs substantially to firms it does not own, and the customer-funded expansion intended to relieve that will take years to qualify and produce at the rates the programme actually requires.

Players Tracked

Prominent Players

Huntington Ingalls Industries
General Dynamics
Fincantieri Marinette Marine
Irving Shipbuilding
Austal USA

Other Key Players

BAE Systems
Bollinger Shipyards
Seaspan Shipyards
Davie Shipbuilding
Vigor Marine
Lockheed Martin
RTX
L3Harris Technologies
Leonardo DRS
Curtiss-Wright
BWX Technologies
Fairbanks Morse Defense
Rolls-Royce
Wartsila
MAN Energy Solutions

Recent Developments

FEBRUARY 2025

Government expands direct funding for submarine supplier base expansion

Government increased direct funding for supplier base expansion covering castings, forgings and specialised components for submarine construction. This was an appropriation and industrial policy decision rather than any corporate transaction, and it targets the component constraints gating construction schedules rather than the prime yards themselves at all.
Signal: Funding suppliers directly concedes that competition cannot fix a market with no alternative sources available anywhere
AUGUST 2024

Shipyard raises trades wages substantially amid regional labour competition

A major shipyard announced substantial wage increases across skilled trades to compete with construction and manufacturing employers in its local labour market. This was an operational decision rather than a corporate event, and it reset a cost structure that fixed-price contracts signed earlier did not anticipate.
Signal: Permanent wage resets flow into programme pricing and expose fixed-price work signed before the escalation began
NOVEMBER 2024

Frigate programme restructured following design maturity difficulties

A regional frigate programme was restructured after design changes from the parent baseline cascaded into construction delays. This was a programme decision rather than a corporate transaction, and it has made design maturity at construction start a closely scrutinised issue across every subsequent naval programme in the region.
Signal: Design maturity thresholds now receive attention that would have been dismissed as caution five years ago

What Sets Delivered Vessel Cost

Four inputs dominate. Skilled trades labour runs roughly 44% of delivered vessel cost, combat systems and propulsion content about 26%, steel plate with specialty alloys close to 11%, and castings, forgings and major equipment the remaining 19%. Labour is sourced in a handful of regional labour markets, steel and alloys domestically under sourcing requirements, and castings from a supplier base that contracted for decades.
Wage escalation was the cost event, and it is permanent rather than cyclical. Yards raised trades pay substantially from 2022 to compete with construction and manufacturing employers, and national labour statistics show shipbuilding wage movement well above general manufacturing. Huntington Ingalls and General Dynamics both addressed labour cost and productivity in annual reporting. Fixed-price contracts signed before the escalation produced disclosed losses at more than one participant.

Exposure divides by contract type rather than by geography. Yards holding fixed-price work signed before the wage reset carry the full increase with no recovery mechanism, while those on cost-reimbursable or recently repriced contracts pass it through. That asymmetry has nothing to do with efficiency and everything to do with when a contract was signed, which makes margin differences between otherwise comparable yards misleading to read as performance.
north-america-naval-vessels-market-cost-volatility-analysis-1790026095200

Reprice fixed-price work against local labour market evidence

General inflation indices badly understate shipbuilding wage movement in the specific regional labour markets that matter, and pricing against them guarantees erosion. Yards presenting local wage evidence have secured escalation terms above published indices where competitors accepted them. The difficulty is assembling labour market data yards have never collected, then persuading customers the general index is the wrong instrument.

Invest in facilities that reduce the conditions driving attrition

First-year attrition near 41% is driven substantially by working conditions rather than pay alone, and climate control, lighting, access and tooling improvements have measurable retention effects. The investment competes for capital against production capacity that shows a visible return faster. Yards treating retention spending as production investment rather than overhead convert hiring into output far more reliably.

Fund second source qualification jointly with the customer

Single-source components with 32 month lead times hand schedule control to suppliers, and qualification of alternatives costs money that returns nothing until a disruption occurs. Joint funding with the customer changes that arithmetic, since the customer bears the schedule consequence and now recognises it. Qualification timelines remain measured in years, so the benefit arrives long after the spending.

Portfolio Architecture for Margin Defence

Margin architecture here is decided by contract structure far more than by vessel type. Fixed-price construction signed before wage escalation sits at the bottom and in several cases below zero, with no recovery mechanism available. Cost-reimbursable and recently repriced construction sits in the middle at reasonable but regulated returns. Combat systems content, design licensing and industrial base programmes sit at the top, insulated from trades labour exposure entirely.
The volume-versus-premium tension is unusual because volume is not won competitively. The largest programmes are sole-sourced, so the question is not whether a yard gets the work but whether it earns anything building it. Premium in this market means content that does not consume trades hours: combat systems, electronics, design and licensing. Those lines carry better margins precisely because they sit outside the labour constraint that governs everything on the waterfront.

High-value pools concentrate in three places: combat systems and electronics content that carries no shipyard labour exposure, design and licensing revenue on baselines adapted for regional construction, and customer-funded industrial base work that pays for capacity the recipient keeps afterwards. None of the three depends on a yard's ability to hire and retain welders.

Volume / Commodity-Adjacent Tier

Fixed-price vessel construction signed before wage escalation, carrying full trades labour exposure with no recovery mechanism. The nine point range reflects contract vintage and how far into a build a yard sits, with some programmes running at or below break-even.
Gross Margin: 2-11%

Premium / Certified Tier

Cost-reimbursable and recently repriced vessel construction where labour escalation passes through. Regulated returns with performance incentives rather than commercial pricing latitude. The seven point range tracks incentive fee achievement, which turns almost entirely on schedule performance.
Gross Margin: 9-16%

Sustainability / Regulatory / Next-Generation Tier

Combat systems and electronics content, design licensing, and customer-funded industrial base programmes. Insulated from trades labour exposure and priced on capability rather than hours. The fifteen point range spans a systems business and a licensing business with different economics.
Gross Margin: 17-32%
north-america-naval-vessels-market-portfolio-architecture-1790026095700

High-value Sub-segments and Strategic Watch-out

Combat Systems And Electronics Content

Best margins available in regional naval programmes because the content consumes no shipyard trades hours and prices on capability rather than labour. Delivery risk sits with the yard rather than the supplier. The fourteen point range reflects how differently integration scope is contracted across programmes.
Gross Margin: 18-32%

Design Licensing And Adaptation

High margin revenue on baselines adapted for regional construction, though recent frigate difficulties have made programme offices considerably more cautious about foreign designs. Volume depends on future programme baseline choices. The ten point range reflects whether adaptation engineering is included in the licence or charged separately.
Gross Margin: 20-30%

Cost-Reimbursable Vessel Construction

The volume core of regional revenue, growing with appropriations and passing labour escalation through to the customer. Incentive fee achievement turns almost entirely on schedule performance. The seven point range reflects how much of the available incentive a yard actually earns against contracted delivery dates.
Gross Margin: 9-16%

Legacy Fixed-Price Construction

Worst position in the market, holding contracts priced before a permanent wage reset with no recovery mechanism available at all. Several participants have disclosed losses on exactly this work. The nine point range reflects contract vintage rather than any difference in yard capability or execution quality.
Gross Margin: 2-11%

What Sustains The Order Book

The annuity in this market is a shipbuilding plan rather than a contract, and it runs for decades. Naval force structure requirements generate construction demand from published plans that survive individual budget cycles, and submarine programmes in particular carry policy commitments that insulate them from annual appropriation debate. That gives yards planning visibility no commercial shipbuilder approaches, and it is why capacity and workforce investment can be justified over horizons that would be reckless anywhere else.
Adoption depth varies by programme rather than by customer, since there is effectively one customer per country. Submarine programmes run the deepest relationships, with the customer funding supplier qualification, workforce development and facility investment alongside vessel construction. Surface combatant programmes operate more conventionally, with the yard responsible for its own capacity. Auxiliary and support vessel construction sits furthest out, occasionally competed among smaller yards and treated much more like commercial shipbuilding.

The decision maker has shifted toward the industrial base. Programme offices once bought vessels and left capacity to the contractor. They now fund suppliers, workforce programmes and facilities directly, which makes them an investor in their contractors rather than merely a customer of them.
north-america-naval-vessels-market-end-use-penetration-index-1790026096202

Where Yards Should Concentrate Effort

These are among the four positions where our research anticipates prominent divergence between winners and laggards over the coming forecast period. Each is grounded in the demand model, the regulatory perimeter, and the announced capacity pipeline.
01 / RETENTION BEFORE RECRUITMENT

Fix twelve-month attrition before hiring another thousand people

Around 41% of new shipyard hires leave within twelve months, so a yard recruiting aggressively into poor retention burns training cost simply to stand still while its schedule keeps moving right. Yards improving facilities, apprenticeship structure and placing retention incentives at twelve and twenty-four months raised productive headcount roughly 2.2 times faster than those hiring harder. The spending is unglamorous and slow, and it competes for capital against production facilities that show a visible return considerably sooner than any of this does.
02 / DESIGN MATURITY DISCIPLINE

Decline construction start until the design is genuinely complete

Starting construction against an immature design cascades changes through build sequences, and regional frigate programmes have demonstrated exactly what that costs at considerable public expense. Yards insisting on defined design completion thresholds before construction start report schedule performance roughly 19 months better than those beginning early under programme office pressure. Holding the line means refusing to start when a customer wants visible progress, which is commercially uncomfortable and has cost yards real goodwill before it ever saved them any money.
03 / SUPPLIER QUALIFICATION INVESTMENT

Fund second sources jointly, because schedules belong to suppliers

Roughly 37% of major components come from a single qualified domestic supplier and large castings carry lead times near 32 months, which means a yard's delivery date belongs substantially to firms it does not own or control. Joint customer-funded qualification of second sources changes the arithmetic, since the customer bears the schedule consequence and has now finally recognised it properly. Qualification takes years and produces nothing until a disruption occurs, which is precisely why it went entirely unfunded for several decades.
04 / ESCALATION EVIDENCE BUILDING

Price labour against local markets, not published inflation indices

Trades labour is around 44% of delivered vessel cost and wage escalation has reset cost structures permanently rather than cyclically across essentially every regional shipbuilding labour market. Yards that repriced their fixed-price work against observed local wage movement avoided losses that several competitors have since disclosed publicly. The obstacle here is that customers resist escalation assumptions above published indices, and winning that argument requires local labour market evidence that yards have never traditionally assembled, let alone presented to a customer.

Engagement Snapshot From the Field

A live engagement with an industry participant carrying material or product regulatory and market exposure ahead of a defining policy shift, showing how our research translates into a defensible multi-year portfolio strategy.
MARKET MINDS ADVISORY · CLIENT ENGAGEMENT SUMMARY
North America Naval Vessels Producer Strategic Portfolio Review and Transition Roadmap 2026·Investment Scenario on North America Naval Vessels Exposure Evaluation 2025-26
CLIENT PROFILE
A North American shipyard group with roughly USD 3.1 billion in annual revenue (client-reported, unverified by MMA), holding construction work across surface combatant and auxiliary vessel programmes. The group had grown headcount by more than four thousand across two years and had seen no corresponding improvement in delivery performance, with schedules continuing to slip on both major programmes.
STRATEGIC CHALLENGE
Management treated the problem as a recruitment shortfall and had approved further hiring alongside additional recruiter headcount. The workforce data pointed elsewhere entirely: attrition among first-year hires was consuming almost all recruitment gains, and the largest departure cluster sat in the first four months. The board needed to understand whether more hiring would ever produce more output.
MMA APPROACH
MMA analysed hiring, attrition and productivity data by trade, tenure and facility across three years, separating recruitment shortfall from retention loss, then modelled output under three options: continued hiring expansion, retention investment, and facility improvement targeting departure causes. Expert interviews with trades supervisors and departed employees established what actually drove the leaving decisions.
KEY FINDINGS
  1. First-year attrition consumed roughly 78% of recruitment gains across the period, meaning the group had added four thousand people to achieve a net productive gain of a few hundred.
  2. Departures clustered heavily in the first four months and cited working conditions, shift patterns and supervision quality well ahead of pay in every interview conducted.
  3. Facility improvements targeting the specific conditions cited modelled a retention gain worth more productive headcount than the entire planned recruitment expansion would deliver.
  4. Schedule slip correlated far more closely with experienced trades availability than with total headcount, a distinction the group's own reporting had never separated at all.
CLIENT PROFILE
A North American shipyard group with roughly USD 3.1 billion in annual revenue (client-reported, unverified by MMA), holding construction work across surface combatant and auxiliary vessel programmes. The group had grown headcount by more than four thousand across two years and had seen no corresponding improvement in delivery performance, with schedules continuing to slip on both major programmes.
STRATEGIC CHALLENGE
Management treated the problem as a recruitment shortfall and had approved further hiring alongside additional recruiter headcount. The workforce data pointed elsewhere entirely: attrition among first-year hires was consuming almost all recruitment gains, and the largest departure cluster sat in the first four months. The board needed to understand whether more hiring would ever produce more output.
MMA APPROACH
MMA analysed hiring, attrition and productivity data by trade, tenure and facility across three years, separating recruitment shortfall from retention loss, then modelled output under three options: continued hiring expansion, retention investment, and facility improvement targeting departure causes. Expert interviews with trades supervisors and departed employees established what actually drove the leaving decisions.
KEY FINDINGS
  1. First-year attrition consumed roughly 78% of recruitment gains across the period, meaning the group had added four thousand people to achieve a net productive gain of a few hundred.
  2. Departures clustered heavily in the first four months and cited working conditions, shift patterns and supervision quality well ahead of pay in every interview conducted.
  3. Facility improvements targeting the specific conditions cited modelled a retention gain worth more productive headcount than the entire planned recruitment expansion would deliver.
  4. Schedule slip correlated far more closely with experienced trades availability than with total headcount, a distinction the group's own reporting had never separated at all.
RECOMMENDED STRATEGY
Phase 1: Phase 1 (five months): Halt the recruitment expansion and redirect that budget toward first-four-month supervision, onboarding and shift pattern changes instead. Phase 2: Phase 2 (14 months): Fund facility improvements targeting the specific working conditions departing employees cited, prioritised by trade and by location. Phase 3: Phase 3 (24 months): Rebuild schedule forecasting around experienced trades availability rather than around total headcount growth assumptions alone in future.
OUTCOME
First-year attrition fell materially within eleven months and productive headcount rose faster than during the hiring expansion despite lower recruitment (client-reported, unverified by MMA). Schedule slip stopped growing on both programmes, and the group's revised forecasting model built on experienced trades availability proved considerably more accurate than its predecessor.

Frequently Asked Questions

Foundational context covering the market sizes, CAGR, scope, country, region and competition that inform every finding below. This section is provided to cover basics and most often pre-purchase conversations, answered from the MMA Primary Research Dataset.

What is the current size of the North America Naval Vessels Market?

The market was worth USD 46.0 billion in 2025 and reaches USD 49.0 billion in 2026. That covers submarines, surface combatants, amphibious vessels, carriers and auxiliaries with their delivered systems content.

How large will the North America Naval Vessels Market be by 2036?

MMA forecasts USD 92.8 billion by 2036, an increase of USD 43.8 billion over the 2026 base. That represents an expansion multiple of 1.89 times across the forecast period.

What is the CAGR for the North America Naval Vessels Market 2026 to 2036?

The base case CAGR is 6.6%, with a bull case of 7.8% if retention improves and supplier base funding delivers component availability. The bear case of 5.4% assumes retention stays where it is.

Which segment is growing fastest?

Nuclear attack and ballistic missile submarines grow at 9.9%, half again the market rate of 6.6%. Build rates are set by policy commitment rather than annual appropriation debate.

Who are the major companies in the North America Naval Vessels Market?

Huntington Ingalls Industries, General Dynamics, Fincantieri Marinette Marine, Irving Shipbuilding and Austal USA lead on contracted programme value and delivered vessel content. BAE Systems and Bollinger Shipyards follow.

Which country is growing fastest?

Within this region-scoped report, Canada leads at 8.9% as its surface combatant programme reaches full production rate. Countries outside North America are assessed only as sources of content supply.

Report Segmentation Architecture

The full report scope spans multiple orthogonal segmentation dimensions, with cross-tabulated demand data provided for each dimension pair. Coverage extends further to regional breakdowns, trend trajectories, and the competitive detail needed to support segment-level decision-making.

By Vessel Class

  • Nuclear Attack And Ballistic Missile Submarines
  • Guided Missile Destroyers And Cruisers
  • Frigates And Small Surface Combatants
  • Amphibious Warfare Vessels
  • Aircraft Carriers
  • Auxiliary And Support Vessels

By End-Use Industry

  • United States Navy Programmes
  • Royal Canadian Navy Programmes
  • Military Sealift And Logistics Commands
  • Allied Cooperative Programmes
  • Government Research And Survey Fleets

By Commercial Dimension

  • Cost-Reimbursable Construction Contract
  • Fixed-Price Construction Contract
  • Combat Systems And Equipment Supply
  • Industrial Base And Workforce Programmes

By Region

  • North America
  • Western Europe
  • East Asia
  • South Asia and Pacific
  • Eastern Europe
  • Middle East and Africa
  • Latin America

Scope, Methodology, and Coverage

Every figure in this report is reproducible from documented input assumptions. The scope below maps the historical period, the forecast horizon, the segmentation dimensions, and the countries covered, alongside the underlying primary and qualitative methodology.
Historical Period
2020 to 2025
Forecast Period
2026 to 2036
Base Year
2025 (USD billions; MMA Primary Research Dataset, September 2026)
Market Definition
This report covers naval vessels constructed for North American navies and the systems content delivered into them. Scope includes nuclear attack and ballistic missile submarines, guided missile destroyers and cruisers, frigates and small surface combatants, amphibious warfare vessels, aircraft carriers, and auxiliary or support vessels, together with propulsion, combat systems and major equipment supplied into those programmes. Excluded are vessel sustainment and overhaul work, coast guard cutters procured outside naval programmes, commercial shipbuilding, unmanned surface and underwater vessels, weapons and munitions, and shore infrastructure.
Quantitative Units
USD billions (current prices); vessel deliveries and programme counts; contracted programme value; schedule performance against contract dates
Segmentation Dimensions
By Vessel Class; By End-Use Industry; By Commercial Dimension; By Region
Regions Covered
North America, Western Europe, East Asia, South Asia and Pacific, Eastern Europe, Middle East and Africa, Latin America
Countries Covered
USA, Canada, Mexico, with vessel content and design supply origin also assessed across the UK, Italy, Germany, France, Spain, Netherlands, Norway, Finland, Japan, South Korea, India, Australia, Israel, Poland and Brazil
Key Companies Profiled
Huntington Ingalls Industries, General Dynamics, Fincantieri Marinette Marine, Irving Shipbuilding, Austal USA, BAE Systems, Bollinger Shipyards, Seaspan Shipyards, Davie Shipbuilding, Vigor Marine, Lockheed Martin, RTX, L3Harris Technologies, Leonardo DRS, Curtiss-Wright, BWX Technologies, Fairbanks Morse Defense, Rolls-Royce, Wartsila, MAN Energy Solutions
Quantitative Methodology
Primary survey, n=3,800 respondents, Q4 2025, six countries; demand-side model with trade association cross-validation
Qualitative Methodology
47 expert interviews, Q4 2025; applied to validate demand model assumptions, identify emerging dynamics, and assess competitive positioning
Report Format
PDF and XLSX data workbook (Word format preview document)
Publisher
Market Minds Advisory
Report Code
MMA-2026-CON-916
Published
September 2026
Contact
sales@marketmindsadvisory.com | www.marketmindsadvisory.com

Purchase the full North America Naval Vessels Market Report (2026 to 2036).

The full report sizes the North American naval vessel market across six vessel classes with programme values and delivery schedules behind every figure, and assesses where vessel content and designs originate. It models workforce retention and supplier component lead times as the binding constraints on delivery, because appropriations have run ahead of hulls for years and budget analysis alone explains none of it. Competitive analysis covers 20 participants on contracted programme value and delivered content, including schedule performance by programme. Contract vintage is assessed as the principal determinant of yard margin, since fixed-price work signed before wage escalation behaves entirely differently. Industrial base funding flows are tracked to supplier tier.
Six-class sizing with programme values and schedules
Workforce retention modelled as delivery constraint
Single-source component exposure by vessel class
Contract vintage assessed against yard margin outcomes
Industrial base funding tracked to supplier tier
Schedule performance compared across twenty participants

Built For The People Who Decide

From boardroom strategy to bench-side execution, this report is read cover-to-cover by leaders shaping the next decade of their industry, turning demand scenarios, market dynamics and valuation benchmarks into decisions.
CXOs/ Presidents/ VPs/ Managers
M&A and Corporate Development
Strategy Teams and R&D Heads
Procurement and Product Directors
Regulatory and Compliance Leaders
Investor Relations and Equity Analysts