Market Minds Advisory
North America Mutual Fund Market

North America Mutual Fund Market: Rising Assets, Falling Revenue Per Dollar

Equity fund charges have fallen from about 0.99% to 0.42% in two decades while assets climbed. The product winning every flow costs 0.05% and earns a twentieth as much for anybody.

Lead Analyst

Published

September 2026

Make Smarter Decisions with Customized Research Insights

Request a free sample report and evaluate market opportunities, growth trends, and competitive dynamics relevant to your business needs.

2025 MARKET VALUE$104.0BMarket Size 2025
2036 FORECAST VALUE$167.0BBase Case , 2026 to 2036
CAGR 2026 TO 20364.4 %Bull 5.6% / Bear 3.2%
INCREMENTAL OPPORTUNITY$58.4BNet 10- year value creation
EXPANSION MULTIPLE1.54x2036 value over 2026 base
Strategic Levers
M&A Pipeline
Regional Outlook
Country Rankings
Competitive Intelligence
Segmental Deep-dive
Call-Us : 91 93563 13602

Executive Snapshot and Market Trajectory

Two lines have moved in opposite directions for twenty years. Assets under management kept climbing while the asset-weighted charge on equity funds fell from roughly 0.99% to about 0.42%, and revenue per dollar managed halved. An industry can expand and shrink at the same time.
Domestic activity carries 84% of value, far above the usual regional band, because this is a region-scoped market whose managers earn overwhelmingly at home. Index and passive equity funds grow at 6.6%, half again the market rate of 4.4%, and they take almost every dollar of net inflow while charging around 0.05% to do it. Winning that category demands the kind of scale only a handful of managers anywhere actually possess at all.
Concentration reaches 56% and the stated expense ratio is not what anybody keeps. Around 61% of a headline charge reaches the manager after platform payments and revenue sharing, because roughly 47% of assets sit inside workplace savings arrangements where somebody else controls the shelf. A manager sets a price and then somebody else entirely decides whether any investor is even allowed to go and buy it at all anywhere.
Market Definition
The market covers management and distribution fee revenue earned by mutual fund providers across the United States and Canada, spanning index and passive equity funds, money market funds, target date and allocation funds, fixed income funds, active equity funds, and specialty and alternative strategy funds. Exchange traded fund revenue reported separately, separately managed accounts, collective investment trusts, private fund management fees, brokerage commissions, and custody and administration revenue earned by service providers are excluded.
Base Year Value
$104.0B in 2025 (MMA Primary Research Dataset, August 2026)
Forecast Period
2026 to 2036, eleven discrete annual values
CAGR
4.4% base case. Bull 5.6%. Bear 3.2%.
Fastest Growth Segment
Index and Passive Equity Funds: 6.6% CAGR
Fastest Growth Country
Australia: 6.4% CAGR
Fastest Growth Region
South Asia and Pacific: 6.6% CAGR
Largest Region
North America: 84% of 2025 global value
Market Leaders
Vanguard, BlackRock, Fidelity Investments, Capital Group, T. Rowe Price. Source: MMA Analysis based on disclosed mutual fund management and distribution fee revenue in North America, company annual reports 2025.
Primary Survey
n=3,800 procurement and R&D decision-makers, Q4 2025, six countries
Methodology
Demand-side build-up, cross-validated against public data, 47 expert interviews

North America Mutual Fund Market Forecast Scenarios

north-america-mutual-fund-industry-size-forecast-scenario-1787916041187
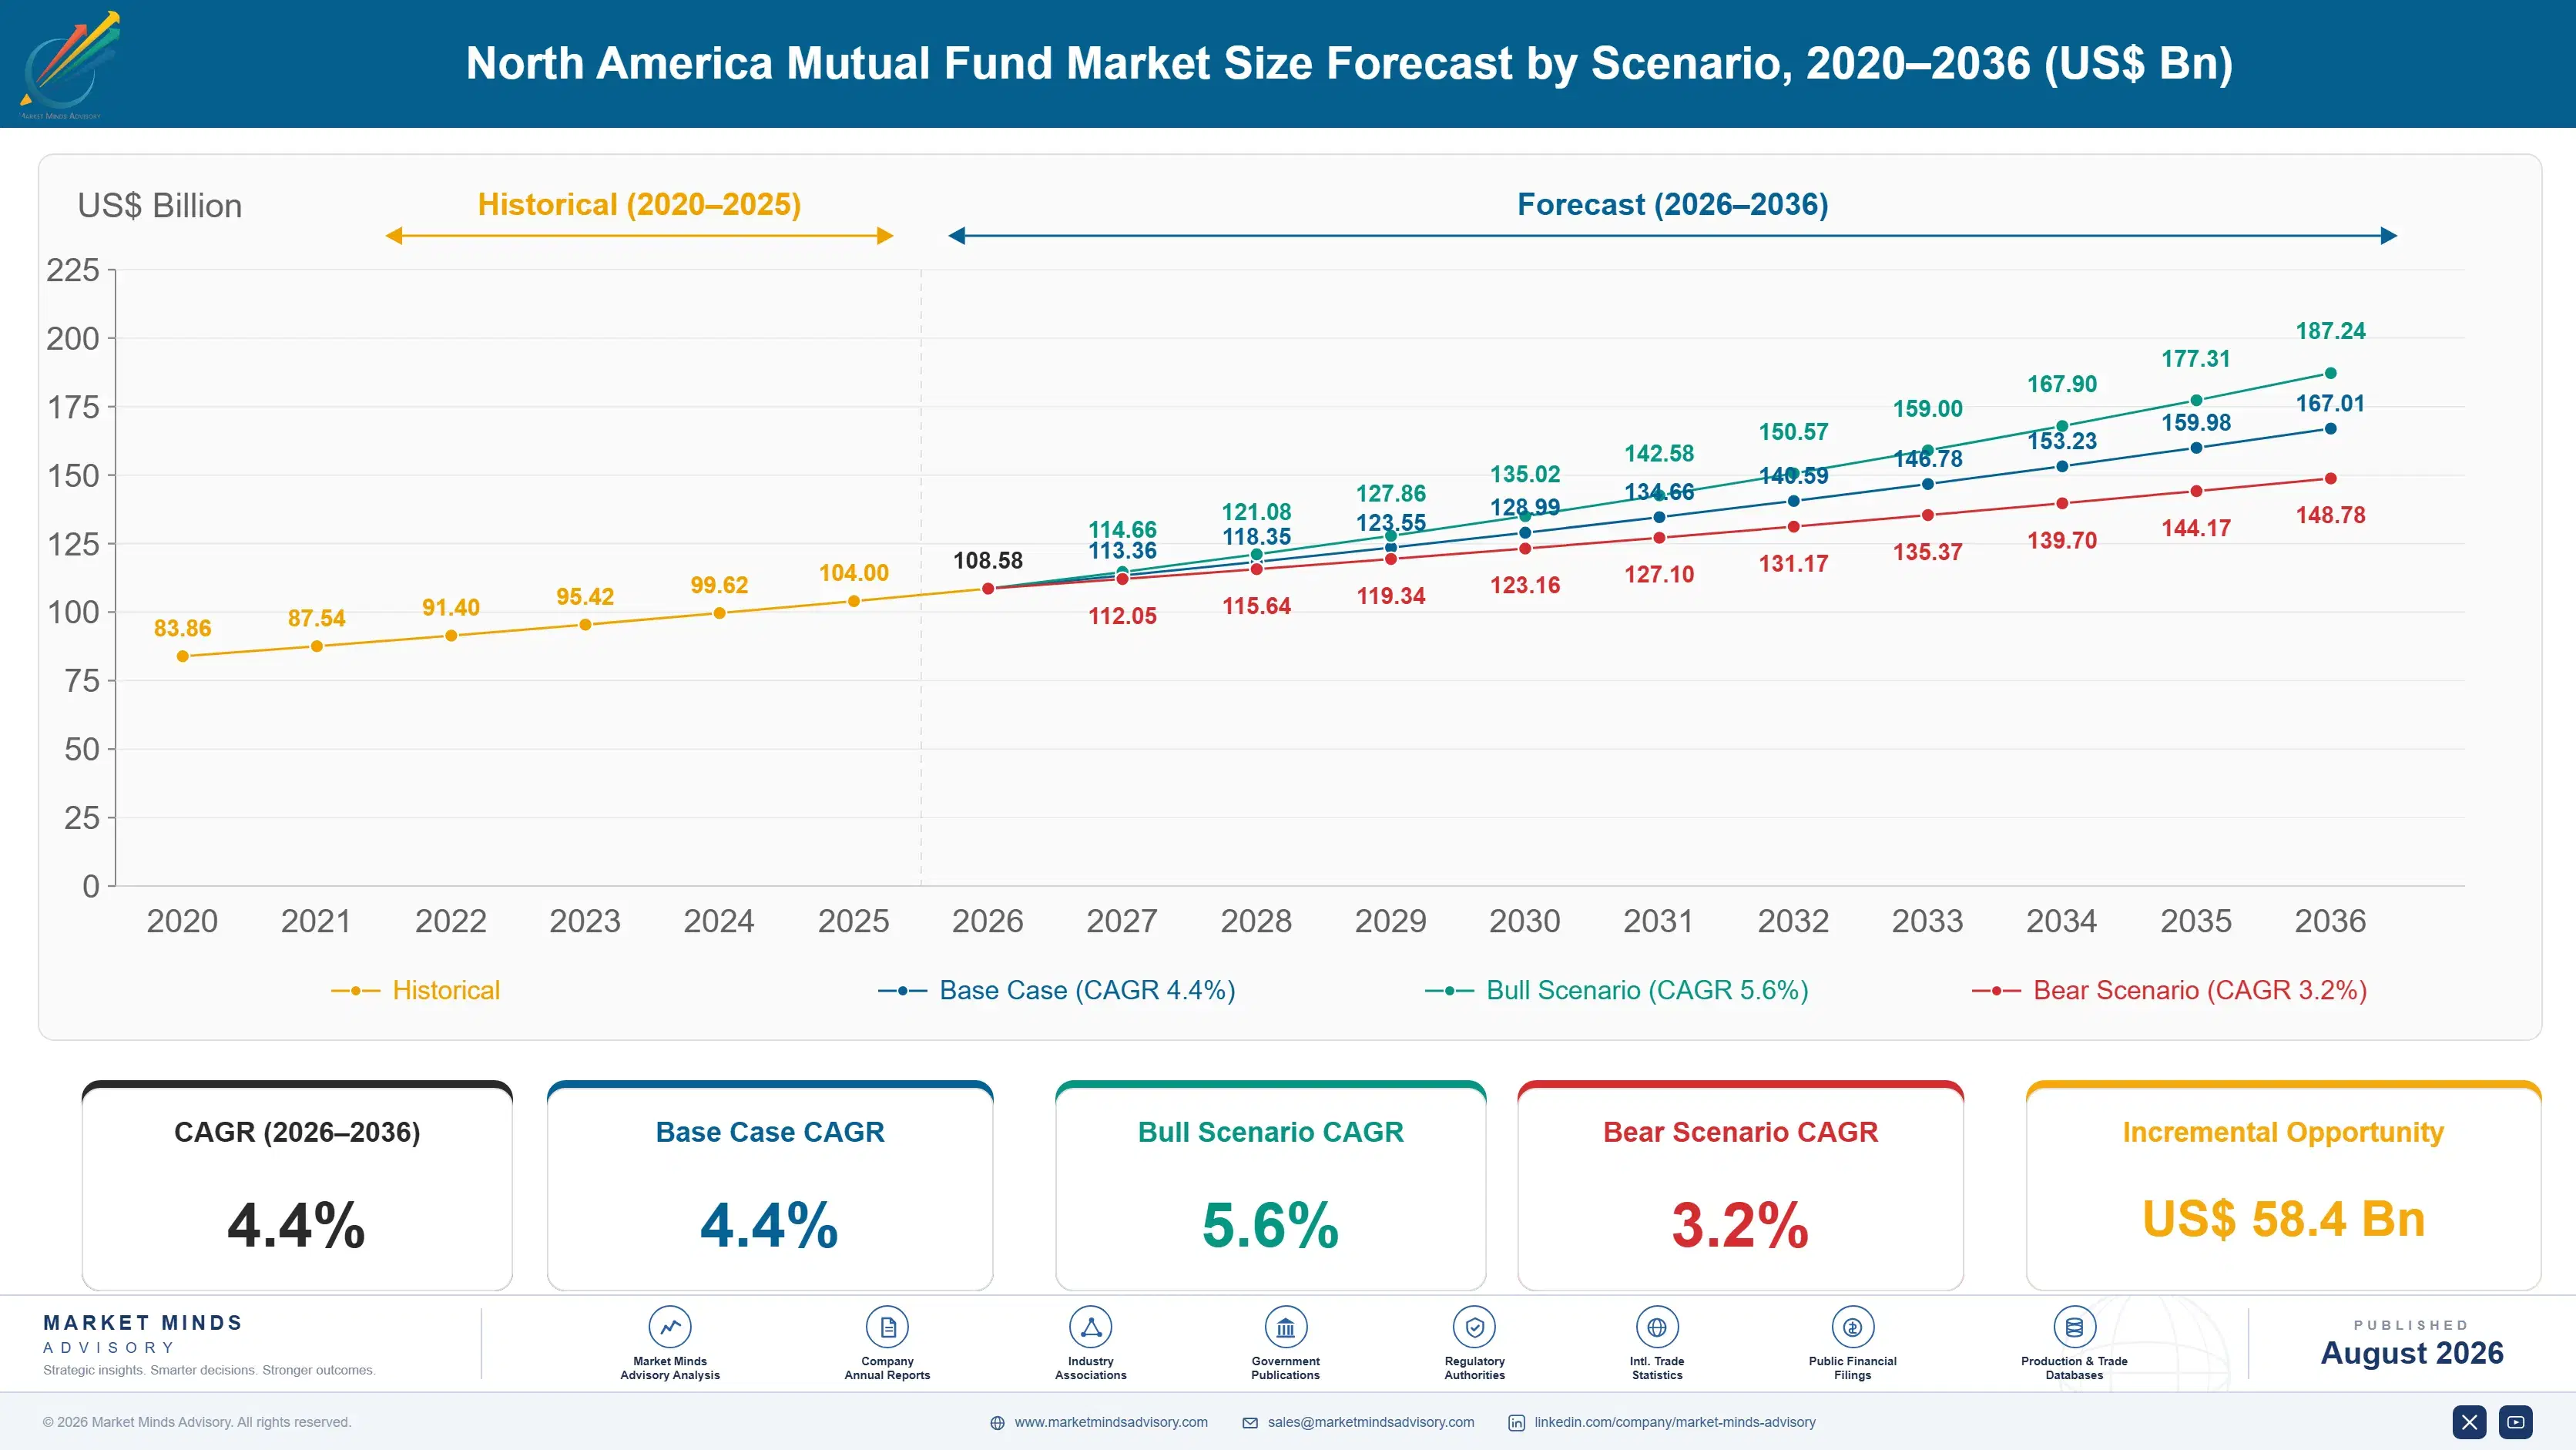
Growth from 2020 to 2025 ran at 3.2% and it was almost entirely markets rather than anything anybody did. Equity valuations lifted asset balances while fee rates kept falling and active equity funds recorded outflows in every single year. Then rates rose and money market funds passed six trillion dollars, because for the first time in over a decade cash actually paid something worth having.
The 4.4% base case rests on three mechanisms. Passive equity assets keep compounding on flows nobody has managed to reverse. Money market balances stay elevated while short rates remain meaningful. And target date funds keep growing automatically through workplace savings contributions that arrive every payroll cycle regardless of what anybody thinks about markets that month. None of the three requires anybody to reverse a flow direction that has held firm for over a decade.
The bull case at 5.6% assumes markets cooperate and money market balances hold as rates settle at levels that still reward cash. The bear case at 3.2% is fee compression accelerating as exchange traded share classes of existing funds reach approval and scale, which would let investors hold the identical portfolio at a materially lower charge inside the same product.

The Fee Line Only Goes Down

Every chart in this industry points the same way. Asset-weighted equity fund charges have fallen from roughly 0.99% at the turn of the century to about 0.42% now, and index products average around 0.05%. Assets grew across the same period, which is why headline figures look healthy. Revenue per dollar managed did not grow at all. This industry has spent twenty years expanding and shrinking simultaneously.
FIVE-FIRM CONCENTRATION56%Share of category revenue held by the largest fund managers
ASSET-WEIGHTED EXPENSE RATIO0.42%Average annual charge across equity assets under management
PASSIVE FUND AVERAGE FEE0.05%Yearly cost of holding an index tracking product
RETIREMENT PLAN ASSET SHARE47%Fund assets held inside workplace savings arrangements today
MANAGER RETAINED FEE SHARE61%Portion of a stated charge reaching the fund manager
MONEY MARKET FUND ASSETS6.4Trillions parked in short duration cash vehicles now
The flows have been one-directional for over a decade. Active equity funds have recorded net outflows every year while index products absorbed the money, and no marketing campaign, performance run or fee cut has reversed it anywhere. That is not a cycle. Managers responded by converting funds into exchange traded vehicles and filing for exchange traded share classes, which is a decision to become the thing eating them.
The stated charge is not the revenue and outsiders consistently miss this. Around 61% of a headline expense ratio actually reaches the manager once platform payments, revenue sharing and administrative fees are deducted, because roughly 47% of assets sit inside workplace savings arrangements where a recordkeeper or adviser controls which funds appear. The manager sets a price and somebody else decides whether anybody can buy it.
"People keep describing this as a scale business, and it is, in the sense that a treadmill is exercise. You have to gather assets faster than the fee rate falls just to stand still, and almost nobody has managed that for twenty years running."
Director, Asset Management Practice · MMA Asset Management and Fund Distribution Practice · August 2026

Market Trends

Managers Convert Into The Product Eating Them

Fund conversions into exchange traded vehicles and filings for exchange traded share classes of existing mutual funds accelerated once the original patent covering the structure expired, and approvals began arriving during 2025. That segment grows at 6.6%. It lets investors hold the identical portfolio at a lower charge with better tax treatment, which is excellent for them and unmistakably worse for the revenue line of whoever manages the money. Nobody in this industry enjoys the arithmetic and almost everybody has now concluded there is no real alternative to it anywhere.
Market Impact: Captures 47% of held assets
Cash Finally Pays And Money Market Assets Surged

Money market fund assets passed six trillion dollars once short rates rose, because for over a decade cash had paid nothing and holding it in a fund made no sense to anybody. That segment grows at 6.0%. The revenue is real and the balances are entirely rate-dependent, which makes this the one growing category in the industry that could reverse quickly if policy rates fall back toward where they were. Nobody held cash in a fund when it paid nothing, and nobody should assume they will keep doing so afterwards.
Market Impact: Grows Australian flows at 6.4%

Market Opportunities and Growth Drivers

Payroll Contributions Arrive Whatever Markets Do

Workplace savings arrangements hold roughly 47% of fund assets and contribute on every payroll cycle regardless of sentiment, valuations or anything appearing in the financial press that month. Target date funds capture most of that automatically as the default option. That segment grows at 5.4%. It is the only genuinely automatic inflow in the industry, and the managers holding default status on large plans have something competitors cannot bid for directly. Losing that status removes the same money just as silently and considerably faster than anybody ever expects it to.
Market Impact: Fell from 0.99% to 0.42%

Australian Superannuation Allocates Outward At Scale

Australian superannuation funds have grown large enough that domestic markets cannot absorb their allocations, which pushes substantial mandates toward North American managers running global and United States equity strategies. Australia grows fastest at 6.4%. Those mandates arrive as institutional business at institutional pricing rather than as retail fund flows, which means they add assets considerably faster than they add revenue to anybody. Chasing scale in reported assets under management while adding almost nothing to fee revenue is a comfortable way to appear to be growing, and almost every manager here does some of it.
Market Impact: Leaves 61% of stated fees

Market Restraints and Challenges

Fee Compression Has Never Once Reversed Anywhere

Asset-weighted equity charges fell from roughly 0.99% to about 0.42% across two decades without a single year of increase, and index products now average around 0.05%. Root cause is that investors finally received comparable fee data and acted on it. Commercial impact is that asset growth must outrun rate decline merely to hold revenue flat. Mitigation runs through scale, product mix and cost discipline, and none of those reverses the underlying direction. Twenty years without a single reversal anywhere is simply not a cycle anybody should expect to turn back.
Market Impact: Cuts charges toward 0.05%

Somebody Else Decides Which Funds Investors Can Buy

Roughly 47% of assets sit inside workplace plans where a recordkeeper or consultant selects the menu, and around 61% of a stated charge survives the platform payments required to appear on it. Root cause is that distribution consolidated faster than manufacturing did. Commercial impact is that a good fund nobody can access earns nothing. Mitigation involves platform relationships and payment negotiation, which favours exactly the largest managers already. A fund nobody can reach through a platform earns nothing whatever its performance record happens to look like to anybody at all afterwards.
Market Impact: Holds 6.4 trillion in assets
3 additional market trends, 4 additional growth drivers, and 2 additional restraints and challenges are covered in the full report. Contact sales@marketmindsadvisory.com to access the complete intelligence.

Segment CAGR and Growth Architecture

Segmentation follows fund category, since fee level, flow direction and distribution route all differ by category rather than by manager or investor type. Six categories cover the market without overlap. Investor channel, share class and manager size are treated as separate commercial dimensions throughout this report rather than as segmentation logic in their own right.
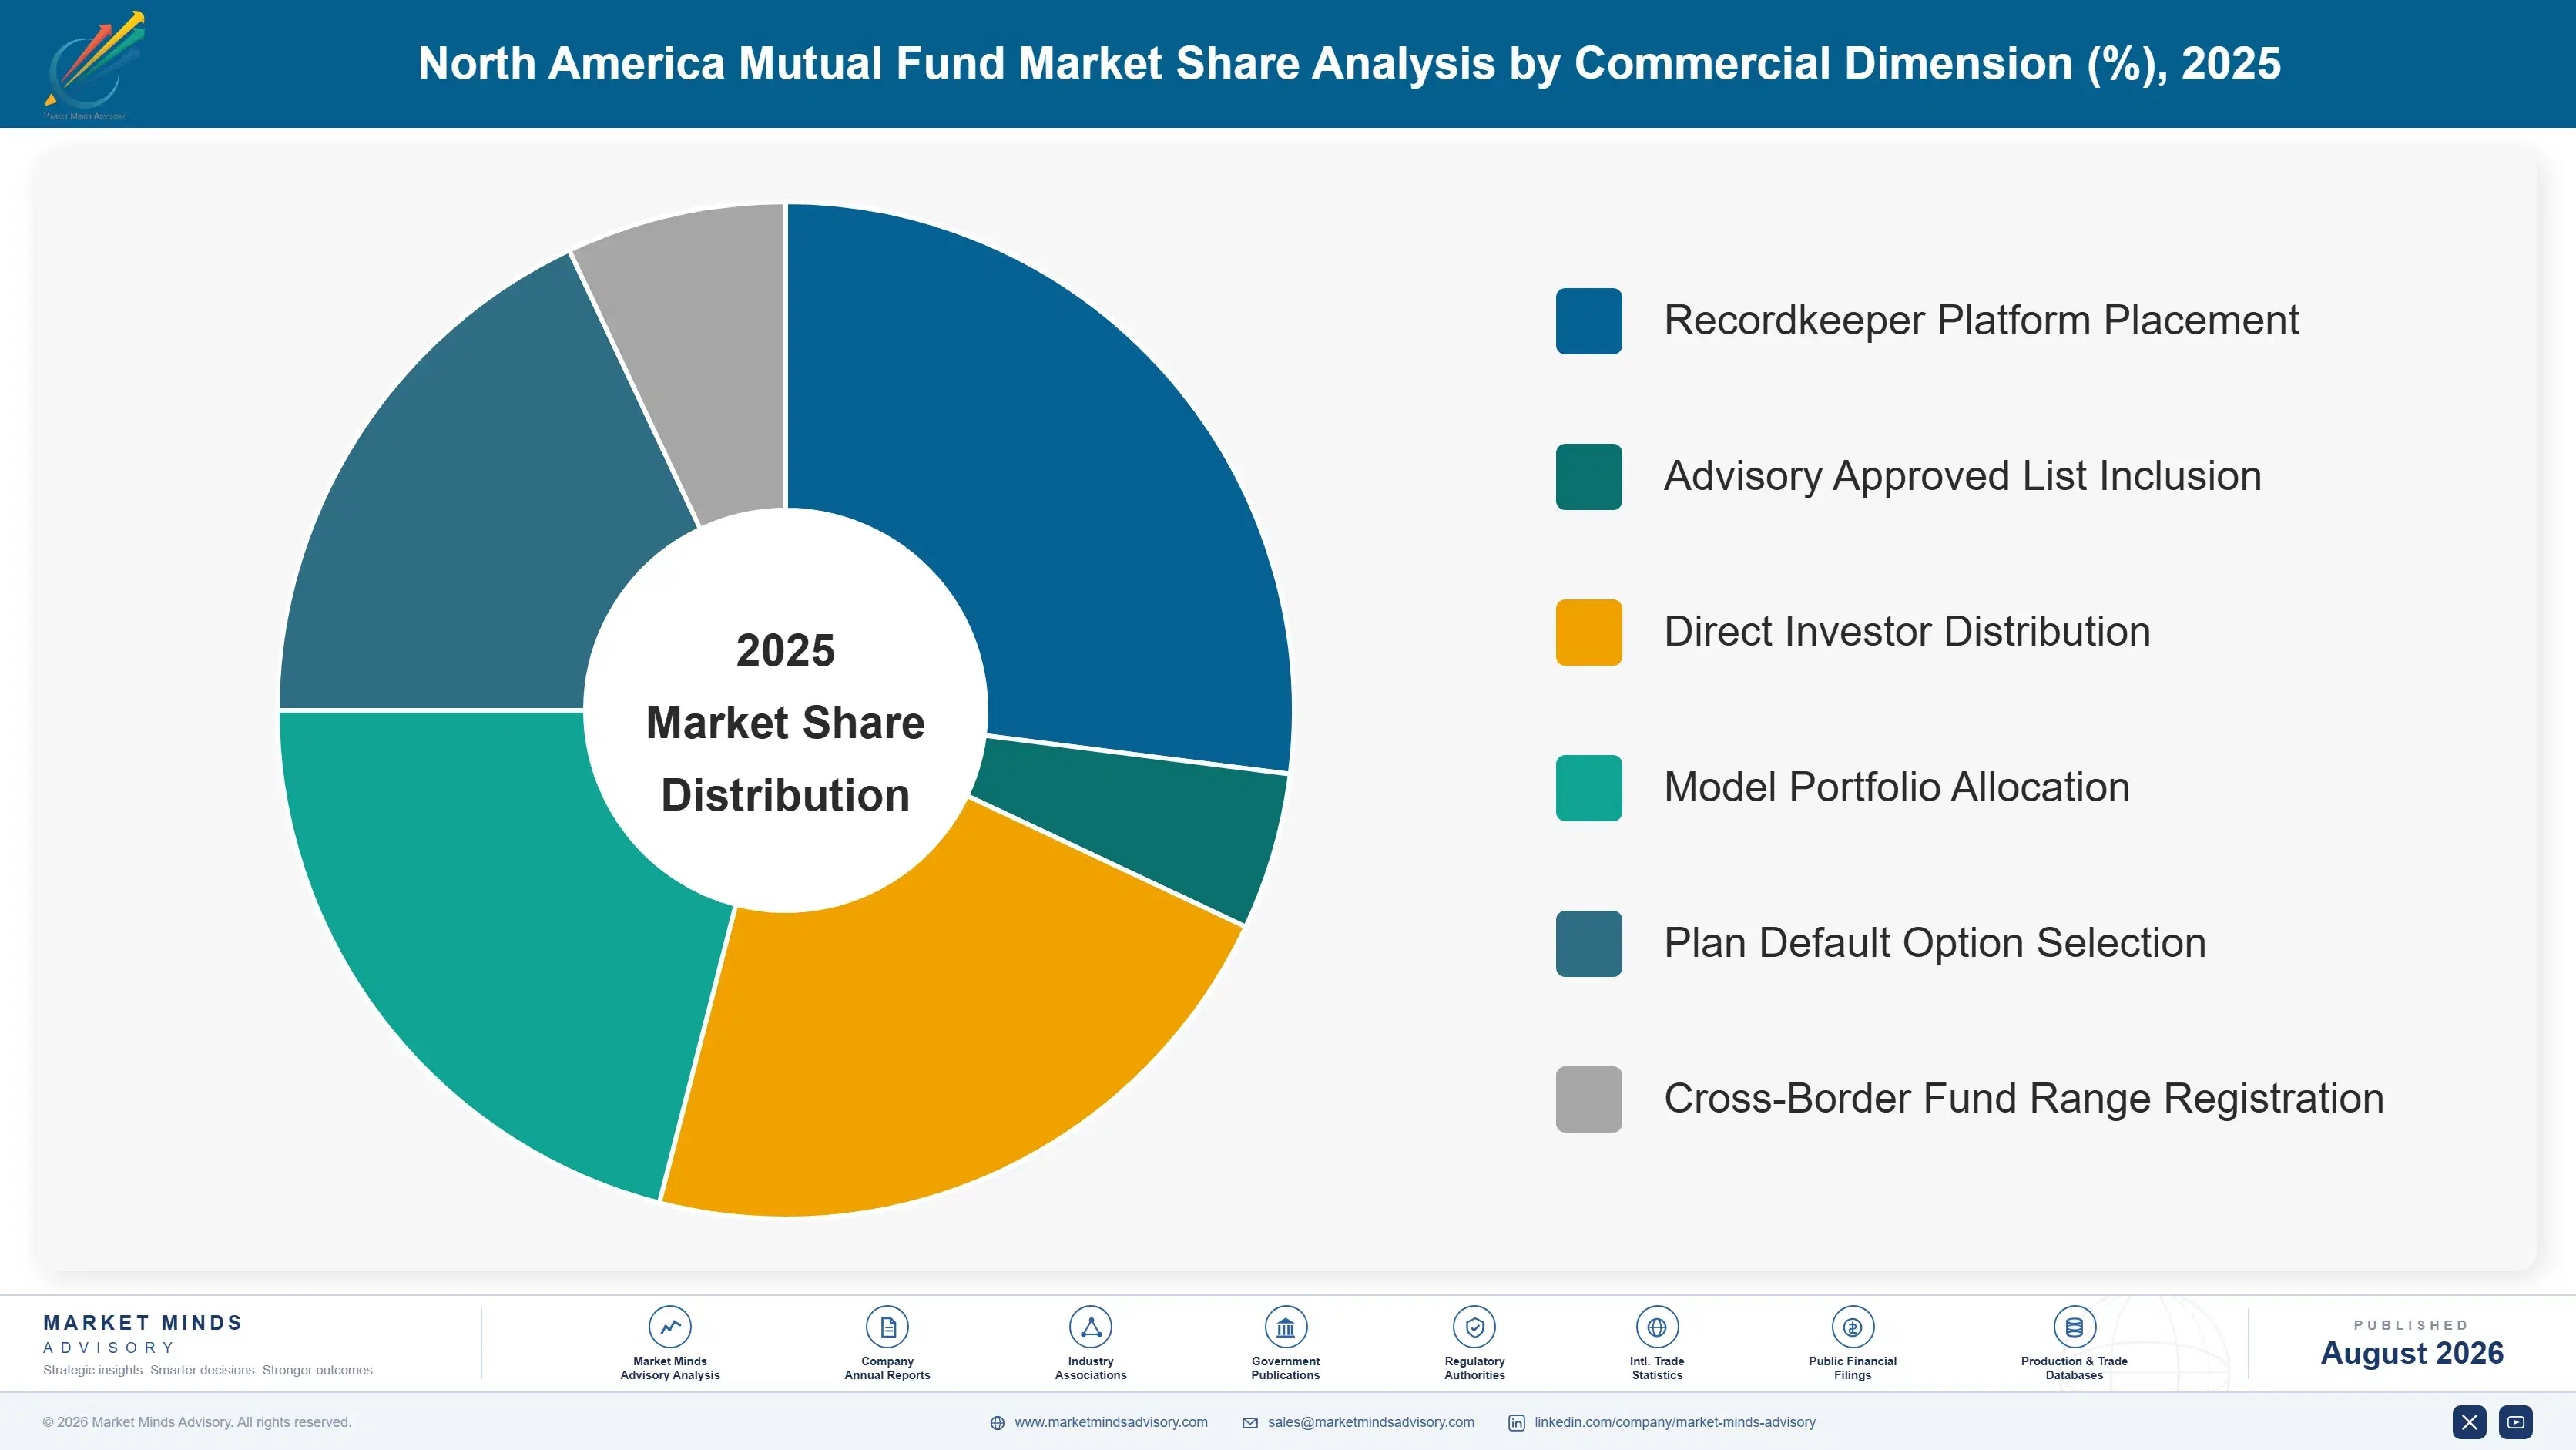
north-america-mutual-fund-industry-market-share-analysis-1787916041733

Index and Passive Equity Funds

Index and passive equity funds grow at 6.6%, half again the market rate of 4.4%, and they absorb essentially every dollar of net inflow while charging around 0.05% against roughly 0.42% across equity assets generally. The revenue arithmetic is unforgiving. Winning this category requires scale that only a handful of managers possess, since the economics work only at enormous asset levels, and the managers who arrived late are competing on a fee that leaves nothing to compete with. Managers who arrived late are competing on a fee level that leaves nothing whatsoever to compete with, which is a position from which no amount of investment capability rescues anybody at all.
CAGR 6.6%

Money Market Funds

Money market funds grow at 6.0% and hold roughly 6.4 trillion dollars after short rates rose enough to make cash worth holding in a fund again, which had not been true for over a decade beforehand. The revenue is genuine and the balances are entirely rate-dependent. Managers treating this as durable growth rather than as a rate cycle are building cost bases against assets that could leave as quickly as they arrived, and several appear to be doing precisely that. Sizing operations for balances that arrived because of a policy decision rather than any product improvement is the discipline this category most obviously requires and least reliably ever receives anywhere.
CAGR 6.0%
Full segment breakdown across 6 segments available in the complete report.

Regional Architecture and Country Demand Map

This is a region-scoped market and the distribution reflects where fee revenue is actually earned, with modest outward exposure through international mandates and cross-listed fund ranges. Fee revenue and assets under management sit in quite different places once the institutional mandates are counted properly here.

North America

Share sits at 84%, far above the standard regional band, because this is a region-scoped market and essentially all fee revenue is earned here. That justification is definitional rather than analytical. The United States and Canada behave quite differently within it: Canadian funds have historically charged among the highest fees anywhere, and regulatory action banning trailing commissions to order-execution-only dealers has compressed them faster than any competitive pressure managed on its own. Exchange traded share class approvals arriving during 2025 apply here first and hardest, since this is where the assets sit and where the patent that had blocked the arrangement for two decades was originally granted to a single manager.
Share: 84% | CAGR: 3.6% (2026 to 2036)

Western Europe

Share sits at 6%, far below the standard regional band, for the definitional reason applying across every non-domestic region here. Activity covers cross-listed fund ranges sold to European investors and institutional mandates awarded to North American managers by European pension arrangements. European fee disclosure rules have influenced how North American managers present costs, since a manager selling in both places generally standardises on the stricter requirement rather than maintaining two approaches. Fee levels across European fund ranges have historically sat above North American equivalents, which occasionally makes a cross-listed range more profitable per dollar than the domestic version of exactly the same strategy, and managers rarely draw attention to that comparison anywhere.
Share: 6% | CAGR: 2.8% (2026 to 2036)
Regional intelligence for 5 additional markets available in the complete report: East Asia, South Asia and Pacific, Latin America, Middle East and Africa, Eastern Europe. Contact sales@marketmindsadvisory.com.
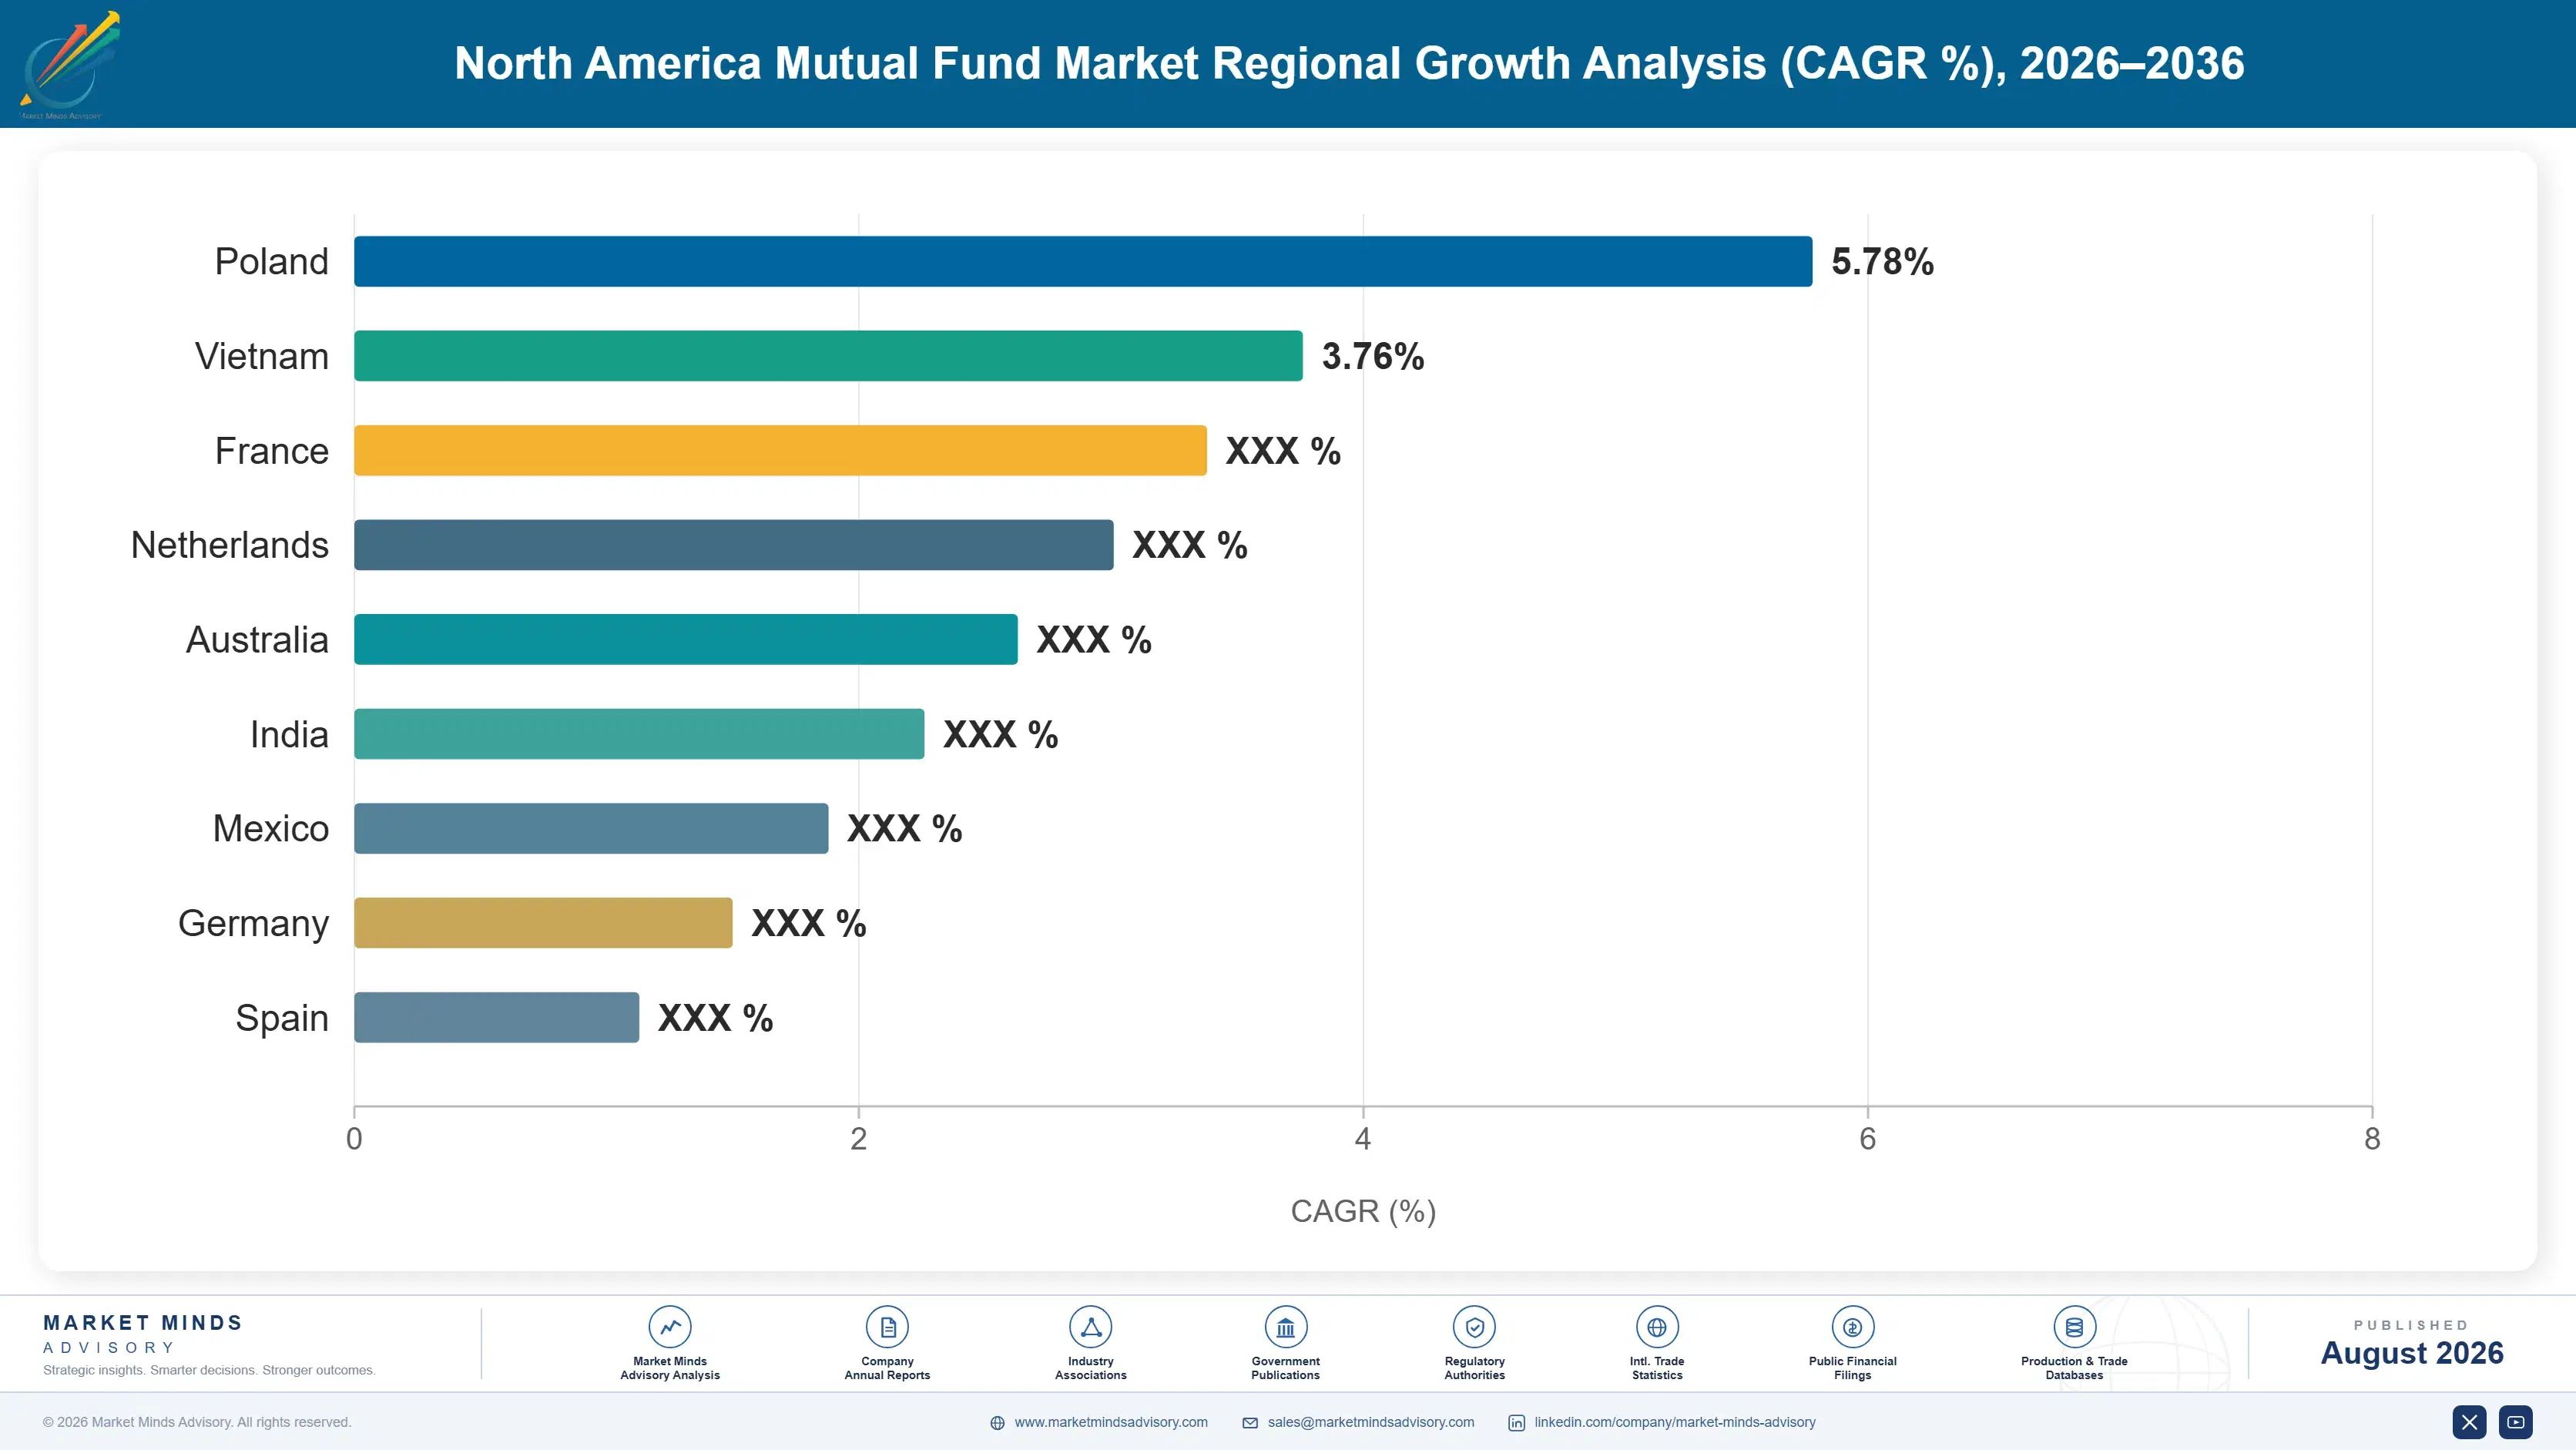
north-america-mutual-fund-industry-country-cagr-analysis-1787916042259

Outrun The Falling Fee Rate

Equity charges have fallen from 0.99% to 0.42% while index products cost 0.05%, workplace plans hold 47% of assets and managers keep 61% of a stated fee. Four levers here work on scale, default status, platform economics and product structure rather than on performance, which decides remarkably little about where any money actually goes.

Win Default Status Inside Large Workplace Plans

Workplace arrangements hold roughly 47% of fund assets and contribute every payroll cycle regardless of markets, with target date funds capturing most of it automatically as the plan default. That is the only genuinely automatic inflow anywhere in this industry. Winning default status on a large plan produces contributions nobody has to market for continuously, and losing it removes them just as silently and considerably faster than anybody expects. Consultants run those searches on a schedule nobody outside the process can influence, which means the work has to start long before any review is announced.
Market Impact: Captures the flows across 47% of held assets

Negotiate Platform Economics Before Assets Depend On Them

Around 61% of a stated expense ratio survives platform payments and revenue sharing, and the share falls further as distribution consolidates into fewer recordkeepers and advisory networks. Managers negotiating once assets already depend on a platform negotiate from nowhere at all. Agreeing terms while the relationship remains genuinely optional preserves margin that the largest managers already secure and everybody smaller quietly surrenders. Distribution consolidated faster than manufacturing did, and the largest managers already secure terms that everybody smaller quietly accepts without ever raising the question at any renewal at all.
Market Impact: Protects that 61% retained fee share properly instead

File Exchange Traded Share Classes Rather Than Waiting

Exchange traded share classes of existing funds let investors hold the identical portfolio at a lower charge with better tax treatment, and approvals began arriving during 2025 after the original patent expired. That is worse for revenue and considerably better than losing the assets entirely. Managers who file early keep the money inside their own house, and managers who wait watch it move to somebody who did not. Nobody enjoys filing an application that reduces their own fee rate, and everybody watching a competitor file has already understood what happens next.
Market Impact: Retains the assets against a 0.05% cheaper alternative

Size The Money Market Business For A Rate Cycle

Money market balances reached roughly 6.4 trillion dollars only because short rates rose enough to make cash worth holding in a fund again, which had not been true for over a decade. Building fixed cost against those assets treats a rate cycle as durable growth. Managers sizing operations for a lower balance keep the profit when rates fall, and everybody else keeps the cost base instead. Nobody in this industry has ever sized a business correctly for a rate cycle, and the ones who tried during the last one were proved right eventually.
Market Impact: Manages the 6.4 trillion dollar rate exposure carefully

Who Controls the Margin Pool

Measured on disclosed mutual fund management and distribution fee revenue in North America, the five largest managers hold a CR5 of 56%, and the concentration is considerably higher in passive products specifically where economics demand enormous scale. Vanguard and BlackRock dominate index assets, Fidelity Investments carries both fund management and recordkeeping distribution, Capital Group holds substantial active franchises, and T. Rowe Price retains strong target date positions. Nobody outside that group operates both a large recordkeeping platform and a leading passive range at the same time.
Three contests define activity. Passive products compete on cost and scale, where a handful of managers can operate at all. Active products compete for shrinking allocations. Target date funds compete for plan default status. Each of those three rewards a completely different capability, and hardly any manager competes convincingly across more than one.

Pressure builds from exchange traded share class approvals letting investors hold the same portfolio more cheaply. Rankings shift toward whoever controls distribution rather than whoever manages money well. Assets under management stopped explaining revenue some years ago, since the fee rate attached to each dollar varies by a factor of eight.
north-america-mutual-fund-industry-company-positioning-matrix-1787916042777

Competitive Moat and Risk Dimensions

VANGUARD

Moat: Ownership Structure And Cost Position

Being owned by its own funds removes any shareholder demanding margin, which allows pricing at levels no publicly listed competitor can match without destroying its own economics. That is not a strategy anybody else can adopt, since it requires an ownership arrangement rather than a decision. That cost position has driven industry fees downward for three decades.
VANGUARD

Risk: Scale Without Pricing Headroom

Operating at fee levels near the bottom of what is economically possible leaves almost no room to absorb rising operational, technology or compliance cost without either raising charges or accepting thinner coverage. Growth must come entirely from asset gathering. There is no pricing lever available in either direction when conditions change.
FIDELITY INVESTMENTS

Moat: Recordkeeping Alongside Fund Management

Operating workplace plan recordkeeping alongside asset management puts the firm on both sides of the arrangement that holds roughly 47% of fund assets, controlling the shelf as well as supplying products for it. Competitors selling into those plans negotiate with a firm that also competes with them. Building comparable recordkeeping scale requires operational investment nobody has attempted seriously in decades.
FIDELITY INVESTMENTS

Risk: Conflict Scrutiny Across Both Roles

Holding both the platform and the products invites persistent regulatory and litigation attention about whether plan participants receive genuinely independent fund selection. Disclosure obligations have tightened repeatedly. The arrangement producing the advantage is precisely the arrangement that attracts the questions, and it cannot be separated without losing the advantage.

Players Tracked

Prominent Players

Vanguard
BlackRock
Fidelity Investments
Capital Group
T. Rowe Price

Other Key Players

State Street Global Advisors
JPMorgan Asset Management
Invesco
Franklin Templeton
Charles Schwab Investment Management
Dimensional Fund Advisors
PIMCO
Federated Hermes
American Century Investments
Janus Henderson
MFS Investment Management
Nuveen
RBC Global Asset Management
TD Asset Management
CI Global Asset Management

Recent Developments

FEBRUARY 2025

Regulator approves exchange traded share classes for existing mutual funds

A securities regulator approved applications permitting exchange traded share classes of existing mutual funds, ending a period where one manager had held exclusive access under patent. This was a regulatory approval rather than any product launch, and dozens of managers had filings pending behind it.
Signal: Investors can now hold exactly the same portfolio far more cheaply inside precisely the same fund.
JUNE 2025

Large plan sponsor replaces target date default with lower cost series

A large workplace plan sponsor replaced its default target date series with a lower cost alternative following a consultant review. This was a plan decision rather than any performance event, and contributions redirected automatically without any participant anywhere having to take any action at all themselves.
Signal: Default status changes hands very quietly and the flows follow immediately without anybody actually choosing anything.
OCTOBER 2025

Active equity range consolidated after another year of outflows

A fund manager merged several active equity funds into surviving vehicles following continued redemptions across the range. This was a rationalisation rather than any strategic exit, and the consolidated products carry lower stated charges than any of the individual funds that they have replaced entirely.
Signal: Consolidation reduces the cost base and the outflow direction has not changed for anybody at all.

Distribution, Management, Operations

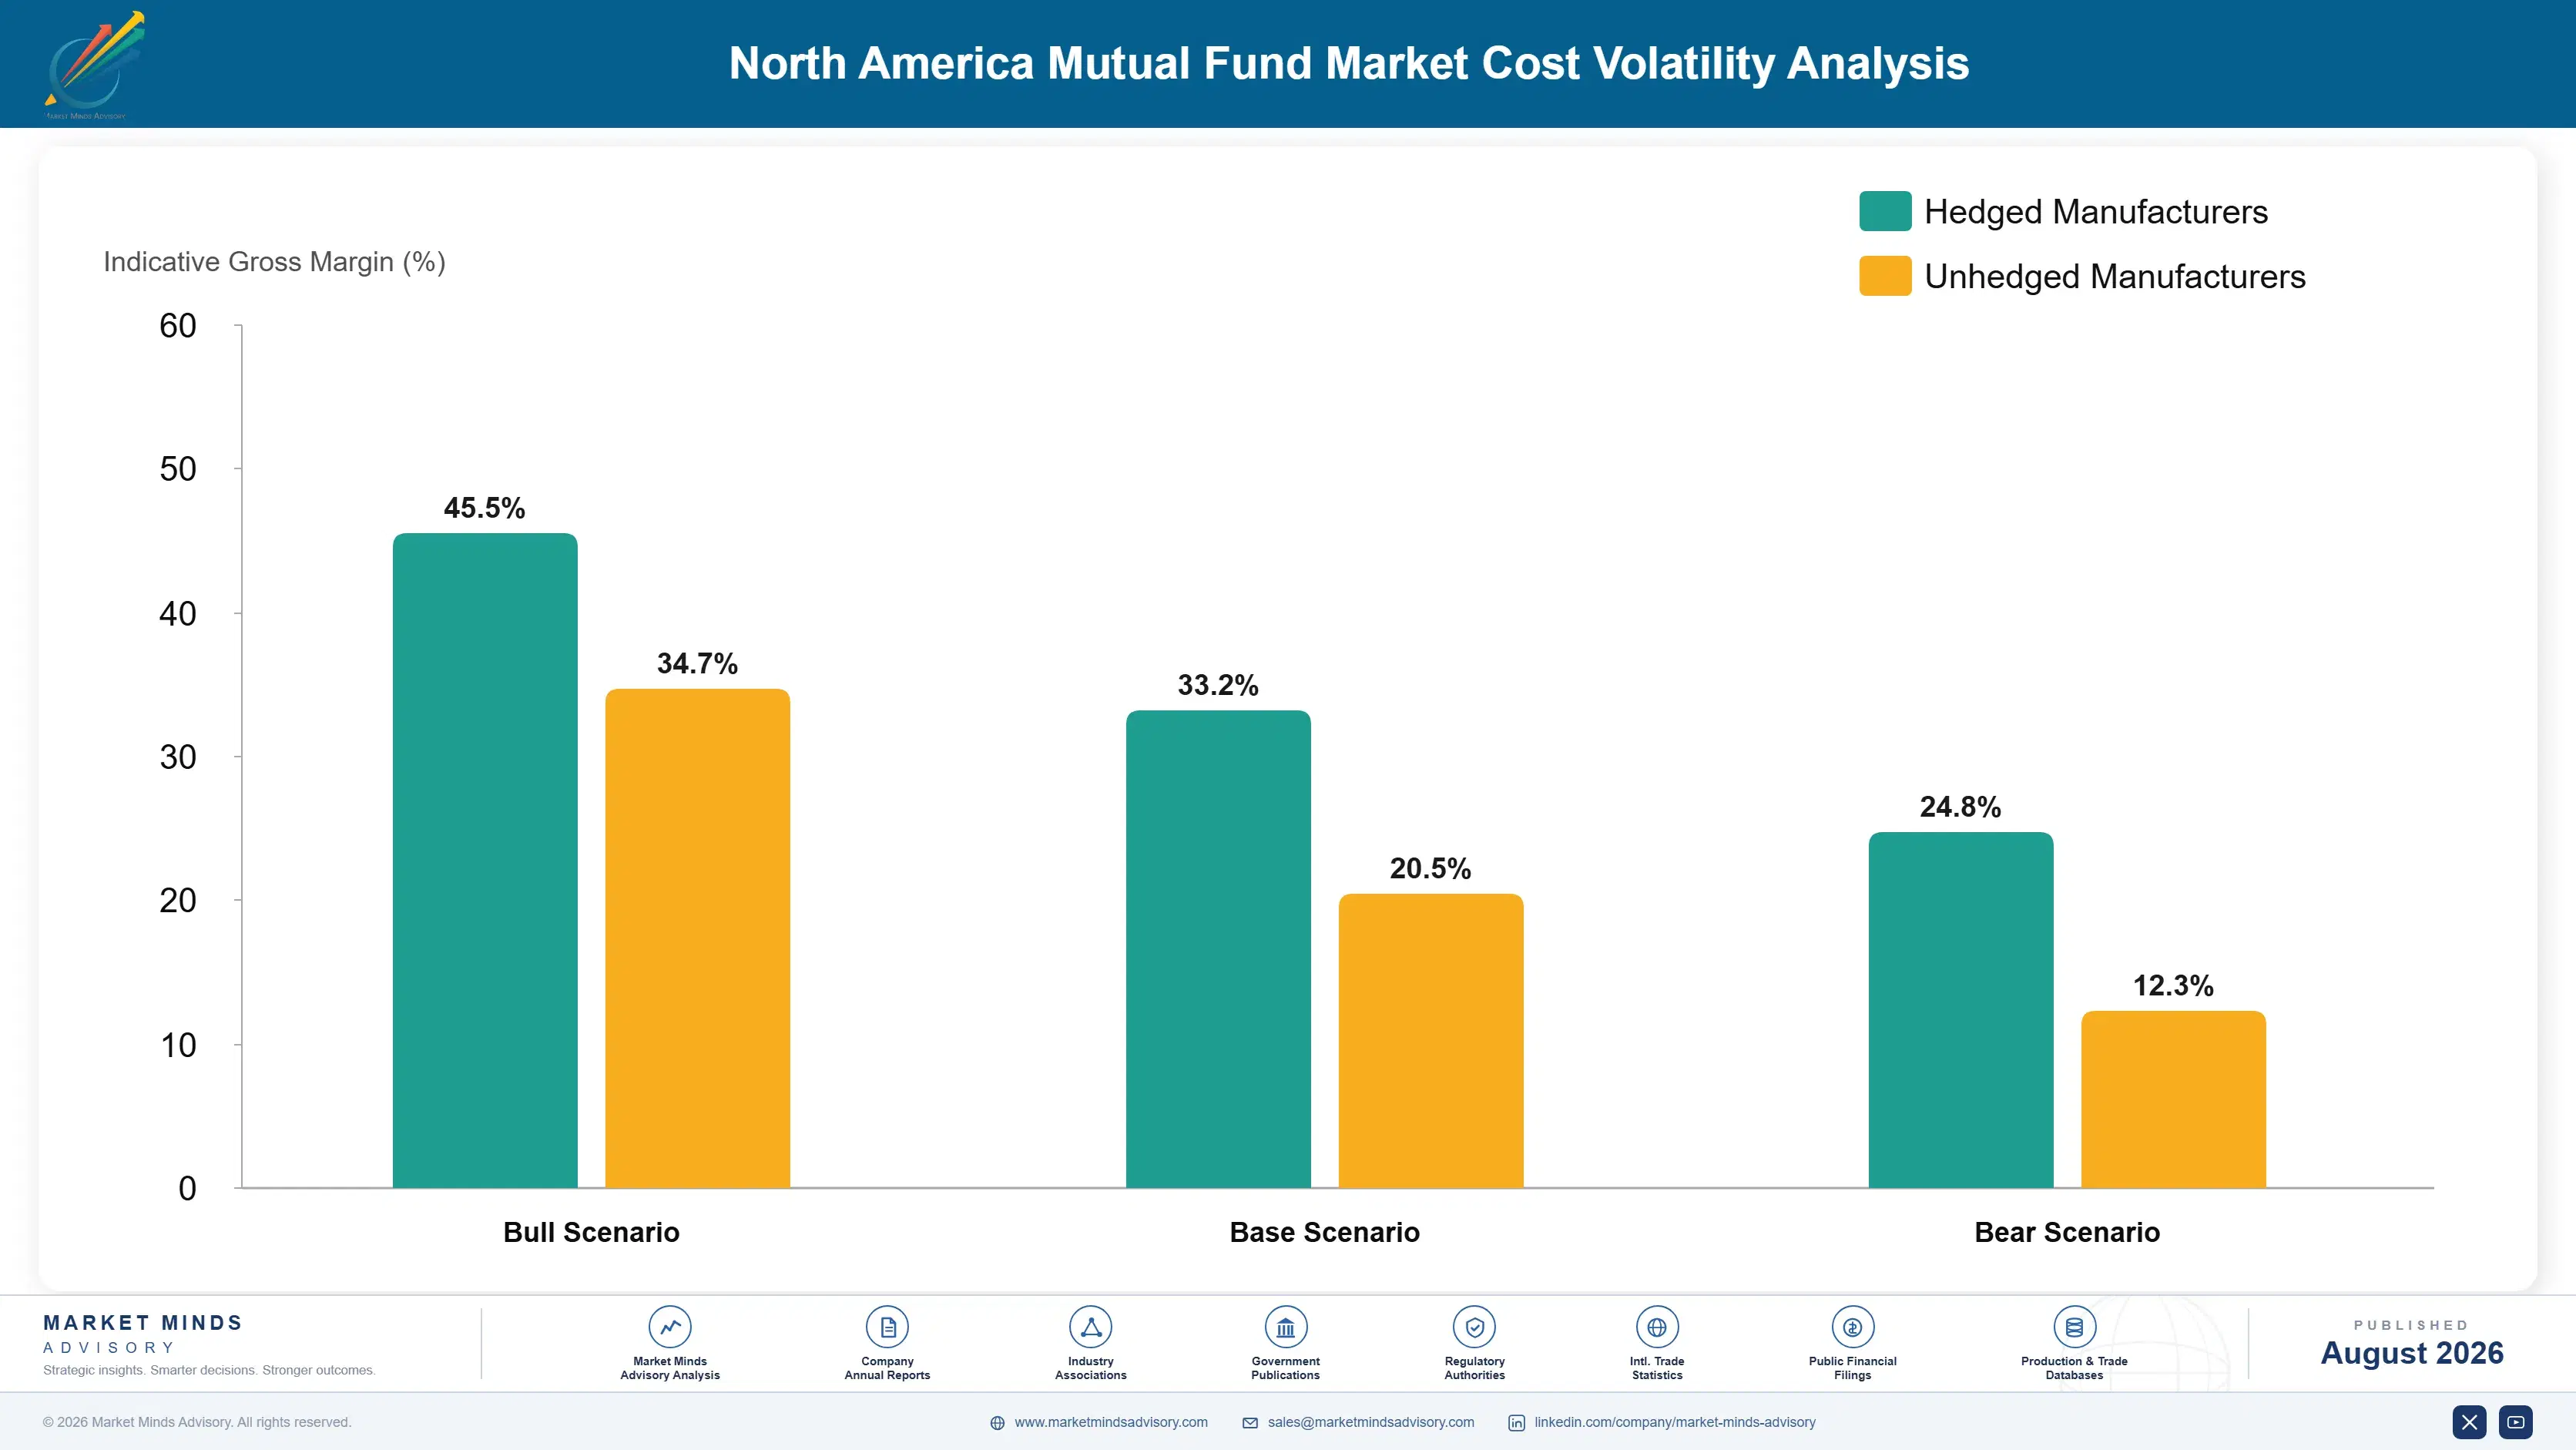
Three costs consume the fee. Distribution and platform payments, portfolio management with research, and operations covering custody transfer agency and compliance together account for 64 to 79% of gross fee revenue at a typical manager. Distribution dominates and it is the one that grew, because around 39% of a stated expense ratio now leaves before the manager sees it and the share rises every time distribution consolidates further.
Two forces moved the economics in opposite directions. Rising short rates pushed money market assets past six trillion dollars and produced genuine fee revenue, which Investment Company Institute data records across the period. Meanwhile Securities and Exchange Commission approval of exchange traded share classes opened a cheaper route to identical portfolios, and BlackRock Annual Report 2024 and T. Rowe Price Annual Report 2024 disclosures describe both effects on reported fee rates together.

Exposure divides by whether a manager controls its own distribution. Firms operating recordkeeping or advisory platforms alongside asset management keep payments that others make outward. Firms manufacturing only products pay whatever the platform demands and have very little to negotiate with. That difference decides realised fee rates far more reliably than investment performance or stated pricing ever has for anybody.
north-america-mutual-fund-industry-cost-volatility-analysis-1787916042974

Agree platform terms before asset dependence develops

Around 39% of a stated expense ratio leaves before the manager receives anything, and that share rises whenever distribution consolidates further into fewer recordkeepers. Negotiating once assets already sit on a platform means negotiating from no position at all. Agreeing terms while the relationship remains genuinely optional preserves margin that larger managers already secure routinely.

File exchange traded share classes rather than defending price

Exchange traded share classes let investors hold identical portfolios at lower cost with better tax treatment, and approvals arrived during 2025 after the original patent expired. Filing reduces the fee rate on affected assets immediately and visibly. It is considerably better than watching those assets leave for a competitor who did file first instead.

Size operations for money market balances that can leave

Assets reached roughly 6.4 trillion dollars only because short rates made cash worth holding in a fund again, which was untrue for over a decade beforehand. Building permanent cost against those balances treats a rate cycle as durable growth. Sizing for a lower level keeps the profit when policy rates do eventually fall back.

Portfolio Architecture for Margin Defence

Margin follows fee level and scale together, which places the growing products at the bottom. Index and passive equity funds earn thinly per dollar and profitably only at enormous scale. Money market funds earn modestly and entirely at the mercy of short rates. Fixed income funds earn reasonably on moderate charges. Target date funds earn well through default status. Specialty and alternative strategies earn better on higher fees. Active equity funds earn best per dollar and lose assets every year.
The tension is that revenue per dollar and flow direction point exactly opposite ways. Active equity carries the highest fee rate in the industry and has recorded outflows every year for over a decade. Index products carry the lowest and take everything. A manager can defend margin on active assets that are leaving, or grow passive assets that pay almost nothing, and nobody has found a third option.

High-value pools sit in three places. Target date default status inside large workplace plans, which produces automatic contributions competitors cannot bid for directly. Owned distribution, whether recordkeeping or advisory, which converts an outward payment into a retained one. And specialty strategies, where fee levels held because comparison is genuinely harder.

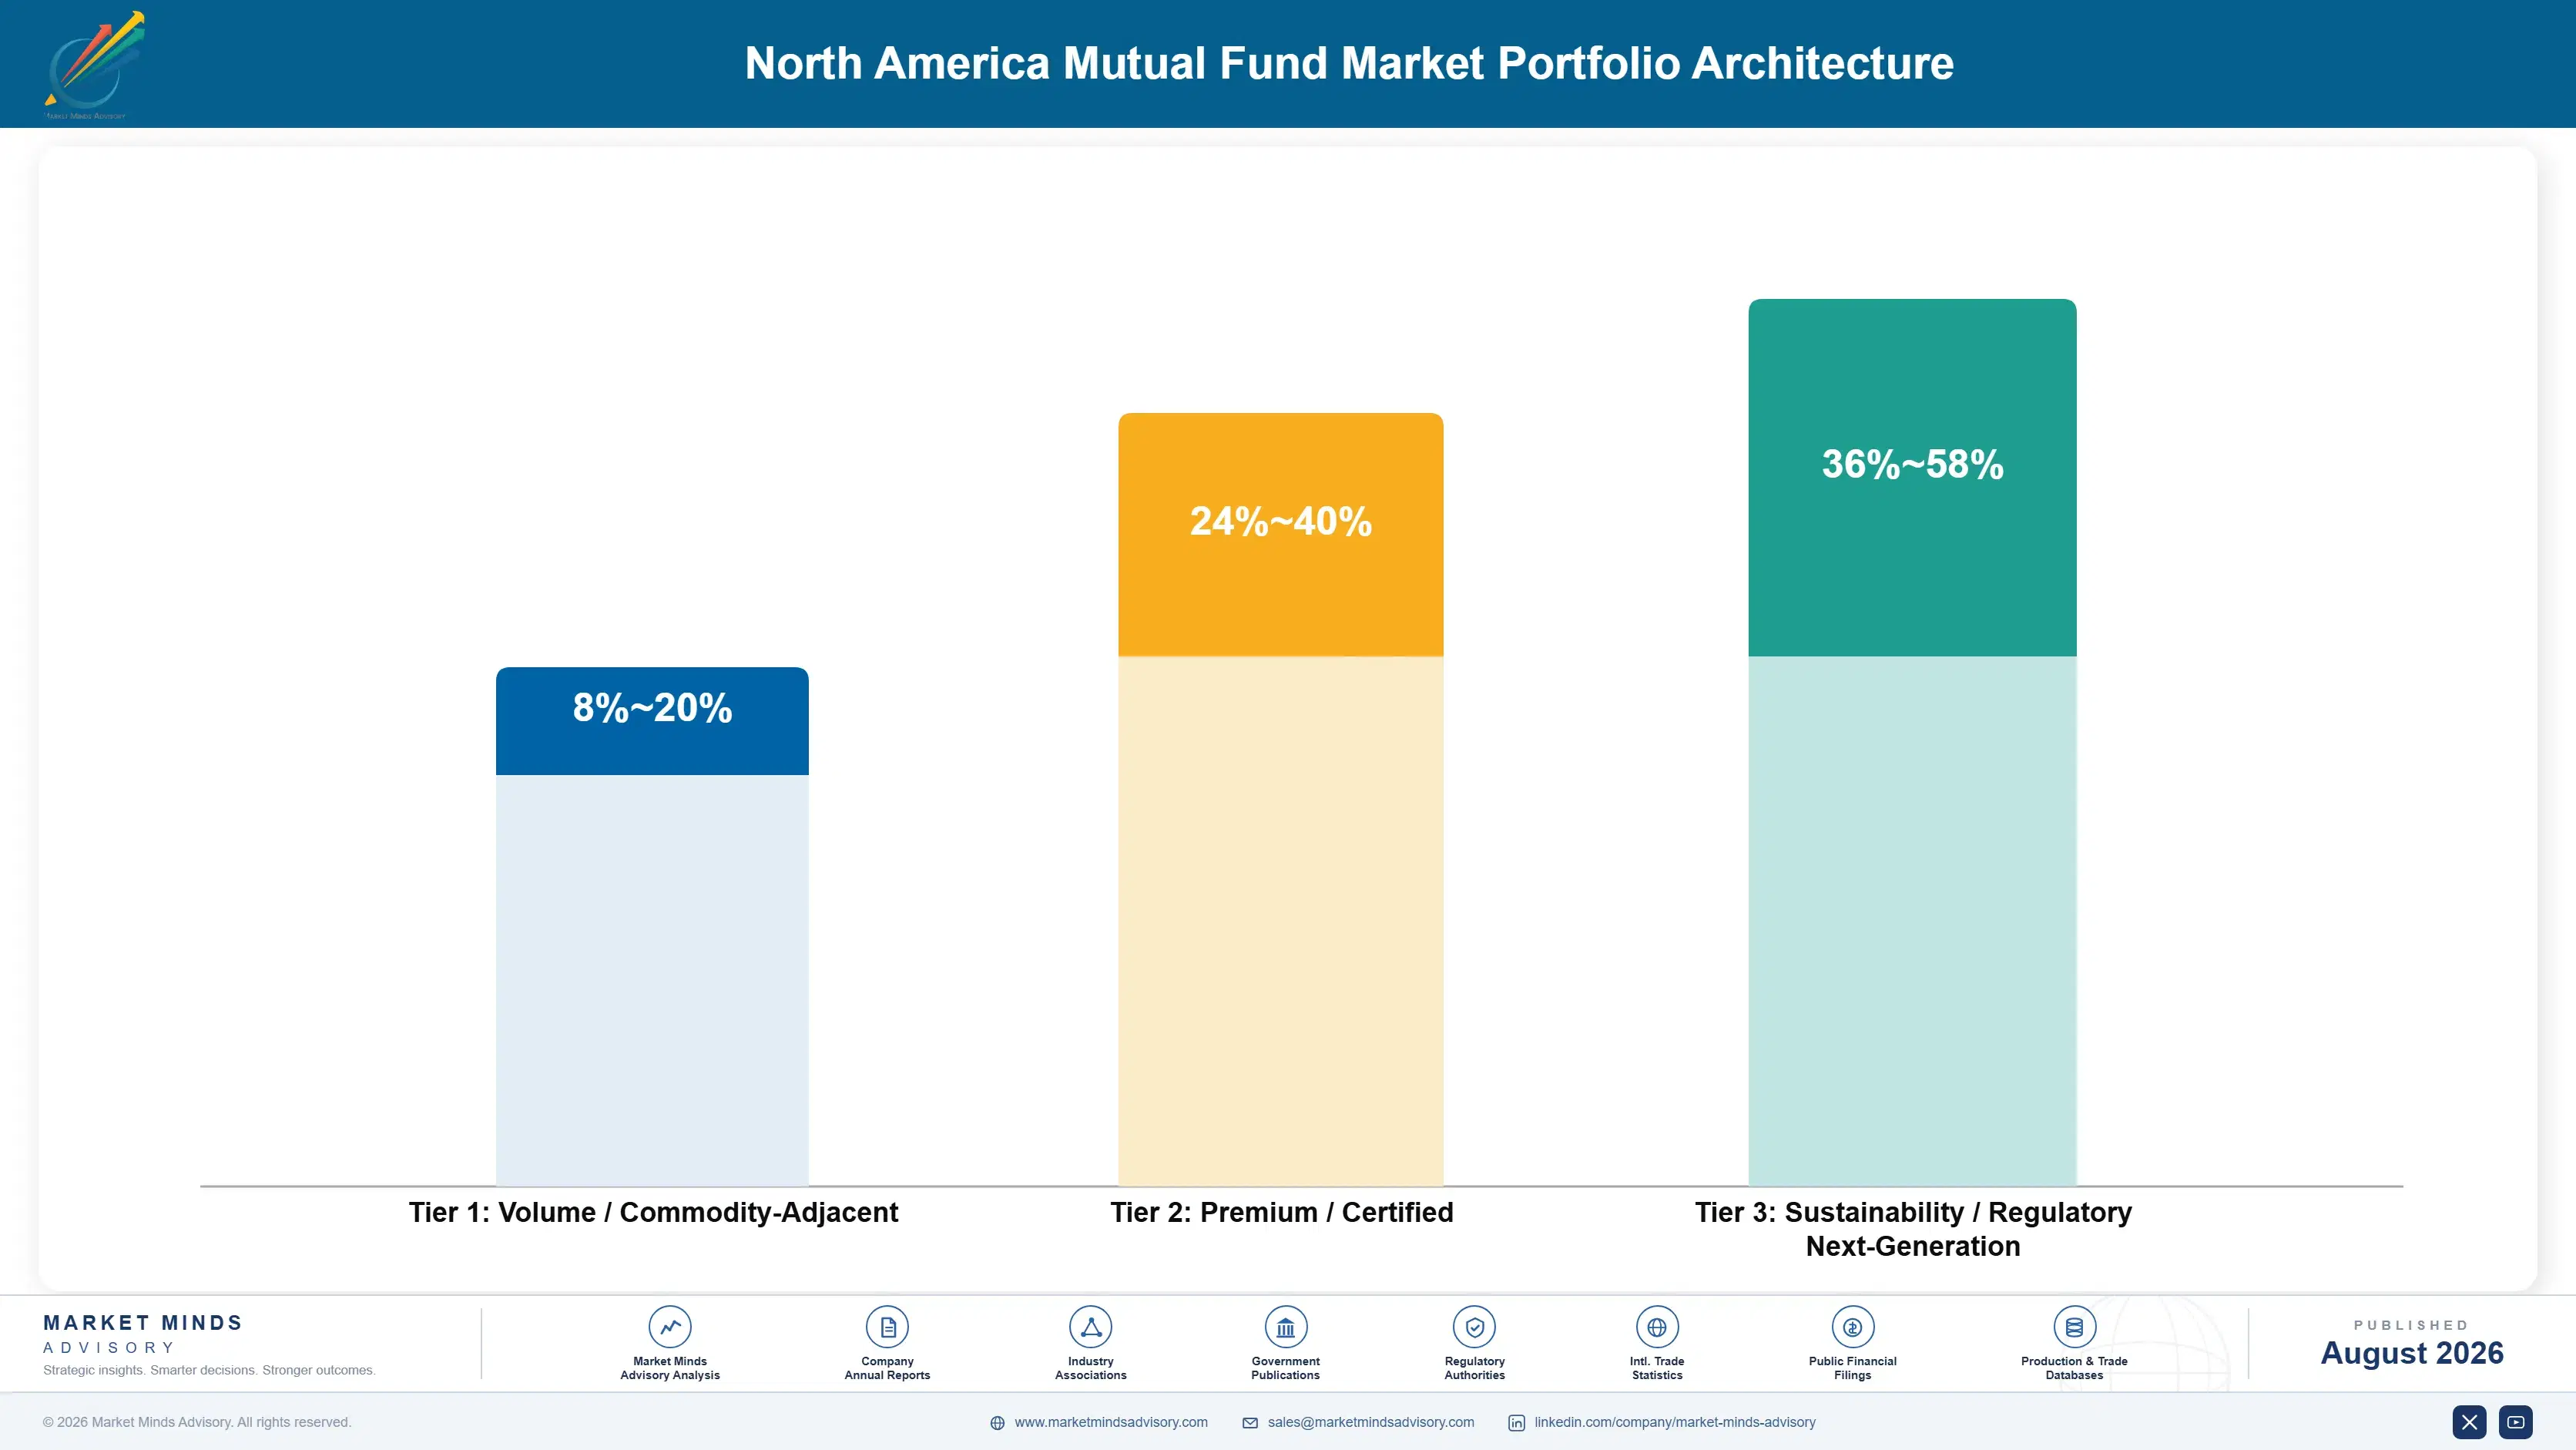
Volume / Commodity-Adjacent

Index equity and money market funds priced near the floor of what remains economically viable at all. The 12-point range separates managers operating at genuinely enormous scale from those competing on the same fee without the asset base to support it.
Gross Margin: 8-20%

Premium / Certified

Fixed income and target date funds where moderate charges and steady contributions produce dependable if unspectacular economics. The 16-point spread reflects how differently default status and non-default target date assets perform for any manager.
Gross Margin: 24-40%

Sustainability / Regulatory / Next-Generation

Active equity and specialty strategies carrying the highest fee levels remaining anywhere in the industry. The 22-point range is wide because active equity margins sit on a shrinking asset base while specialty strategies hold pricing considerably better.
Gross Margin: 36-58%
north-america-mutual-fund-industry-portfolio-architecture-1787916043475

High-value Sub-segments and Strategic Watch-out

Target Date Default Positions

Strong economics from contributions arriving every payroll cycle without anybody choosing anything, which is the only automatic inflow left anywhere in this industry. The risk is that default status changes hands on a consultant review with no warning. And nobody gets any warning at all.
Gross Margin: 42-56%

Owned Distribution Platforms

Excellent economics from retaining payments that competitors make outward, since roughly 39% of a stated fee leaves the manager entirely. The risk is persistent regulatory and litigation attention about whether fund selection is genuinely independent. And that particular question is never going to go away.
Gross Margin: 38-52%

Passive Equity Scale

The volume core taking essentially every net inflow while charging around 0.05% for the privilege of doing it. Managers hold it because the alternative is holding nothing, not because the fee rate rewards anybody adequately. Holding nothing at all is the only actual alternative here.
Gross Margin: 10-22%

Active Equity Fee Base

The strategic watch-out. It carries the highest fee rate in the industry on an asset base that has shrunk every single year for over a decade. The risk is defending margin on money that is already leaving regardless. And the direction has never once changed.
Gross Margin: 34-48%

Contributions Arrive By Themselves

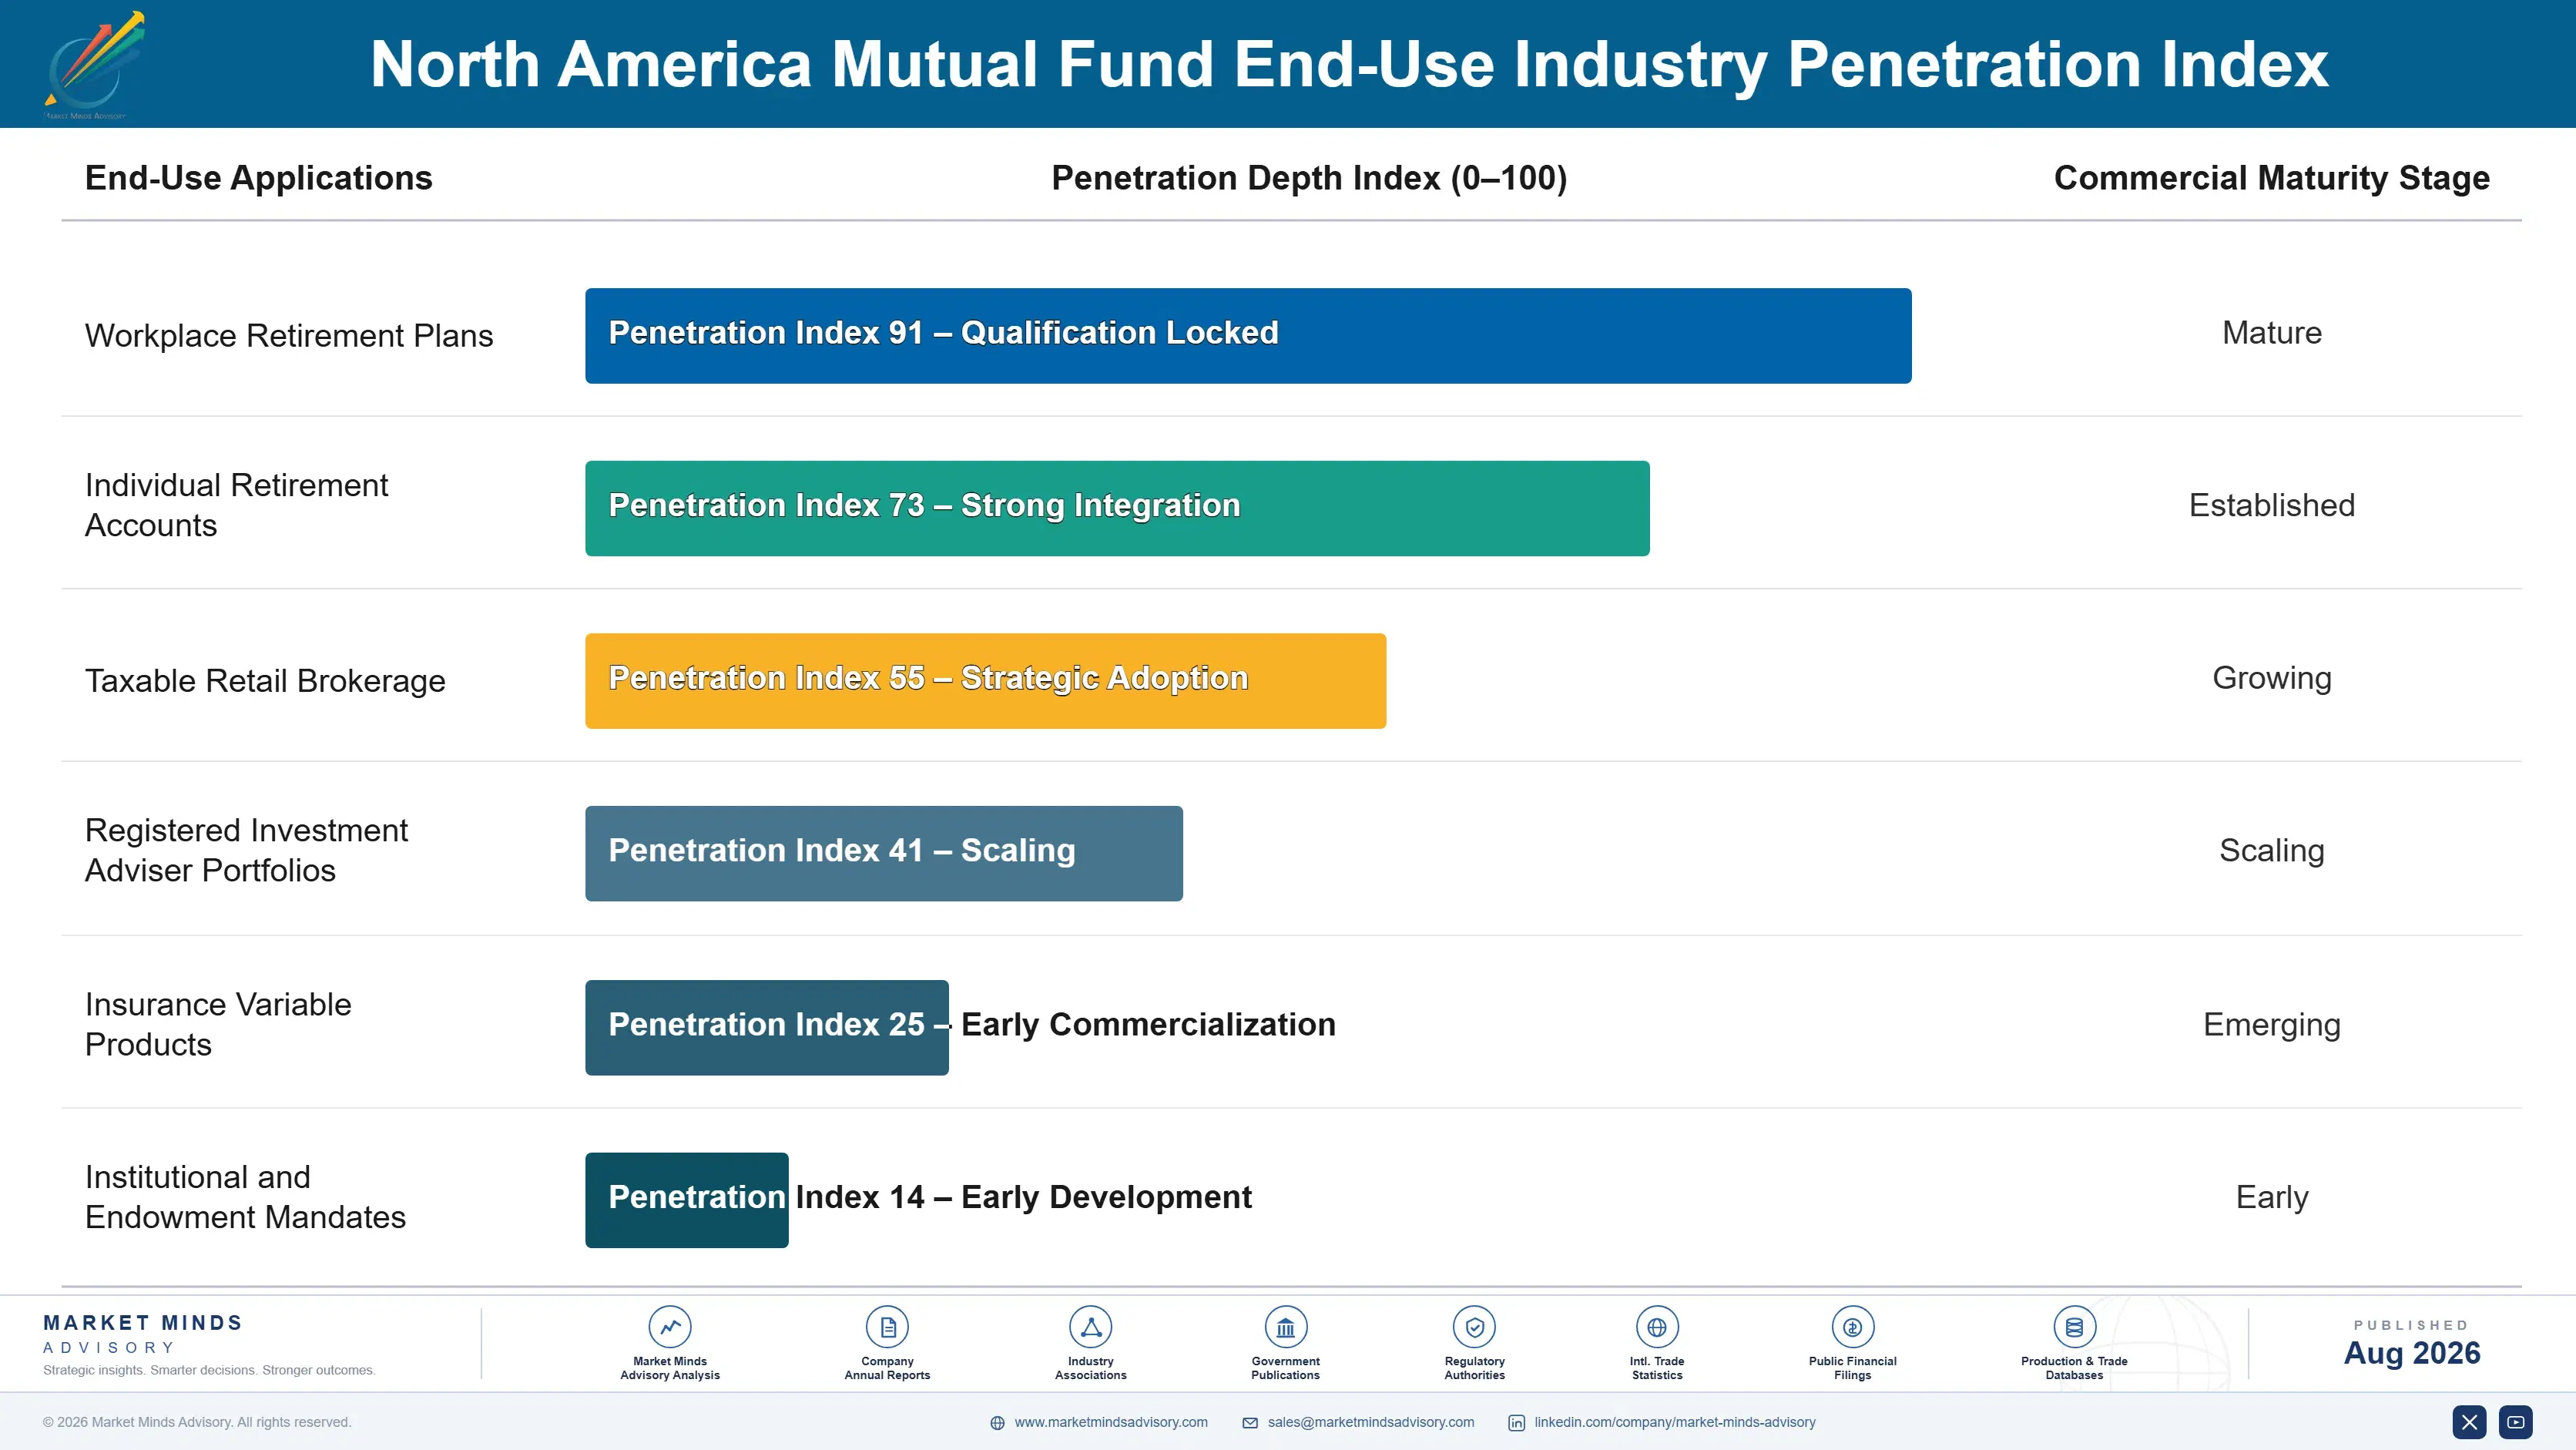
Annuity characteristics here are exceptionally strong and almost entirely involuntary. Fees accrue daily on assets that mostly sit still, workplace contributions arrive every payroll cycle whatever anybody thinks about markets, and switching requires a deliberate act that most investors never take. Roughly 47% of assets sit inside plans where a participant would have to log in and choose. Revenue therefore persists through periods when nothing about the product justifies it.
Stickiness varies enormously by how the money arrived. Default target date assets are extraordinarily sticky, since nobody chose them and nobody will choose to leave. Adviser-placed assets move when the adviser moves, which happens on platform economics rather than on performance. Direct retail assets are the least sticky and the most fee-sensitive, because those investors selected the fund deliberately and will reselect just as deliberately.

The decision maker has moved almost entirely away from the investor. Plan consultants select menus, recordkeepers control shelf access, advisory platforms operate approved lists and model portfolios allocate mechanically. An individual holding a fund frequently never chose it and could not name the manager. Managers still marketing to end investors are addressing somebody four intermediaries have already removed from the decision.
north-america-mutual-fund-industry-end-use-penetration-index-1787916043965

Distribution Beats Performance

These are among the four positions where our research anticipates prominent divergence between winners and laggards over the coming forecast period. Each is grounded in the demand model, the regulatory perimeter, and the announced capacity pipeline.
01 / DEFAULT STATUS PURSUIT

Contributions arrive whether anybody chooses or not

Workplace savings arrangements hold roughly 47% of all fund assets and they contribute on every single payroll cycle regardless of markets, sentiment or anything else at all, with target date funds capturing most of that automatically as the standing plan default option. It is the only genuinely automatic inflow left anywhere in this entire industry. Winning default status produces money that nobody has to market for at all, and losing it removes that same money just as silently and considerably faster.
02 / PLATFORM ECONOMICS DISCIPLINE

Thirty-nine percent of your fee never arrives

Around 61% of any stated expense ratio actually reaches the fund manager once the platform payments and revenue sharing have been deducted, and that share keeps falling further as recordkeeping and advisory distribution consolidate into ever fewer hands with each passing year. Managers who negotiate terms once their assets already depend on a platform are negotiating from no real position whatsoever. Agreeing them while the relationship still remains genuinely optional preserves the margin that larger competitors already secure quite routinely.
03 / STRUCTURE CONVERSION TIMING

Become the cheap thing before somebody else does

Exchange traded share classes of existing funds now let investors hold identical portfolios at a materially lower charge with better tax treatment, and the approvals began arriving during 2025 once the original patent covering that arrangement had finally expired. That is unmistakably worse for the fee rate and it is considerably better than simply losing all the assets outright. Managers who choose to file early keep that money inside their own house rather than simply watching it move somewhere else entirely.
04 / RATE CYCLE SIZING

Six trillion arrived because rates rose

Money market balances here reached roughly 6.4 trillion dollars only because short rates rose far enough to make holding any cash in a fund worthwhile again, which simply had not been true for well over a decade beforehand anywhere. Building permanent cost against all those assets treats an ordinary rate cycle as though it were durable growth. Managers sizing operations for a lower balance keep the profit when rates eventually fall, while everybody else simply keeps the whole cost base.

Engagement Snapshot From the Field

A live engagement with an industry participant carrying material or product regulatory and market exposure ahead of a defining policy shift, showing how our research translates into a defensible multi-year portfolio strategy.
MARKET MINDS ADVISORY · CLIENT ENGAGEMENT SUMMARY
North America Mutual Fund Producer Strategic Portfolio Review and Transition Roadmap 2026·Investment Scenario on North America Mutual Fund Exposure Evaluation 2025-26
CLIENT PROFILE
A mid-sized North American mutual fund manager with reported management and distribution fee revenue of 340 million dollars (client-reported, unverified by MMA). Roughly 68% of revenue came from active equity funds recording steady outflows. No target date default positions existed on any large plan and no exchange traded share class filing had yet been prepared or scoped internally.
STRATEGIC CHALLENGE
Active equity assets had declined for six consecutive years while the fee rate held, which flattered reported margin and concealed a shrinking base. Management proposed increasing marketing spend to reverse the outflows. That addressed a flow direction no manager anywhere has reversed with marketing, while leaving the distribution position and product structure entirely unchanged.
MMA APPROACH
MMA analysed revenue by fee rate against flow direction, separating the shrinking high-fee base from the growing low-fee one. Twenty-four expert interviews with plan consultants, recordkeepers, advisory platform heads and competing managers established how allocation decisions are actually made now. The analysis treated default status pursuit and structure conversion as the routes genuinely available forward.
KEY FINDINGS
  1. Active equity revenue was declining at roughly the same rate as assets, and the stable fee rate had concealed that decline in every internal report produced.
  2. Plan consultants interviewed said the manager was absent from default target date consideration entirely, and none had been approached about it in three years.
  3. Platform payments consumed a larger share of stated fees than management had assumed, and no negotiation had occurred at any renewal since 2019.
  4. Two competing managers of similar size had already filed exchange traded share class applications, and advisers were beginning to ask about them directly.
CLIENT PROFILE
A mid-sized North American mutual fund manager with reported management and distribution fee revenue of 340 million dollars (client-reported, unverified by MMA). Roughly 68% of revenue came from active equity funds recording steady outflows. No target date default positions existed on any large plan and no exchange traded share class filing had yet been prepared or scoped internally.
STRATEGIC CHALLENGE
Active equity assets had declined for six consecutive years while the fee rate held, which flattered reported margin and concealed a shrinking base. Management proposed increasing marketing spend to reverse the outflows. That addressed a flow direction no manager anywhere has reversed with marketing, while leaving the distribution position and product structure entirely unchanged.
MMA APPROACH
MMA analysed revenue by fee rate against flow direction, separating the shrinking high-fee base from the growing low-fee one. Twenty-four expert interviews with plan consultants, recordkeepers, advisory platform heads and competing managers established how allocation decisions are actually made now. The analysis treated default status pursuit and structure conversion as the routes genuinely available forward.
KEY FINDINGS
  1. Active equity revenue was declining at roughly the same rate as assets, and the stable fee rate had concealed that decline in every internal report produced.
  2. Plan consultants interviewed said the manager was absent from default target date consideration entirely, and none had been approached about it in three years.
  3. Platform payments consumed a larger share of stated fees than management had assumed, and no negotiation had occurred at any renewal since 2019.
  4. Two competing managers of similar size had already filed exchange traded share class applications, and advisers were beginning to ask about them directly.
RECOMMENDED STRATEGY
Phase 1: Phase one: prepare exchange traded share class filings immediately, since competitors have filed and advisers are already asking about them. Phase 2: Phase two: approach plan consultants about target date default consideration, since the manager is currently absent from that process entirely. Phase 3: Phase three: reopen platform payment negotiations at renewal rather than accepting terms unchanged for a seventh consecutive year running now.
OUTCOME
Exchange traded share class filings were prepared and submitted within the year (client-reported, unverified by MMA). Consultant conversations opened on two target date searches. Platform terms improved modestly at one renewal. The marketing increase was cancelled, having proposed reversing a flow direction that no manager in this industry has ever reversed.

Frequently Asked Questions

Foundational context covering the market sizes, CAGR, scope, country, region and competition that inform every finding below. This section is provided to cover basics and most often pre-purchase conversations, answered from the MMA Primary Research Dataset.

What is the current size of the North America Mutual Fund Market?

The market was worth 104.0 billion dollars in management and distribution fee revenue in 2025, across index, money market, target date, fixed income, active equity and specialty funds. It reaches 108.58 billion dollars in 2026.

How large will the North America Mutual Fund Market be by 2036?

MMA forecasts 167.01 billion dollars by 2036, an increase of 58.43 billion dollars over the 2026 base. That represents an expansion multiple of 1.54 times across the forecast period.

What is the CAGR for the North America Mutual Fund Market 2026 to 2036?

The base case compounds at 4.4% annually. The bull case reaches 5.6% if markets cooperate and money market balances hold, while the bear case sits at 3.2% on accelerating fee compression.

Which segment is growing fastest?

Index and passive equity funds, at 6.6%, half again the market rate of 4.4%. They absorb essentially every dollar of net inflow while charging around 0.05%.

Who are the major companies in the North America Mutual Fund Market?

Vanguard, BlackRock, Fidelity Investments and Capital Group lead on disclosed fee revenue. Concentration is considerably higher in passive products, where operating at all requires genuinely enormous scale.

Which country is growing fastest?

Australia at 6.4%, as superannuation funds outgrow domestic markets and allocate substantial mandates toward North American managers at institutional pricing levels well below any retail equivalent.

Report Segmentation Architecture

The full report scope spans multiple orthogonal segmentation dimensions, with cross-tabulated demand data provided for each dimension pair. Coverage extends further to regional breakdowns, trend trajectories, and the competitive detail needed to support segment-level decision-making.

By Fund Category

  • Index and Passive Equity Funds
  • Money Market Funds
  • Target Date and Allocation Funds
  • Fixed Income Funds
  • Active Equity Funds
  • Specialty and Alternative Strategy Funds

By End-Use Industry

  • Workplace Retirement Plans
  • Individual Retirement Accounts
  • Taxable Retail Brokerage
  • Registered Investment Adviser Portfolios
  • Insurance Variable Products
  • Institutional and Endowment Mandates

By Commercial Dimension

  • Recordkeeper Platform Placement
  • Advisory Approved List Inclusion
  • Direct Investor Distribution
  • Model Portfolio Allocation
  • Plan Default Option Selection
  • Cross-Border Fund Range Registration

By Region

  • North America
  • Western Europe
  • East Asia
  • South Asia and Pacific
  • Latin America
  • Middle East and Africa
  • Eastern Europe

Scope, Methodology, and Coverage

Every figure in this report is reproducible from documented input assumptions. The scope below maps the historical period, the forecast horizon, the segmentation dimensions, and the countries covered, alongside the underlying primary and qualitative methodology.
Historical Period
2020 to 2025
Forecast Period
2026 to 2036
Base Year
2025 (USD billions; MMA Primary Research Dataset, August 2026)
Market Definition
Scope covers management and distribution fee revenue earned by mutual fund providers across the United States and Canada, spanning index and passive equity funds, money market funds, target date and allocation funds, fixed income funds, active equity funds, and specialty and alternative strategy funds. Revenue is measured as management fees together with distribution and service fees retained by the fund manager after platform payments and revenue sharing. Exchange traded fund revenue reported as a separate product line, separately managed accounts, collective investment trusts, private fund and hedge fund management fees, brokerage commissions earned by intermediaries, custody transfer agency and fund administration revenue earned by service providers, and insurance product wrapper charges are excluded from the market size and all derived figures.
Quantitative Units
USD billions of fee revenue (current prices); assets under management in USD trillions; asset-weighted expense ratio as percentage; retained fee share as percentage of stated charge; net flows in USD billions
Segmentation Dimensions
By Fund Category; By End-Use Industry; By Commercial Dimension; By Region
Regions Covered
North America, Western Europe, East Asia, South Asia and Pacific, Latin America, Middle East and Africa, Eastern Europe
Countries Covered
USA, Canada, with outward mandate analysis across Australia, Japan, UK, Netherlands, South Korea, Switzerland, Chile, Mexico, Saudi Arabia, UAE, Germany, Singapore, Denmark
Key Companies Profiled
Vanguard, BlackRock, Fidelity Investments, Capital Group, T. Rowe Price, State Street Global Advisors, JPMorgan Asset Management, Invesco, Franklin Templeton, Charles Schwab Investment Management, Dimensional Fund Advisors, PIMCO, Federated Hermes, American Century Investments, Janus Henderson, MFS Investment Management, Nuveen, RBC Global Asset Management, TD Asset Management, CI Global Asset Management
Quantitative Methodology
Primary survey, n=3,800 respondents, Q4 2025, six countries; demand-side model with trade association cross-validation
Qualitative Methodology
47 expert interviews, Q4 2025; applied to validate demand model assumptions, identify emerging dynamics, and assess competitive positioning
Report Format
PDF and XLSX data workbook (Word format preview document)
Publisher
Market Minds Advisory
Report Code
MMA-2026-TEC-281
Published
August 2026
Contact
sales@marketmindsadvisory.com | www.marketmindsadvisory.com

Purchase the full North America Mutual Fund Market Report (2026 to 2036).

The full report runs to 190 pages and covers all six fund categories, seven regions and 20 profiled managers in detail. It includes the complete segment CAGR set, fee rate decline modelled against asset growth across two decades, and retained fee analysis separating stated charges from what managers actually receive. Company profiles carry evaluation on disclosed mutual fund management and distribution fee revenue, with moat and risk assessment for the top five managers. The competitive section extends to 15 tracked regulatory, product and distribution developments across 2024 and 2025. Primary research inputs include a quantitative survey of 3,800 respondents and 47 expert interviews conducted in Q4 2025.
Six fund categories with individual CAGR forecasts
Seven regions covering domestic revenue and outward mandates
Twenty manager profiles on consistent fee revenue basis
Fifteen tracked regulatory and distribution developments with commercial interpretation
Fee rate decline modelled against asset growth across two decades
Retained fee share separated from stated expense ratios throughout

Built For The People Who Decide

From boardroom strategy to bench-side execution, this report is read cover-to-cover by leaders shaping the next decade of their industry, turning demand scenarios, market dynamics and valuation benchmarks into decisions.
CXOs/ Presidents/ VPs/ Managers
M&A and Corporate Development
Strategy Teams and R&D Heads
Procurement and Product Directors
Regulatory and Compliance Leaders
Investor Relations and Equity Analysts