Market Minds Advisory
North America Ground Handling System Market

North America Ground Handling System Market: North America Ground Handling Systems: Electrification Without Power and the Ownership Mismatch

Airports can buy electric tugs far faster than they can energise them, and the switchgear behind the apron often costs several times the vehicles while belonging to nobody's product line.

Lead Analyst

Published

September 2026

Make Smarter Decisions with Customized Research Insights

Request a free sample report and evaluate market opportunities, growth trends, and competitive dynamics relevant to your business needs.

2025 MARKET VALUE$5.6BMarket Size 2025
2036 FORECAST VALUE$12.3BBase Case , 2026 to 2036
CAGR 2026 TO 20367.4 %Bull 8.7% / Bear 6.2%
INCREMENTAL OPPORTUNITY$6.3BNet 10- year value creation
EXPANSION MULTIPLE2.05x2036 value over 2026 base
Strategic Levers
M&A Pipeline
Regional Outlook
Country Rankings
Competitive Intelligence
Segmental Deep-dive
Call-Us : 91 93563 13602

Executive Snapshot and Market Trajectory.

Airports can buy electric tugs faster than they can energise them. The vehicle is the easy part; the switchgear, feeders and apron charging capacity behind it take years and permits, and they frequently cost several times what the equipment itself did. Nobody sells that as a product at all.
The other thing nobody sells is a solution to the ownership mismatch. Handlers run on thin margins with contracts of two to five years, while equipment lasts fifteen or twenty, so buying assets for work you may lose is a poor bet. Apron charging and electrification infrastructure grows fastest at 11.1%, half again the market rate of 7.4%, and from a small base.
The supplier field is fragmented, with five firms holding 44%, because tugs, loaders, de-icers, baggage systems and charging infrastructure come from five different manufacturing traditions. What has changed is who owns the asset. Airports and leasing companies increasingly buy the equipment and pool it, which shifts the customer from a handler counting pennies to an airport with a twenty-year balance sheet, and that is a completely different sale, made to a completely different buyer.
Market Definition
This report covers ground support equipment and ground handling systems procured for commercial airports across North America. Scope includes aircraft movement and towing equipment, loading and cargo handling equipment, aircraft servicing vehicles, de-icing and weather response equipment, baggage handling systems, and apron charging with electrification infrastructure. Excluded are airfield lighting and navigation systems, terminal buildings and civil construction, passenger screening equipment, aircraft maintenance tooling, fuel farms and hydrant systems, and ground handling labour services sold as a contract.
Base Year Value
$5.6B in 2025 (MMA Primary Research Dataset, September 2026)
Forecast Period
2026 to 2036, eleven discrete annual values
CAGR
7.4% base case. Bull 8.7%. Bear 6.2%.
Fastest Growth Segment
Apron Charging And Electrification Infrastructure: 11.1% CAGR
Fastest Growth Country
Mexico: 9.8% CAGR
Fastest Growth Region
South Asia and Pacific: 9.4% CAGR
Largest Region
North America: 42% of 2025 global value
Market Leaders
JBT Corporation, Textron GSE, TLD Group, Vestergaard Company, Mallaghan. Source: MMA Analysis based on unit shipments and contracted programme value, July 2026.
Primary Survey
n=3,800 procurement and R&D decision-makers, Q4 2025, six countries
Methodology
Demand-side build-up, cross-validated against public data, 47 expert interviews

North America Ground Handling System Market Forecast Scenarios

north-america-ground-handling-system-market-size-forecast-scenario-1790026415721
Growth averaged 6.1% across 2020 to 2025 and the period contained two opposite halves. Equipment purchasing collapsed in 2020 as handlers cut capital spending to survive, then recovered sharply from 2022 as traffic returned to apron fleets that had aged two years without replacement. Labour shortage during the recovery pushed wages up permanently and made headcount-reducing equipment commercially interesting for the first time.
Base case growth of 7.4% rests on three mechanisms. Emissions regulation at state and airport level requires fleet conversion to electric equipment on dated timelines that operators cannot negotiate away. Ownership is shifting from handlers toward airports and leasing companies, which have balance sheets that match equipment life and therefore buy more readily. And airport terminal expansion across the region brings baggage handling and apron infrastructure content with every project commissioned.
The bull case at 8.7% assumes apron electrical capacity is delivered fast enough to keep pace with vehicle conversion mandates rather than lagging them. The bear case at 6.2% follows from the opposite and more likely risk: charging infrastructure lags, airports seek deadline extensions, conversion slows to the rate switchgear can be installed, and equipment purchases follow that constraint rather than regulation.

Vehicles Are Easy, Power Is Not

Electrification is the dominant force here and the vehicles are the least of it. Emissions regulation at state and airport level sets conversion deadlines that operators cannot negotiate, and electric equipment is available across most categories. What is not available at the same pace is apron electrical capacity: switchgear, feeders and charging positions run around 3.4 times vehicle cost and need utility coordination, permitting and construction on live aprons.
FIVE-FIRM CONCENTRATION44%Five separate manufacturing traditions keep this field fragmented
AVERAGE ELECTRIC TUG PRICEUSD 178kBattery electric pushback unit before any charging infrastructure
INFRASTRUCTURE COST MULTIPLE3.4 timesApron electrical works against the vehicles they actually serve
HANDLER CONTRACT DURATION3.2 yearsAverage term against equipment life measured in decades
AIRPORT OWNED FLEET SHARE38%Regional ground equipment owned by airports rather than handlers
ELECTRIC FLEET PENETRATION27%Share of regional apron equipment now battery electric
The ownership mismatch shapes who actually buys. Ground handlers operate on famously thin margins with contracts averaging around 3.2 years, while apron equipment lasts fifteen to twenty, so a handler buying assets for work it may lose at the next tender is making a poor bet. Airports and leasing companies have stepped in, and roughly 38% of regional equipment is now airport-owned and pooled across handlers.
That shift changes the customer entirely. A handler evaluates equipment on purchase price and immediate operating cost because its contract horizon is short and its margin is thin. An airport evaluates on twenty-year total cost, emissions compliance, pooling utilisation and residual value, and it can fund infrastructure that no handler would contemplate. Suppliers still selling to handlers on price are calling on the wrong buyer.
"Every airport has an electrification target and a fleet plan. Ask when the utility can deliver the feeder to the apron and you find out what the plan is actually worth."
Director, Airport Operations and Ground Systems Practice · MMA Aviation Services / Airport Ground Support Equipment Practice · September 2026

Market Trends

Apron Electrical Capacity Becomes The Binding Conversion Constraint

Battery electric ground equipment is available across nearly every category, but converting a fleet requires charging positions, feeders, transformers and switchgear on aprons that were never designed to distribute that much power. Infrastructure runs around 3.4 times vehicle cost and needs utility coordination, permitting and construction around live aircraft operations. Airports meeting conversion deadlines are those that started electrical works before ordering vehicles, and the ones that ordered first are now parking equipment they cannot charge properly. Sequencing decides whether a conversion programme works or embarrasses somebody publicly later on.
Market Impact: Covers 41,000 regional equipment units
Equipment Ownership Migrates From Handlers To Airports

Ground handlers cannot rationally fund fifteen-year assets against contracts averaging 3.2 years, and airports have concluded that pooled equipment they own serves them better than a handler fleet that leaves when the contract does. Roughly 38% of regional equipment is now airport-owned, with leasing companies taking a further share. The commercial consequence for suppliers is a different buyer entirely: longer evaluation horizons, total cost analysis, infrastructure funding capability and considerably more purchasing sophistication than handlers ever brought. Longer evaluation horizons change which equipment actually wins any of these decisions at all.
Market Impact: Wages have risen roughly 34%

Market Opportunities and Growth Drivers

State And Airport Emissions Rules Set Non-Negotiable Conversion Deadlines

Californian regulation and individual airport requirements across the region impose dated targets for zero-emission ground support equipment, and operators cannot negotiate their way past a compliance deadline the way they can defer a discretionary upgrade. That converts fleet replacement from a capital decision into an obligation, which is the strongest demand driver any equipment market can have. Conversion covers every category from tugs to belt loaders and cargo handling. Around 41,000 regional units fall within announced conversion requirements. Demand of this kind does not respond to economic conditions in any way.
Market Impact: Delays conversion by 26 months

Labour Cost Escalation Makes Headcount Reduction Commercially Viable

Ground handling wages rose sharply from 2021 and have not returned, which changed the arithmetic on equipment that reduces the number of people required on a turnaround. Autonomous and remotely operated baggage tractors, powered loaders and automated baggage systems all become defensible on labour saving where they previously did not. Handlers running on thin margins now have a genuine payback case for the first time. Regional ground handling wages have risen roughly 34% since 2021 across major hubs. Equipment that removes a person from every turnaround now pays for itself properly.
Market Impact: Contracts average only 3.2 years

Market Restraints and Challenges

Utility And Permitting Timelines Govern Electrification Pace

Apron electrical works require utility capacity studies, permitting and construction around live aircraft operations, and the timelines involved sit outside airport control entirely. The root cause is that apron power distribution was designed for lighting and a few ground power units rather than for charging hundreds of vehicles overnight. Commercially this means equipment demand follows infrastructure delivery rather than regulatory deadlines. Participants are responding with mobile and battery-buffered charging, opportunity charging during turnarounds, and phased conversion sequencing built around electrical capacity rather than fleet age. Regulation sets the deadline; the utility sets the pace.
Market Impact: Infrastructure costs 3.4 times vehicles

Handler Margins Cannot Support Equipment Capital Requirements

Ground handling operates at low single-digit margins against contracts averaging around 3.2 years, while apron equipment lasts fifteen to twenty years, so a handler funding assets carries residual risk it cannot price into a competitive tender. The root cause is a procurement model that competes handling contracts far more frequently than equipment lifecycles permit. Commercially this suppresses handler purchasing regardless of equipment merit. The market is answering through airport-owned pooled fleets, equipment leasing structured to contract terms, and suppliers offering usage-based commercial arrangements. Residual risk cannot be priced into a competitive tender.
Market Impact: Airports own 38% of equipment
4 additional market trends, 3 additional growth drivers, and 2 additional restraints and challenges are covered in the full report. Contact sales@marketmindsadvisory.com to access the complete intelligence.

Segment CAGR and Growth Architecture

Equipment is segmented here by category, because category determines the manufacturing tradition behind it, the airport function that specifies it and the conversion pathway it follows. Mixing category with airport size or handler type produces groups no procurement recognises. Six categories cover the field from baggage systems through to apron electrification infrastructure, and their conversion economics differ sharply.
north-america-ground-handling-system-market-market-share-analysis-1790026416307

Apron Charging And Electrification Infrastructure

Growing at 11.1%, half again the market rate of 7.4%, this category barely registered five years ago and now represents the binding constraint on everything else in the market. Charging positions, feeders, transformers, switchgear and energy management run around 3.4 times the cost of the vehicles they serve, and the work happens on live aprons with utility coordination and permitting attached. The supplier field here comes from electrical contracting and power distribution rather than from ground equipment manufacture, which means the firms growing fastest in this market are not the ones who have historically served it at all. The firms growing fastest here have never sold a tug in their lives.
CAGR 11.1%

Aircraft Movement And Towing Equipment

Towing and pushback equipment grows at 8.4%, ahead of the market, because it sits at the front of every conversion programme. Tugs are high-utilisation, high-emission units operating close to terminals, which makes them the first category airports convert and the most visible evidence of a fleet programme. Electric pushback units cost materially more than diesel equivalents at purchase and considerably less to run, which suits an airport balance sheet far better than a handler's. Autonomous and remotely operated variants are also furthest advanced here, driven by the wage escalation that made headcount reduction defensible for the first time. Visibility makes this the category almost every conversion programme starts with first of all.
CAGR 8.4%
Full segment breakdown across 6 segments available in the complete report.

Regional Architecture and Country Demand Map

This is a region-scoped report, so the regional table records where the equipment and systems serving North American airports are manufactured rather than where demand sits. Domestic and European manufacture split most of the supply, reflecting two separate industrial traditions that have served this market for decades.

North America

At 42%, above the 22 to 32% band applied elsewhere in this report, domestic manufacture leads on a mixture of proximity, service network depth and long-standing airline relationships. United States producers hold strong positions in loaders, cargo handling, towing equipment and boarding bridges, and service response matters enormously when a failed loader delays departures. Canadian manufacture contributes de-icing and cold weather equipment where the operating environment created genuine specialist capability. Growth of 7.6% sits above the regional market rate, helped by electrification programmes favouring suppliers who can support conversion locally rather than from overseas. Service response matters enormously when a failed loader is delaying departures on a schedule nobody can recover.
Share: 42% | CAGR: 7.6% (2026 to 2036)

Western Europe

At 33%, above the 18 to 26% band used elsewhere, European manufacture holds positions that domestic producers have never seriously contested. French, Danish, Irish and Italian firms lead in towing equipment, de-icing, catering vehicles and passenger steps, in several cases supplying a majority of regional units in their categories. Dutch and German suppliers dominate baggage handling systems almost entirely. European electrification capability also arrived earlier, driven by tighter airport emissions requirements at home. Growth of 6.0% trails the regional market rate, as domestic suppliers gain ground on service response during conversion programmes that require local support. Several categories here are supplied almost entirely from Europe with no domestic alternative offered at all.
Share: 33% | CAGR: 6.0% (2026 to 2036)
Regional intelligence for 5 additional markets available in the complete report: East Asia, South Asia and Pacific, Middle East and Africa, Eastern Europe, Latin America. Contact sales@marketmindsadvisory.com.
north-america-ground-handling-system-market-country-cagr-analysis-1790026416827

Where Ground Equipment Suppliers Earn Margin

Unit prices are the visible number in this market and a poor guide to returns. Infrastructure scope, service network depth and commercial model choice decide economics instead. The four levers below reflect positions suppliers have used to improve results measurably rather than to win unit volume. The buyer has changed, and most pricing has not.

Sell The Charging Infrastructure With The Vehicles

Apron electrical works run around 3.4 times vehicle cost and currently go to electrical contractors with no relationship to the equipment supplier. Suppliers offering the infrastructure alongside the fleet capture a far larger share of a conversion programme and control the sequencing that decides whether vehicles arrive before they can be charged. Participants bundling infrastructure report programme value roughly 2.9 times equipment-only scope. The capability required is electrical engineering and contracting rather than vehicle manufacture, which usually means partnership or acquisition. Partnership or acquisition is usually the only realistic route available.
Market Impact: Programme value rises roughly 2.9 times higher overall

Sell To Airports, Not To Handlers

Roughly 38% of regional equipment is now airport-owned and the share is rising, because airports have balance sheets matching equipment life while handlers hold contracts averaging 3.2 years. Airports evaluate on twenty-year total cost, emissions compliance and pooling utilisation rather than on purchase price, which rewards better equipment and supports higher pricing. Suppliers selling primarily to airports report realised prices roughly 18% above those selling the same units to handlers, and considerably longer relationships as well. Sales organisations built for handler operations managers are calling on the wrong people entirely now.
Market Impact: Realised equipment prices run roughly 18% higher overall

Build Service Response Into The Sale

A failed loader or tug delays aircraft, and delay costs an airline far more than the equipment is worth, so response time dominates operator evaluation once a supplier clears the technical threshold. Suppliers with local parts and technician coverage win competitions that cheaper imported equipment loses outright, and they hold service contract pricing that remote suppliers cannot approach. Regional coverage delivers service revenue roughly 2.4 times that of suppliers serving from a central facility elsewhere. Coverage must precede the revenue that justifies it, which is exactly what keeps importers out.
Market Impact: Service revenue runs roughly 2.4 times higher overall

Offer Usage-Based Commercial Arrangements To Handlers

Handlers cannot fund fifteen-year assets against three-year contracts, but they can pay per turnaround or per operating hour, which matches cost to the revenue the equipment actually generates. Suppliers offering usage-based arrangements reach handler demand that capital sales simply cannot access, and the arrangements produce recurring revenue at better margin than outright sale. Participants offering them report handler segment revenue roughly 41% above competitors selling only capital equipment into the same accounts. It requires a balance sheet willing to hold the asset, which is precisely what the handler could not do.
Market Impact: Handler segment revenue rises roughly 41% higher overall

Who Controls the Margin Pool

Concentration is low at 44% for the top five, measured on unit shipments and contracted programme value, the basis used throughout this section. Fragmentation is a consequence of manufacturing history rather than competitive dynamics: tugs, loaders, de-icers, baggage systems and electrical infrastructure descend from five unrelated engineering traditions, and no supplier holds credible capability across more than two or three of them.
Competition currently turns on three dimensions. Infrastructure capability decides who can serve a conversion programme rather than merely supply vehicles into one. Service network depth decides who wins where a failed unit delays aircraft, which is everywhere. And commercial model flexibility decides who can reach handlers whose balance sheets cannot support capital purchase. Unit price still matters, but it decides fewer competitions than it did.

Positions will shift through infrastructure and through ownership. The firms growing fastest in this market are electrical contractors and power distribution specialists who have never sold ground equipment, and they are entering from the side rather than competing head-on. Meanwhile the migration of ownership toward airports rewards suppliers who can sell a twenty-year total cost argument, which is not a capability most ground equipment sales organisations have ever needed.
north-america-ground-handling-system-market-company-positioning-matrix-1790026417353

Competitive Moat and Risk Dimensions

JBT CORPORATION

Moat: Breadth Across Equipment Categories

JBT covers more ground support equipment categories than most competitors, which matters increasingly as airports move toward pooled fleets and prefer fewer supplier relationships across a conversion programme. Breadth also spreads service network cost across a wider installed base, giving the firm better response economics than single-category specialists operating the same geographic coverage.
JBT CORPORATION

Risk: Limited Electrical Infrastructure Capability

The fastest-growing part of this market is apron electrical infrastructure at roughly 3.4 times vehicle cost, and that work sits with electrical contractors rather than equipment manufacturers. Entering it means capability in power distribution engineering and construction contracting, which has almost nothing in common with building vehicles and is not acquired quickly.
TLD GROUP

Moat: Early Electrification Product Depth

TLD moved into electric ground equipment earlier than most competitors, driven by European airport emissions requirements that arrived ahead of North American ones, and it holds product depth across categories that conversion programmes need simultaneously. That head start matters when an airport is converting a whole fleet rather than replacing individual units as they age.
TLD GROUP

Risk: North American Service Coverage Gap

Service response decides competitions in this market because a failed unit delays aircraft, and a European manufacturer supporting North American operators faces parts logistics and technician coverage that domestic competitors provide more readily. Building equivalent coverage is expensive and must precede the revenue that justifies it, which is a difficult sequence to fund.

Players Tracked

Prominent Players

JBT Corporation
Textron GSE
TLD Group
Vestergaard Company
Mallaghan

Other Key Players

Oshkosh AeroTech
Cavotec
ADB SAFEGATE
Vanderlande
BEUMER Group
Daifuku
Alstef Group
Charlatte Manutention
Aviogei
Goldhofer
Kalmar Motor
Guangtai Airports Equipment
Aero Specialties
Tronair
Shenzhen CIMC-Tianda

Recent Developments

MARCH 2025

Major hub delays electrification targets citing apron electrical capacity

A large North American hub airport revised its ground equipment electrification timeline, citing utility capacity and permitting rather than vehicle availability as the limiting factor. This was an operational and regulatory adjustment rather than any corporate transaction, and it confirms infrastructure as the binding constraint across the region.
Signal: Infrastructure rather than vehicle supply now sets the pace of every conversion programme across the whole region
SEPTEMBER 2024

Airport authority takes ownership of pooled ground equipment fleet

A North American airport authority purchased and pooled ground support equipment previously owned by its handling contractors, making it available to all handlers operating on the field. This was an asset acquisition and operating model change rather than a corporate merger, and it shifts the purchasing customer decisively.
Signal: Airport ownership replaces a price-sensitive handler with a buyer evaluating twenty-year total cost of ownership instead
JANUARY 2025

Equipment manufacturer partners with electrical contractor on conversion programmes

A ground support equipment manufacturer formed a commercial partnership with an electrical infrastructure contractor to bid complete apron conversion programmes rather than vehicle supply alone. The arrangement was a partnership rather than a merger, and it acknowledges that neither party holds the other's capability internally at all.
Signal: Partnership rather than acquisition suggests equipment makers know how far electrical contracting sits from building vehicles themselves

What Sets Delivered Equipment Cost

Four inputs dominate. Steel and aluminium fabrication runs roughly 24% of delivered equipment cost, battery packs and electric drivetrains about 29% on converted units, hydraulics and mechanical systems close to 18%, and assembly with testing labour the remaining 29%. Steel and aluminium are regionally sourced under trade arrangements, while battery cells and drivetrain components originate overwhelmingly in East Asia regardless of where equipment is assembled.
Two movements ran in opposite directions. Cell pricing declined steadily through the period, with IEA battery price data showing the trend, which improved electric equipment economics against diesel. Meanwhile North American steel and aluminium pricing rose with energy costs and trade measures, as EIA industrial energy data shows. JBT and Oshkosh both discussed input cost and supply conditions in annual reporting. Net cost on electric units improved while diesel equivalents did not.

Exposure separates by how far a supplier has converted its range. Manufacturers weighted toward diesel equipment carry steel, engine and hydraulic cost with no offsetting improvement, while those weighted toward electric benefit from falling cell prices on a rising share of their output. That asymmetry compounds, because electrification mandates are shrinking the addressable market for exactly the equipment whose costs are not improving.
north-america-ground-handling-system-market-cost-volatility-analysis-1790026417550

Contract cell supply on multi-year terms during price decline

Cell prices have fallen steadily, which tempts buyers into spot purchasing, but availability during conversion surges matters more than the last few percent. Multi-year agreements secured allocation for suppliers signing them while competitors chased declining spot rates and then queued. Commitment risk is real given how fast timelines move, though mandate-driven demand visibility is better here than in most markets.

Convert the product range faster than mandates require

Diesel equipment carries rising input costs into a shrinking addressable market, which is the worst combination available. Converting the range ahead of mandate deadlines shifts cost exposure onto falling cell prices and captures early conversion demand simultaneously. The constraint is engineering capacity, since converting properly means redesign rather than fitting a battery where the engine was.

Source fabrication regionally to limit trade measure exposure

Steel and aluminium pricing in North America carries trade measure effects that fluctuate with policy rather than markets, and imported fabrication has proved an unreliable hedge. Regional fabrication including Mexican capacity limits that exposure while keeping cost competitive under existing trade arrangements. Several suppliers have moved fabrication accordingly, and the shift also shortens lead times that lengthened badly after 2021.

Portfolio Architecture for Margin Defence

Margin architecture here sorts by what a supplier is actually selling. Standard diesel and basic electric units sit at the bottom, competed on price against comparable equipment with many qualified suppliers. Specialist equipment including de-icing, cargo loading and baggage systems sits in the middle, protected by engineering depth and service requirements. Infrastructure scope, service contracts and usage-based arrangements sit at the top, earning without competing on unit price at all.
The volume-versus-premium tension follows the buyer. Volume means selling units to handlers on price, which is a shrinking share of the market and the least profitable part of it. Premium means selling conversion programmes to airports on twenty-year total cost, including infrastructure, service and pooling support. Suppliers organised around unit sales to handlers are calling on a customer type that is becoming less important every year, and most have not restructured for it.

High-value pools concentrate in three places: apron electrical infrastructure at roughly 3.4 times vehicle cost and currently captured by electrical contractors, service contracts where response time rather than price sets the value, and usage-based arrangements reaching handler demand that capital sales cannot access at all.

Volume / Commodity-Adjacent Tier

Standard towing, servicing and basic electric equipment sold to handlers on purchase price against many comparable suppliers. Full material cost exposure with no offsetting content. The eight point range reflects whether a supplier fabricates regionally or imports finished units.
Gross Margin: 14-22%

Premium / Certified Tier

De-icing, cargo loading, baggage handling systems and specialist equipment where engineering depth and service requirements narrow the field. The nine point range tracks regional service coverage, which changes both win rates and the pricing a supplier can hold on the service contract.
Gross Margin: 25-34%

Sustainability / Regulatory / Next-Generation Tier

Apron electrification infrastructure, service and availability contracts, and usage-based commercial arrangements. Priced against the customer's alternative rather than against competing equipment. The seventeen point range spans a contracting business and a service business with different economics.
Gross Margin: 31-48%
north-america-ground-handling-system-market-portfolio-architecture-1790026418053

High-value Sub-segments and Strategic Watch-out

Apron Electrification Infrastructure

Fastest growing at 11.1% and worth roughly 3.4 times the vehicles it serves, currently captured by electrical contractors with no equipment relationship at all. Entering this requires genuine power distribution capability. The fourteen point range reflects how differently design and construction scope are contracted across different airports.
Gross Margin: 32-46%

Service And Availability Contracts

Recurring revenue running roughly 2.4 times higher for suppliers with regional coverage than for those serving centrally, because a failed unit delays aircraft. Response time rather than price sets the value here. The twelve point range reflects how much local coverage a supplier genuinely maintains.
Gross Margin: 34-46%

Aircraft Movement Equipment

The premium volume core, growing at 8.4% as the first category airports convert in any electrification programme. Airports pay roughly 18% above handler pricing for exactly the same units. The nine point range reflects whether autonomous or remotely operated capability is included in the purchase specification.
Gross Margin: 25-34%

Standard Servicing Vehicles

Slowest growing at 5.9% and the most price-competitive part of the market, sold largely to handlers whose margins make purchase price the only real criterion. Chinese and Indian imports compete very hard here on price. The eight point range reflects regional fabrication against fully imported finished equipment.
Gross Margin: 14-22%

What Airports Keep Funding

The annuity in this market is service and availability rather than replacement. Ground equipment operates in a punishing environment on continuous duty cycles, and it fails in ways that delay aircraft, so parts, maintenance and availability contracts recur throughout a fifteen to twenty year life. That recurring revenue typically exceeds the original equipment value, and it accrues to whoever can put a technician on the apron quickly rather than to whoever sold the unit originally.
Adoption depth varies sharply by buyer type. Airport authorities owning pooled fleets run the full relationship, including equipment, infrastructure, service contracts and fleet management systems, and they fund conversion programmes across multiple years. Large handlers buy selectively and maintain equipment themselves where they can. Small regional handlers buy used equipment, defer maintenance and replace only on failure, which is rational given their contract horizons but produces a fleet nobody would design deliberately.

The buyer has changed decisively within five years. Equipment was bought by handler operations managers comparing purchase prices across similar units. It is increasingly bought by airport planning and sustainability functions modelling twenty-year cost, emissions compliance and electrical capacity, and those people ask questions no ground equipment salesperson was ever trained to answer.
north-america-ground-handling-system-market-end-use-penetration-index-1790026418545

Where Suppliers Should Reposition

These are among the four positions where our research anticipates prominent divergence between winners and laggards over the coming forecast period. Each is grounded in the demand model, the regulatory perimeter, and the announced capacity pipeline.
01 / INFRASTRUCTURE SCOPE CAPTURE

Sell the switchgear, not just the tug in front of it

Apron electrical works run around 3.4 times vehicle cost and currently go to electrical contractors who have no relationship with the equipment supplier at all. Suppliers bundling infrastructure with fleet conversion report programme value roughly 2.9 times equipment-only scope, and they control the sequencing that decides whether vehicles arrive before anything can charge them. The capability is power distribution engineering and construction contracting rather than vehicle manufacture, which realistically means partnership or acquisition rather than any internal development at all.
02 / CUSTOMER TYPE MIGRATION

Call on the airport, because the handler cannot buy

Roughly 38% of regional equipment is already airport-owned and that share keeps on rising, because airports hold balance sheets matching fifteen-year assets while handlers hold contracts averaging 3.2 years. Airports evaluate on twenty-year total cost, emissions compliance and pooling utilisation rather than purchase price, and suppliers selling to them realise prices roughly 18% above levels achieved on the same units sold to handlers. Sales organisations built to call on handler operations managers are calling on a customer that is shrinking and impoverished.
03 / SERVICE COVERAGE INVESTMENT

Put technicians where aircraft get delayed, before winning work

A failed loader or tug delays aircraft and delay costs an airline far more than the equipment is worth, which makes response time dominate evaluation once a supplier clears the technical threshold at all. Suppliers with local parts and technician coverage win competitions that cheaper imported equipment loses outright and hold service pricing remote competitors cannot approach, delivering service revenue roughly 2.4 times higher. The coverage must precede the revenue, which is exactly the sequence that keeps most importers out.
04 / COMMERCIAL MODEL FLEXIBILITY

Let handlers pay per turnaround instead of per unit

Handlers cannot rationally fund fifteen-year assets against three-year contracts, but they can pay per turnaround or operating hour, which matches their cost directly to the revenue the equipment actually earns them. Suppliers offering usage-based arrangements report handler segment revenue roughly 41% above competitors selling only capital equipment into the same accounts, and the arrangements also recur at considerably better margin. It requires a balance sheet willing to hold the asset, which is precisely what the handler itself could never do.

Engagement Snapshot From the Field

A live engagement with an industry participant carrying material or product regulatory and market exposure ahead of a defining policy shift, showing how our research translates into a defensible multi-year portfolio strategy.
MARKET MINDS ADVISORY · CLIENT ENGAGEMENT SUMMARY
North America Ground Handling System Producer Strategic Portfolio Review and Transition Roadmap 2026·Investment Scenario on North America Ground Handling System Exposure Evaluation 2025-26
CLIENT PROFILE
A North American ground support equipment manufacturer with roughly USD 340 million in annual revenue (client-reported, unverified by MMA), selling towing and servicing equipment predominantly to ground handling companies. The company had invested heavily in electric product development and had seen disappointing order intake, with several airports running conversion programmes it had not been invited to bid at all.
STRATEGIC CHALLENGE
Management believed the electric products were being outpriced and had prepared a discounting programme. The award data showed something else entirely: airports were procuring conversion programmes including electrical infrastructure as single packages, and the client could not bid because it had no infrastructure capability. The board needed to decide whether to acquire that capability or accept a shrinking role.
MMA APPROACH
MMA analysed regional conversion procurements by package scope, separating vehicle-only awards from bundled infrastructure programmes, and modelled addressable market under three options: vehicles only, partnership with an electrical contractor, and acquisition of one. Expert interviews with airport planning staff established how these packages were being defined and, more importantly, why.
KEY FINDINGS
  1. Bundled conversion programmes including electrical infrastructure accounted for roughly 64% of regional conversion value, and the client had been unable to bid for any of it.
  2. Electrical infrastructure scope within those programmes averaged around 3.4 times the vehicle value, making it the larger half of every package by a wide margin.
  3. Airport buyers evaluated on twenty-year total cost and sequencing certainty, and ranked purchase price fourth or lower in every procurement the analysis reconstructed.
  4. The client's discounting programme would have reduced margin on vehicle-only awards without affecting eligibility for the bundled programmes it was actually losing.
CLIENT PROFILE
A North American ground support equipment manufacturer with roughly USD 340 million in annual revenue (client-reported, unverified by MMA), selling towing and servicing equipment predominantly to ground handling companies. The company had invested heavily in electric product development and had seen disappointing order intake, with several airports running conversion programmes it had not been invited to bid at all.
STRATEGIC CHALLENGE
Management believed the electric products were being outpriced and had prepared a discounting programme. The award data showed something else entirely: airports were procuring conversion programmes including electrical infrastructure as single packages, and the client could not bid because it had no infrastructure capability. The board needed to decide whether to acquire that capability or accept a shrinking role.
MMA APPROACH
MMA analysed regional conversion procurements by package scope, separating vehicle-only awards from bundled infrastructure programmes, and modelled addressable market under three options: vehicles only, partnership with an electrical contractor, and acquisition of one. Expert interviews with airport planning staff established how these packages were being defined and, more importantly, why.
KEY FINDINGS
  1. Bundled conversion programmes including electrical infrastructure accounted for roughly 64% of regional conversion value, and the client had been unable to bid for any of it.
  2. Electrical infrastructure scope within those programmes averaged around 3.4 times the vehicle value, making it the larger half of every package by a wide margin.
  3. Airport buyers evaluated on twenty-year total cost and sequencing certainty, and ranked purchase price fourth or lower in every procurement the analysis reconstructed.
  4. The client's discounting programme would have reduced margin on vehicle-only awards without affecting eligibility for the bundled programmes it was actually losing.
RECOMMENDED STRATEGY
Phase 1: Phase 1 (four months): Cancel the discounting programme and form a partnership with a regional electrical infrastructure contractor to bid bundled packages. Phase 2: Phase 2 (14 months): Rebuild the sales organisation to call on airport planning and sustainability functions rather than handler operations managers. Phase 3: Phase 3 (24 months): Evaluate acquisition of electrical contracting capability once partnership economics and win rates are properly established and understood.
OUTCOME
The client bid four bundled conversion programmes within twelve months, having bid none previously, and won two of them (client-reported, unverified by MMA). Vehicle margins held because the discounting programme was never launched, and the partnership revealed infrastructure economics that reframed the acquisition question entirely.

Frequently Asked Questions

Foundational context covering the market sizes, CAGR, scope, country, region and competition that inform every finding below. This section is provided to cover basics and most often pre-purchase conversations, answered from the MMA Primary Research Dataset.

What is the current size of the North America Ground Handling System Market?

The market was worth USD 5.6 billion in 2025 and reaches USD 6.0 billion in 2026. That covers ground support equipment, baggage handling systems and apron electrification infrastructure across regional commercial airports.

How large will the North America Ground Handling System Market be by 2036?

MMA forecasts USD 12.3 billion by 2036, an increase of USD 6.3 billion over the 2026 base. That represents an expansion multiple of 2.05 times across the forecast period.

What is the CAGR for the North America Ground Handling System Market 2026 to 2036?

The base case CAGR is 7.4%, with a bull case of 8.7% if apron electrical capacity keeps pace with conversion mandates. The bear case of 6.2% assumes infrastructure lags and deadlines slip.

Which segment is growing fastest?

Apron charging and electrification infrastructure grows at 11.1%, half again the market rate of 7.4%. It costs roughly 3.4 times the vehicles it serves and is the binding constraint on every conversion programme.

Who are the major companies in the North America Ground Handling System Market?

JBT Corporation, Textron GSE, TLD Group, Vestergaard Company and Mallaghan lead on unit shipments and contracted programme value. Oshkosh AeroTech, Cavotec and Vanderlande follow in the next tier.

Which country is growing fastest?

Within this region-scoped report, Mexico leads at 9.8%, driven by airport expansion and new terminal construction alongside growing fabrication capacity within regional supply chains. Countries outside North America are assessed only as supply sources.

Report Segmentation Architecture

The full report scope spans multiple orthogonal segmentation dimensions, with cross-tabulated demand data provided for each dimension pair. Coverage extends further to regional breakdowns, trend trajectories, and the competitive detail needed to support segment-level decision-making.

By Equipment Category

  • Aircraft Movement And Towing Equipment
  • Loading And Cargo Handling Equipment
  • Aircraft Servicing Vehicles
  • De-Icing And Weather Response Equipment
  • Baggage Handling Systems
  • Apron Charging And Electrification Infrastructure

By End-Use Industry

  • Airport Authorities And Operators
  • Independent Ground Handling Companies
  • Airline Self-Handling Operations
  • Cargo And Freight Terminal Operators
  • Fixed Base Operators And General Aviation

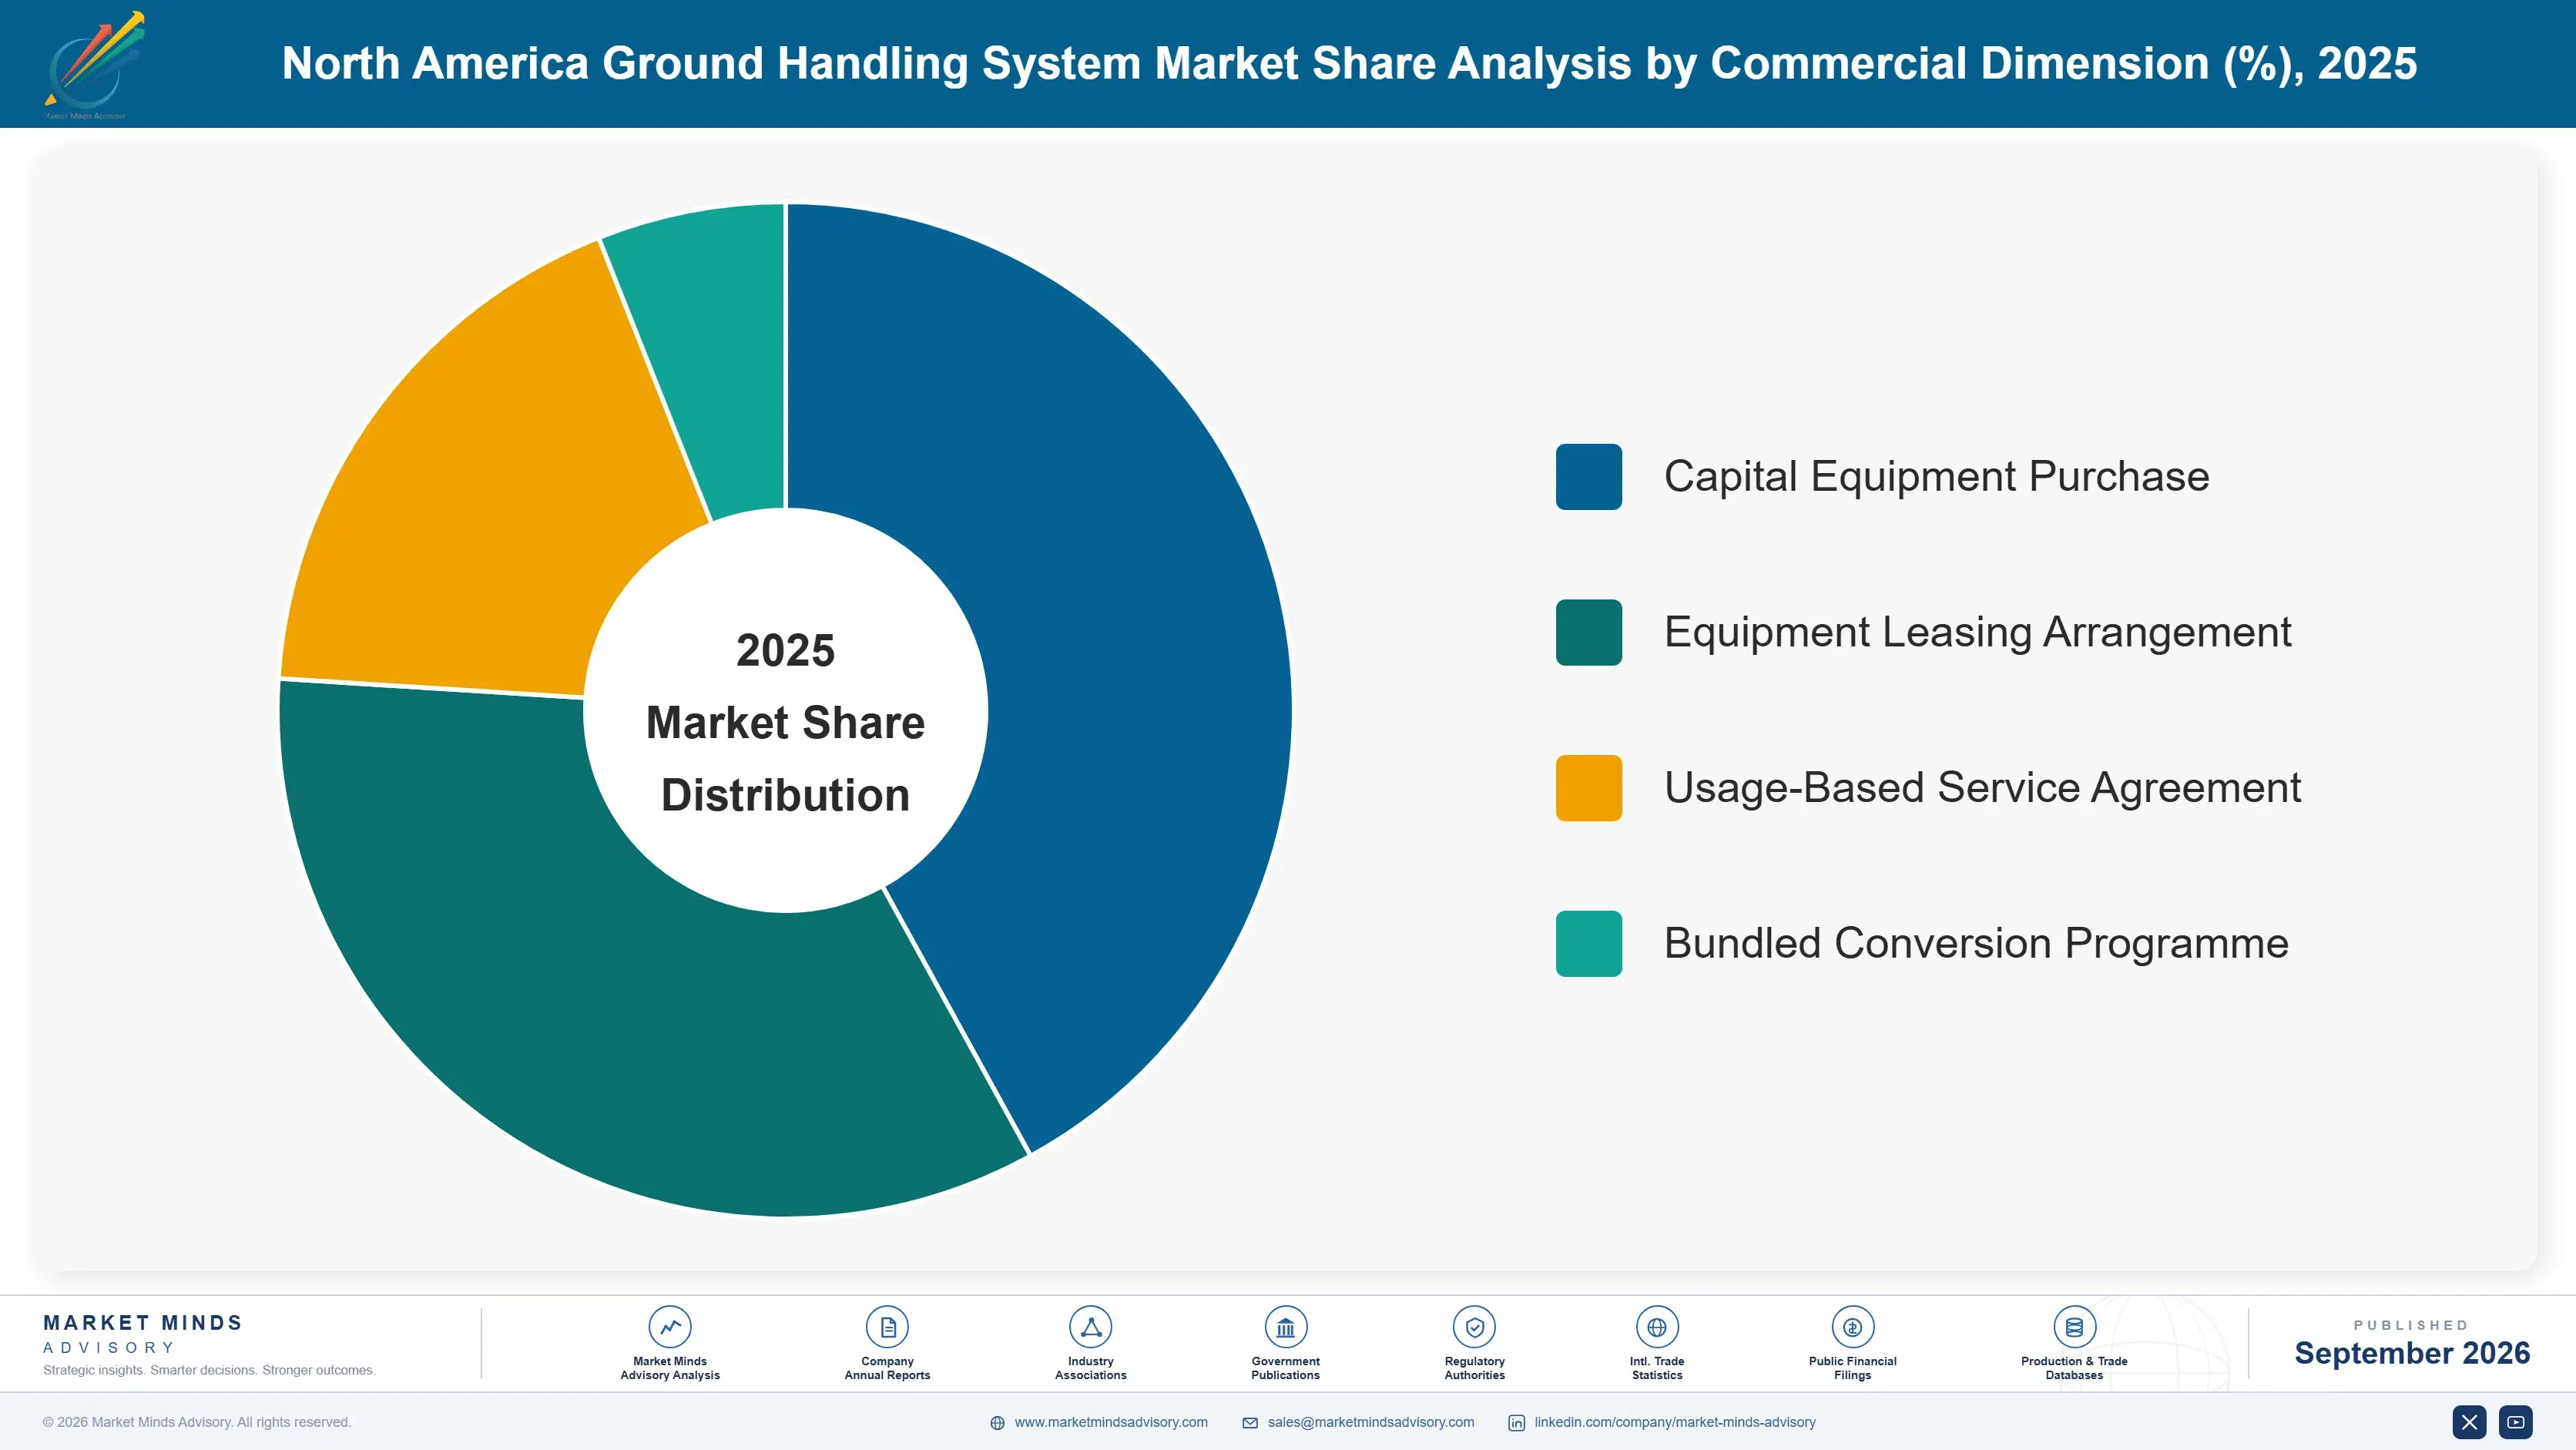
By Commercial Dimension

  • Capital Equipment Purchase
  • Equipment Leasing Arrangement
  • Usage-Based Service Agreement
  • Bundled Conversion Programme

By Region

  • North America
  • Western Europe
  • East Asia
  • South Asia and Pacific
  • Middle East and Africa
  • Eastern Europe
  • Latin America

Scope, Methodology, and Coverage

Every figure in this report is reproducible from documented input assumptions. The scope below maps the historical period, the forecast horizon, the segmentation dimensions, and the countries covered, alongside the underlying primary and qualitative methodology.
Historical Period
2020 to 2025
Forecast Period
2026 to 2036
Base Year
2025 (USD billions; MMA Primary Research Dataset, September 2026)
Market Definition
This report covers ground support equipment and ground handling systems procured for commercial airports across North America. Scope includes aircraft movement and towing equipment, loading and cargo handling equipment, aircraft servicing vehicles, de-icing and weather response equipment, baggage handling systems, and apron charging with electrification infrastructure, together with associated service and availability contracts. Excluded are airfield lighting and navigation systems, terminal buildings and civil construction, passenger screening equipment, aircraft maintenance tooling, fuel farms and hydrant systems, and ground handling labour services.
Quantitative Units
USD billions (current prices); unit shipments; equipment pricing by category; electric fleet penetration
Segmentation Dimensions
By Equipment Category; By End-Use Industry; By Commercial Dimension; By Region
Regions Covered
North America, Western Europe, East Asia, South Asia and Pacific, Middle East and Africa, Eastern Europe, Latin America
Countries Covered
USA, Canada, Mexico, with equipment and component supply origin also assessed across France, Denmark, Ireland, Italy, Netherlands, Germany, Spain, China, Japan, South Korea, India, Australia, Israel, Turkey, Poland, Czech Republic and Brazil
Key Companies Profiled
JBT Corporation, Textron GSE, TLD Group, Vestergaard Company, Mallaghan, Oshkosh AeroTech, Cavotec, ADB SAFEGATE, Vanderlande, BEUMER Group, Daifuku, Alstef Group, Charlatte Manutention, Aviogei, Goldhofer, Kalmar Motor, Guangtai Airports Equipment, Aero Specialties, Tronair, Shenzhen CIMC-Tianda
Quantitative Methodology
Primary survey, n=3,800 respondents, Q4 2025, six countries; demand-side model with trade association cross-validation
Qualitative Methodology
47 expert interviews, Q4 2025; applied to validate demand model assumptions, identify emerging dynamics, and assess competitive positioning
Report Format
PDF and XLSX data workbook (Word format preview document)
Publisher
Market Minds Advisory
Report Code
MMA-2026-CON-921
Published
September 2026
Contact
sales@marketmindsadvisory.com | www.marketmindsadvisory.com

Purchase the full North America Ground Handling System Market Report (2026 to 2036).

The full report sizes the North American ground handling systems market across six equipment categories with unit shipments and pricing behind every figure, and assesses where the equipment serving regional airports is manufactured. It models apron electrical infrastructure explicitly against vehicle demand, because infrastructure costs several times the fleet and determines the pace at which any conversion programme can actually proceed. Competitive analysis covers 20 participants on shipments and contracted programme value, including infrastructure capability and regional service coverage by supplier. Equipment ownership migration from handlers to airports is tracked as the principal change in who buys. Usage-based commercial models are assessed separately from capital sales.
Six-category sizing with shipments and pricing
Apron infrastructure modelled against vehicle demand
Ownership migration from handlers to airports tracked
Service coverage and infrastructure capability by supplier
Usage-based commercial models assessed entirely separately
Conversion mandate timelines mapped by jurisdiction

Built For The People Who Decide

From boardroom strategy to bench-side execution, this report is read cover-to-cover by leaders shaping the next decade of their industry, turning demand scenarios, market dynamics and valuation benchmarks into decisions.
CXOs/ Presidents/ VPs/ Managers
M&A and Corporate Development
Strategy Teams and R&D Heads
Procurement and Product Directors
Regulatory and Compliance Leaders
Investor Relations and Equity Analysts