Market Minds Advisory
North America & Europe Palletizers Market

North America & Europe Palletizers Market: Buying Machines Because Nobody Applies

The brochure payback calculation assumes a labour rate. The actual purchase decision is driven by roles that stay unfilled at any rate, which is a different problem with a different answer entirely.

Lead Analyst

Bilal Shaikh

Published

September 2026

Make Smarter Decisions with Customized Research Insights

Request a free sample report and evaluate market opportunities, growth trends, and competitive dynamics relevant to your business needs.

2025 MARKET VALUE$2.1BMarket Size 2025
2036 FORECAST VALUE$4.6BBase Case , 2026 to 2036
CAGR 2026 TO 20367.2 %Bull 8.4% / Bear 6.0%
INCREMENTAL OPPORTUNITY$2.3BNet 10- year value creation
EXPANSION MULTIPLE2.01x2036 value over 2026 base
Strategic Levers
M&A Pipeline
Regional Outlook
Country Rankings
Competitive Intelligence
Segmental Deep-dive
Call-Us : 91 93563 13602

Executive Snapshot and Market Trajectory

Manual palletizing means lifting a fifteen kilogram case somewhere between two and four thousand times a shift. Across surveyed plants in these two regions, 23% of those positions sit unfilled. You cannot calculate a payback against a person who does not exist, and the industry is slowly catching up.
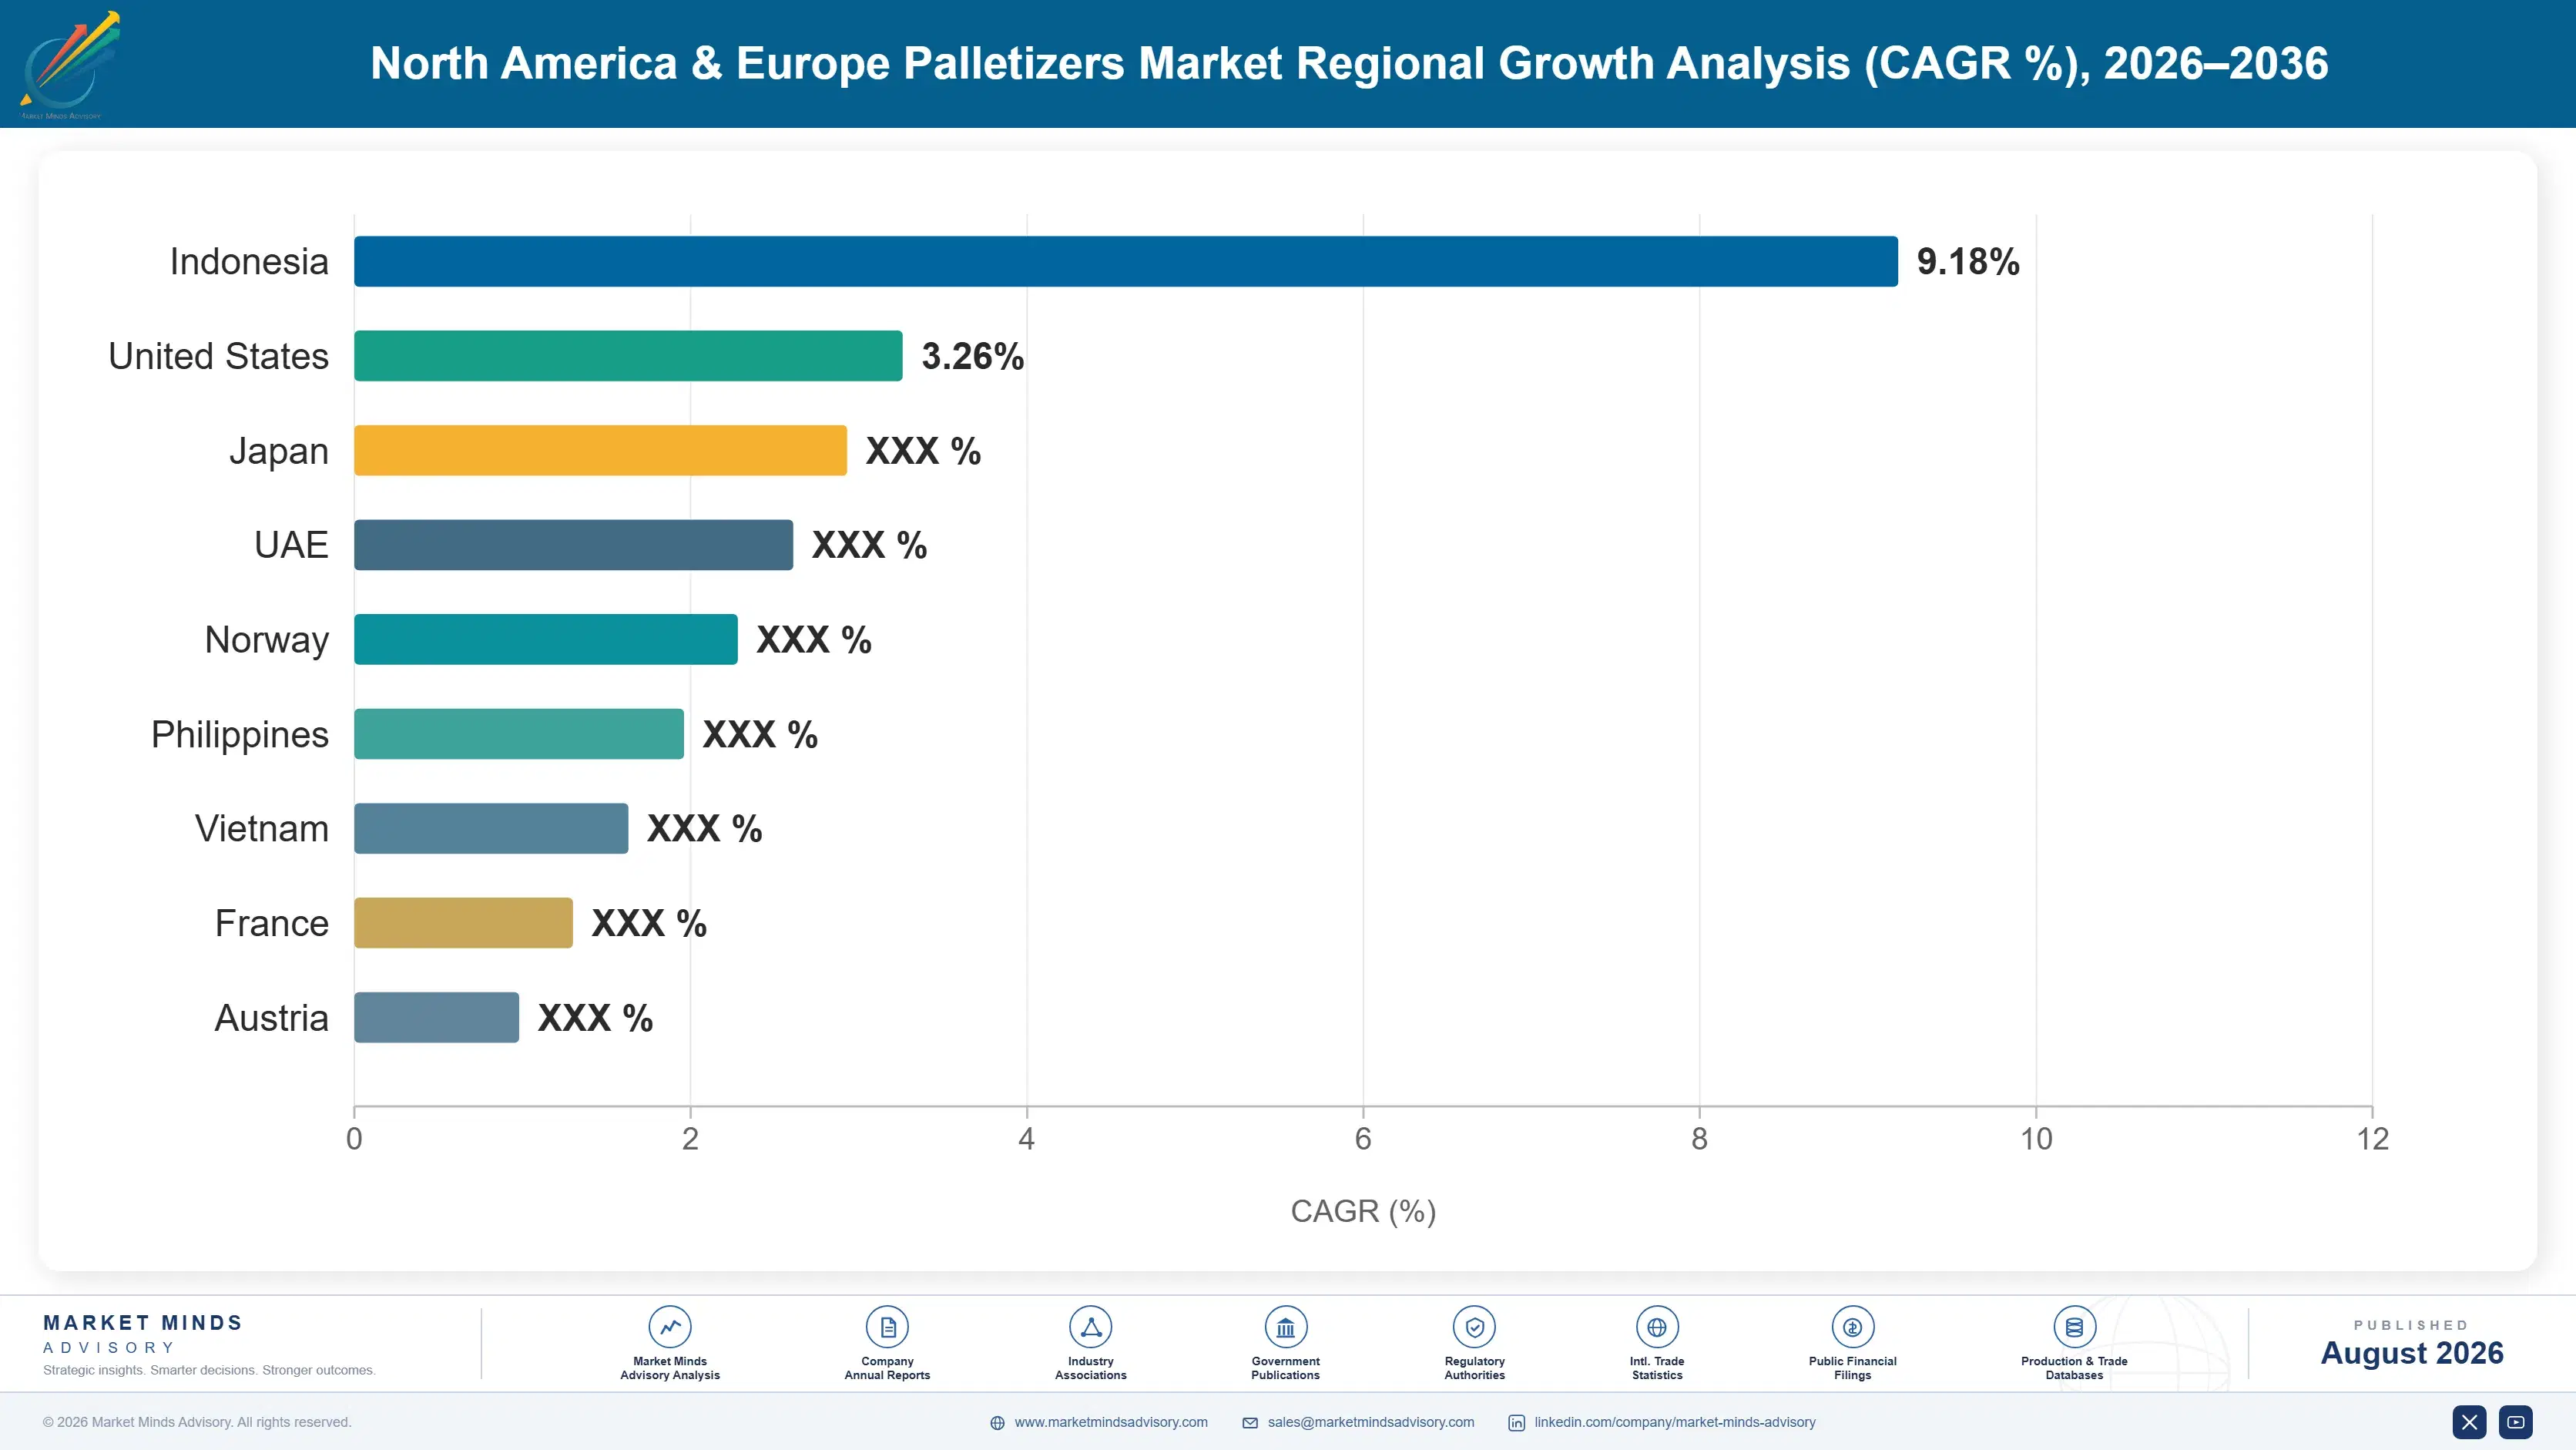
Growth runs at 7.2% across North America and Europe, driven by labour scarcity rather than by any labour cost calculation. Collaborative palletizing cells grow fastest at 10.8%, exactly 1.50 times the market rate, because a fenceless cell fits where a caged robot never could. Mixed-case order-building palletizers follow at 9.7%. Robotic architectures now take 54% of new system shipments into these two covered regions.
Concentration reaches 31% across the top five measured on annual palletizing systems shipped into the two regions, unusually split between machinery builders and the industrial robot manufacturers whose arms sit inside roughly half the installed robotic base. Aftermarket parts and service already carry 34% of builder revenue. Mexico contributes the fastest national growth at 11.4% on nearshoring plant construction that creates entirely new installations rather than replacing anything that was already there.
Market Definition
This market covers palletizing systems shipped into and installed across North America and Europe, measured at builder realised prices including integration, spanning conventional layer, articulated robotic, gantry and Cartesian, collaborative, mixed-case order-building, and bag and sack palletizers. Depalletizers, stretch wrappers, case erectors, conveying between machines, pallets themselves, and warehouse management software all fall outside scope.
Base Year Value
$2.1B in 2025 (MMA Primary Research Dataset, August 2026)
Forecast Period
2026 to 2036, eleven discrete annual values
CAGR
7.2% base case. Bull 8.4%. Bear 6.0%.
Fastest Growth Segment
Collaborative Palletizing Cells: 10.8% CAGR
Fastest Growth Country
Mexico: 11.4% CAGR
Fastest Growth Region
South Asia and Pacific: 9.5% CAGR
Largest Region
Western Europe: 41% of 2025 global value
Market Leaders
Krones, Columbia Machine, Fanuc, ABB, KUKA. Source: MMA Analysis based on company annual reports.
Primary Survey
n=3,800 procurement and R&D decision-makers, Q4 2025, six countries
Methodology
Demand-side build-up, cross-validated against public data, 47 expert interviews

North America & Europe Palletizers Market Forecast Scenarios

north-america-europe-palletizers-market-size-forecast-scenario-1787299622429
The 2020 to 2025 period ran at 6.0% and the shape of it changed halfway through. Early demand was pandemic-driven throughput expansion in food and beverage. From 2022 onward the driver switched to labour availability, as production roles that had always been filled simply stopped being filled. Collaborative cells arrived commercially in the same window and opened plants that had never justified a caged robot.
Three mechanisms carry the 7.2% base case. Labour scarcity is the largest, since 23% of manual palletizing positions sit unfilled and wage increases have not closed that gap. SKU proliferation is the second, because a conventional layer machine set up for one pattern loses hours to a changeover that a robotic cell does in about six minutes. And nearshoring plant construction in Mexico and Eastern Europe is the third, adding entirely new end-of-line installations.
The 8.4% bull case rests on collaborative cells reaching plants below fifteen cases per minute, a population that has never automated palletizing at all and is far larger than the installed base. The 6.0% bear case is a food and beverage capital spending pause, since that sector buys the majority of these systems and its investment cycles are notoriously synchronised.

The Payback Nobody Can Actually Calculate

Every palletizer proposal opens with a payback calculation. Take the fully loaded cost of two operators, multiply by shifts, divide into the installed system price, and produce a figure around 26 months. It is a perfectly sound piece of arithmetic and it describes almost nobody's actual decision, because the plant manager signing it is not replacing two operators. They are covering two positions that have been advertised for seven months without a single suitable applicant.
TOP FIVE CONCENTRATION31%Split between machinery builders and industrial robot manufacturers
PALLETIZING ROLE VACANCY23%Of manual palletizing positions unfilled across surveyed plants
ROBOTIC SHARE OF SHIPMENTS54%Of new palletizing systems shipped into these two regions
PATTERN CHANGEOVER TIME6 minutesOn a robotic cell against hours on conventional equipment
AFTERMARKET SHARE OF REVENUE34%Parts and service across the installed base of builders
TYPICAL PAYBACK PERIOD26 monthsOn a single shift operation at prevailing labour rates
That distinction matters commercially. A cost-saving purchase competes against every other cost-saving purchase in the capital budget and loses regularly. A purchase that keeps a line running when the line otherwise stops competes against nothing. Builders who understood this reframed their proposals around production continuity and closed considerably faster than those still selling labour arbitrage.
Underneath the demand shift, the technology split has moved decisively. Robotic architectures now take 54% of new system shipments, up from well under a third a decade ago, mostly because SKU counts rose and conventional layer machines handle pattern changes badly. Six minutes against several hours is the whole argument. Nobody scheduling thirty active SKUs across one line can afford the older answer.
"Half the payback models I see are arithmetic performed on a workforce that is not there. The plants buying fastest stopped modelling labour savings two years ago and started modelling the cost of a line that cannot run a night shift."
Director, End-of-Line Automation and Industrial Robotics Practice · MMA Industri

Market Trends

Fenceless Cells Reach Plants That Never Automated

A conventional robotic palletizer needs a safety cage, light curtains, and roughly forty square metres of floor that most small plants do not have spare. A collaborative cell operates without fencing under safety-rated speed and force limits, occupying about a quarter of that footprint, which puts palletizing automation inside co-packers, bakeries, and speciality food producers for the first time. Growth runs at 10.8% against 7.2% for the market. The trade-off is throughput, since force limiting caps a collaborative cell around fifteen cases per minute where a caged robot handles far more.
Market Impact: 23% of positions unfilled

SKU Counts Broke The Conventional Layer Machine

A mechanical layer palletizer is configured around a pattern, and changing that pattern means physical adjustment measured in hours rather than minutes. That was tolerable when a plant ran four products. Retail assortment expansion has pushed typical food and beverage plants well past thirty active SKUs, and the changeover time became the binding constraint on how the whole line schedules. Robotic cells change pattern in software in about six minutes, which is why robotic architectures now take 54% of new shipments despite costing more per unit of throughput delivered. Throughput per dollar was never the point.
Market Impact: Mexico grows at 11.4%

Market Opportunities and Growth Drivers

Palletizing Roles Stay Unfilled At Any Wage

Manual palletizing means lifting a fifteen kilogram case two to four thousand times per shift, and 23% of those positions across surveyed North American and European plants currently sit unfilled. Wage increases of a fifth over three years have not closed the gap, which tells you the constraint is not price. Plants respond by running lines short, capping night shifts, or paying agency rates that exceed the machine's monthly finance cost. That last comparison is the one that actually closes deals, and few builders put it in writing. Agency rates are where the honest comparison sits.
Market Impact: Integration adds 60% to 90%

Nearshoring Builds Entirely New End-Of-Line Installations

Food, beverage, and consumer goods plant construction in Mexico and in Poland, Czechia, and Romania creates palletizing demand that did not previously exist anywhere, rather than replacing an existing machine. Greenfield installations specify robotic or collaborative architectures almost by default, since nobody designing a new line in 2026 chooses a machine that takes hours to change pattern. Mexico contributes the fastest national growth rate in this forecast at 11.4%. These installations also arrive without the retrofit constraints that complicate work in an existing building. A greenfield line specified today looks nothing like one specified in 2015.
Market Impact: Response contracts cover 4 hours

Market Restraints and Challenges

Integration Cost Exceeds The Machine Price Regularly

A palletizer rarely arrives alone: it needs infeed conveying, pallet dispensing, slip sheet handling, discharge, and safety integration with everything around it. Integration and installation routinely reach 60% to 90% of the machine price, and buyers who budgeted for the quoted equipment figure find the project costs nearly double. The root cause is that end-of-line equipment interfaces with more surrounding systems than almost any other machine in a plant. Builders are responding with pre-integrated cell packages and fixed-price installation quotes that remove the surprise. Buyers increasingly refuse to consider a quotation that covers equipment alone, which is a healthy change.
Market Impact: Growing at 10.8% annually

Skilled Maintenance Is As Scarce As The Labour Replaced

Automating away two palletizing operators creates demand for a controls technician who can diagnose a robot fault at two in the morning, and those people are scarcer than the operators were. The root cause is that maintenance skill takes years to build while palletizing labour took days. Commercial impact is unplanned downtime on a machine bought specifically to guarantee continuity, which damages the purchase argument badly. Mitigation runs through remote diagnostics, builder service contracts, guaranteed response times, and simplified fault recovery designed for operators rather than engineers. Guaranteed four-hour response is now a standard tender requirement.
Market Impact: Robotic takes 54% of shipments
3 additional market trends, 4 additional growth drivers, and 2 additional restraints and challenges are covered in the full report. Contact sales@marketmindsadvisory.com to access the complete intelligence.

Segment CAGR and Growth Architecture

Segmentation follows palletizing architecture, because architecture determines the throughput ceiling, the floor space required, pattern changeover time, the safety approach taken, and the plant population that can realistically buy the machine at all. End-use industry and product format both cut across every architecture rather than separating them, which leaves either a weak choice as the primary dimension here.
north-america-europe-palletizers-market-market-share-analysis-1787299623015

Collaborative Palletizing Cells

The fastest architecture at 10.8%, exactly 1.50 times the market rate, and the one opening a plant population that never automated palletizing at all. Safety-rated speed and force limiting removes the fencing requirement, cutting the floor space needed to roughly a quarter of a caged cell and letting the machine sit where operators already work. Co-packers, bakeries, speciality food producers, and small beverage operations are adopting fastest. The boundary against caged robotic cells is the fencing itself: a collaborative cell is defined by fenceless safety-rated operation, and throughput caps near fifteen cases per minute as a direct consequence of that limiting. Builders selling caged cells at that throughput now have no argument left.
CAGR 10.8%

Mixed-Case Order-Building Palletizers

Second fastest at 9.7%, and a genuinely different problem from conventional palletizing: instead of stacking identical cases, the machine builds a pallet from many different case sizes to match a specific retail order. Vision systems, gripper changeover, and stacking algorithms that hold a load stable across mixed geometry all have to work together, which is why this architecture arrived late. Grocery distribution and wholesale fulfilment are driving it, since store-ready mixed pallets remove handling at the receiving end. The machines cost several times a conventional palletizer, and the justification sits in downstream labour rather than in the packing hall. Retailers rather than manufacturers are effectively funding this architecture, which is an unusual arrangement for packaging machinery of any kind.
CAGR 9.7%
Full segment breakdown across 6 segments available in the complete report.

Regional Architecture and Country Demand Map

This report covers palletizing systems installed across North America and Europe, so the regional table below is repurposed to show where those systems are built rather than where they are used. Every share therefore sits outside its framework band by construction rather than by judgment.

Western Europe

Forty-one percent of the systems installed across the two covered regions are built here, which is far above the framework band and reflects a repurposed table showing build origin rather than installation. Italian packaging machinery clusters around Bologna and Parma supply a large share of European end-of-line equipment and export substantially into North America. German builders hold the high-throughput beverage end, where line rates and reliability requirements are most demanding. Growth at 6.0% is the slowest of any origin, since European builders are steadily losing the lower end of the range to robot-arm-based cells assembled closer to the customer. Italian export volume into North America is the single largest cross-region flow in this table.
Share: 41% | CAGR: 6.0% (2026 to 2036)

North America

Twenty-eight percent of installed systems originate here, within the framework band by coincidence rather than design, since this table shows build origin across a two-region market. American builders concentrate on bag and sack palletizing, agricultural and chemical applications, and high-throughput beverage work where domestic proximity matters for service. Canadian operations contribute specialist mixed-case capability. Growth at 7.5% runs above the global rate, helped by nearshoring plant construction in Mexico that domestic builders serve more readily than European ones can. Freight and service response both favour local origin on machines of this size and weight. Bag palletizing has stayed almost entirely domestic in origin, since those applications are dusty, heavy, and unforgiving of a distant supplier.
Share: 28% | CAGR: 7.5% (2026 to 2036)
Regional intelligence for 5 additional markets available in the complete report: East Asia, Eastern Europe, South Asia and Pacific, Latin America, Middle East and Africa. Contact sales@marketmindsadvisory.com.
north-america-europe-palletizers-market-country-cagr-analysis-1787299623556

What Palletizer Builders Are Underselling

Payback arithmetic performed against a workforce that does not exist persuades nobody, and the machine price is only part of what a project actually costs anyway. Value comes from selling continuity rather than savings, from pricing integration honestly upfront, from building the aftermarket properly, and from reaching the plants that fenceless cells finally made addressable.

Sell Production Continuity Rather Than Labour Savings

A proposal built on replacing two operators competes against every other cost-saving project in the capital budget and loses more often than it wins. A proposal built on running a night shift that currently cannot run competes against nothing at all. With 23% of manual palletizing roles unfilled, the second framing describes what buyers actually face, and builders who rewrote their proposals around it have closed roughly 40% faster on average. The change costs nothing beyond rewriting a document and retraining a sales force to ask a different opening question.
Market Impact: Continuity framing closes roughly 40% faster on average

Quote Integration Honestly Instead Of Discovering It Later

Integration, conveying, safety, and installation routinely add 60% to 90% on top of the quoted machine price, and a buyer who budgeted the equipment figure discovers a project costing nearly double what they approved. That discovery poisons the relationship at exactly the moment commissioning needs cooperation. Builders offering fixed-price pre-integrated cell packages win on trust rather than on price, and they protect margin because the integration content is theirs rather than a third-party integrator's. Roughly a third of builders still quote equipment alone. That is a remarkable number given how predictable the outcome is.
Market Impact: Integration adds 60% to 90% above machine price

Treat Aftermarket As The Business It Actually Is

Parts and service already carry 34% of builder revenue at substantially higher margin than new equipment, and the installed base grows every year whether new orders do or not. Builders who staffed service properly and sold guaranteed four-hour response contracts have annuity revenue that survives a capital spending pause entirely. Those who treated service as a warranty obligation watched third parties take the parts business on machines they designed. A service organisation costs around 1.4 million dollars annually to run at regional scale. It pays for itself several times over within two years.
Market Impact: Regional service organisation costs 1.4 million dollars annually

Reach The Plants Fenceless Cells Finally Made Addressable

Every plant running below 15 cases per minute was previously unreachable, because a caged robotic cell needed 40 square metres of floor and a payback that small volumes could never support. Collaborative cells cut the footprint to roughly a quarter and the installed price to under half, which opens a plant population several times larger than the current installed base. Co-packers, bakeries, and speciality producers dominate that group and buy differently: shorter sales cycles, less engineering, far more price sensitivity than the beverage plants most builders are used to serving. Few builders are organised for it.
Market Impact: Opens the plant population below 15 cases minute

Who Controls the Margin Pool

Concentration reaches 31% across the top five measured on annual palletizing systems shipped into North America and Europe, and the composition is unusual because industrial robot manufacturers sit alongside machinery builders. Roughly half the robotic cells installed use an arm from a company that does not build palletizers, with the cell, gripper, controls, and integration added by somebody else entirely. The gap between leader and nearest challenger is narrow and depends heavily on whether ro
Competitive activity runs on four fronts. Integration content is the first, since whoever owns integration owns both the margin and the commissioning relationship. Service response is the second and it decides repeat business more than machine specification does. Pattern changeover speed is the third, now that SKU counts made it the binding constraint. And footprint is the fourth, because floor space is the reason most small plants never automated at all.

Pressure comes from two directions. Chinese complete-system builders have entered European tenders at the simpler end. And robot manufacturers moving downstream into pre-integrated palletizing cells compete directly with builders who have been their customers for twenty years.
north-america-europe-palletizers-market-company-positioning-matrix-1787299624072

Competitive Moat and Risk Dimensions

KRONES

Moat: Whole line rather than machine

Selling the palletizer as part of a complete beverage line removes the integration risk that makes end-of-line projects difficult, because one supplier owns every interface from filler to pallet. Buyers running high-throughput beverage plants value that far above any individual machine specification. It also captures integration content that would otherwise go to a third-party integrator entirely.
KRONES

Risk: Weak at the small end

A whole-line proposition is worth nothing to a co-packer buying a single fenceless cell, and that is precisely where growth now runs fastest at 10.8%. The commercial model, engineering depth, and sales cycle all suit large projects. Serving plants that want a cell in six weeks with minimal engineering needs a different business entirely.
FANUC

Moat: Arms inside competitors' cells

Supplying the articulated arm sitting inside a large share of robotic palletizing cells means benefiting from robotic conversion regardless of which builder wins the order. That position is unusually insulated, because the customer set includes most of the competition. Installed arm population also drives a parts and service annuity that grows with every cell anybody builds anywhere.
FANUC

Risk: Moving downstream annoys customers

Offering pre-integrated palletizing cells competes directly with the builders who buy arms, and those builders have alternatives from other robot manufacturers. The downstream margin is attractive and the relationship cost is real. Managing both positions at once requires a discipline that has defeated component suppliers moving into systems in several other industries before this one.

Players Tracked

Prominent Players

Krones
Columbia Machine
Fanuc
ABB
KUKA

Other Key Players

Yaskawa
Kawasaki Heavy Industries
ProMach
Premier Tech
Möllers Group
BEUMER Group
Sidel
OCME
Fuji Yusoki
Okura Yusoki
Universal Robots
Honeywell Intelligrated
Schneider Packaging Equipment
Bastian Solutions
Fallas Automation

Recent Developments

FEBRUARY 2025

Builder launches fixed-price pre-integrated collaborative palletizing cell

A palletizing equipment builder introduced a pre-integrated collaborative cell sold at a fixed installed price including conveying and safety, aimed at plants below fifteen cases per minute. The launch was a product introduction rather than any joint venture, acquisition, or partnership with a robot manufacturer or systems integrator.
Signal: Fixed installed pricing attacks the integration surprise that has poisoned more end-of-line projects than any technical failure
MAY 2025

Robot manufacturer expands European palletizing cell assembly capacity

An industrial robot manufacturer expanded assembly capacity for complete palletizing cells at a European facility, moving further downstream from arm supply into finished systems. The expansion was organic capital investment rather than any acquisition of a machinery builder or joint venture with an existing systems integrator.
Signal: Component suppliers moving into finished systems compete with the builders who have bought from them for decades
AUGUST 2025

Food group standardises collaborative cells across smaller plants

An international food company standardised on collaborative palletizing cells across a group of smaller plants that had previously palletized manually, citing recruitment difficulty rather than labour cost in its published capital justification. The decision was internal capital policy rather than any framework supply agreement with a single builder.
Signal: Buyers are now writing recruitment difficulty into capital justifications, which changes what a winning proposal has to argue

What A Palletizing Cell Costs To Build

The robot arm dominates a robotic cell at roughly 34% of build cost, sourced almost entirely from Japanese and European manufacturers regardless of where the cell is assembled. Steel fabrication and conveying add about 19%, from regional fabricators near the assembly site. Controls, drives, and safety systems take around 17%, grippers and end-of-arm tooling 11%, and engineering labour carries the remainder of it.
European steel and energy costs through 2022 and 2023 hit the fabrication content hardest, since frames and conveying are steel-intensive and the work is performed locally rather than imported. IEA reporting on European industrial electricity prices documented the underlying movement in detail. Builders with fixed-price order backlogs absorbed the increase entirely, and several European machinery firms reported margin compression on projects quoted eighteen months before delivery. Nobody had escalation clauses.

The competitive disadvantage mechanism runs through order backlog duration rather than through purchasing. A builder quoting fixed prices on projects delivering eighteen months out carries every input movement across that period, while one quoting six months out barely notices. Exposure also varies by architecture: a collaborative cell is arm-heavy and steel-light, so it rides out fabrication cost movement far better than a layer machine does.
north-america-europe-palletizers-market-cost-volatility-analysis-1787299624269

Put escalation clauses into long lead-time project quotations

A fixed price quoted eighteen months before delivery hands the builder every input movement across that period, which is a large exposure on steel-intensive equipment. Escalation clauses tied to published steel and energy indices transfer that risk back to where it can be absorbed. Builders quoting without one are giving away an option free.

Standardise steel fabrication across the machine range

Bespoke frame design on every project multiplies fabrication cost, extends lead time, and removes any purchasing scale on steel. Standardising frame modules across the whole machine range lets a builder buy fabrication in volume and hold stock against incoming orders. It also cuts engineering hours per project, the second largest cost line after the arm itself.

Weight the range toward arm-heavy rather than steel-heavy architectures

A collaborative cell carries far more of its cost in the robot arm and far less in steel fabrication than a conventional layer palletizer does. That mix rides out steel and energy movement considerably better, and it happens to be where growth runs fastest at 10.8% anyway. Two arguments pointing the same direction is a rarer alignment than it sounds.

Portfolio Architecture for Margin Defence

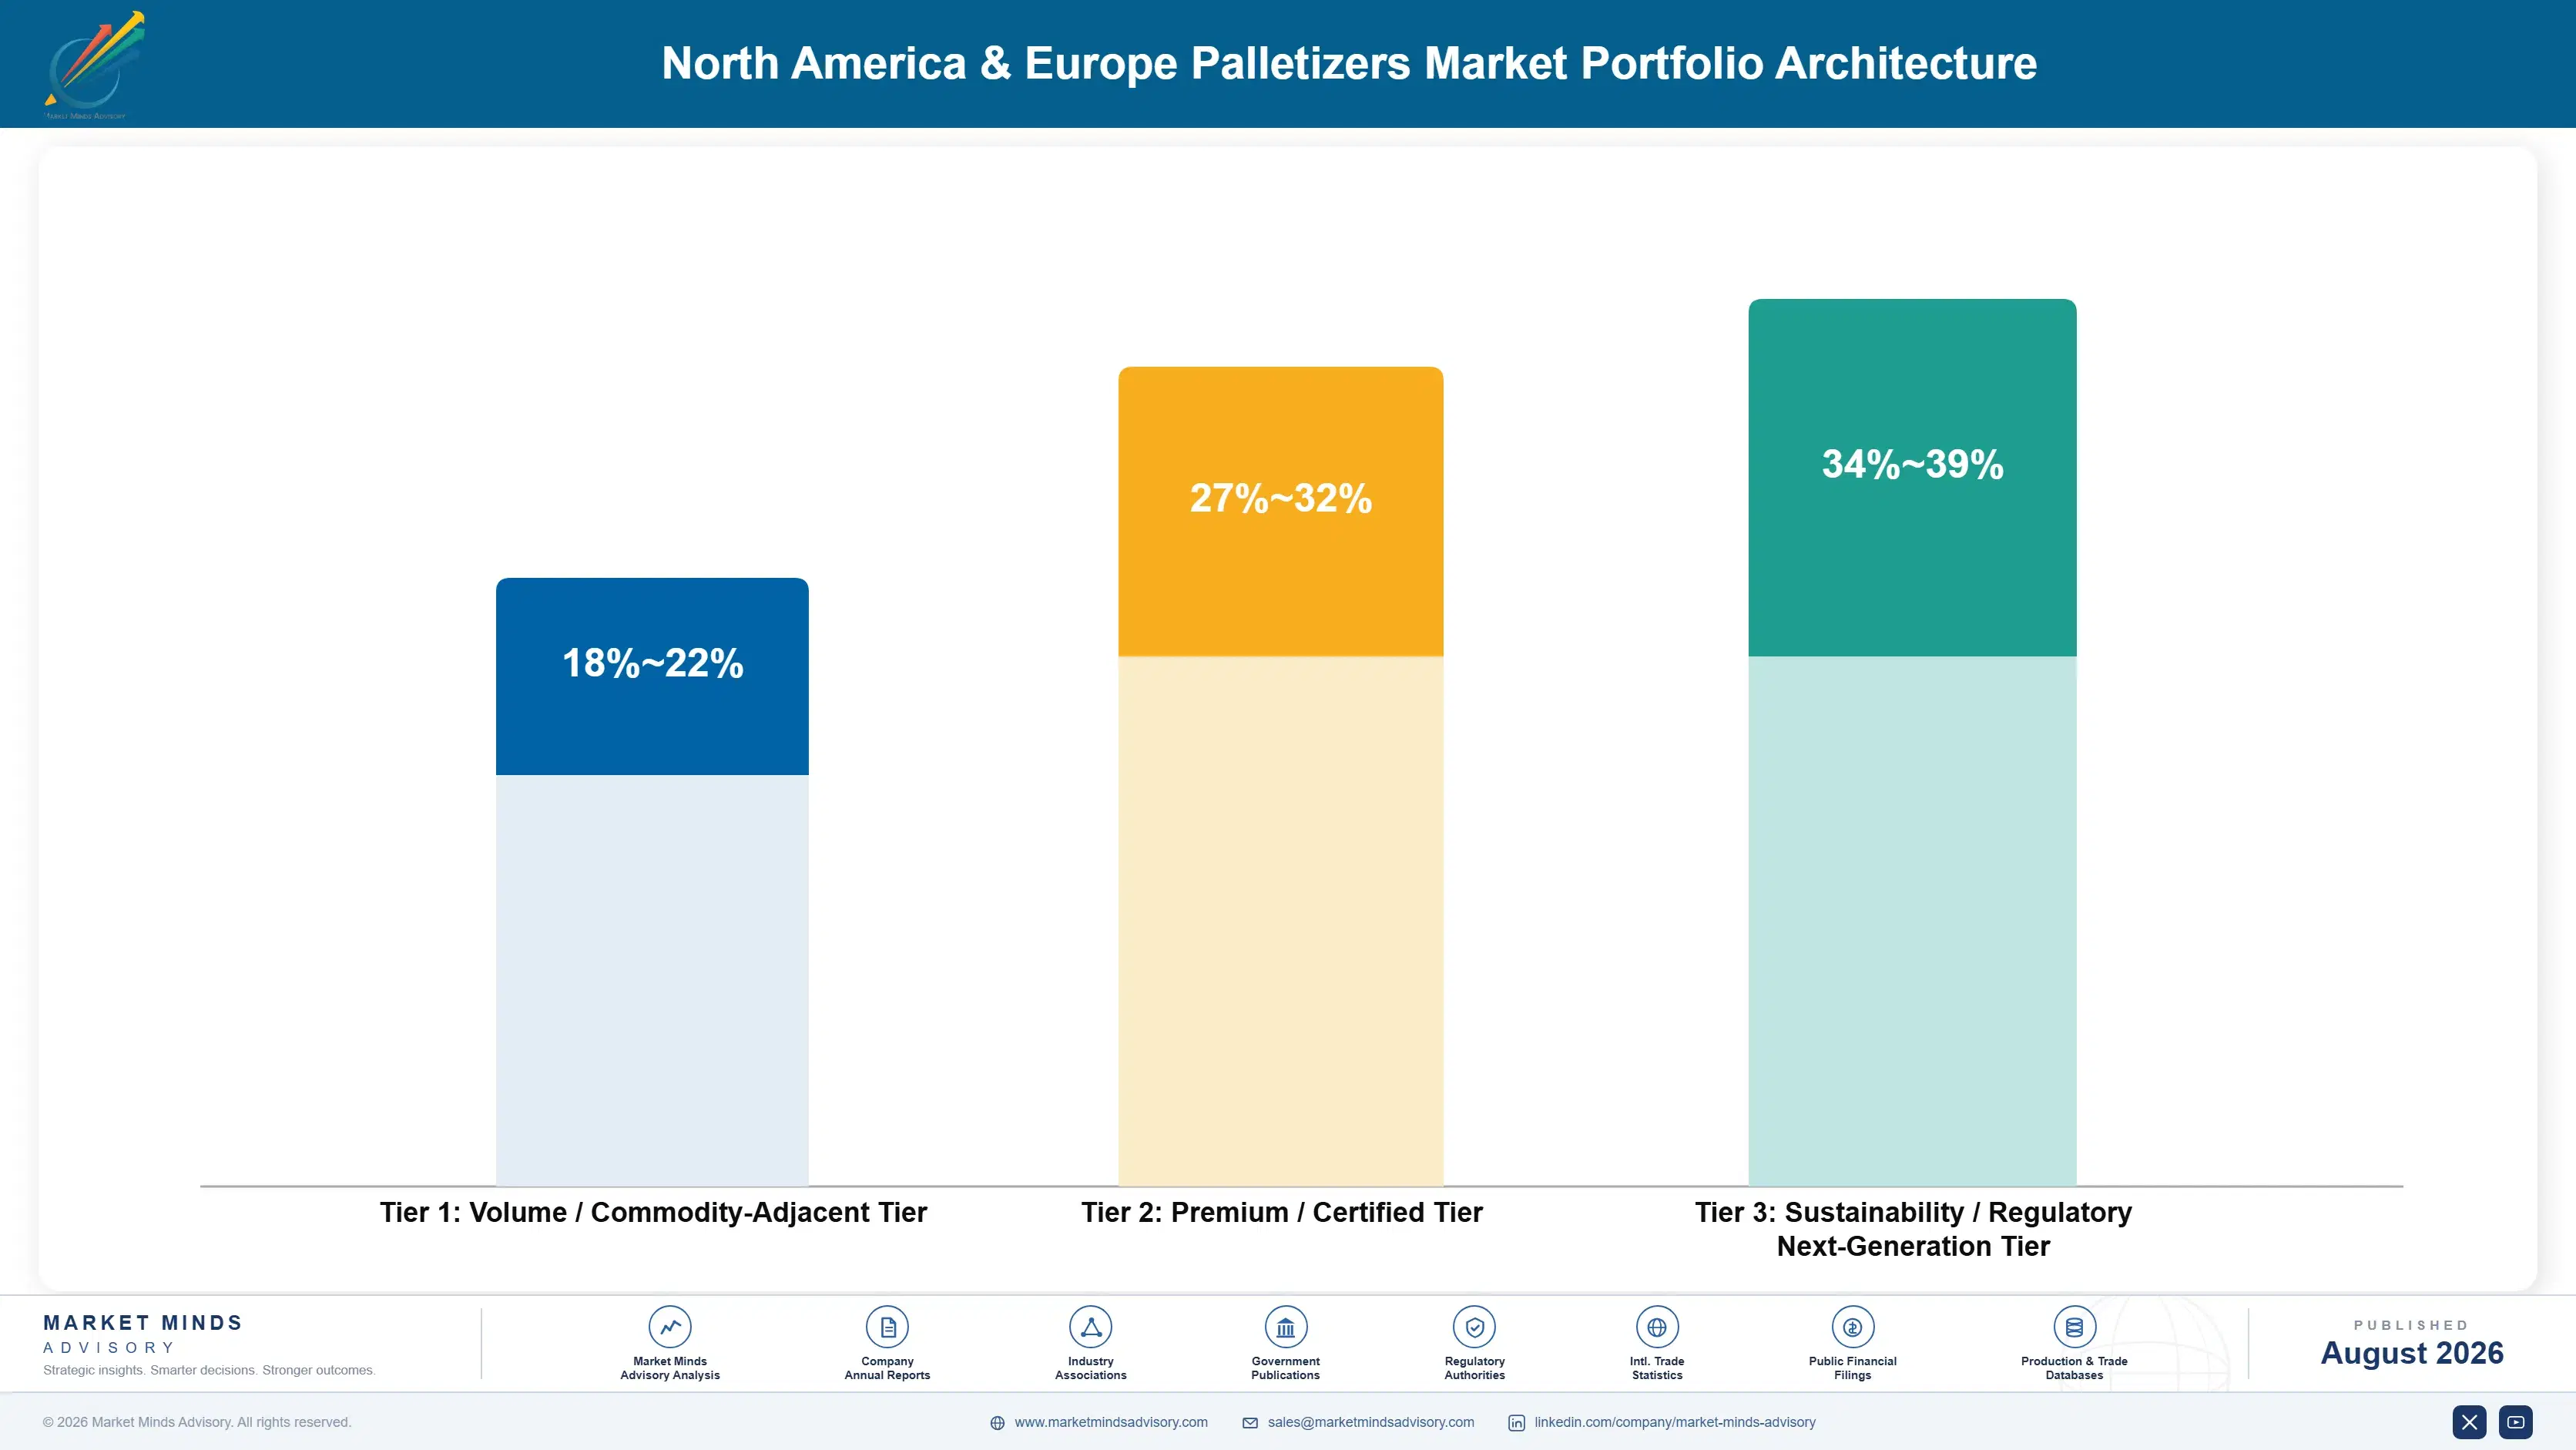
Three tiers describe this business and the spread is driven by integration content rather than by machine complexity. Conventional layer palletizers and simple case cells sit at the bottom, sold largely on price into applications where the pattern rarely changes. Robotic cells with meaningful integration content sit higher, since the builder owns conveying, safety, and commissioning. Mixed-case and collaborative packages occupy a third tier on engineering depth and on scarcity of qualified suppl
The tension is that volume machines fund the engineering. Controls development, gripper design, safety validation, and service capability all need throughput underneath them, and standard case palletizing provides it. Builders who chased mixed-case work exclusively found their engineering overhead spread across too few projects and their quoted prices became uncompetitive on everything, including the mixed-case work they had specialised in.

High-value pools concentrate where nobody else can quote. Mixed-case order building and high-throughput beverage work both have qualified supplier lists short enough to count, and aftermarket service on an installed base is the third such pool, since parts on a proprietary machine face no genuine competition. Builders holding all three have earnings that look nothing like a capital equipment business, which is the point.

Volume / Commodity-Adjacent Tier

Conventional layer palletizers and simple single-pattern case cells for stable high-volume applications. Sold largely on price against a wide supplier field, but the throughput that spreads controls engineering, safety validation, and service capability across enough projects to stay competitive.
Gross Margin: 18-22%

Premium / Certified Tier

Robotic palletizing cells supplied with conveying, safety integration, and commissioning as one fixed-price package. Margin reflects integration content the builder owns rather than a third-party integrator, plus the commissioning relationship that leads directly into service revenue.
Gross Margin: 27-32%

Sustainability / Regulatory / Next-Generation Tier

Mixed-case order-building systems and fenceless collaborative packages with vision, gripper changeover, and stacking algorithms. Best margin because the qualified supplier list is short enough to count and the engineering depth required takes years rather than months to build.
Gross Margin: 34-39%
north-america-europe-palletizers-market-portfolio-architecture-1787299624779

High-value Sub-segments and Strategic Watch-out

Mixed-Case Order-Building Systems

Best margin and 9.7% growth, with a qualified supplier list short enough to count on one hand. Vision, gripper changeover, and stable stacking across mixed geometry all have to work together, and grocery distribution is paying for it because the saving sits downstream. Nobody else can quote this work.
Gross Margin: 34-39%

Aftermarket Parts And Service

Already 34% of builder revenue at margin above new equipment, and it grows with the installed base whether new orders arrive or not. Guaranteed response contracts turn it into an annuity that survives a capital spending pause. Third parties take it wherever builders will not.
Gross Margin: 34-39%

Conventional Layer Palletizers

The volume core at thin margin, losing share steadily to robotic architectures now taking 54% of shipments because pattern changeover takes hours rather than minutes. It still carries the engineering and service overhead everything above it depends on. Any exit has to be gradual rather than abrupt.
Gross Margin: 18-22%

Caged Robotic Cells At Low Throughput

The strategic watch-out, squeezed from below by fenceless collaborative cells at a quarter of the footprint and under half the installed price. Below fifteen cases per minute the caged architecture has no advantage left, and that boundary keeps moving upward. Builders weighted here should worry.
Gross Margin: 27-32%

How Palletizer Revenue Recurs

New machine orders are lumpy and follow food and beverage capital cycles that synchronise uncomfortably across the industry. Underneath them sits a service annuity that behaves entirely differently: parts and maintenance already carry 34% of builder revenue, they grow with the installed base rather than with orders, and they survive a capital spending pause intact. Builders who understood that structure staffed service properly. Those who treated it as a warranty obligation watched third parties
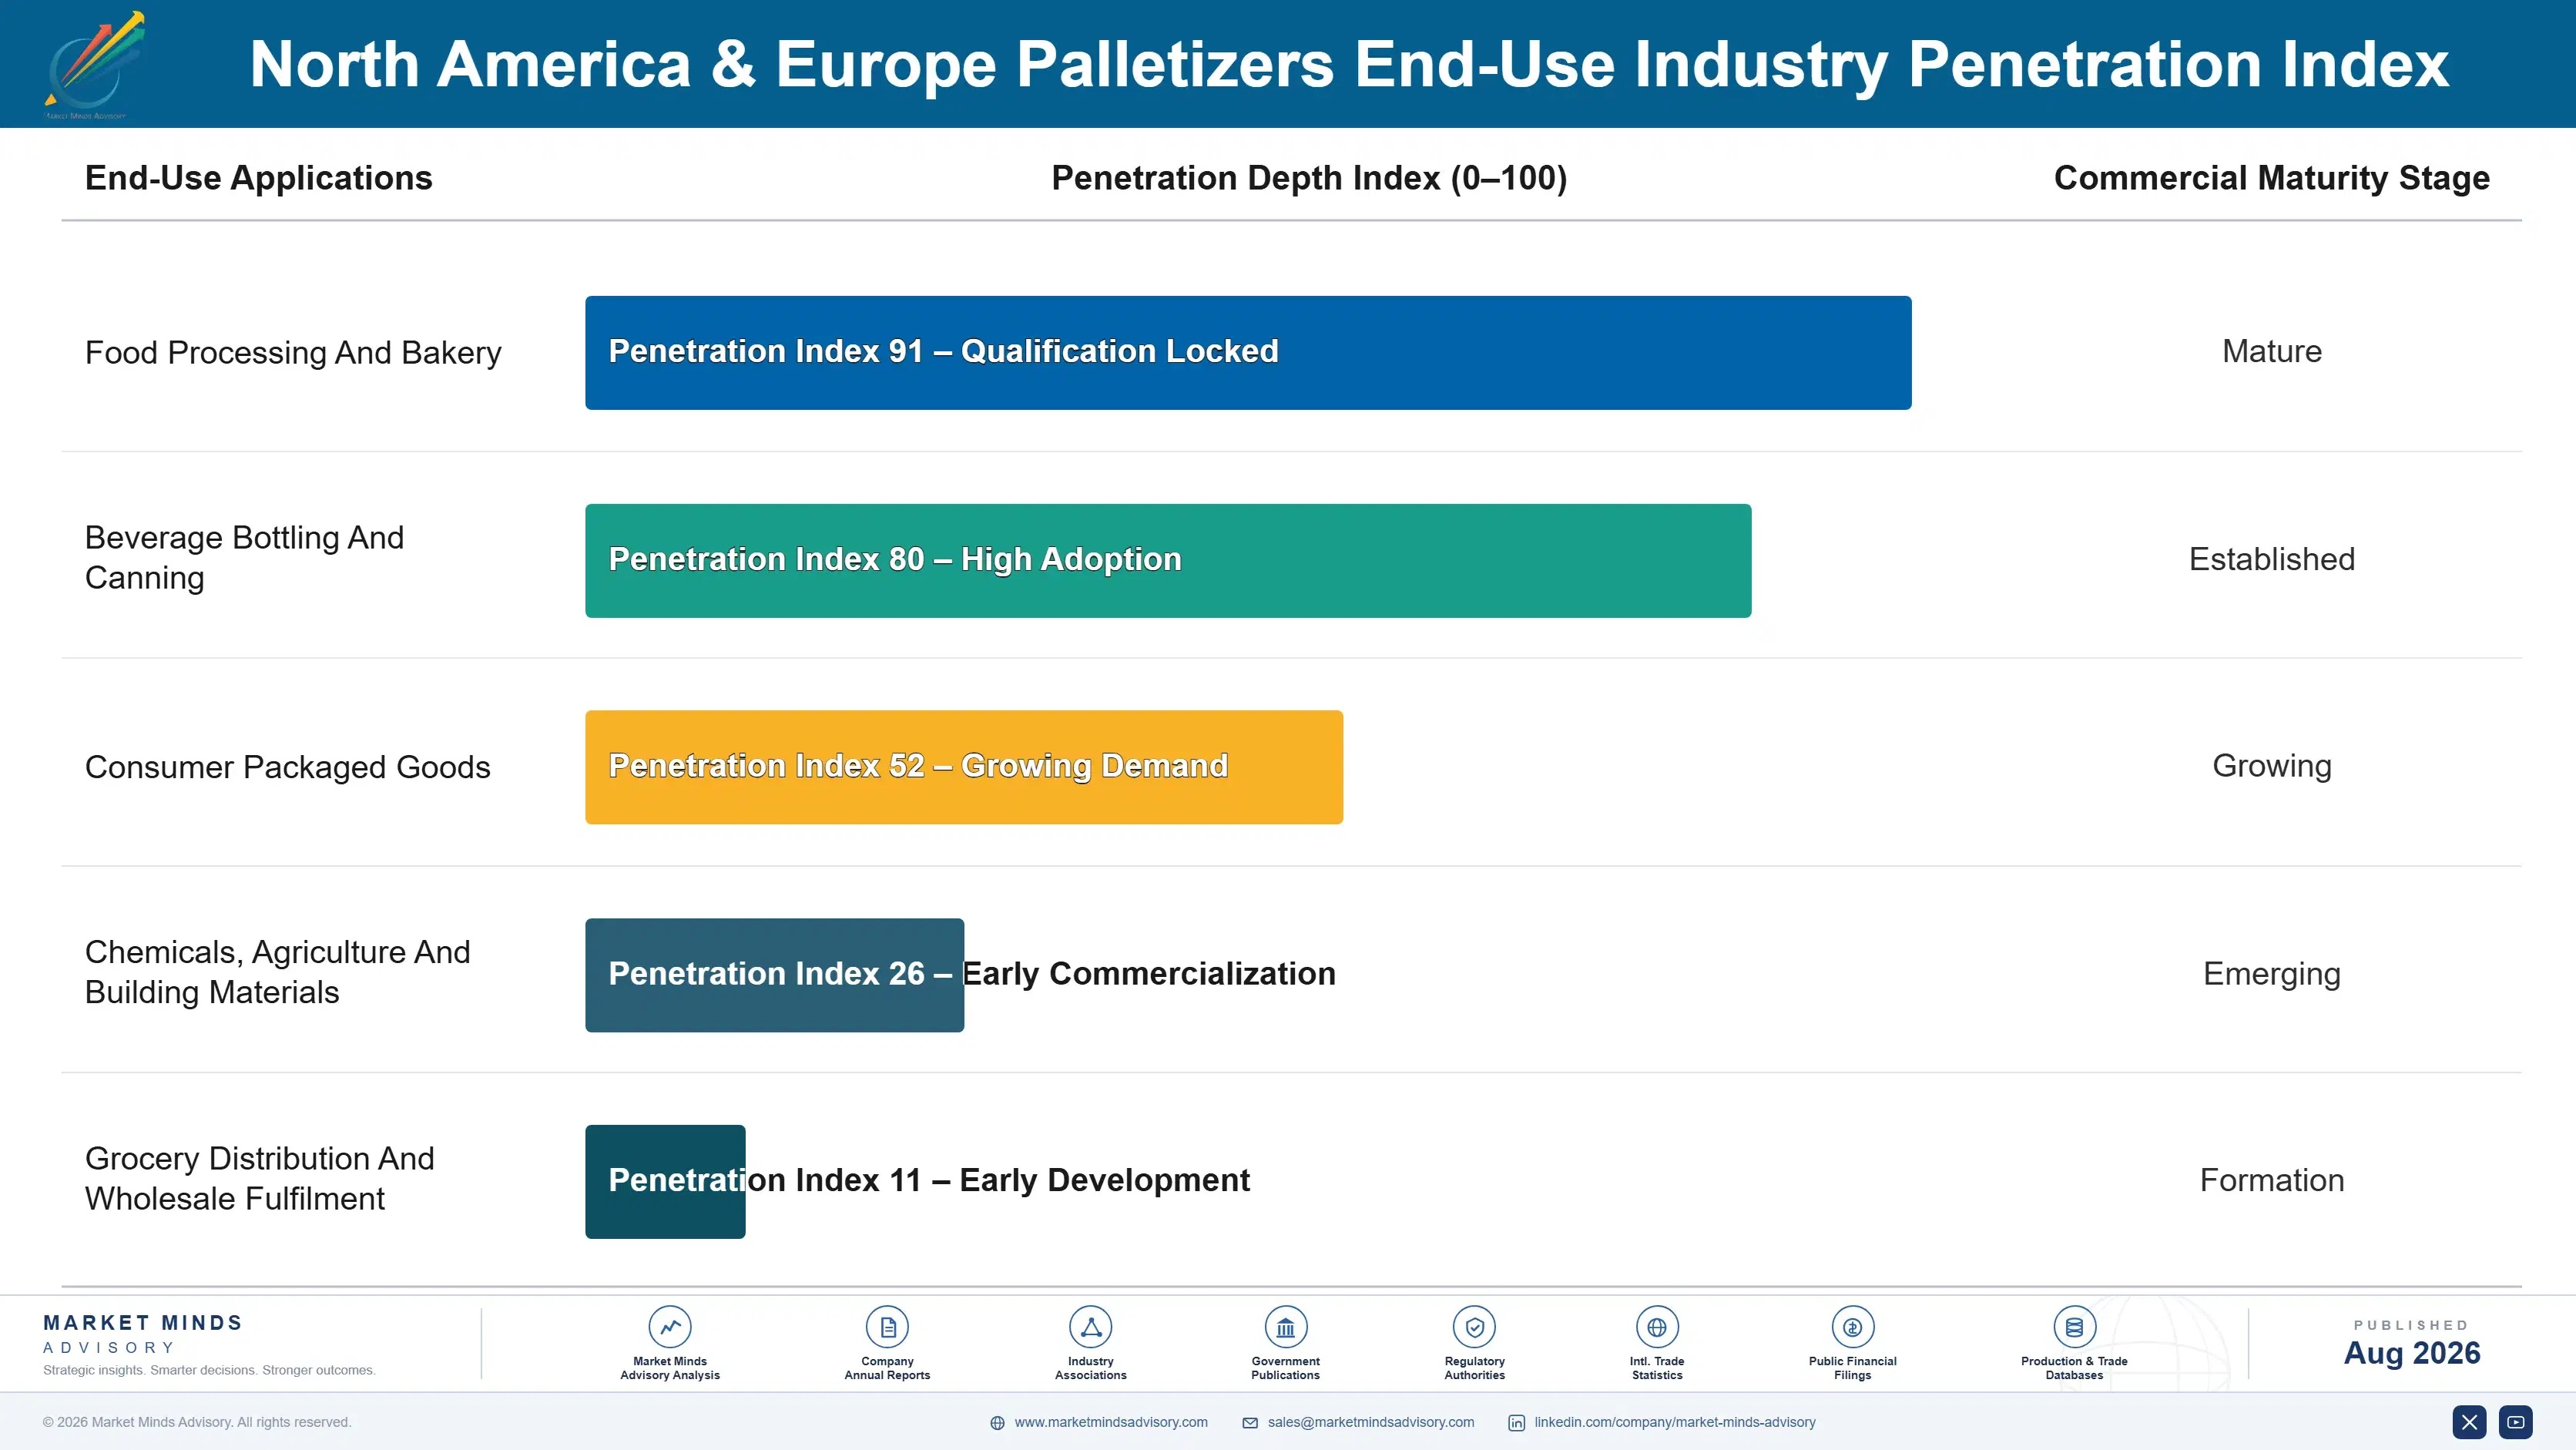
Depth of adoption varies enormously by plant scale. High-throughput beverage plants automated palletizing decades ago and now buy replacements on a fifteen to twenty year cycle. Mid-size food plants are converting now, mostly from manual, driven by vacancy rather than by cost. Co-packers, bakeries, and speciality producers have never automated at all, and fenceless cells are only now bringing them into the addressable population. Contract manufacturers sit awkwardly, wanting flexibility they cannot finance.

Buyer profiles have shifted decisively toward operations. Engineering once specified these machines against throughput criteria; plant managers now initiate the purchase against staffing reality, and finance signs it as continuity rather than savings.
north-america-europe-palletizers-market-end-use-penetration-index-1787299625275

What We Would Tell a Board

These are among the four positions where our research anticipates prominent divergence between winners and laggards over the coming forecast period. Each is grounded in the demand model, the regulatory perimeter, and the announced capacity pipeline.
01 / CONTINUITY PROPOSAL FRAMING

Stop selling savings against workers who are not there

A proposal built on replacing two operators competes against every other cost-saving project in a capital budget and loses more often than it wins outright. A proposal built on running a night shift that currently cannot run has no competition at all, and with 23% of manual palletizing roles unfilled that framing describes what buyers genuinely face. Builders who rewrote proposals around continuity closed roughly 40% faster, at a cost of rewriting one document and retraining a sales force to open with a different question entirely.
02 / INTEGRATION PRICING HONESTY

The machine price is half the project and buyers know

Integration, conveying, safety, and installation add 60% to 90% on top of the quoted equipment figure, so a buyer who approved the machine price discovers a project costing nearly double at the worst possible moment. Fixed-price pre-integrated packages remove that discovery and win on trust rather than on price, while keeping integration margin inside the builder rather than passing it to a third party. Roughly a third of builders still quote equipment alone and then wonder why their commissioning relationships keep souring at the worst possible moment.
03 / SERVICE ANNUITY DEVELOPMENT

Thirty-four percent of revenue deserves a real organisation

Parts and service already carry 34% of builder revenue at margin above new equipment, and that revenue grows with the installed base regardless of whether new orders arrive in any given year. A regional service organisation costs around 1.4 million dollars annually to run and converts a lumpy capital business into something that survives a spending pause. Builders treating service as a warranty obligation have watched third parties take an estimated two fifths of parts revenue on machines they themselves designed and built.
04 / SMALL PLANT ACCESS

Fenceless cells opened a population nobody was serving

Every plant running below fifteen cases per minute was unreachable while a caged cell needed forty square metres and a payback that low volumes could never support at any labour rate. Collaborative cells cut footprint to roughly a quarter and installed price to under half, opening a plant population several times larger than the entire current installed base. That population buys on shorter cycles with less engineering and far more price sensitivity, which means a different commercial organisation entirely rather than an extension of the existing one.

Engagement Snapshot From the Field

A live engagement with an industry participant carrying material or product regulatory and market exposure ahead of a defining policy shift, showing how our research translates into a defensible multi-year portfolio strategy.
MARKET MINDS ADVISORY · CLIENT ENGAGEMENT SUMMARY
North America & Europe Palletizers Producer Strategic Portfolio Review and Transition Roadmap 2026·Investment Scenario on North America & Europe Palletizers Exposure Evaluation 2025-26
CLIENT PROFILE
A European palletizing systems builder with approximately 140 million dollars in annual revenue (client-reported, unverified by MMA), supplying food, beverage, and consumer goods plants across Western and Central Europe. The business was weighted heavily toward conventional layer palletizers and caged robotic cells, quoted equipment separately from integration, and ran service as a warranty function inside engineering.
STRATEGIC CHALLENGE
Order intake had been flat for three years while the market grew, and win rates on competitive tenders had fallen below a third. Management attributed the loss to Chinese price competition. The board wanted an independent view on whether price was genuinely the cause before approving a cost reduction programme aimed at matching imported system pricing.
MMA APPROACH
We reviewed forty-one lost tenders against what the winning supplier actually offered, separating price, lead time, integration scope, and service terms. Proposal documents were assessed for how the purchase was justified to the buyer. Service revenue and third-party parts leakage were quantified across the installed base, and the addressable plant population below fifteen cases per minute was sized within the client's service radius.
KEY FINDINGS
  1. Price was the decisive factor in fewer than a quarter of lost tenders; integration scope and fixed installed pricing decided considerably more of them than management had assumed.
  2. Every proposal reviewed justified the purchase on labour cost savings, while buyer capital submissions in eleven traced cases justified it on recruitment difficulty instead.
  3. Third parties were supplying an estimated 44% of spare parts across the client's own installed base, revenue the builder had never systematically pursued or even measured.
  4. Around 900 plants inside the service radius ran below fifteen cases per minute and had never automated palletizing, a population the sales organisation did not call on at all.
CLIENT PROFILE
A European palletizing systems builder with approximately 140 million dollars in annual revenue (client-reported, unverified by MMA), supplying food, beverage, and consumer goods plants across Western and Central Europe. The business was weighted heavily toward conventional layer palletizers and caged robotic cells, quoted equipment separately from integration, and ran service as a warranty function inside engineering.
STRATEGIC CHALLENGE
Order intake had been flat for three years while the market grew, and win rates on competitive tenders had fallen below a third. Management attributed the loss to Chinese price competition. The board wanted an independent view on whether price was genuinely the cause before approving a cost reduction programme aimed at matching imported system pricing.
MMA APPROACH
We reviewed forty-one lost tenders against what the winning supplier actually offered, separating price, lead time, integration scope, and service terms. Proposal documents were assessed for how the purchase was justified to the buyer. Service revenue and third-party parts leakage were quantified across the installed base, and the addressable plant population below fifteen cases per minute was sized within the client's service radius.
KEY FINDINGS
  1. Price was the decisive factor in fewer than a quarter of lost tenders; integration scope and fixed installed pricing decided considerably more of them than management had assumed.
  2. Every proposal reviewed justified the purchase on labour cost savings, while buyer capital submissions in eleven traced cases justified it on recruitment difficulty instead.
  3. Third parties were supplying an estimated 44% of spare parts across the client's own installed base, revenue the builder had never systematically pursued or even measured.
  4. Around 900 plants inside the service radius ran below fifteen cases per minute and had never automated palletizing, a population the sales organisation did not call on at all.
RECOMMENDED STRATEGY
Phase 1: Phase 1 (months one to six): rewrite proposals around production continuity and introduce fixed-price integrated packages on the standard robotic cell range. Phase 2: Phase 2 (months six to twenty): build a dedicated service organisation with guaranteed response contracts and recover parts revenue across the installed base. Phase 3: Phase 3 (months twenty to thirty-six): launch a fenceless collaborative cell offer with a short sales cycle aimed at the small plant population.
OUTCOME
The cost reduction programme was cancelled. Tender win rate recovered above forty percent within three quarters on fixed-price integrated proposals, service contract revenue roughly doubled, and the collaborative cell offer generated first orders from plants that had never bought automation before (client-reported, unverified by MMA).

Frequently Asked Questions

Foundational context covering the market sizes, CAGR, scope, country, region and competition that inform every finding below. This section is provided to cover basics and most often pre-purchase conversations, answered from the MMA Primary Research Dataset.

What is the current size of the North America & Europe Palletizers Market?

The market is valued at USD 2.15 billion in 2025, rising to USD 2.30 billion in 2026. Scope covers palletizing systems installed across North America and Europe at builder realised prices.

How large will the North America & Europe Palletizers Market be by 2036?

MMA forecasts USD 4.62 billion by 2036, an increase of USD 2.32 billion over the 2026 base. That represents an expansion multiple of 2.01 times across the forecast period.

What is the CAGR for the North America & Europe Palletizers Market 2026 to 2036?

The base case CAGR is 7.2%, with a bull case of 8.4% and a bear case of 6.0%. The historical rate from 2020 to 2025 was 6.0%, so the market is accelerating.

Which segment is growing fastest?

Collaborative palletizing cells at 10.8%, exactly 1.50 times the market rate. Fenceless safety-rated operation cuts the floor space needed to roughly a quarter of a caged robotic cell.

Who are the major companies in the North America & Europe Palletizers Market?

Krones, Columbia Machine, Fanuc, ABB, and KUKA lead on annual systems shipped into the two regions. The top five hold 31%, split between machinery builders and robot manufacturers.

Which country is growing fastest?

Mexico at 11.4%, driven by nearshoring food and consumer goods plant construction where greenfield lines specify robotic or collaborative palletizing almost by default. These are new installations rather than replacements.

Report Segmentation Architecture

The full report scope spans multiple orthogonal segmentation dimensions, with cross-tabulated demand data provided for each dimension pair. Coverage extends further to regional breakdowns, trend trajectories, and the competitive detail needed to support segment-level decision-making.

By Palletizing Architecture

  • Conventional Layer Palletizers
  • Articulated Robotic Palletizers
  • Gantry And Cartesian Palletizers
  • Collaborative Palletizing Cells
  • Mixed-Case Order-Building Palletizers
  • Bag And Sack Palletizers

By End-Use Industry

  • Food Processing And Bakery
  • Beverage Bottling And Canning
  • Consumer Packaged Goods
  • Chemicals, Agriculture And Building Materials
  • Grocery Distribution And Wholesale Fulfilment

By Sales Model

  • Direct Builder Sales To End User
  • Systems Integrator Channel
  • Robot Manufacturer Pre-Integrated Cells
  • Distributor And Reseller Networks
  • Aftermarket Parts And Service Contracts

By Region

  • Western Europe
  • North America
  • East Asia
  • Eastern Europe
  • South Asia and Pacific
  • Latin America
  • Middle East and Africa

Scope, Methodology, and Coverage

Every figure in this report is reproducible from documented input assumptions. The scope below maps the historical period, the forecast horizon, the segmentation dimensions, and the countries covered, alongside the underlying primary and qualitative methodology.
Historical Period
2020 to 2025
Forecast Period
2026 to 2036
Base Year
2025 (USD billions; MMA Primary Research Dataset, August 2026)
Market Definition
This market comprises palletizing systems shipped into and installed across North America and Europe, measured at builder realised prices including integration content supplied by the builder. Architecture coverage spans conventional layer palletizers with high-level and low-level infeed, articulated robotic palletizers, gantry and Cartesian systems, fenceless collaborative palletizing cells, mixed-case order-building systems, and bag and sack palletizers. Depalletizers, stretch and shrink wrappers, case erectors and sealers, conveying supplied independently of a palletizing system, pallets and slip sheets, warehouse management and control software, and installations outside the two covered regions fall outside scope.
Quantitative Units
USD billions (current prices); systems shipped per year; installed price per system; cases per minute throughput
Segmentation Dimensions
By Palletizing Architecture; By End-Use Industry; By Sales Model; By Region
Regions Covered
Western Europe, North America, East Asia, Eastern Europe, South Asia and Pacific, Latin America, Middle East and Africa
Countries Covered
USA, Canada, Mexico, Germany, Italy, France, Spain, UK, Netherlands, Belgium, Austria, Switzerland, Sweden, Denmark, Norway, Finland, Ireland, Portugal, Poland, Czechia, Slovakia, Hungary, Romania, Bulgaria, Croatia, Slovenia, Serbia, Greece, Turkey, Ukraine, and additional markets relevant to this sector
Key Companies Profiled
Krones, Columbia Machine, Fanuc, ABB, KUKA, Yaskawa, Kawasaki Heavy Industries, ProMach, Premier Tech, Möllers Group, BEUMER Group, Sidel, OCME, Fuji Yusoki, Okura Yusoki, Universal Robots, Honeywell Intelligrated, Schneider Packaging Equipment, Bastian Solutions, Fallas Automation
Quantitative Methodology
Primary survey, n=3,800 respondents, Q4 2025, six countries; demand-side model with trade association cross-validation
Qualitative Methodology
47 expert interviews, Q4 2025; applied to validate demand model assumptions, identify emerging dynamics, and assess competitive positioning
Report Format
PDF and XLSX data workbook (Word format preview document)
Publisher
Market Minds Advisory
Report Code
MMA-2026-CON-392
Published
August 2026
Contact
sales@marketmindsadvisory.com | www.marketmindsadvisory.com

Purchase the full North America & Europe Palletizers Market Report (2026 to 2036).

The full report sizes palletizing systems across six architectures, five end-use industries, five sales models, and thirty countries within North America and Europe. Manual palletizing vacancy rates are quantified by country and plant scale, since recruitment difficulty rather than labour cost now drives the purchase decision in most cases. Integration content as a proportion of total project cost is measured across architectures and builder types. Competitive profiling covers twenty companies on annual systems shipped into the two regions. The unautomated plant population below fifteen cases per minute is sized by country.
Manual palletizing vacancy rates quantified by country
Integration content measured as proportion of project cost
Unautomated small plant population sized by country
Aftermarket parts leakage assessed across builder installed bases
Pattern changeover times compared across competing architectures
Build origin mapped for systems installed in both regions

Built For The People Who Decide

From boardroom strategy to bench-side execution, this report is read cover-to-cover by leaders shaping the next decade of their industry, turning demand scenarios, market dynamics and valuation benchmarks into decisions.
CXOs/ Presidents/ VPs/ Managers
M&A and Corporate Development
Strategy Teams and R&D Heads
Procurement and Product Directors
Regulatory and Compliance Leaders
Investor Relations and Equity Analysts