

Market Minds Advisory
North America and Europe IBC Rental Business Market

North America and Europe IBC Rental Business Market: Competing against free collection, certification clocks and trip rate economics to 2036 

The competitor here is not container ownership. It is a collection service the customer pays nothing for, funded entirely by the value of the steel frame that comes back with it.

Lead Analyst

Bilal Shaikh

Published

September 2026

Make Smarter Decisions with Customized Research Insights

Request a free sample report and evaluate market opportunities, growth trends, and competitive dynamics relevant to your business needs.

2025 MARKET VALUE$3.6BMarket Size 2025
2036 FORECAST VALUE$6.8BBase Case , 2026 to 2036
CAGR 2026 TO 20366.0 %Bull 7.2% / Bear 4.8%
INCREMENTAL OPPORTUNITY$3.0BNet 10- year value creation
EXPANSION MULTIPLE1.79x2036 value over 2026 base
Strategic Levers
M&A Pipeline
Regional Outlook
Country Rankings
Competitive Intelligence
Segmental Deep-dive
Call-Us : 91 93563 13602

Executive Snapshot and Market Trajectory

Rental in this market does not compete against purchase. It competes against free, because reconditioning networks collect empty containers from customers at no charge and fund that collection out of the steel cage they recover. Rental penetration sits near 14% and has barely moved in a decade.
Where rental genuinely wins, it wins on obligations the user would rather not own. Stainless steel and specialty asset rental grows at 9.0%, half again the market rate of 6.0%, because a costly container used a few times a year makes no sense on anybody's balance sheet. Food and pharmaceutical grade rental follows at 8.4% on documented cleaning validation. Neither case rests on any cost advantage over ownership.
Western Europe holds 30% of value, more than any other region, because chemical industry density and short return distances made take-back networks viable there first. The economics everybody underestimates sit in the trip rate: a rented container completes about 4.2 filled cycles a year, and idle time at a customer site destroys returns faster than any pricing decision. Fleet size tells an investor almost nothing here. Idle containers carry full capital charge and earn nothing.
Market Definition
This report covers intermediate bulk container rental and associated service businesses, spanning standard composite IBC rental, UN-certified dangerous goods rental, food and pharmaceutical grade rental, stainless steel and specialty asset rental, reconditioned composite supply, and collection and take-back programmes. The market is assessed globally with North America and Europe as the analytical centre throughout, and value is measured at operator level on rental and service revenue. Excluded are outright container sales without any service commitment, drums and smaller packaging, flexible bulk bags, road tankers and ISO tank containers, and the resin or steel sold to container manufacturers.
Base Year Value
$3.6B in 2025 (MMA Primary Research Dataset, August 2026)
Forecast Period
2026 to 2036, eleven discrete annual values
CAGR
6.0% base case. Bull 7.2%. Bear 4.8%.
Fastest Growth Segment
Stainless Steel and Specialty Asset Rental: 9.0% CAGR
Fastest Growth Country
India: 9.2% CAGR
Fastest Growth Region
South Asia and Pacific: 8.0% CAGR
Largest Region
Western Europe: 30% of 2025 global value
Market Leaders
Schütz, Mauser Packaging Solutions, Greif, Time Technoplast and Werit Kunststoffwerke lead the market. Source: MMA Primary Research Dataset, July 2026.
Primary Survey
n=3,800 procurement and R&D decision-makers, Q4 2025, six countries
Methodology
Demand-side build-up, cross-validated against public data, 47 expert interviews

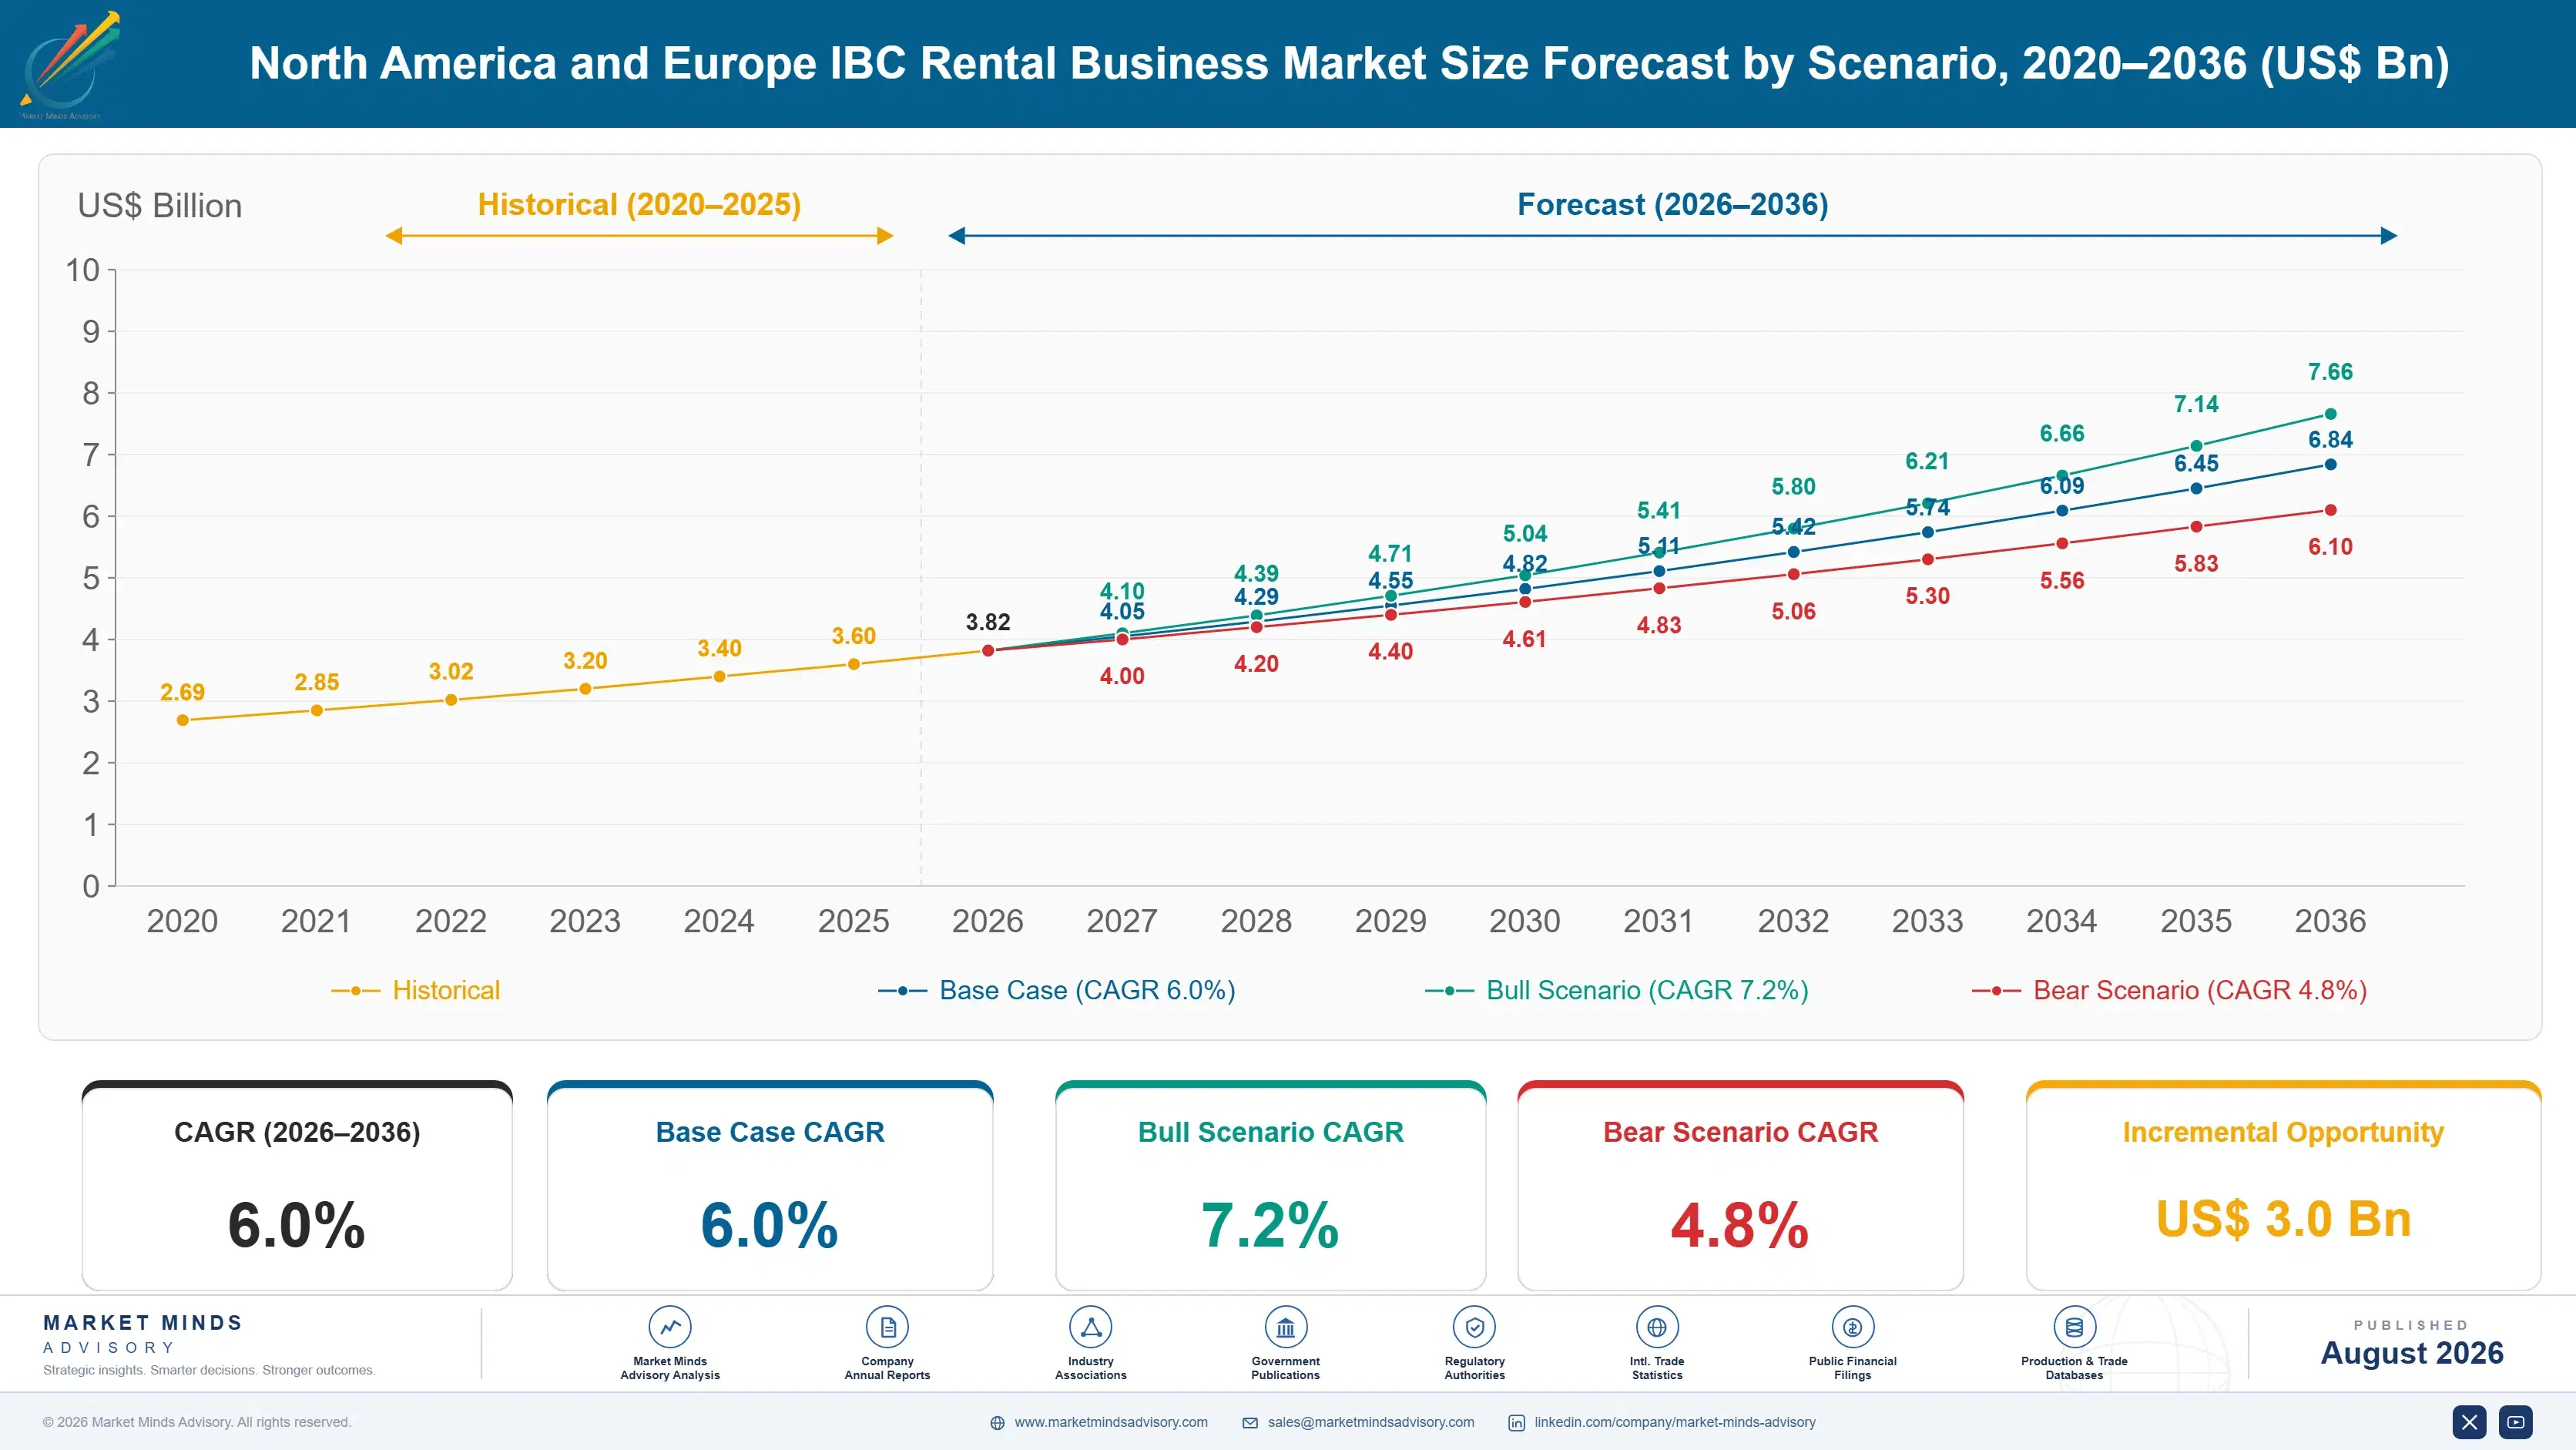
North America and Europe IBC Rental Business Market Forecast Scenarios

north-america-europe-ibc-rental-business-market-size-forecast-scenario-1787559295607
Growth ran at 4.6% between 2020 and 2025 and the composition mattered far more than the rate. Chemical and food production volumes recovered unevenly, steel prices swung enough to change what a recovered cage was worth, and collection network density kept improving across Europe. Rental penetration itself moved hardly at all, because the free take-back alternative improved at roughly the same pace as the rental proposition did.
The 6.0% base case rests on three mechanisms. Stainless steel and specialty asset rental at 9.0%, which is the clearest case for renting anything in this market. Food and pharmaceutical grade rental at 8.4% as cleaning validation documentation becomes a compliance burden users decline to own. And Indian growth at 9.2%, the fastest of any country, on chemical manufacturing expansion and formalising container logistics together. Collection density there remains low.
The 7.2% bull case is dangerous goods certification tightening further, which would push more shippers to transfer a compliance clock they do not want to administer. The 4.8% bear case is steel prices falling enough to make free collection even more attractive, since a cheaper cage does not change collection cost but does change what a network can afford to give away.

Competing Against Free Collection

Anybody analysing this business as rental versus ownership has already missed the point. A composite intermediate bulk container is a steel cage with a working life around 25 years, holding a plastic bottle that gets replaced when the container is reconditioned. The cage is the durable asset and it is worth enough that reconditioning networks will collect empty containers from a customer's yard at no charge whatsoever, then rebottle and resell them. Rental therefore competes against a free service. Penetration sits near 14%, which is what a rental proposition achieves against a free alternative.
TOP-FIVE CONCENTRATION56%Combined position across supply held by the leading network operators
DANGEROUS GOODS SERVICE LIFE5 yearsPeriod a certified container may carry regulated liquid cargo
PERIODIC INSPECTION INTERVAL2.5 yearsTime between mandatory inspections on certified transport containers
RENTAL PENETRATION RATE14%Share of containers in service under rental rather than ownership
ANNUAL TRIP RATE4.2Times a rented container completes a filled delivery cycle
CAGE REUSE LIFE25 yearsWorking life of the steel frame across successive bottle replacements
Where rental wins, it wins on obligations rather than on economics. Containers certified for regulated liquid cargo carry a service life of five years with mandatory inspection at two and a half, which makes certification a wasting asset that has to be tracked container by container. A shipper owning a fleet administers that clock itself. Renting transfers it.
The number that decides operator returns is trip rate. A rented container completes roughly 4.2 filled cycles a year, and every week it sits idle in a customer's yard is revenue that does not exist.
"Operators keep telling me their competition is the customer buying containers. It isn't. The competition is a truck that turns up, takes the empties away for nothing and leaves. If you cannot explain what the customer gets that free collection does not give them, you do not have a rental business."
Director, Industrial Packaging and Returnable Systems Practice · MMA Packaging and Converting Materials Practice · August 2026

Market Trends

Free take-back collection holds rental penetration persistently low

Reconditioning networks collect empty composite containers from customers without charge, because a recovered steel cage with roughly 25 years of working life is worth more than the collection run costs. That makes the realistic alternative to renting a container genuinely free rather than merely cheaper. Penetration has consequently sat near 14% for a decade and has not responded to rental pricing at all. Commercially this means an operator must sell something collection cannot provide, and price competition against a free service is not a strategy anybody wins. The alternative improves whenever steel prices rise.
Market Impact: Segment compounds at 8.4% annually

Certification clocks push dangerous goods users toward rental

Containers certified for regulated liquid cargo carry a service life of five years with mandatory periodic inspection at two and a half, which makes certification status a wasting asset tracked container by container rather than fleet by fleet. Owning that obligation means administering inspection schedules, retiring units on time and proving it under audit. Renting transfers the whole burden to an operator who does it at scale. Growth at 7.2% in this segment reflects shippers deciding they would rather not run a compliance register they gain nothing from. Audit evidence rather than the container itself is the product.
Market Impact: Indian demand compounds at 9.2%

Market Opportunities and Growth Drivers

Cleaning validation records become a food and pharmaceutical requirement

Food and pharmaceutical users increasingly have to produce documented cleaning validation for every container that touches their product, with traceable records tied to specific units rather than to a process description. Growth at 8.4% follows that requirement rather than any cost advantage, since renting usually costs more per trip than owning would. Operators running validated wash facilities with per-container records sell exactly what an auditor asks for. Users building the same capability internally find the capital and the documentation burden considerably harder than expected. Several have abandoned the attempt after starting it.
Market Impact: Trip rate held near 4.2

Chemical manufacturing expands across Asian and Indian markets

Indian growth at 9.2% leads every country in this market, driven by specialty chemical manufacturing expansion and by container logistics formalising away from informal drum handling. Chinese and Southeast Asian chemical output continues growing on a much larger base with rental penetration well below Western levels. Neither market has the collection network density that made take-back viable in Europe, which paradoxically leaves more room for rental to establish itself before free collection arrives and closes the opportunity down. Formalising container logistics is itself a driver. Rented and tracked containers replace handling that produced no service revenue at all.
Market Impact: Cage life runs 25 years

Market Restraints and Challenges

Idle containers at customer sites destroy operator returns

A rented container completes roughly 4.2 filled cycles annually, and the difference between a good fleet and a poor one is almost entirely dwell time rather than pricing. The root cause is that a customer holding an empty container faces no cost pressure to return it promptly unless the contract creates one. Commercially this means fleet size tells you almost nothing about earnings, since an underused asset still carries full capital charge. Operators are addressing it with demurrage terms and container tracking that shows exactly where dwell time accumulates. Fleet size alone reveals nothing about earnings here.
Market Impact: Penetration stuck near 14%

Steel price movement changes what free collection can afford

Take-back collection is funded by the recovered value of the steel cage, so falling steel prices reduce what a reconditioning network can afford to spend collecting containers. The root cause is that the whole free service rests on a commodity value nobody in the chain controls. Commercially this makes the competitive landscape move with a market unrelated to packaging demand, which is disorienting for operators planning against chemical output. Some networks now hedge steel exposure or charge for collection in low-price periods, which briefly improves the rental case. Planning against chemical output misses the variable entirely.
Market Impact: Transfers a 5 year certification clock
4 additional market trends, 3 additional growth drivers, and 2 additional restraints and challenges are covered in the full report. Contact sales@marketmindsadvisory.com to access the complete intelligence.

Segment CAGR and Growth Architecture

Value is classified here by asset and service class, since what an operator actually sells differs enormously between a standard composite container and a validated stainless vessel. Container construction, end customer industry and contract structure are each handled separately in the framework below, because one asset class frequently serves several industries under quite different terms.
north-america-europe-ibc-rental-business-market-market-share-analysis-1787559296149

Stainless Steel and Specialty Asset Rental

Growing at 9.0%, half again the market rate, stainless steel and specialty containers are the clearest case for renting anything in this business. The asset costs many times what a composite container does, a single user typically needs it a handful of times a year, and the idle capital between uses is money doing nothing on somebody's balance sheet. Pooling that asset across several users is straightforwardly better for everyone involved. Cleaning between products is demanding and often requires validated procedures, which favours an operator running dedicated facilities over a user attempting it in a corner of the plant. Utilisation across a pool comfortably exceeds what any single user achieves alone.
CAGR 9.0%

Food and Pharmaceutical Grade Rental

Food and pharmaceutical users must increasingly produce documented cleaning validation for containers touching their product, with records traceable to individual units rather than to a general process description. Growth at 8.4% follows that documentation requirement rather than any cost saving, because renting usually costs more per trip than ownership. Operators running validated wash facilities with per-container records supply precisely what an auditor asks to see. Users who attempt to build equivalent capability internally consistently underestimate both the capital required and the ongoing documentation discipline that keeping the validation current actually demands. Records referencing a specific operator's facilities also make switching expensive, since revalidation is required, which turns these into the most durable relationships in the whole market.
CAGR 8.4%
Full segment breakdown across 6 segments available in the complete report.

Regional Architecture and Country Demand Map

Western Europe holds 30% of value, more than any other region and above the standard band, because chemical industry density and short return distances made collection networks viable there before they worked anywhere else. North America follows at 28% on chemical and food manufacturing scale.

Western Europe

At 30% this region sits above the standard band and leads the market, because chemical manufacturing density and short return distances made take-back collection networks economic here well before they were viable anywhere else. Schütz and Werit built the model from German chemical industry demand and it spread across the continent from there. Packaging waste regulation reinforced it by making disposal of used containers commercially unattractive. Rental penetration is consequently lowest here in relative terms, since the free alternative is most developed. Growth at 4.5% is the weakest on this table for exactly that reason. Dangerous goods certification administration is nonetheless a growing service line. Validated washing capability among regional operators is the deepest anywhere.
Share: 30% | CAGR: 4.5% (2026 to 2036)

North America

Chemical and food manufacturing scale supports the second largest regional pool, though longer return distances make collection network economics harder than in Europe and leave more room for rental to compete. Mauser and Greif operate substantial reconditioning and service networks alongside Schütz. Dangerous goods certification administration is a meaningful driver here, since shippers face audit obligations they would rather transfer to an operator. Food grade cleaning validation requirements are tightening across the region. Growth at 6.5% sits above the market rate and reflects both service demand and manufacturing expansion. Container tracking adoption is further advanced here than in Europe, driven by the longer distances that make dwell time more costly. Demurrage terms appear more commonly in contracts.
Share: 28% | CAGR: 6.5% (2026 to 2036)
Regional intelligence for 5 additional markets available in the complete report: East Asia, South Asia and Pacific, Latin America, Middle East and Africa, Eastern Europe. Contact sales@marketmindsadvisory.com.
north-america-europe-ibc-rental-business-market-country-cagr-analysis-1787559296664

Where Rental Actually Beats Collection

Four moves matter for an operator whose principal competitor gives its own service away at no charge whatsoever. Two concern selling obligations the customer would rather not carry, which is the only ground where a paid service reliably wins, and the other two concern the fleet economics that decide whether winning that customer earns anything at all.

Sell the certification clock, not the container

Containers approved for regulated liquid cargo carry a five year service life with mandatory inspection at two and a half years, tracked unit by unit rather than across a fleet. A shipper owning containers administers that register itself, retires units on schedule and proves compliance under audit. Renting transfers the entire obligation. That is a genuine service free collection cannot provide, and it is why the dangerous goods segment grows at 7.2% while overall penetration sits at 14%. Audit evidence rather than the steel is what the shipper is actually buying here.
Market Impact: Transfers a 5 year certification obligation in full

Build validated washing that auditors will accept

Food and pharmaceutical users must produce cleaning validation traceable to individual containers, and growth at 8.4% follows that requirement rather than any cost saving. Operators running validated facilities with per-container records sell exactly what an auditor asks to see, which no collection service offers. Users who try to build the same capability internally underestimate both the capital and the documentation discipline involved, and several have abandoned the attempt after discovering what maintaining validation actually requires. Records tied to a named facility also make switching costly, since revalidation follows any change of operator.
Market Impact: Serves a segment that is growing at 8.4%

Price dwell time rather than pricing the rental

A container completes roughly 4.2 filled cycles a year, and the gap between a strong fleet and a weak one is dwell time at customer sites rather than the day rate charged. A customer sitting on empty containers faces no pressure to return them unless the contract creates it. Demurrage terms combined with container tracking that shows precisely where dwell accumulates raise trip rate without any pricing increase at all, and that flows straight into returns. Customers accept demurrage far more readily when the tracking evidence is unarguable and visible to both sides.
Market Impact: Lifts a trip rate currently stuck at 4.2

Enter markets before free collection arrives

Rental penetration is lowest where collection networks are most developed, which means the opening for a paid service closes as those networks mature. Indian growth at 9.2% leads this market partly because collection density there is low. Establishing rental relationships and contract terms before a reconditioning network makes collection free is considerably easier than displacing it afterwards, and the same pattern is visible across Southeast Asia and parts of Latin America today. The same window is currently open across Southeast Asia and parts of Latin America, and it will not stay open indefinitely once reconditioning networks reach viable density there.
Market Impact: Enters markets sitting below the 14% penetration rate

Who Controls the Margin Pool

Five operators hold 56% of this market, measured on rental and service revenue at operator level, the basis used throughout this section. Concentration is high because the business is a logistics network rather than a manufacturing one, and network density compounds: more collection points make each route cheaper, which funds more collection points. New entrants face that arithmetic from a standing start. Density compounds against any newcomer.
Competition runs on four dimensions. Network density, which decides collection cost and therefore what an operator can afford to offer free. Certification administration capability for regulated cargo, which is the obligation shippers most want transferred. Validated washing for food and pharmaceutical users who must produce per-container records. And tracking systems, since dwell time rather than day rate governs whether a fleet earns anything at all.

Rankings shift toward operators with validated washing and container-level tracking, and toward those entering markets where collection networks have not yet closed the opening. European operators hold the densest networks alongside the slowest growth on this table. Asian participants hold manufacturing cost positions that make container ownership cheap and rental correspondingly harder to sell against.
north-america-europe-ibc-rental-business-market-company-positioning-matrix-1787559297176

Competitive Moat and Risk Dimensions

SCHÜTZ

Moat: Network density and reconditioning

The company built the collection and reconditioning model from German chemical industry demand and operates the densest network anywhere, which lets it collect empty containers at no charge and still profit from the recovered steel cage. That density compounds, because each additional collection point lowers route cost and funds further expansion, and a competitor starting fresh faces the reverse arithmetic.
SCHÜTZ

Risk: Free collection caps rental growth

The same free collection model that dominates the region also holds rental penetration near 14%, and Western Europe grows at 4.5%, the weakest on this table. Growth sits in markets where collection density is low and rental can establish itself first. Operators entering those markets early build positions that a mature network model does not naturally reach.
MAUSER PACKAGING SOLUTIONS

Moat: Combined manufacturing and services

Operating container manufacture alongside reconditioning and rental services gives the company control over both ends of the asset life, which matters when the steel cage funds collection and the plastic bottle is the consumable. That combination also supports dangerous goods certification administration at scale across a large North American footprint where return distances are long.
MAUSER PACKAGING SOLUTIONS

Risk: Long haul collection economics

North American return distances make collection network economics considerably harder than in Europe, which raises the cost of the free service and simultaneously raises the cost of rental logistics. Operators with validated washing and container tracking capture value that pure network scale does not reach. Dwell time rather than route density increasingly decides fleet returns here.

Players Tracked

Prominent Players

Schütz
Mauser Packaging Solutions
Greif
Time Technoplast
Werit Kunststoffwerke

Other Key Players

Brambles
Hoover Ferguson
Thielmann
Snyder Industries
Sotralentz Packaging
Auer Packaging
Nilkamal
Pyramid Technoplast
Industrial Container Services
Bulk Lift International
Berry Global
SCHÄFER Container Systems
Nittel
Balmer Lawrie
Jinan Chenghao

Recent Developments

MARCH 2025

An operator extended container-level tracking across its rental fleet

A rental operator completed deployment of container-level tracking across its fleet, aiming to identify where dwell time accumulates at customer sites and support demurrage terms in contracts. This was internal operational investment rather than any acquisition, merger or partnership with another company. Coverage now extends across the whole fleet.
Signal: Trip rate rather than day rate governs fleet returns, and tracking is what makes dwell time contractually visible
JULY 2025

A chemical shipper transferred its certified fleet to rental

A specialty chemical manufacturer moved its owned fleet of dangerous goods certified containers onto a rental arrangement, citing the administrative burden of tracking inspection and retirement dates across individual units. This was a service contract rather than any equity transaction between the parties involved. Inspection records transferred with the units.
Signal: Shippers are transferring the certification register rather than the containers, which is the service rental genuinely sells
NOVEMBER 2025

An operator commissioned validated washing for pharmaceutical customers

A rental operator commissioned dedicated validated washing capacity with per-container cleaning records, targeting pharmaceutical and food customers required to produce documentation traceable to individual units. This was organic capital investment rather than any acquisition or joint venture arrangement. Records are generated per container per wash cycle rather than per batch.
Signal: Documentation traceable to a specific container is what free collection cannot offer and auditors increasingly demand

What Governs Fleet Returns

Container capital recovery accounts for roughly 38% of operator cost and it is the line that dwell time attacks directly, since an idle asset carries the same charge as a working one. Transport for collection and delivery adds around 27% and rises sharply with return distance. Washing, inspection and certification administration take about 18%. Steel and resin enter through replacement rather than directly.
Steel prices moved sharply through 2021 and 2022 and that mattered here in an unusual way, since the recovered cage value funds free collection and therefore sets what rental competes against. Greif noted steel and resin cost movement across its industrial packaging operations in its Annual Report 2022. Operators with owned fleets purchased before the increase held an advantage, and several delayed fleet expansion until replacement costs normalised again.

The disadvantage falls on operators with thin network density, and it appears as transport cost rather than as any asset disadvantage. A collection route serving few customers costs the same to run as one serving many, so route economics deteriorate quickly below a density threshold. Regional operators face this most acutely, and it is why the market concentrates rather than fragmenting the way asset-light businesses usually do.
north-america-europe-ibc-rental-business-market-cost-volatility-analysis-1787559297371

Write demurrage terms and enforce them with tracking data

Capital recovery at roughly 38% of cost is charged whether a container moves or sits, so dwell time at customer sites is the single largest destroyer of fleet returns. Demurrage terms only work when tracking data shows exactly where containers are and for how long. Customers accept the terms far more readily when the evidence is available and unarguable.

Build route density before expanding fleet size

Transport near 27% of cost falls sharply with collection density, since a route serving many customers costs little more than one serving few. Adding containers into a thin network multiplies the asset base without improving route economics at all. Operators who sequence density ahead of fleet growth reach profitability at considerably smaller scale. Sequencing matters more than scale here.

Load validated washing across several regulated accounts

Validated washing costs substantially more than standard cleaning and requires documentation discipline that a single customer rarely justifies on its own. Spreading that capacity across multiple food and pharmaceutical accounts changes the economics entirely. Operators running validation for one customer carry capital that better-loaded competitors recover across a wider regulated book. Regulated accounts cluster geographically, which helps considerably.

Portfolio Architecture for Margin Defence

Margin separates on what obligation the operator absorbs rather than on fleet scale, which is not how asset rental usually works. Standard composite rental runs at gross margins in the mid teens because free collection sets the ceiling on what anybody can charge. Reconditioned supply and take-back programmes run modestly better, funded partly by recovered cage value. Dangerous goods certified rental runs considerably higher on administration transferred. Validated food and pharmaceutical rental and stainless specialty assets run highest of all.
The tension is that standard composite volume builds the network density that everything else depends on, while the obligations business earns the returns. An operator cannot skip the density and go straight to validated washing, because route economics collapse below a threshold. Several regional operators have discovered this by attempting exactly that sequence and finding the transport cost impossible to recover.

High-value pools sit in certified dangerous goods administration, validated washing and stainless specialty assets. Standard composite rental is where free collection sets the price and no operator escapes it. An operator without an obligations business is running a haulage company with containers on it, and the margin reflects exactly that.

Volume / Commodity-Adjacent

Standard composite container rental and reconditioned supply, priced against a collection service the customer can obtain free. The eight-point range separates operators with dense collection routes from those running thin networks over longer distances.
Gross Margin: 13%-21%

Premium / Certified

Dangerous goods certified rental where inspection scheduling, retirement tracking and audit evidence transfer to the operator. The twelve-point spread reflects administration capability and fleet certification currency rather than any container difference.
Gross Margin: 24%-36%

Sustainability / Regulatory / Next-Generation

Validated food and pharmaceutical rental and stainless specialty asset pooling. The twenty-point range is wide because validation depth, cleaning complexity and asset value vary enormously between individual customer programmes and product types.
Gross Margin: 34%-54%
north-america-europe-ibc-rental-business-market-portfolio-architecture-1787559297869

High-value Sub-segments and Strategic Watch-out

Stainless Specialty Asset Pooling

Compounding at 9.0% because an expensive container used a handful of times a year is capital sitting idle. Pooling across users is straightforwardly better for everyone, and cleaning complexity favours dedicated operator facilities. Pool utilisation comfortably beats single user rates. Cleaning between products favours dedicated facilities.
Gross Margin: 36%-54%

Validated Food and Pharmaceutical Rental

Growing at 8.4% on cleaning validation traceable to individual containers rather than to a process description. Users who attempt this internally underestimate the capital and the ongoing documentation discipline required. Revalidation on switching makes these relationships unusually durable once won. Auditors ask for exactly this evidence.
Gross Margin: 34%-48%

Dangerous Goods Certified Rental

Shippers transfer a five year certification clock with inspection at two and a half years rather than administering it themselves. That register is the actual product, and free collection cannot supply it. Administering that register across a fleet is what shippers are paying to avoid.
Gross Margin: 24%-36%

Standard Composite Rental

The network volume, priced against collection the customer gets free and funded by recovered cage value. Manage this for route density rather than for margin that competition against free will never allow. Route density decides everything in this tier, and thin networks bleed transport cost that no pricing decision recovers.
Gross Margin: 13%-21%

How Rental Revenue Renews

Revenue renews per trip rather than per contract, which makes this a throughput business dressed as an asset business. A container earns when it moves filled and earns nothing while it waits, so revenue tracks customer production rates and return discipline together rather than the size of the fleet deployed. Operators who report fleet growth without trip rate are describing capital deployment rather than earnings, and the distinction becomes very clear during a demand slowdown.
Stickiness runs through documentation depth by vertical. A pharmaceutical customer whose cleaning validation records reference a specific operator's facilities faces revalidation to switch, which makes those relationships extremely durable. Dangerous goods users transferring a certification register face a similar administrative barrier. Standard chemical users switch on price whenever a competitor quotes lower, and frequently switch to free collection instead of to another rental operator entirely.

The buyer has shifted from logistics and procurement toward quality and compliance functions in the growing segments. Container rental was a distribution cost negotiated on day rate. In regulated applications it now involves people who care about audit evidence, validation currency and inspection records, and who will pay a premium rather than administer any of it themselves.
north-america-europe-ibc-rental-business-market-end-use-penetration-index-1787559298357

Where To Place The Bet

These are among the four positions where our research anticipates prominent divergence between winners and laggards over the coming forecast period. Each is grounded in the demand model, the regulatory perimeter, and the announced capacity pipeline.
01 / OBLIGATION TRANSFER SELLING

Sell the compliance register, never the container

Containers approved for regulated liquid cargo carry a five year service life with mandatory inspection at two and a half years, administered unit by unit rather than across a fleet, and a shipper owning containers must run that register and prove it under audit. Renting transfers the entire obligation, which is something no free collection service is able to provide to anybody. That is why dangerous goods rental grows at 7.2% while overall penetration has sat near 14% for a decade without moving.
02 / VALIDATED WASHING CAPABILITY

Build documentation an auditor will accept unchallenged

Food and pharmaceutical users must now produce cleaning validation traceable to individual containers rather than to a general process description, and growth at 8.4% follows that requirement rather than any cost saving, since renting typically costs more per trip than ownership does. Operators running validated facilities with per-container records supply exactly what an auditor asks to see. Users attempting to build equivalent capability internally consistently underestimate both the capital involved and the ongoing documentation discipline required to keep validation current.
03 / DWELL TIME MANAGEMENT

Charge for idle days rather than raising rates

A rented container completes roughly 4.2 filled cycles a year and the difference between a strong fleet and a weak one is almost entirely dwell time at customer sites rather than the day rate being charged for it. A customer holding empty containers faces no pressure at all to return them unless the contract deliberately creates that pressure. Demurrage terms supported by container tracking data raise trip rate without any price increase, and every additional cycle flows directly into fleet returns.
04 / PRE-NETWORK MARKET ENTRY

Arrive before collection becomes free there

Rental penetration is always lowest wherever collection networks are most developed, because a free alternative caps what any paid service can charge and eventually caps whether it exists at all. Indian country growth at 9.2% leads this market partly because collection density there remains low today. Establishing rental relationships and contract terms before a reconditioning network makes collection free is far easier than displacing that network afterwards, and the same window is currently open across Southeast Asia and parts of Latin America.

Engagement Snapshot From the Field

A live engagement with an industry participant carrying material or product regulatory and market exposure ahead of a defining policy shift, showing how our research translates into a defensible multi-year portfolio strategy.
MARKET MINDS ADVISORY · CLIENT ENGAGEMENT SUMMARY
North America and Europe IBC Rental Business Producer Strategic Portfolio Review and Transition Roadmap 2026·Investment Scenario on North America and Europe IBC Rental Business Exposure Evaluation 2025-26
CLIENT PROFILE
A European intermediate bulk container rental operator running a fleet of roughly 44,000 units (client-reported, unverified by MMA), serving chemical and food manufacturers across three countries. Validated washing capability did not exist. Container tracking covered only a portion of the fleet. Contracts carried no demurrage terms of any kind. Fleet had grown for three consecutive years.
STRATEGIC CHALLENGE
Fleet had grown for three years while revenue per container fell, and management proposed further fleet expansion to defend share against a competitor offering free collection. Nobody had measured trip rate or established where containers actually spent their time between filled deliveries. Neither figure had ever been measured, and the expansion case rested on assumptions nobody had tested.
MMA APPROACH
MMA measured trip rate and dwell time across the tracked portion of the fleet and extrapolated across the remainder using customer return records. Validated washing investment was costed against regulated customer requirements in the existing book. Contract terms were benchmarked against operators charging demurrage, and route density economics were assessed by region.
KEY FINDINGS
  1. Trip rate averaged well below the operator's own assumption, and roughly a third of fleet capital was tied up in containers sitting idle at customer sites for extended periods.
  2. Fleet expansion had been compensating for poor dwell discipline rather than serving demand growth, which meant more containers would have produced the same revenue at higher capital cost.
  3. Four existing food customers were already requesting cleaning validation records the operator could not supply, and two had begun evaluating competitors who could provide them.
  4. Collection route density in one country sat below the threshold where transport economics work, and that region had been consuming margin generated in the other two.
CLIENT PROFILE
A European intermediate bulk container rental operator running a fleet of roughly 44,000 units (client-reported, unverified by MMA), serving chemical and food manufacturers across three countries. Validated washing capability did not exist. Container tracking covered only a portion of the fleet. Contracts carried no demurrage terms of any kind. Fleet had grown for three consecutive years.
STRATEGIC CHALLENGE
Fleet had grown for three years while revenue per container fell, and management proposed further fleet expansion to defend share against a competitor offering free collection. Nobody had measured trip rate or established where containers actually spent their time between filled deliveries. Neither figure had ever been measured, and the expansion case rested on assumptions nobody had tested.
MMA APPROACH
MMA measured trip rate and dwell time across the tracked portion of the fleet and extrapolated across the remainder using customer return records. Validated washing investment was costed against regulated customer requirements in the existing book. Contract terms were benchmarked against operators charging demurrage, and route density economics were assessed by region.
KEY FINDINGS
  1. Trip rate averaged well below the operator's own assumption, and roughly a third of fleet capital was tied up in containers sitting idle at customer sites for extended periods.
  2. Fleet expansion had been compensating for poor dwell discipline rather than serving demand growth, which meant more containers would have produced the same revenue at higher capital cost.
  3. Four existing food customers were already requesting cleaning validation records the operator could not supply, and two had begun evaluating competitors who could provide them.
  4. Collection route density in one country sat below the threshold where transport economics work, and that region had been consuming margin generated in the other two.
RECOMMENDED STRATEGY
Phase 1: Phase one: halt fleet expansion and introduce demurrage terms at contract renewal, supported by extending tracking coverage across the remaining untracked containers. Phase 2: Phase two: invest in validated washing capability for the regulated customers already asking for it, before those accounts move to competitors who can supply the records. Phase 3: Phase three: exit or restructure the thin-density country rather than continuing to fund its transport costs from margin earned elsewhere.
OUTCOME
Trip rate improved materially within two quarters of demurrage terms taking effect, with no fleet addition at all. Validated washing is commissioned and has retained both at-risk accounts. The thin-density operation has been restructured, and the client reports return on fleet capital improving substantially (client-reported, unverified by MMA).

Frequently Asked Questions

Foundational context covering the market sizes, CAGR, scope, country, region and competition that inform every finding below. This section is provided to cover basics and most often pre-purchase conversations, answered from the MMA Primary Research Dataset.

What is the current size of the North America and Europe IBC Rental Business Market?

The global market was valued at USD 3.6 billion in 2025, rising to an estimated USD 3.82 billion in 2026. Western Europe holds the largest regional share at 30% of value.

How large will the North America and Europe IBC Rental Business Market be by 2036?

MMA forecasts USD 6.83 billion by 2036 under the base case, an expansion multiple of 1.79 times the 2026 value. That represents USD 3.01 billion of incremental value.

What is the CAGR for the North America and Europe IBC Rental Business Market 2026 to 2036?

The base case runs at 6.0% compound annual growth between 2026 and 2036, with a bull case at 7.2% and a bear case at 4.8%. Historical growth from 2020 to 2025 was 4.6%.

Which segment is growing fastest?

Stainless steel and specialty asset rental leads at 9.0%, half again the market rate, because expensive containers used occasionally suit pooling. Food and pharmaceutical rental follows at 8.4%.

Who are the major companies in the North America and Europe IBC Rental Business Market?

Schütz, Mauser Packaging Solutions, Greif, Time Technoplast and Werit Kunststoffwerke hold 56% of the market. Collection network density rather than fleet size sustains those positions.

Which country is growing fastest?

India leads at 9.2%, driven by specialty chemical manufacturing expansion and by container logistics formalising away from the informal drum handling that previously dominated the market.

Report Segmentation Architecture

The full report scope spans multiple orthogonal segmentation dimensions, with cross-tabulated demand data provided for each dimension pair. Coverage extends further to regional breakdowns, trend trajectories, and the competitive detail needed to support segment-level decision-making.

By Asset and Service Class

  • Standard Composite IBC Rental
  • UN-Certified Dangerous Goods Rental
  • Food and Pharmaceutical Grade Rental
  • Stainless Steel and Specialty Asset Rental
  • Reconditioned Composite Supply
  • Collection and Take-Back Programmes

By End-Use Industry

  • Commodity and Specialty Chemicals
  • Food and Beverage Manufacturing
  • Pharmaceutical and Life Sciences
  • Paints, Coatings and Adhesives
  • Agricultural Inputs and Crop Protection
  • Lubricants and Industrial Fluids

By Contract Structure

  • Per-Trip Rental Agreements
  • Fixed-Term Fleet Leasing
  • Managed Pool Arrangements
  • Reconditioning Service Contracts
  • Free Collection Programmes

By Region

  • North America
  • Western Europe
  • East Asia
  • South Asia and Pacific
  • Latin America
  • Middle East and Africa
  • Eastern Europe

Scope, Methodology, and Coverage

Every figure in this report is reproducible from documented input assumptions. The scope below maps the historical period, the forecast horizon, the segmentation dimensions, and the countries covered, alongside the underlying primary and qualitative methodology.
Historical Period
2020 to 2025
Forecast Period
2026 to 2036
Base Year
2025 (USD billions; MMA Primary Research Dataset, August 2026)
Market Definition
The market comprises intermediate bulk container rental and associated service businesses, including standard composite IBC rental, UN-certified dangerous goods rental, food and pharmaceutical grade rental, stainless steel and specialty asset rental, reconditioned composite supply, and collection and take-back programmes, delivered under per-trip, fixed-term, managed pool, service contract and free collection arrangements. The market is assessed globally with North America and Europe as the analytical centre, and value is measured at operator level on rental and service revenue. Outright container sales without service commitment, drums and smaller packaging, flexible bulk bags, road tankers and ISO tank containers, and raw materials sold to container manufacturers fall outside scope.
Quantitative Units
USD billions (current prices); containers in managed service; USD per trip by asset and service class
Segmentation Dimensions
By Asset and Service Class; By End-Use Industry; By Contract Structure; By Region
Regions Covered
North America, Western Europe, East Asia, South Asia and Pacific, Latin America, Middle East and Africa, Eastern Europe
Countries Covered
Germany, France, Netherlands, Belgium, Italy, Spain, United Kingdom, Sweden, Switzerland, Austria, United States, Canada, Mexico, Brazil, Argentina, Colombia, China, Japan, South Korea, Taiwan, India, Thailand, Malaysia, Indonesia, Australia, Poland, Czechia, Romania, Saudi Arabia, South Africa
Key Companies Profiled
Schütz, Mauser Packaging Solutions, Greif, Time Technoplast, Werit Kunststoffwerke, Brambles, Hoover Ferguson, Thielmann, Snyder Industries, Sotralentz Packaging, Auer Packaging, Nilkamal, Pyramid Technoplast, Industrial Container Services, Bulk Lift International, Berry Global, SCHÄFER Container Systems, Nittel, Balmer Lawrie, Jinan Chenghao
Quantitative Methodology
Primary survey, n=3,800 respondents, Q4 2025, six countries; demand-side model with trade association cross-validation
Qualitative Methodology
47 expert interviews, Q4 2025; applied to validate demand model assumptions, identify emerging dynamics, and assess competitive positioning
Report Format
PDF and XLSX data workbook (Word format preview document)
Publisher
Market Minds Advisory
Report Code
MMA-2026-PAC-216
Published
August 2026
Contact
sales@marketmindsadvisory.com | www.marketmindsadvisory.com

Purchase the full North America and Europe IBC Rental Business Market Report (2026 to 2036).

The full report sizes the global intermediate bulk container rental and service market to 2036 across six asset and service classes and seven regions, with North America and Europe as the analytical centre and value measured at operator level. It treats free take-back collection as the actual competitor rather than container ownership, which is the correction most analysis of this business needs. Competitive analysis covers 20 operators on one consistent revenue basis, with moat and risk assessment for the two leaders. Trip rate and dwell time economics are modelled explicitly by region. Four quantified revenue levers close the analysis.
Six-class asset and service sizing with individual growth rates
Free collection economics modelled against rental proposition value
Trip rate and dwell time quantified across regional fleet operations
Certification and validation obligations sized as service revenue
Twenty-operator competitive map on one consistent revenue basis
Four quantified revenue levers with commercial impact ranges

Built For The People Who Decide

From boardroom strategy to bench-side execution, this report is read cover-to-cover by leaders shaping the next decade of their industry, turning demand scenarios, market dynamics and valuation benchmarks into decisions.
CXOs/ Presidents/ VPs/ Managers
M&A and Corporate Development
Strategy Teams and R&D Heads
Procurement and Product Directors
Regulatory and Compliance Leaders
Investor Relations and Equity Analysts