Market Minds Advisory
North America Drone Services Market

North America Drone Services Market: North America Drone Services: Waiver Position, Inspection Records And The Business That Was Never About Flying

Anyone can fly a drone over a transmission line, and almost nobody can produce an inspection record an insurer, a regulator and a utility will all three accept afterward without any argument.

Lead Analyst

Published

September 2026

Make Smarter Decisions with Customized Research Insights

Request a free sample report and evaluate market opportunities, growth trends, and competitive dynamics relevant to your business needs.

2025 MARKET VALUE$7.2BMarket Size 2025
2036 FORECAST VALUE$29.9BBase Case , 2026 to 2036
CAGR 2026 TO 203613.8 %Bull 15.1% / Bear 12.5%
INCREMENTAL OPPORTUNITY$21.6BNet 10- year value creation
EXPANSION MULTIPLE3.64x2036 value over 2026 base
Strategic Levers
M&A Pipeline
Regional Outlook
Country Rankings
Competitive Intelligence
Segmental Deep-dive
Call-Us : 91 93563 13602

Executive Snapshot and Market Trajectory.

Flying was never the business and the industry took years to accept it. What a utility pays for is a defensible inspection record that survives a regulator, an insurer and a rate case. The flight is the cheap part of producing one. Everyone learned this expensively.
Utility and energy asset inspection grows fastest at 20.7%, because wildfire liability turned vegetation and conductor inspection from a maintenance preference into something no operator can defer. Extended range approvals changed the unit economics underneath that, since one operator supervising several aircraft along a corridor is a different cost structure from one pilot per flight. Data processing now carries 44% of contract value. That share of the value goes to whoever processes the imagery.
Concentration is low at 38% and consolidating steadily. Single-operator businesses could not carry insurance, waiver administration and analysis capability at enterprise scale, and enterprise buyers stopped contracting with anyone who could not. Foreign aircraft procurement restrictions added a fleet cost that small operators absorbed worst of all. Consolidation in this market happened through procurement requirements rather than through anything anybody would recognise as an actual competition at all.
Market Definition
Revenue from commercial uncrewed aircraft services performed within North America, covering utility and energy asset inspection, public safety and emergency response operations, construction and site progress documentation, agriculture and crop management services, survey, mapping and geospatial work, and media and commercial imaging. Includes the data processing and analysis delivered as part of a service engagement. Excludes cargo delivery operations, aircraft and sensor manufacture, software licensed without an accompanying service, and defence operations flown by armed forces.
Base Year Value
$7.2B in 2025 (MMA Primary Research Dataset, August 2026)
Forecast Period
2026 to 2036, eleven discrete annual values
CAGR
13.8% base case. Bull 15.1%. Bear 12.5%.
Fastest Growth Segment
Utility and Energy Asset Inspection: 20.7% CAGR
Fastest Growth Country
India: 15.8% CAGR
Fastest Growth Region
South Asia and Pacific: 15.8% CAGR
Largest Region
North America: 62% of 2025 global value
Market Leaders
Zeitview, Volatus Aerospace, SkySpecs, PrecisionHawk and Percepto lead on commercial drone service revenue generated within the region. Source: company annual reports and MMA Primary Research Dataset, July 2026.
Primary Survey
n=3,800 procurement and R&D decision-makers, Q4 2025, six countries
Methodology
Demand-side build-up, cross-validated against public data, 47 expert interviews

North America Drone Services Market Forecast Scenarios

north-america-drone-services-market-size-forecast-scenario-1788025511916
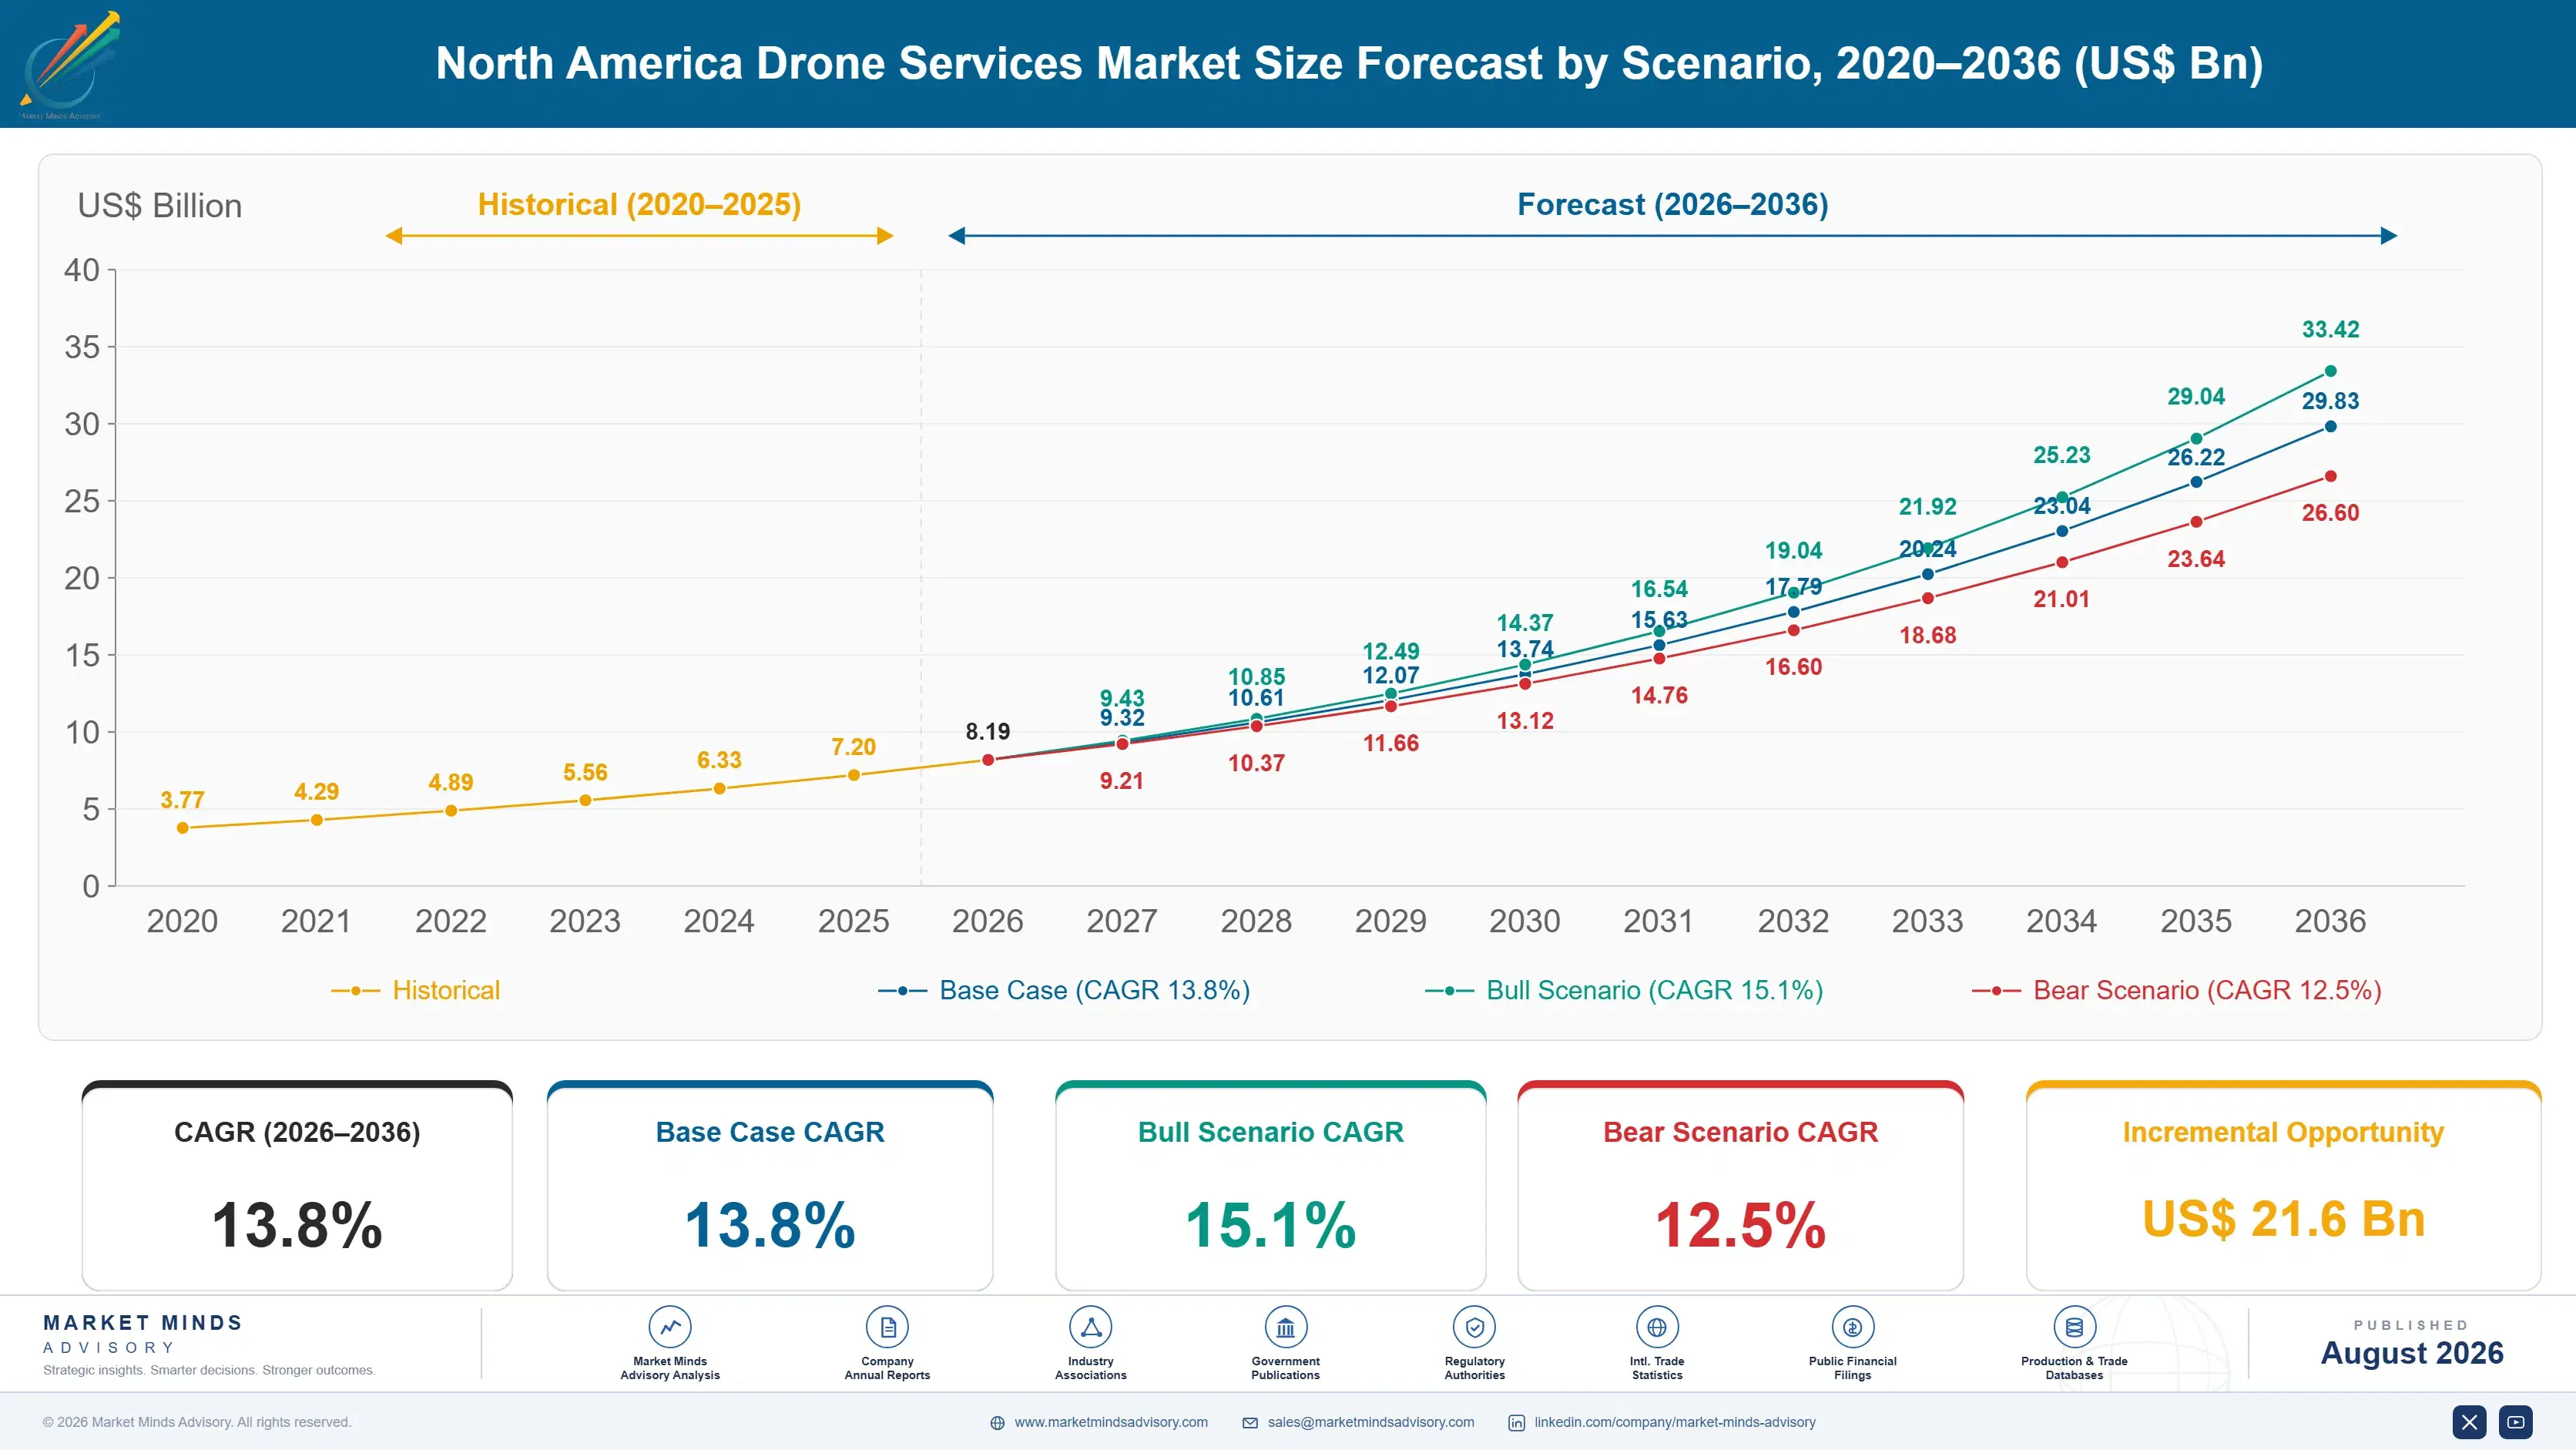
Between 2020 and 2025 the industry stopped being a flying business and became a data one. Enterprise buyers consolidated fragmented supplier lists onto providers who could carry insurance, manage waivers and deliver analysis, and hundreds of single-operator firms exited quietly. Remote identification compliance added administrative burden that small operators felt most. Revenue compounded near 12.4%, with the composition changing considerably more than the total did.
Three mechanisms carry the base case. Wildfire and storm liability has made utility inspection non-deferrable across an enormous asset base. Extended range approvals are converting one-pilot-per-flight economics into supervised multi-aircraft operations along fixed corridors. And public agency fleet replacement under foreign aircraft restrictions is pulling agencies toward contracted services rather than owned fleets they can no longer cheaply operate. None of the three requires a new aircraft or a technical advance of any kind.
The bull catalyst is a final rule permitting routine extended range operation without individual waivers, which would remove the single largest administrative cost in this market. The bear risk is an accident over people during a corridor inspection, since the waiver framework rests on a safety record rather than on any demonstrated engineering margin. The framework is thin.

Flying Is Not The Business

The founding assumption of this industry was that flying a sensor over an asset was the valuable act. It never was. A utility inspecting a transmission corridor needs a record that identifies a defect, dates it, locates it and survives a regulator, an insurer and a rate case years later. Producing that record is where 44% of contract value sits, and the flight itself is the cheap part.
MARKET CONCENTRATION CR538%Share of regional service revenue held by leading providers
COST PER INSPECTED MILEUSD 118Typical transmission corridor rate under current operating practice
DATA PROCESSING SHARE44%Portion of contract value from analysis rather than flying
EXTENDED RANGE WAIVERS3,100Active approvals permitting flight beyond the operator's visual range
FLIGHTS PER OPERATOR14Average sorties one person supervises across a working day
FLEET REPLACEMENT REQUIREMENT71%Share of public agency aircraft affected by procurement restrictions
Wildfire liability is what made the demand non-deferrable. Vegetation encroachment and conductor condition stopped being maintenance preferences once utilities began carrying enormous exposure for fires traced to their equipment, and inspection at around USD 118 per mile is inexpensive against that. Extended range approvals then changed the economics underneath, since one operator supervising 14 sorties along a corridor produces a different cost structure from one pilot per flight.
Consolidation followed both. Enterprise buyers stopped contracting with operators who could not carry insurance, administer waivers and deliver analysis, which removed hundreds of small firms from supplier lists without any competitive event occurring. Foreign aircraft procurement restrictions then imposed fleet replacement across roughly 71% of public agency aircraft. Small operators absorbed that worst, and several of them simply stopped.
"The companies that survived were not the best pilots. They were the ones who understood that a utility is buying evidence for a future rate case, and that a photograph without provenance is worth nothing to anybody making that argument."
Director, Uncrewed Systems Services Practice · MMA Commercial Aviation Services Practice · August 2026

Market Trends

Extended Range Approvals Rewrote Service Unit Economics

Around 3,100 active approvals now permit flight beyond an operator's visual range, and the commercial effect is larger than the operational one. One person supervising 14 sorties along a fixed corridor replaces a model requiring a pilot present for every flight, which changes cost per inspected mile rather than merely extending capability. Providers who built operations around supervised multi-aircraft working hold a cost position that single-flight operators cannot approach at any scale. Corridor work is where the growth sits, and it is precisely the work single-flight economics cannot serve profitably.
Market Impact: Costs USD 118 per inspected mile
Buyers Consolidated Onto Providers Who Carry Enterprise Obligations

Enterprise procurement stopped contracting with operators unable to carry insurance limits, administer waiver portfolios and deliver analysis at contracted service levels, which removed hundreds of small providers from supplier lists without any competitive event taking place. The requirement was administrative rather than technical, and it proved decisive anyway. Providers who built compliance and analysis capability early inherited work that better pilots lost. Consolidation continues on exactly this basis. Enterprise buyers reduced supplier lists from dozens of names to perhaps 3 or 4 in most categories, and the survivors were rarely the best operators in any technical sense.
Market Impact: Affects 71% of agency fleets

Market Opportunities and Growth Drivers

Wildfire Liability Made Utility Inspection Non-Deferrable

Utilities carrying exposure for fires traced to their own equipment cannot treat vegetation and conductor inspection as a deferrable maintenance line, which converted a discretionary spend into an obligation across an enormous asset base. Inspection at roughly USD 118 per mile is trivially cheap against the alternative exposure. That is why utility and energy work grows at 20.7% against a market rate of 13.8%. No other vertical carries a comparable forcing mechanism behind its demand. The forcing mechanism is legal exposure rather than any operating requirement, which makes it unusually durable.
Market Impact: Manages 3,100 separate approvals

Agency Fleet Restrictions Push Buyers Toward Contracted Services

Procurement restrictions on covered foreign aircraft affect roughly 71% of public agency fleets, and replacement at compliant pricing costs considerably more than the equipment being retired. Agencies facing that arithmetic increasingly contract services rather than operate owned fleets they can no longer afford to refresh. The shift moves revenue from hardware into services permanently rather than temporarily. Providers holding compliant fleets captured that demand while competitors were still arguing about the policy. A policy decision moved revenue permanently from equipment budgets into service budgets, which very few commercial developments ever manage.
Market Impact: Raises fleet cost across 71%

Market Restraints and Challenges

Waiver Administration Consumes Margin Nobody Prices For

Maintaining roughly 3,100 extended range approvals across a national footprint requires staff, documentation and renewal management that scale with operating area rather than with revenue. The root cause is that approvals are granted per operation and per area rather than to an operator once. Commercially it means administrative cost rises faster than flight revenue does. Mitigation runs through portfolio-level waiver management, standardised operating documentation, and positioning for the rulemaking that would replace individual approvals entirely. None of those mitigations removes the burden until a rule replaces the individual approval process.
Market Impact: Supervises 14 sorties per operator

Compliant Aircraft Cost Far More Than Restricted Alternatives

Procurement restrictions removed the cheapest capable aircraft from roughly 71% of agency fleets and from any provider serving them, and compliant equivalents cost several times more for comparable capability. The root cause is that manufacturing scale sits with producers now excluded rather than with permitted ones. Commercially it raises fleet capital and depreciation against unchanged contract pricing. Mitigation runs through longer fleet life, sensor reuse across airframes, and contract terms passing compliant equipment cost to the buyer. Every one of those routes accepts a higher fleet cost as permanent rather than temporary.
Market Impact: Cut supplier lists to 4 providers
4 additional market trends, 3 additional growth drivers, and 2 additional restraints and challenges are covered in the full report. Contact sales@marketmindsadvisory.com to access the complete intelligence.

Segment CAGR and Growth Architecture

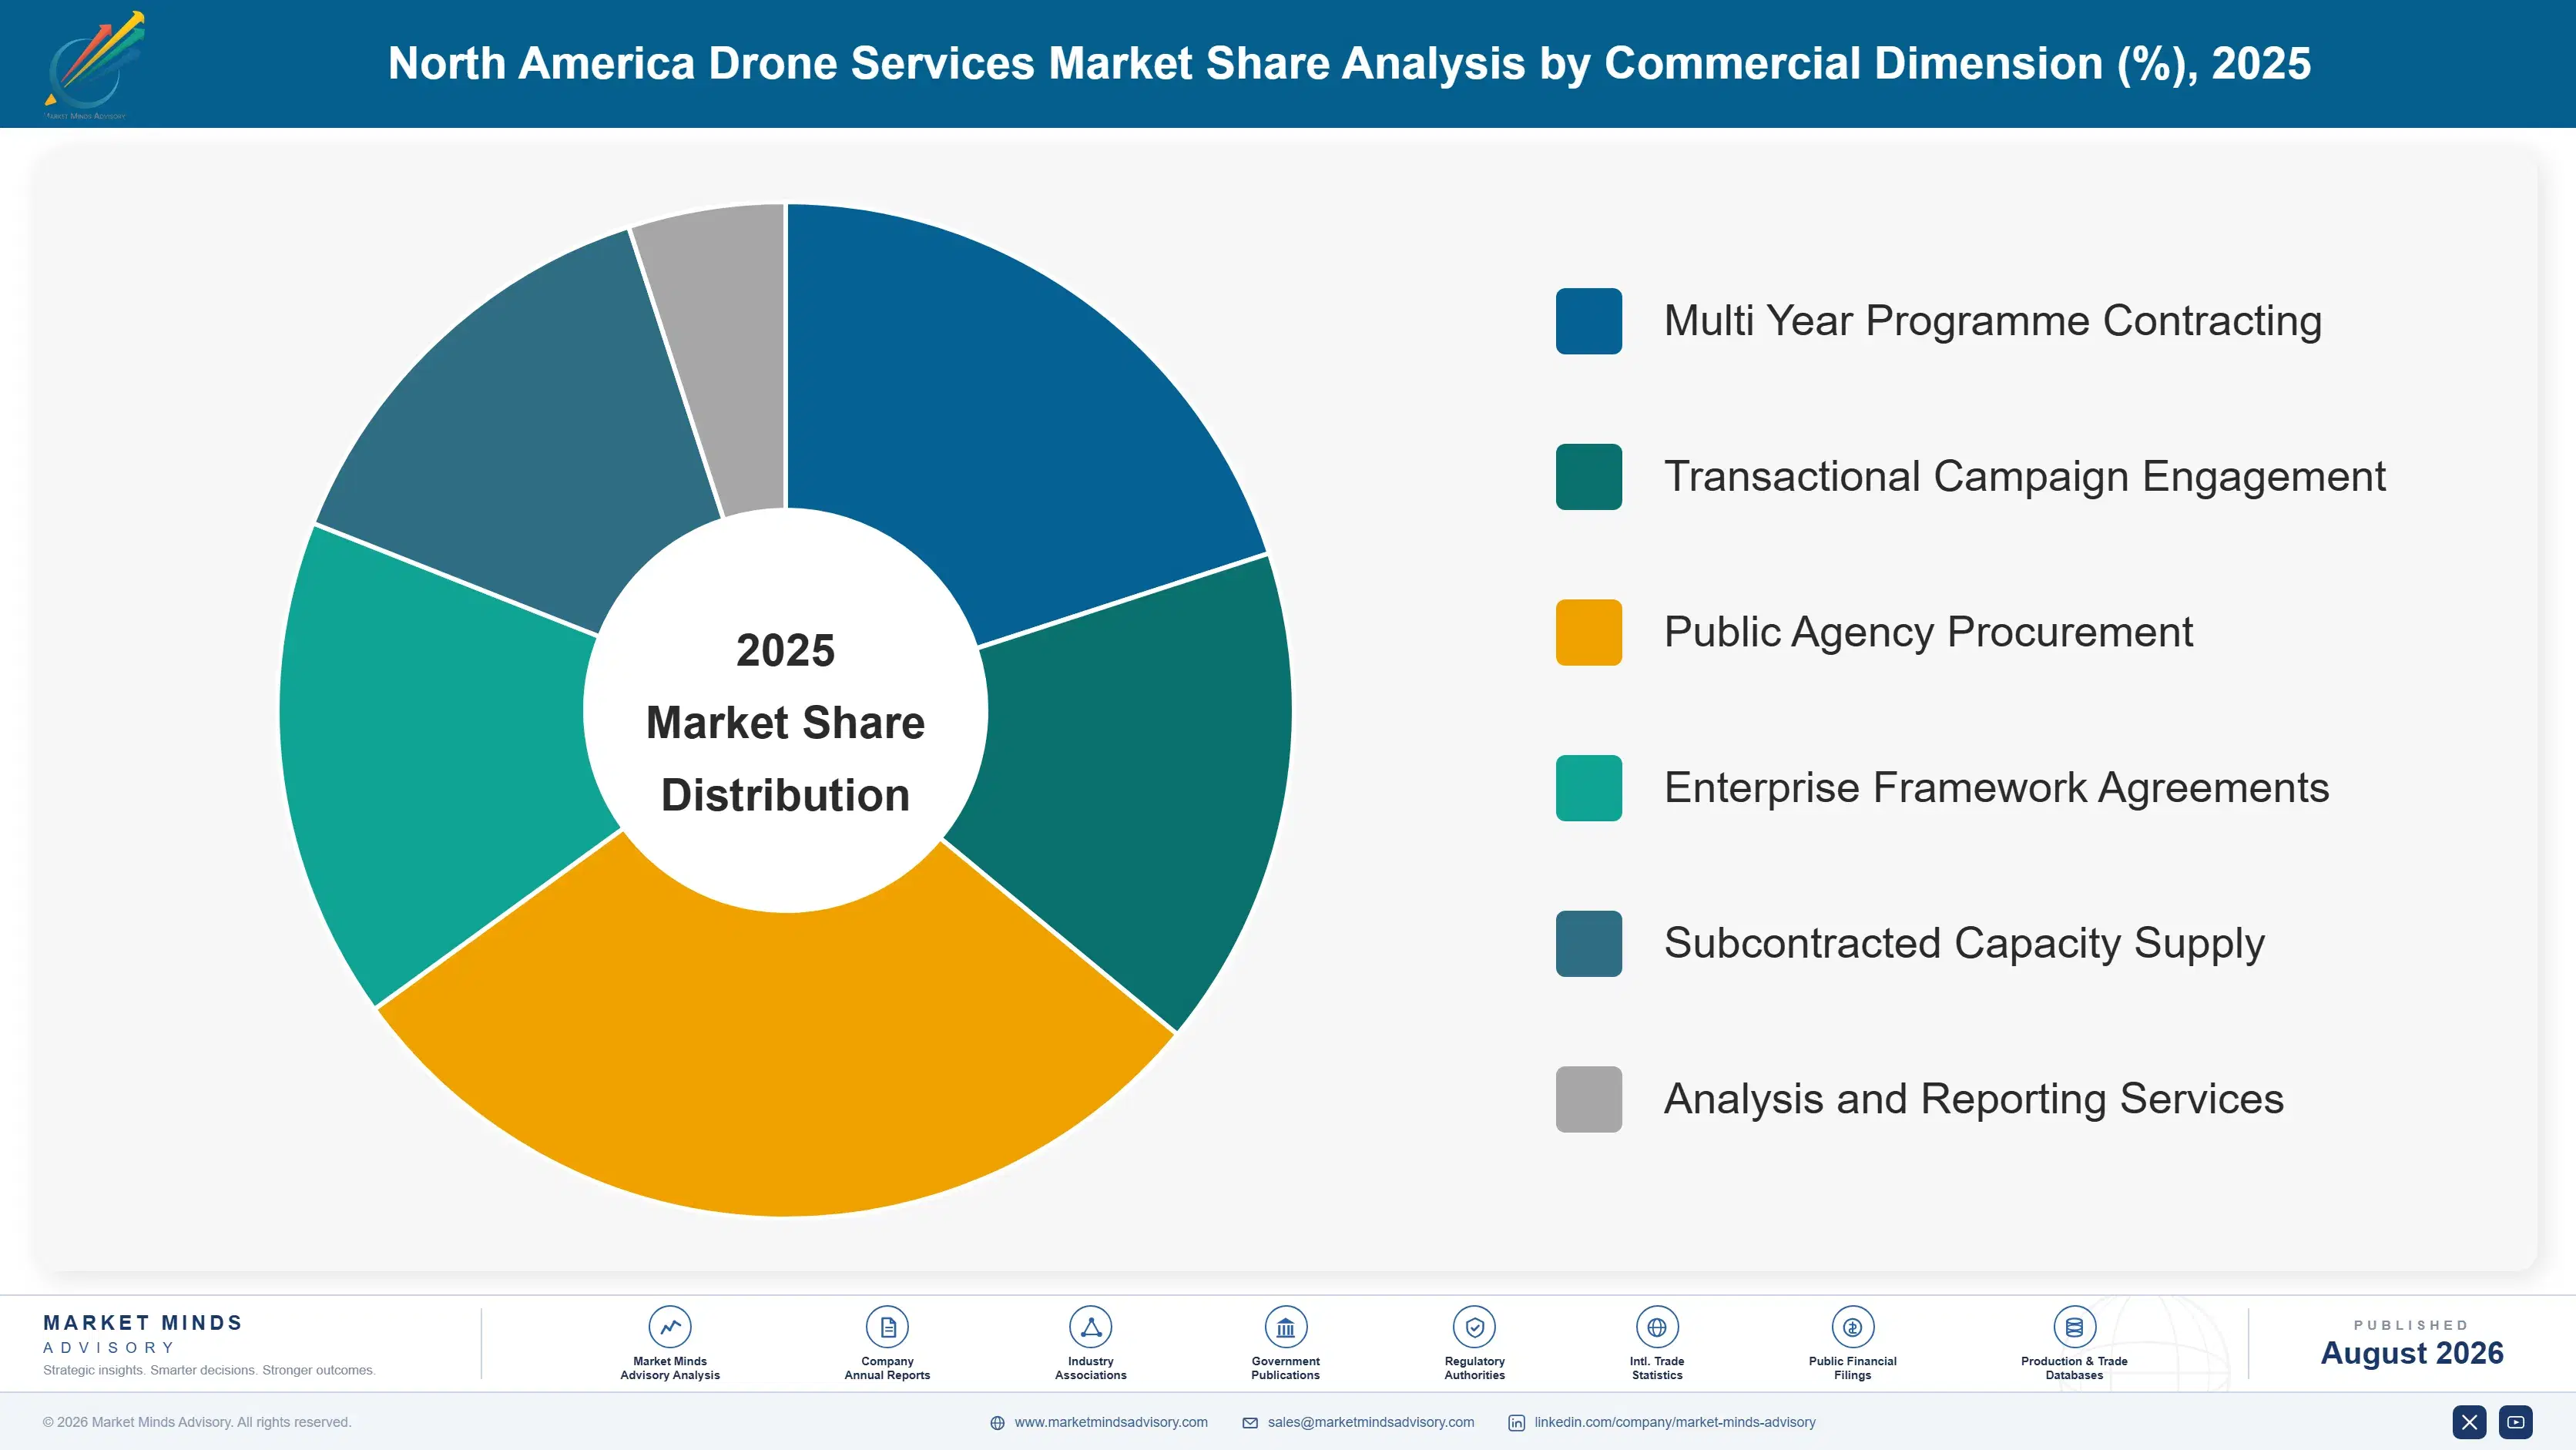
Segmentation follows service application, because each carries a different buyer, a different regulatory posture and a different balance between flying and analysis. Six applications describe the market completely, from media work where the flight is most of the value through to utility inspection where the record produced afterward is very nearly all of it.
north-america-drone-services-market-market-share-analysis-1788025512472

Utility and Energy Asset Inspection

The fastest application grows at 20.7%, half again the market rate of 13.8%, and liability rather than technology explains all of it. Utilities carrying exposure for fires traced to their equipment cannot defer vegetation and conductor inspection, and at roughly USD 118 per inspected mile the work is cheap against what it protects against. Extended range approvals made corridor inspection economic by letting one operator supervise 14 sorties rather than flying each one. The deliverable is a dated, located, defensible record rather than imagery, which is why providers without analysis capability keep losing this work to those who have it. Nobody in this vertical is buying photographs from anybody any more.
CAGR 20.7%

Public Safety and Emergency Response Operations

Public safety work grows at 17.4% and is being reshaped by procurement policy more than by operational demand. Restrictions on covered foreign aircraft affect roughly 71% of agency fleets, and compliant replacements cost several times more for comparable capability, which pushes agencies toward contracted services rather than owned fleets. Response applications span search operations, scene documentation, tactical overwatch and post-incident survey work. The buyers are numerous, individually small and constrained by budget cycles rather than by requirement, which makes this the most administratively demanding vertical in the market to serve profitably at any scale. Contract values are small individually and the administrative effort behind each one is not at all small.
CAGR 17.4%
Full segment breakdown across 6 segments available in the complete report.

Regional Architecture and Country Demand Map

This is a regionally scoped market, so the demand sits within North America. The seven-region split therefore describes where the aircraft, sensors, analysis capability and competing operating models supporting that demand actually originate rather than distributing the underlying revenue. The distinction matters for reading these shares.

North America

Out-of-band note: this region holds 62% against a band of 22 to 32% because the market is defined as services performed within it, so the home region necessarily dominates. Utility inspection anchors demand across an enormous transmission and distribution asset base carrying wildfire and storm liability that no operator can defer. Public safety agencies number in the thousands and buy in small, budget-constrained increments. Construction, agriculture and survey work fill the rest, and consolidation onto enterprise-capable providers continues across every one of them. Nothing in this region resembles a mature service market yet, and the consolidation now under way will settle who serves it for the next decade or more to come.
Share: 62% | CAGR: 13.6% (2026 to 2036)

Western Europe

Out-of-band note: the 10% share reflects sensor supply, analysis capability and competing operating models rather than demand located here. European sensor and payload manufacturers supply a substantial share of what flies in North American service fleets, particularly in thermal and multispectral imaging. Providers with European origins operate directly in the region and bring corridor inspection methods developed under different regulatory conditions. Analysis and defect classification software developed here reaches North American providers through licensing arrangements rather than through direct competition for service contracts. That arrangement suits both sides, since European firms reach a large market without carrying waiver administration and North American providers acquire capability they would take years to build themselves.
Share: 10% | CAGR: 12.2% (2026 to 2036)
Regional intelligence for 5 additional markets available in the complete report: East Asia, South Asia and Pacific, Latin America, Middle East and Africa, Eastern Europe. Contact sales@marketmindsadvisory.com.
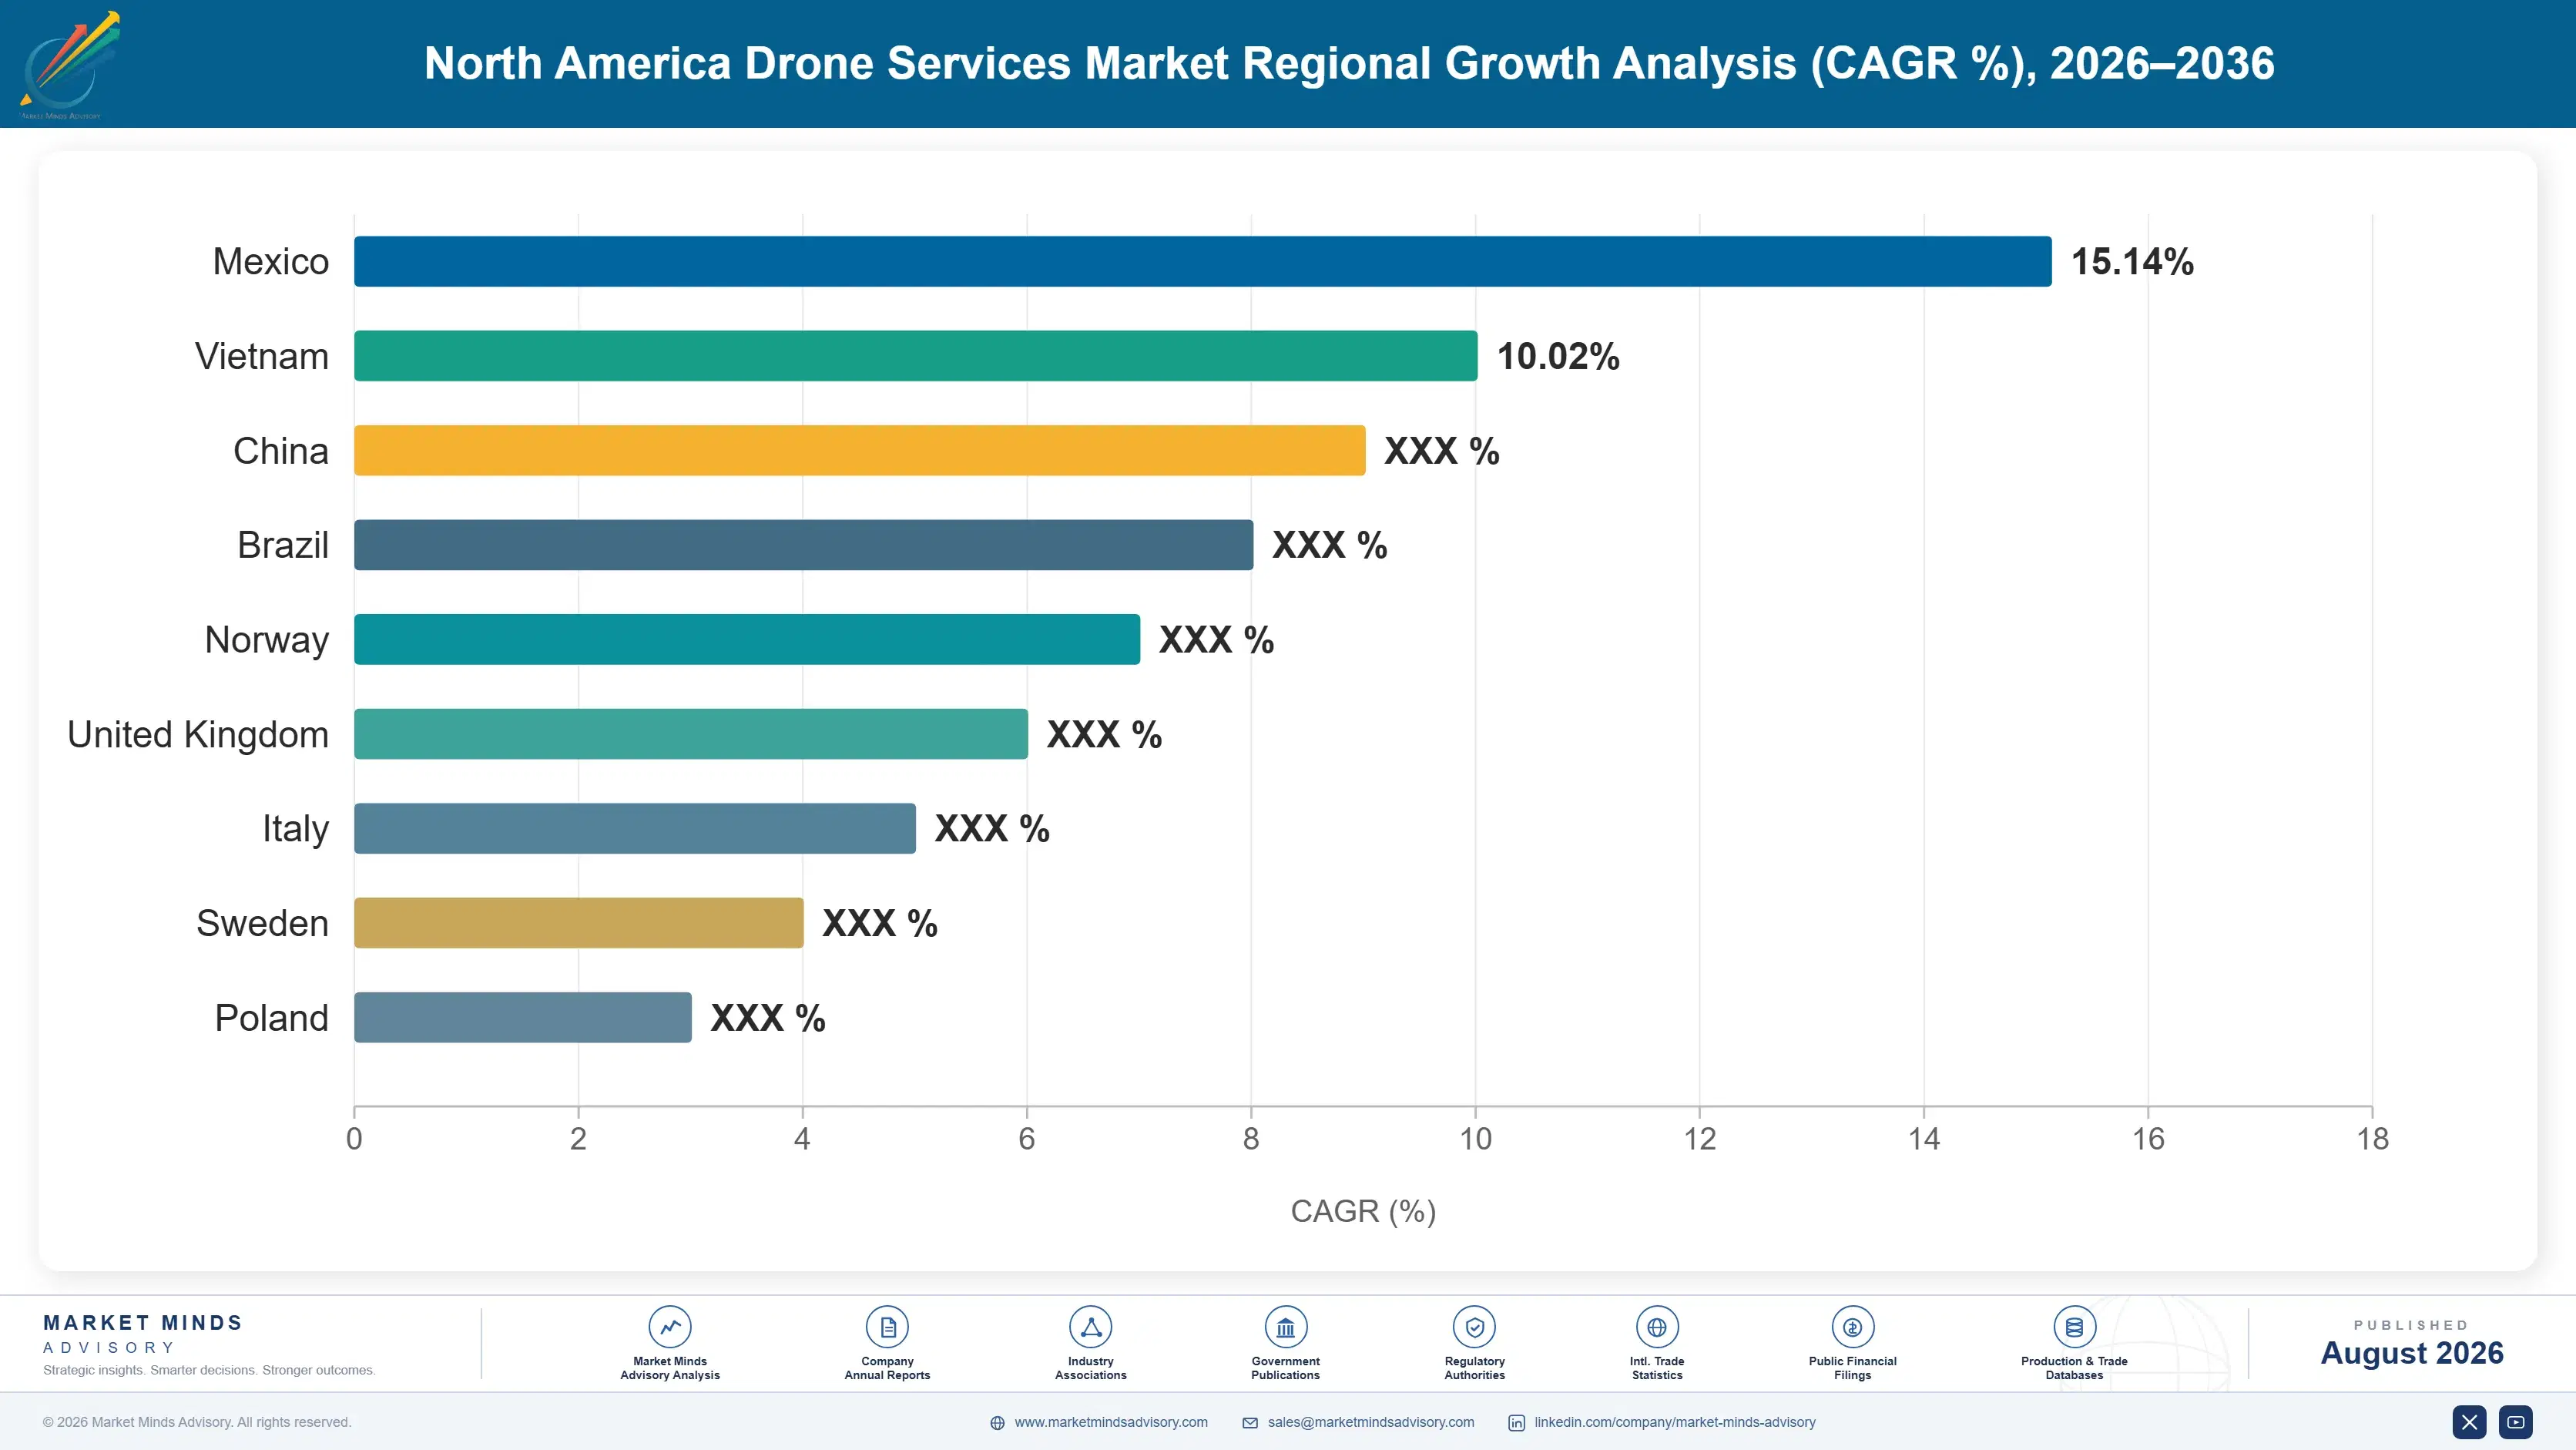
north-america-drone-services-market-country-cagr-analysis-1788025513003

Where Drone Service Margin Sits

Four levers work on deliverable quality, waiver position and contract structure rather than on flight capability, which decides very few competitions now. Analysis ownership, supervised operations, waiver portfolio management and multi-year contracting each address something a provider controls directly today. None of the four requires buying a single additional aircraft, which is rather the point.

Own The Analysis Rather Than Selling Flight Hours

Around 44% of contract value sits in producing a dated, located, defensible record rather than in flying, and providers pricing on flight hours hand that share to whoever processes the imagery afterward. Enterprise buyers want a defect list they can act on and defend in a rate case, not a folder of photographs. Building classification and reporting capability costs perhaps 3 million dollars. Providers who did it years ago are winning work that better pilots keep losing to them. A single utility programme repays that investment comfortably within its first year.
Market Impact: Captures the full 44% of processed contract value

Convert Operations To Supervised Multi Aircraft Working

Extended range approvals let one person supervise 14 sorties along a corridor instead of flying each one, which changes cost per inspected mile rather than merely extending range. Providers still operating one pilot per flight cannot match that structure at any volume, and corridor work is where the growth sits. Conversion requires operations design, documentation and training rather than new aircraft. Most providers hold the approvals already and have not restructured the operation behind them. The approvals are already held, which is what makes the omission so surprising in practice.
Market Impact: Cuts operator cost across 14 supervised daily sorties

Manage Waivers As A Portfolio Not Individually

Maintaining roughly 3,100 approvals across a national footprint consumes staff and documentation effort that scales with operating area rather than with revenue, and most providers administer each one separately. Portfolio-level management with standardised operating documentation reduces that burden by 30 to 40 percent at very little cost. It also positions a provider to convert quickly when rulemaking replaces individual approvals. Administrative discipline is unglamorous and it decides which providers can operate nationally at all. Providers administering 3,100 approvals one at a time are paying for staff their competitors do not need.
Market Impact: Reduces waiver administration burden by roughly 35% overall

Contract Utility Inspection On Multi Year Terms

Wildfire and storm liability makes utility inspection non-deferrable, which means buyers will commit to multi-year programmes that other verticals never offer. A 5 year corridor programme supports fleet investment, staffing and analysis capability that transactional work cannot justify at all. Providers still quoting inspection campaign by campaign are leaving both revenue certainty and pricing on the table. The buyer prefers the longer term as well, since supplier continuity improves the record they are actually buying. Campaign pricing typically runs 12 to 18 percent below programme rates anyway on comparable work.
Market Impact: Secures inspection programmes running 5 years or longer

Who Controls the Margin Pool

Concentration is low at around 38% across the five largest providers measured on commercial service revenue generated within the region, and it is rising steadily rather than dramatically. The industry began with thousands of single-operator businesses and is consolidating onto firms able to carry insurance, administer waivers and deliver analysis. That consolidation happened through procurement requirements rather than through any competitive contest.
Competition runs on deliverable quality, waiver footprint and operating cost. Deliverable quality decides enterprise work, since a buyer is purchasing a defensible record rather than a flight. Waiver footprint decides what geography a provider can serve without individual applications. Operating cost decides margin, and supervised multi-aircraft working separates providers far more than aircraft selection does. Flight skill barely features anywhere in the evaluation.

Pressure is arriving from two directions. Analysis software firms are moving downstream into service delivery, holding the part of the value chain that matters most. Asset owners with large enough programmes are meanwhile bringing inspection in-house. Rankings will shift toward providers combining national waiver coverage with owned analysis capability, since very few currently hold both and buyers are asking for them together.
north-america-drone-services-market-company-positioning-matrix-1788025513530

Competitive Moat and Risk Dimensions

ZEITVIEW

Moat: Analysis depth across energy assets

Zeitview built defect classification and reporting capability across solar, wind and utility assets at a scale that lets it deliver the defensible record enterprise buyers actually purchase rather than the imagery competitors supply. Its inspection history across comparable assets improves classification accuracy in ways new entrants cannot replicate quickly. That capability wins contracts flight operations alone would lose.
ZEITVIEW

Risk: Concentration in energy sector spending

Revenue concentrated in utility and renewable asset inspection carries exposure to capital cycles and regulatory rate decisions that no service provider influences. A slowdown in renewable buildout or a change in inspection frequency requirements removes volume quickly. Diversifying into other verticals means competing where analysis advantage counts for considerably less.
VOLATUS AEROSPACE

Moat: Fleet compliance and national footprint

Volatus operates compliant aircraft across a national footprint at a time when procurement restrictions affect roughly 71% of public agency fleets, which positions it precisely where agencies are shifting from owned operations toward contracted services. Its waiver coverage supports work across geographies that regionally focused providers cannot serve. Fleet and training capability together support contract terms smaller operators cannot offer.
VOLATUS AEROSPACE

Risk: Compliant aircraft capital intensity

Compliant equipment costs several times more than restricted alternatives for comparable capability, which raises fleet capital and depreciation against contract pricing that has not risen correspondingly. Carrying a national compliant fleet is expensive between contract awards. Providers who lease or pass equipment cost to buyers carry considerably less balance sheet exposure than this model does.

Players Tracked

Prominent Players

Zeitview
Volatus Aerospace
SkySpecs
PrecisionHawk
Percepto

Other Key Players

AgEagle Aerial Systems
Aerodyne Group
American Robotics
Censys Technologies
Cyberhawk Innovations
DroneDeploy
Firmatek
ULC Technologies
Terra Drone
Sharper Shape
Skydio
Hylio
Rantizo
Sentera
Propeller Aero

Recent Developments

DECEMBER 2023

Federal legislation restricted agency use of covered foreign aircraft

Federal legislation restricted procurement and operation of covered foreign uncrewed aircraft by federal agencies and by entities using federal funds, affecting a large share of public safety fleets and the providers serving them. This was statutory action rather than any acquisition, merger or commercial arrangement between participants.
Signal: Procurement policy moved more revenue from owned fleets into contracted services than any commercial development did.
AUGUST 2025

Aviation authority proposed routine extended range operating rules

An aviation authority proposed rulemaking that would permit routine operation beyond an operator's visual range under defined conditions, replacing the individual waiver process that currently governs corridor and infrastructure inspection work. This was a regulatory proposal rather than any commercial transaction between service providers or their customers.
Signal: Replacing individual waivers with a rule would remove the largest administrative cost in this entire market.
APRIL 2025

Utility awarded multi-year transmission corridor inspection programme

An electricity utility awarded a multi-year inspection programme covering transmission corridors, specifying defect classification and reporting deliverables alongside flight operations after previously contracting inspection campaign by campaign. This was a commercial service agreement rather than any acquisition, merger or joint venture between the parties concerned.
Signal: Multi-year awards specifying deliverables show buyers now purchase records rather than flight hours from their providers.

What A Service Flight Hour Costs

Cost divides four ways and the aircraft is not the largest part. Operating and analysis staff absorb roughly 41% of service cost, regulatory administration and insurance near 23%, fleet capital and depreciation near 21%, and mobilisation with travel the remaining 15%. Providers pricing on flight hours consistently misjudge the analysis staffing that the deliverable actually requires, and they discover it after the contract is signed.
Compliant aircraft pricing moved sharply once procurement restrictions removed the cheapest capable equipment from roughly 71% of agency fleets and from the providers serving them. Volatus Aerospace and AgEagle have both discussed fleet cost and equipment availability across recent reporting periods. Insurance pricing has moved in the same direction as operating areas expanded, since underwriters price extended range corridor work considerably above visual line of sight operation.

Exposure varies sharply by operating model. Providers running supervised multi-aircraft operations spread staff cost across 14 sorties where single-flight operators spread it across one. National providers carry waiver administration and insurance that scales with operating area rather than revenue. Providers passing compliant equipment cost to buyers carry far less balance sheet exposure than those funding national fleets between contract awards.
north-america-drone-services-market-cost-volatility-analysis-1788025513727

Supervised operations spreading staff cost across sorties

Operating and analysis staff absorb roughly 41% of service cost, and the difference between spreading that across fourteen sorties or one decides whether a corridor contract is profitable. Conversion needs operations design, documentation and training rather than new aircraft. Most providers already hold the approvals required and have simply never restructured the operation sitting behind them.

Contract terms passing compliant equipment cost through

Compliant aircraft cost several times more than restricted alternatives for comparable capability, and contract pricing has not risen to match. Terms that pass equipment cost to the buyer, or that price fleet refresh explicitly, remove exposure providers currently absorb silently. Buyers accept it more readily than providers expect, because they understand exactly why the cost moved.

Waiver portfolio administration replacing individual management

Maintaining roughly 3,100 approvals individually consumes staff effort scaling with operating area rather than with revenue, which penalises exactly the national footprint enterprise buyers want. Portfolio management with standardised operating documentation reduces the burden substantially at very little cost. It also positions a provider to convert quickly when rulemaking replaces the individual approval process entirely.

Portfolio Architecture for Margin Defence

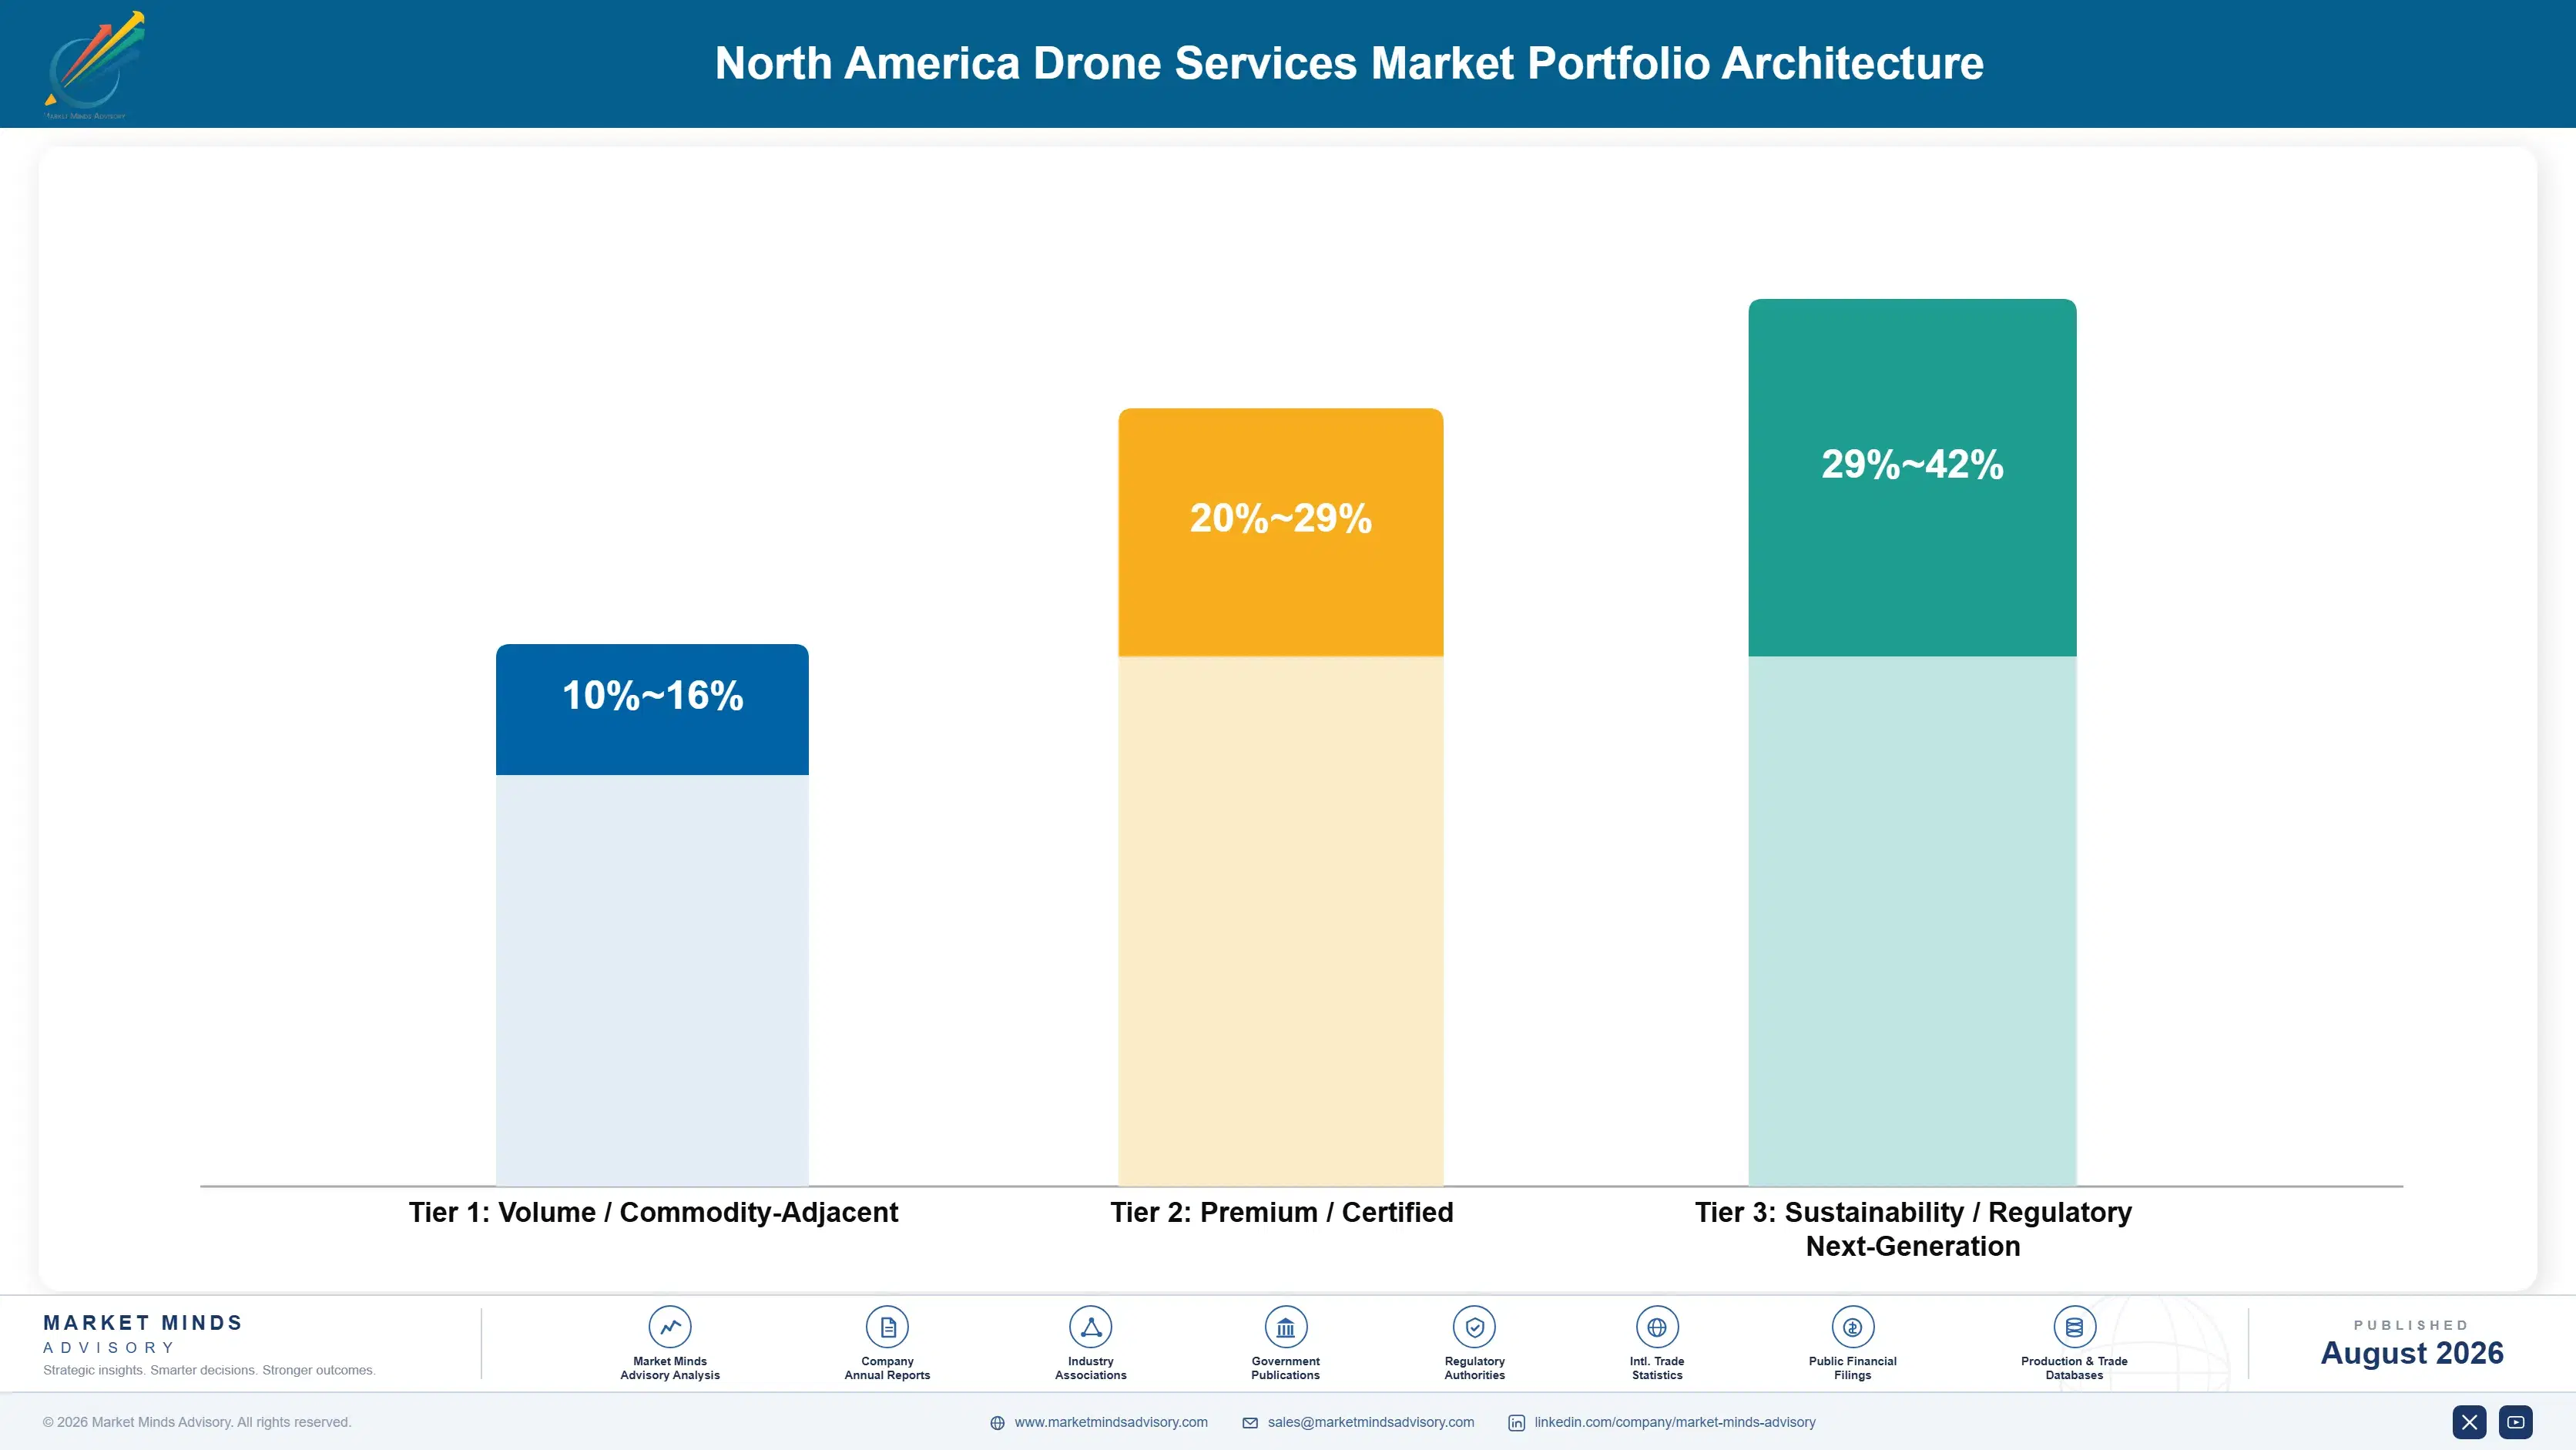
The portfolio separates by whether the buyer is purchasing imagery or evidence. Media, commercial imaging and straightforward survey work form the volume core: numerous buyers, low switching cost, competition on day rate, and margins that reflect a service anybody with an aircraft and a certificate can supply. It anchors nothing and generates very little. Everyone starts here and nobody stays.
Margin concentrates where the deliverable has to survive examination. Utility inspection, energy asset condition assessment and regulated infrastructure work all require defect classification, provenance and reporting that a buyer will defend in front of a regulator years later. Around 44% of contract value sits in producing that record, and providers without analysis capability hand it to whoever processes their imagery for them. The value moved and the pricing did not.

The overlooked pool is waiver footprint. National coverage is administrative rather than technical, costs comparatively little to maintain properly, and decides which providers enterprise buyers can contract with at all. Most treat it as compliance overhead. It is closer to a licence to bid, and the providers who understood that early are the ones consolidating the market now. That was always the real barrier.

Volume / Commodity-Adjacent

Media, commercial imaging and basic survey work competed on day rate against numerous small operators. Range spans six points because utilisation and travel efficiency decide outcomes far more than any capability difference does.
Gross Margin: 10-16%

Premium / Certified

Construction documentation, agriculture services and mapping work requiring repeatable methods and reporting. Range spans nine points because contract length and route density vary enormously between enterprise programmes and transactional engagements.
Gross Margin: 20-29%

Sustainability / Regulatory / Next-Generation

Utility and energy asset inspection, regulated infrastructure work and public safety contracting. Range spans thirteen points because analysis ownership and waiver footprint separate providers more sharply than anything operational. Neither is a flying capability.
Gross Margin: 29-42%
north-america-drone-services-market-portfolio-architecture-1788025514222

High-value Sub-segments and Strategic Watch-out

Utility and Energy Asset Inspection

High value and high growth at 20.7%, made non-deferrable by wildfire and storm liability across an enormous asset base. The eleven point range separates providers owning defect classification from those flying and handing imagery to somebody else entirely. The record is what gets purchased here.
Gross Margin: 31-42%

Public Safety and Emergency Response Operations

High value with moderate growth at 17.4%, reshaped by procurement restrictions affecting roughly 71% of agency fleets. The eight point range reflects how differently providers handle numerous small budget-constrained buyers against consolidated multi-agency contracting arrangements. Budget cycles rather than any requirement govern the timing throughout.
Gross Margin: 24-32%

Media and Commercial Imaging

The volume core, competed on day rate against operators who need only an aircraft and a certificate to bid. Low switching cost, no analysis content and margins that reflect both, and it anchors almost nothing else in a portfolio. Nobody defends a position here for long.
Gross Margin: 10-16%

Waiver Footprint Coverage

The strategic watch-out rather than a growth pool. National approval coverage decides which providers enterprise buyers can contract with at all, costs little to hold properly, and most participants still treat it as compliance overhead. It is closer to a licence to bid than to overhead.
Gross Margin: Variable

Why Inspection Programmes Renew

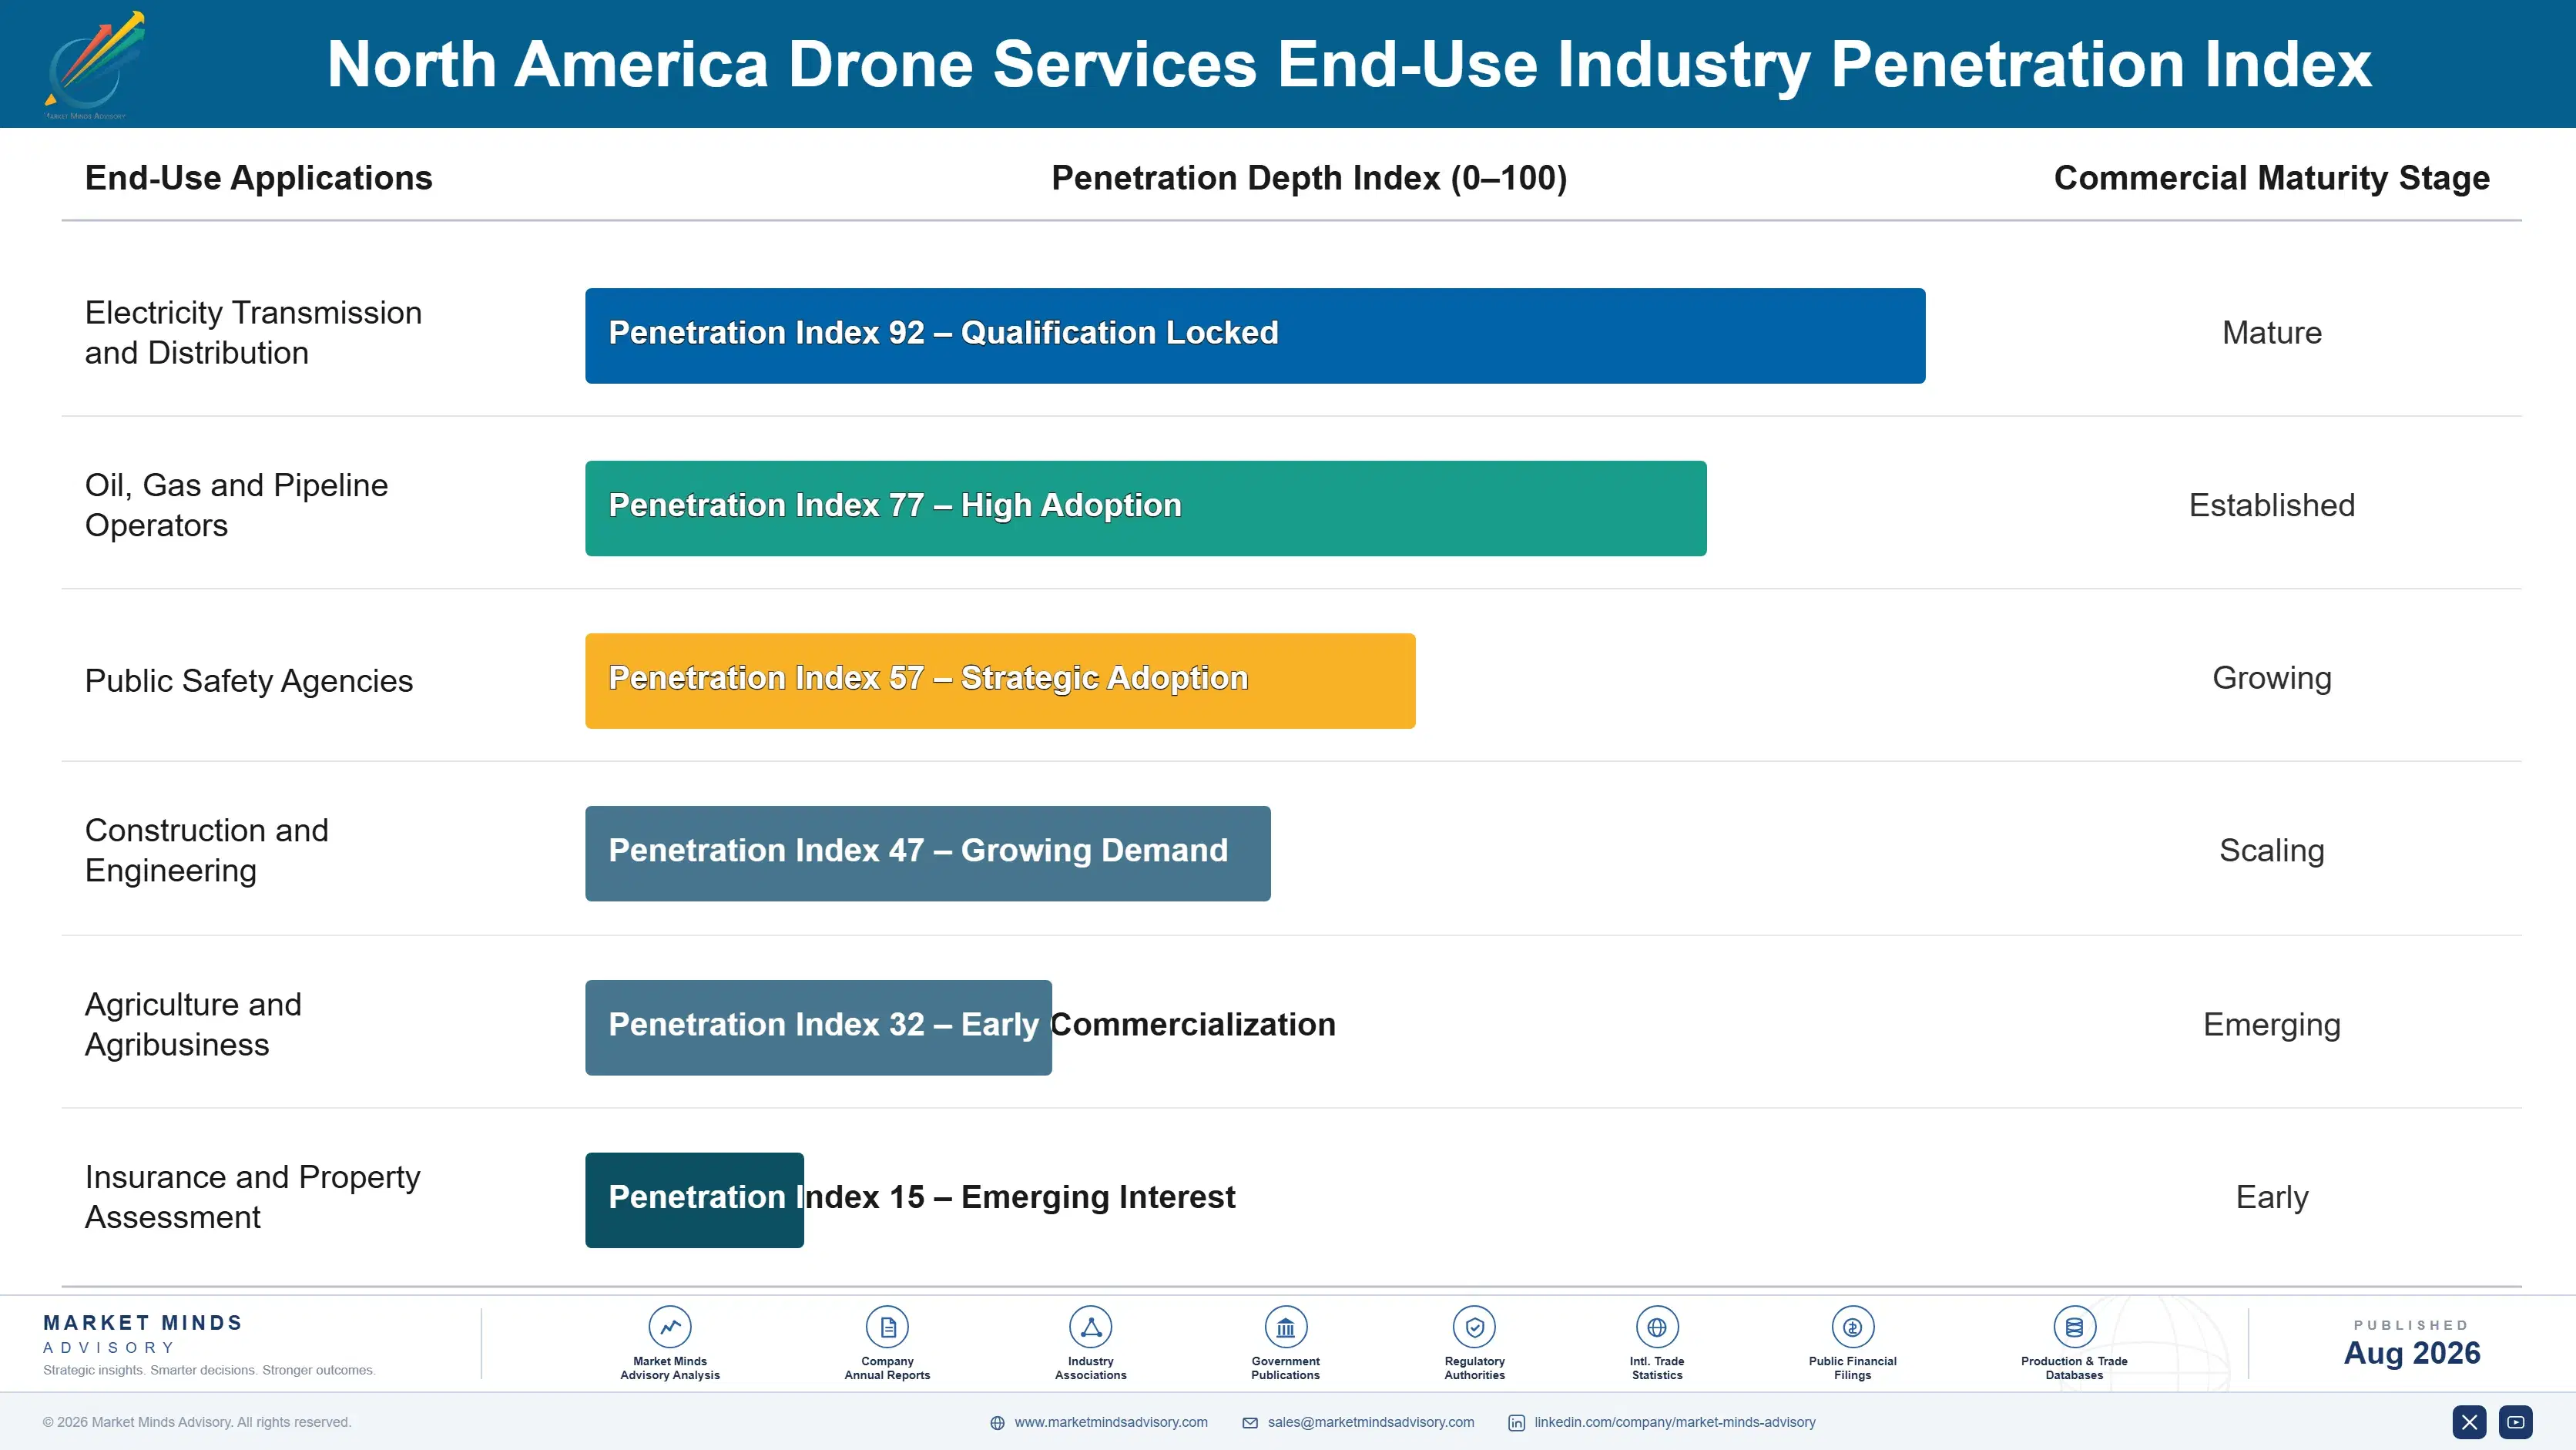
Inspection produces annuity economics of a straightforward kind. Assets require examination on cycles set by regulation, insurance condition or internal policy, so demand arrives on a calendar known years ahead rather than in response to any commercial decision. A provider holding a corridor programme sees that work repeatedly, and the comparative value of its record improves each cycle because change detection depends on having inspected the same asset before. Switching provider loses that history.
Stickiness varies by deliverable rather than by buyer. Utility programmes are close to permanent once established, since inspection history, defect classification consistency and regulatory familiarity all sit behind them. Public safety contracts turn over more readily on budget cycles and procurement rules. Media and survey work has essentially no stickiness at all, being contracted per engagement against whoever quotes acceptably on the day.

The buyer has changed considerably. Early contracts were signed by innovation groups and asset engineers willing to fund something new. Renewals now sit with procurement and risk functions asking about insurance limits, waiver coverage, data custody and whether the record will survive a regulatory challenge. Providers whose commercial approach was built for the first buyer find the second asks entirely different questions.
north-america-drone-services-market-end-use-penetration-index-1788025514713

Where Providers Should Commit Now

These are among the four positions where our research anticipates prominent divergence between winners and laggards over the coming forecast period. Each is grounded in the demand model, the regulatory perimeter, and the announced capacity pipeline.
01 / ANALYSIS CAPABILITY OWNERSHIP

Sell the record, never sell the flight hours

Roughly 44% of contract value sits in producing a dated, located and defensible record rather than in the flying itself, and providers pricing on flight hours hand that entire share to whoever processes their imagery for them afterward. Enterprise buyers want a defect list they can act on and defend in a rate case years later, not a folder of photographs. Building classification and reporting capability costs perhaps three million dollars and repays itself across a single utility programme comfortably.
02 / SUPERVISED OPERATIONS CONVERSION

One operator, fourteen sorties, an entirely different cost base

Extended range approvals allow one person to supervise fourteen sorties along a corridor instead of flying each one individually, which changes cost per inspected mile rather than merely extending operational range at all. Providers still running one pilot per flight cannot match that structure at any volume, and corridor work is precisely where the growth in this market actually sits. Conversion needs operations design, documentation and training rather than new aircraft, and most providers already hold the approvals they need.
03 / WAIVER PORTFOLIO DISCIPLINE

National coverage is a licence to bid

Maintaining roughly 3,100 approvals across a national footprint consumes staff effort that scales with operating area rather than with revenue earned, and most providers still administer every single one of them separately and expensively. Portfolio management with standardised operating documentation cuts that burden by thirty to forty percent at very little cost and rather less effort than most expect. It also positions a provider to convert immediately when rulemaking finally replaces the individual approval process altogether, as it eventually must.
04 / MULTI YEAR CONTRACT STRUCTURE

Liability driven demand supports commitments other verticals refuse

Wildfire and storm liability together make utility inspection non-deferrable, which means those buyers will commit to multi-year programmes that no other vertical in this market offers to anybody at present. A five year corridor programme supports fleet investment, staffing and analysis capability that transactional campaign work cannot justify at any volume at all. Providers still quoting campaign by campaign leave both revenue certainty and pricing on the table, and the buyer would prefer the longer arrangement anyway for their own reasons.

Engagement Snapshot From the Field

A live engagement with an industry participant carrying material or product regulatory and market exposure ahead of a defining policy shift, showing how our research translates into a defensible multi-year portfolio strategy.
MARKET MINDS ADVISORY · CLIENT ENGAGEMENT SUMMARY
North America Drone Services Producer Strategic Portfolio Review and Transition Roadmap 2026·Investment Scenario on North America Drone Services Exposure Evaluation 2025-26
CLIENT PROFILE
A drone service provider operating across four states with utility, construction and public safety customers, flying its own aircraft and subcontracting imagery processing to a third party. Revenue had grown steadily for four years while gross margin declined across the same period, and management had attributed the decline to competitive day rate pressure rather than to anything about its own operating model.
STRATEGIC CHALLENGE
The board needed to establish why growing revenue was producing falling margin, and whether building analysis capability internally justified the investment against continuing to subcontract it. It also faced a utility customer offering a multi-year corridor programme that operations leadership wanted to decline on capacity grounds without any commercial modelling being done first.
MMA APPROACH
MMA rebuilt gross margin by contract and by vertical across three years, allocating waiver administration, insurance and mobilisation cost properly for the first time. It modelled internal analysis capability against subcontracting under several volume scenarios. Expert interviews with utility buyers, insurers, procurement staff and competing providers established what enterprise customers actually evaluate and pay for.
KEY FINDINGS
  1. Subcontracted imagery processing captured roughly 44% of contract value, and the client had priced its own work as though flying was the deliverable being purchased.
  2. Media and basic survey engagements lost money once mobilisation and travel were allocated properly, and no achievable day rate made them profitable at current utilisation.
  3. The client held extended range approvals it had never used operationally, still flying one pilot per sortie where supervised working was already permitted.
  4. Waiver administration cost had grown with operating area rather than with revenue, and consolidating it into portfolio management was straightforward and had never been attempted.
CLIENT PROFILE
A drone service provider operating across four states with utility, construction and public safety customers, flying its own aircraft and subcontracting imagery processing to a third party. Revenue had grown steadily for four years while gross margin declined across the same period, and management had attributed the decline to competitive day rate pressure rather than to anything about its own operating model.
STRATEGIC CHALLENGE
The board needed to establish why growing revenue was producing falling margin, and whether building analysis capability internally justified the investment against continuing to subcontract it. It also faced a utility customer offering a multi-year corridor programme that operations leadership wanted to decline on capacity grounds without any commercial modelling being done first.
MMA APPROACH
MMA rebuilt gross margin by contract and by vertical across three years, allocating waiver administration, insurance and mobilisation cost properly for the first time. It modelled internal analysis capability against subcontracting under several volume scenarios. Expert interviews with utility buyers, insurers, procurement staff and competing providers established what enterprise customers actually evaluate and pay for.
KEY FINDINGS
  1. Subcontracted imagery processing captured roughly 44% of contract value, and the client had priced its own work as though flying was the deliverable being purchased.
  2. Media and basic survey engagements lost money once mobilisation and travel were allocated properly, and no achievable day rate made them profitable at current utilisation.
  3. The client held extended range approvals it had never used operationally, still flying one pilot per sortie where supervised working was already permitted.
  4. Waiver administration cost had grown with operating area rather than with revenue, and consolidating it into portfolio management was straightforward and had never been attempted.
RECOMMENDED STRATEGY
Phase 1: Phase one: build internal defect classification and reporting capability, beginning with the utility vertical where analysis value concentrates most heavily. Phase 2: Phase two: restructure corridor operations around supervised multi-aircraft working under approvals the company already holds but has so far never used. Phase 3: Phase three: accept the multi-year utility programme and withdraw from media and basic survey work that loses money at every achievable rate.
OUTCOME
The client reported gross margin improving 7.4 points within five quarters and the multi-year utility programme signed (client-reported, unverified by MMA). Media work was discontinued entirely during the period. Supervised operations raised sorties per operating day considerably, and analysis capability moved in-house across two of its verticals.

Frequently Asked Questions

Foundational context covering the market sizes, CAGR, scope, country, region and competition that inform every finding below. This section is provided to cover basics and most often pre-purchase conversations, answered from the MMA Primary Research Dataset.

What is the current size of the North America Drone Services Market?

The market is valued at USD 7.2 billion in 2025, measured as commercial uncrewed aircraft service revenue generated on work performed at locations within the region.

How large will the North America Drone Services Market be by 2036?

MMA forecasts USD 29.85 billion by 2036, up from USD 8.19 billion in 2026. That represents incremental revenue of USD 21.65 billion and an expansion multiple of 3.64 times.

What is the CAGR for the North America Drone Services Market 2026 to 2036?

The base case CAGR is 13.8%, with a bull case of 15.1% and a bear case of 12.5%. Utility inspection demand supplies the largest part of that growth.

Which segment is growing fastest?

Utility and energy asset inspection grows at 20.7%, half again the market rate of 13.8%, because wildfire liability made that inspection work impossible for operators to defer.

Who are the major companies in the North America Drone Services Market?

Zeitview, Volatus Aerospace, SkySpecs, PrecisionHawk and Percepto lead on regional service revenue, holding around 38% between them in an industry that still remains genuinely fragmented.

Which country is growing fastest?

India grows fastest at 15.8%, driven by data processing and defect classification operations that North American providers depend on to deliver analysis at contracted service levels.

Report Segmentation Architecture

The full report scope spans multiple orthogonal segmentation dimensions, with cross-tabulated demand data provided for each dimension pair. Coverage extends further to regional breakdowns, trend trajectories, and the competitive detail needed to support segment-level decision-making.

By Service Application

  • Utility and Energy Asset Inspection
  • Public Safety and Emergency Response Operations
  • Construction and Site Progress Documentation
  • Agriculture and Crop Management Services
  • Survey, Mapping and Geospatial Services
  • Media and Commercial Imaging

By End-Use Industry

  • Electricity Transmission and Distribution
  • Oil, Gas and Pipeline Operators
  • Public Safety Agencies
  • Construction and Engineering
  • Agriculture and Agribusiness
  • Insurance and Property Assessment

By Commercial Dimension

  • Multi Year Programme Contracting
  • Transactional Campaign Engagement
  • Public Agency Procurement
  • Enterprise Framework Agreements
  • Subcontracted Capacity Supply
  • Analysis and Reporting Services

By Region

  • North America
  • Western Europe
  • East Asia
  • South Asia and Pacific
  • Latin America
  • Middle East and Africa
  • Eastern Europe

Scope, Methodology, and Coverage

Every figure in this report is reproducible from documented input assumptions. The scope below maps the historical period, the forecast horizon, the segmentation dimensions, and the countries covered, alongside the underlying primary and qualitative methodology.
Historical Period
2020 to 2025
Forecast Period
2026 to 2036
Base Year
2025 (USD billions; MMA Primary Research Dataset, August 2026)
Market Definition
Revenue from commercial uncrewed aircraft services performed at locations within North America, spanning utility and energy asset inspection, public safety and emergency response operations, construction and site progress documentation, agriculture and crop management services, survey, mapping and geospatial work, and media and commercial imaging, together with the data processing and analysis delivered as part of a service engagement. Multi-year programme contracting, transactional engagement, public agency procurement, enterprise frameworks, subcontracted capacity and analysis services are included. Cargo delivery operations, aircraft and sensor manufacture, software licensed without an accompanying service, and defence operations flown by armed forces are excluded.
Quantitative Units
USD billions, commercial service revenue performed within the region
Segmentation Dimensions
Service application, end-use industry, commercial contracting model, region of origin
Regions Covered
North America, Western Europe, East Asia, South Asia and Pacific, Latin America, Middle East and Africa, Eastern Europe
Countries Covered
United States, Canada, Mexico, United Kingdom, Germany, France, Japan, South Korea, China, India, Australia, Brazil, Israel, Poland
Key Companies Profiled
Zeitview, Volatus Aerospace, SkySpecs, PrecisionHawk, Percepto, AgEagle Aerial Systems, Cyberhawk Innovations, American Robotics, DroneDeploy, ULC Technologies
Quantitative Methodology
Primary survey, n=3,800 respondents, Q4 2025, six countries; demand-side model with trade association cross-validation
Qualitative Methodology
47 expert interviews, Q4 2025; applied to validate demand model assumptions, identify emerging dynamics, and assess competitive positioning
Report Format
PDF and XLSX data workbook (Word format preview document)
Publisher
Market Minds Advisory
Report Code
MMA-2026-TEC-461
Published
August 2026
Contact
sales@marketmindsadvisory.com | www.marketmindsadvisory.com

Purchase the full North America Drone Services Market Report (2026 to 2036).

The full report treats this as the data business it became rather than the flying business it was funded as. It quantifies where contract value actually sits between flying and analysis, maps extended range approval coverage against the corridor work that depends on it, and assesses how procurement restrictions moved public agency demand from owned fleets into contracted services. Segment analysis covers all six service applications, with particular attention to utility inspection where liability rather than technology explains the entire growth rate. Competitive assessment ranks twenty providers on commercial service revenue generated within the region.
Six service application segmentation with growth rates
Contract value split between flying and analysis
Twenty provider assessment on regional service revenue
Extended range approval coverage mapped by provider
Agency fleet restriction effects quantified across public safety
Utility programme contract structures compared across buyers

Built For The People Who Decide

From boardroom strategy to bench-side execution, this report is read cover-to-cover by leaders shaping the next decade of their industry, turning demand scenarios, market dynamics and valuation benchmarks into decisions.
CXOs/ Presidents/ VPs/ Managers
M&A and Corporate Development
Strategy Teams and R&D Heads
Procurement and Product Directors
Regulatory and Compliance Leaders
Investor Relations and Equity Analysts