Market Minds Advisory
Non-Woven Glass Fiber Prepreg Market

Non-Woven Glass Fiber Prepreg Market: Resin System Economics, Treater Capacity and the Low-Dielectric Transition, 2026 to 2036

Telecom and data centre boards now demand dielectric performance that conventional epoxy simply cannot reach, and the treater lines qualified to run the alternatives are booked years ahead of the demand behind them.

Lead Analyst

Bilal Shaikh

Published

September 2026

Make Smarter Decisions with Customized Research Insights

Request a free sample report and evaluate market opportunities, growth trends, and competitive dynamics relevant to your business needs.

2025 MARKET VALUE$1.4BMarket Size 2025
2036 FORECAST VALUE$3.3BBase Case , 2026 to 2036
CAGR 2026 TO 20368.0 %Bull 9.2% / Bear 6.8%
INCREMENTAL OPPORTUNITY$1.8BNet 10- year value creation
EXPANSION MULTIPLE2.16x2036 value over 2026 base
Strategic Levers
M&A Pipeline
Regional Outlook
Country Rankings
Competitive Intelligence
Segmental Deep-dive
Call-Us : 91 93563 13602

Executive Snapshot and Market Trajectory

Resin chemistry has become the whole commercial argument here. Data centre switching, automotive radar and telecom infrastructure all need dielectric loss figures that conventional epoxy on glass veil cannot deliver, and the treater lines qualified to run the alternatives are genuinely scarce everywhere.
Low-dielectric hydrocarbon and PPE resin prepreg grows at 12.0%, a full 1.50 times the market rate, pulled by high-frequency board demand and by automotive radar modules moving into mid-range vehicles. East Asia holds 36% of global value, above the standard regional band, because Chinese, Taiwanese, Japanese and Korean laminators between them own most of the world's treater capacity and sit physically beside the board fabricator customers they supply.
The top five producers hold 49% of revenue, high for a materials business, and it reflects how capital-intensive qualified treater capacity actually is. Qualification runs 19 months from sample to production release, which locks specification for the life of a board design. Electrical insulation demand behaves entirely differently: it grows steadily with motor and transformer output, buys on cost and certification rather than dielectric performance, and it keeps most treater lines loaded through the year.
Market Definition
The market covers non-woven glass fibre prepreg: wet-laid glass veil, chopped strand mat and randomly oriented glass web pre-impregnated with a thermoset resin system and supplied in B-stage form. It spans standard epoxy, modified halogen-free epoxy, phenolic, polyester, cyanate ester, bismaleimide and low-dielectric hydrocarbon systems. It excludes woven glass fabric prepreg, carbon and aramid fibre prepreg, dry glass veil supplied without resin, finished copper clad laminate, and cured composite parts.
Base Year Value
$1.4B in 2025 (MMA Primary Research Dataset, August 2026)
Forecast Period
2026 to 2036, eleven discrete annual values
CAGR
8.0% base case. Bull 9.2%. Bear 6.8%.
Fastest Growth Segment
Low-Dielectric Hydrocarbon and PPE Resin Prepreg: 12.0% CAGR
Fastest Growth Country
Vietnam: 11.4% CAGR
Fastest Growth Region
South Asia and Pacific: 10.3% CAGR
Largest Region
East Asia: 36% of 2025 global value
Market Leaders
Panasonic Industry, Rogers Corporation, Shengyi Technology, Elite Material, Isola Group. Source: MMA Primary Research Dataset, July 2026.
Primary Survey
n=3,800 procurement and R&D decision-makers, Q4 2025, six countries
Methodology
Demand-side build-up, cross-validated against public data, 47 expert interviews

Non-Woven Glass Fiber Prepreg Market Forecast Scenarios

non-woven-glass-fiber-prepreg-market-size-forecast-scenario-1787311387021
The market compounded at 6.8% between 2020 and 2025, with the two demand streams behaving quite differently. Electronics-driven volume surged through 2021 as remote working pulled forward server and networking hardware purchases, then corrected sharply through 2023. Electrical insulation demand tracked industrial motor and transformer output with far less drama, and it is what kept treater utilisation from collapsing in the downturn.
The 8.0% base case rests on three mechanisms. First, continued data centre buildout keeps raising the share of boards requiring low-loss dielectric material, and each generation of switching silicon tightens the requirement further. Second, automotive radar and electrification move high-frequency material into vehicles at volumes that consumer electronics never supplied. Third, grid investment across every major economy sustains transformer and motor insulation demand at rates comfortably above general industrial growth.
The bull case at 9.2% assumes data centre capital spending holds at current levels while automotive radar penetration accelerates into mid-range vehicles ahead of schedule. The bear case at 6.8% assumes a hyperscaler capital spending pause of the kind that followed 2022, combined with glass veil supply tightness limiting how quickly qualified treater capacity can actually be filled with saleable output.

Why Treater Qualification Decides Supply

Prepreg looks like a coating operation and behaves like a qualification business. Impregnating glass veil with resin and partially curing it to B-stage is well understood chemistry that many companies could run. Holding resin content, flow and gel time within the windows a board fabricator or motor winder requires, batch after batch, is what actually separates producers.
TOP FIVE CONCENTRATION49%Combined position of the five largest prepreg producing companies
AVERAGE SELLING PRICE$11.80 per sq metreTypical realised price across standard and low-loss grades
TOP PRODUCING COUNTRY SHARE44%Chinese share of global laminate and prepreg output
RESIN INPUT SHARE41% of COGSResin system share of delivered prepreg production cost
CAPACITY UTILISATION74%Average operating rate across installed treater and impregnation lines
QUALIFICATION CYCLE19 monthsMedian time from sample submission to full production release
Treater capacity is the physical constraint and it is stubbornly slow to add. A qualified line costs $18 million to $35 million and takes roughly two years to build and validate, and low-dielectric systems demand different oven profiles, solvent handling and line speeds than epoxy does. Producers who converted lines before 2024 hold capacity that board fabricators are now competing for, and they are allocating it rather than selling it. Everyone else is quoting lead times measured in quarters.
The two demand streams sit awkwardly on the same assets. Electronics work pays well, moves fast and swings violently with hyperscaler capital cycles. Electrical insulation pays modestly, moves slowly and never stops, which makes it the ballast that keeps lines loaded when electronics corrects. Producers weighted entirely toward one or the other have found the last five years considerably harder than those carrying both.
"The strange thing about this industry is that the least glamorous product keeps the most glamorous one alive. Transformer insulation prepreg funds the treater that runs low-loss material for a hyperscaler, and when the hyperscaler pauses its capital programme, the transformers are still there. Producers who dropped insulation work to chase electronics margin learned that the hard way in 2023."
Principal Analyst, Electronic and Electrical Materials Practice · MMA Chemicals

Market Trends

Switching Silicon Generations Tighten Dielectric Loss Requirements

Each generation of data centre switching silicon raises signalling rates, and the dielectric loss the board material can tolerate falls accordingly. Material that qualified for 400 gigabit systems is marginal at 800 and unusable beyond that point. Roughly 31% of new high-performance board designs released in 2025 specified a low-loss system against about 14% four years earlier. The commercial consequence is that qualification cycles restart with each silicon generation rather than persisting, which favours producers with several qualified resin systems on the same treater and punishes those who bet on one chemistry.
Market Impact: Doubles board area per 1 system
Halogen-Free Requirements Become Standing Customer Specifications

Major electronics brands have moved halogen-free material from an environmental option into a default specification across consumer, telecom and increasingly automotive hardware. Phosphorus-based flame retardant systems that meet the requirement behave differently in the treater, with narrower processing windows and different resin flow characteristics than brominated epoxy. Roughly 68% of electronics-grade output now runs halogen-free. Producers who made that transition early hold qualification records that newer entrants cannot match, and the requirement has quietly become an entry barrier in its own right rather than the compliance cost it was originally treated as being.
Market Impact: Extends order backlogs 4 years

Market Opportunities and Growth Drivers

Data Centre Buildout Sustains High-Value Board Demand

Hyperscaler capital spending on networking and accelerator hardware has grown at rates no other electronics segment approaches, and each server rack carries substantially more low-loss board area than the generation before it. Board area per accelerator system has roughly doubled since 2021 as signal counts rise and layer counts follow behind them. That demand is concentrated among a small number of buyers, which makes it lumpy, but the qualified supplier list is short enough that producers holding low-loss capacity are allocating available output rather than competing on price for any of it.
Market Impact: Delays entry by 19 months

Grid And Motor Investment Underpins Insulation Prepreg Volume

Transformer and industrial motor production has grown steadily on grid replacement programmes across North America and Europe, and on electrification of industrial drives everywhere else. Insulation-grade prepreg used in coil and slot applications tracks that output directly. Transformer order backlogs at major manufacturers now extend three to four years, which gives insulation material demand unusual visibility compared with anything on the electronics side. This is the volume that keeps treater lines loaded through electronics downturns, and its predictability is worth considerably more to a producer than its margin alone would suggest.
Market Impact: Limits output growth below 10%

Market Restraints and Challenges

Treater Qualification Blocks Entry Into High-Value Programmes

Qualification runs 19 months from first sample to production release, covering dielectric performance, thermal reliability, drilling behaviour and assembly compatibility at both material and finished board level. The root cause is that board fabricators cannot requalify a laminate without their own customers requalifying the assembly, which nobody wants to trigger. Commercially this excludes new entrants from high-value work for years after their capacity is technically ready. Participants are addressing it by qualifying through laminators rather than fabricators directly, which cuts roughly six months, and in several cases by acquiring already-qualified positions outright.
Market Impact: Reaches 31% of new board designs

Glass Veil Supply Constrains Low-Dielectric Output Growth

Low-dielectric systems require glass veil with tightly controlled fibre diameter and binder chemistry, and the qualified veil supplier list is shorter than the prepreg supplier list. The root cause is furnace economics: low-dielectric glass compositions run at different melt temperatures and damage refractory faster, so producers are reluctant to dedicate furnaces to them. Commercially this caps how quickly qualified prepreg capacity can actually be filled with saleable output. Mitigation runs through multi-year veil offtake agreements, and increasingly through prepreg producers taking direct equity positions in veil capacity in order to secure allocation.
Market Impact: Covers 68% of electronics-grade out
2 additional market trends, 4 additional growth drivers, and 3 additional restraints and challenges are covered in the full report. Contact sales@marketmindsadvisory.com to access the complete intelligence.

Segment CAGR and Growth Architecture

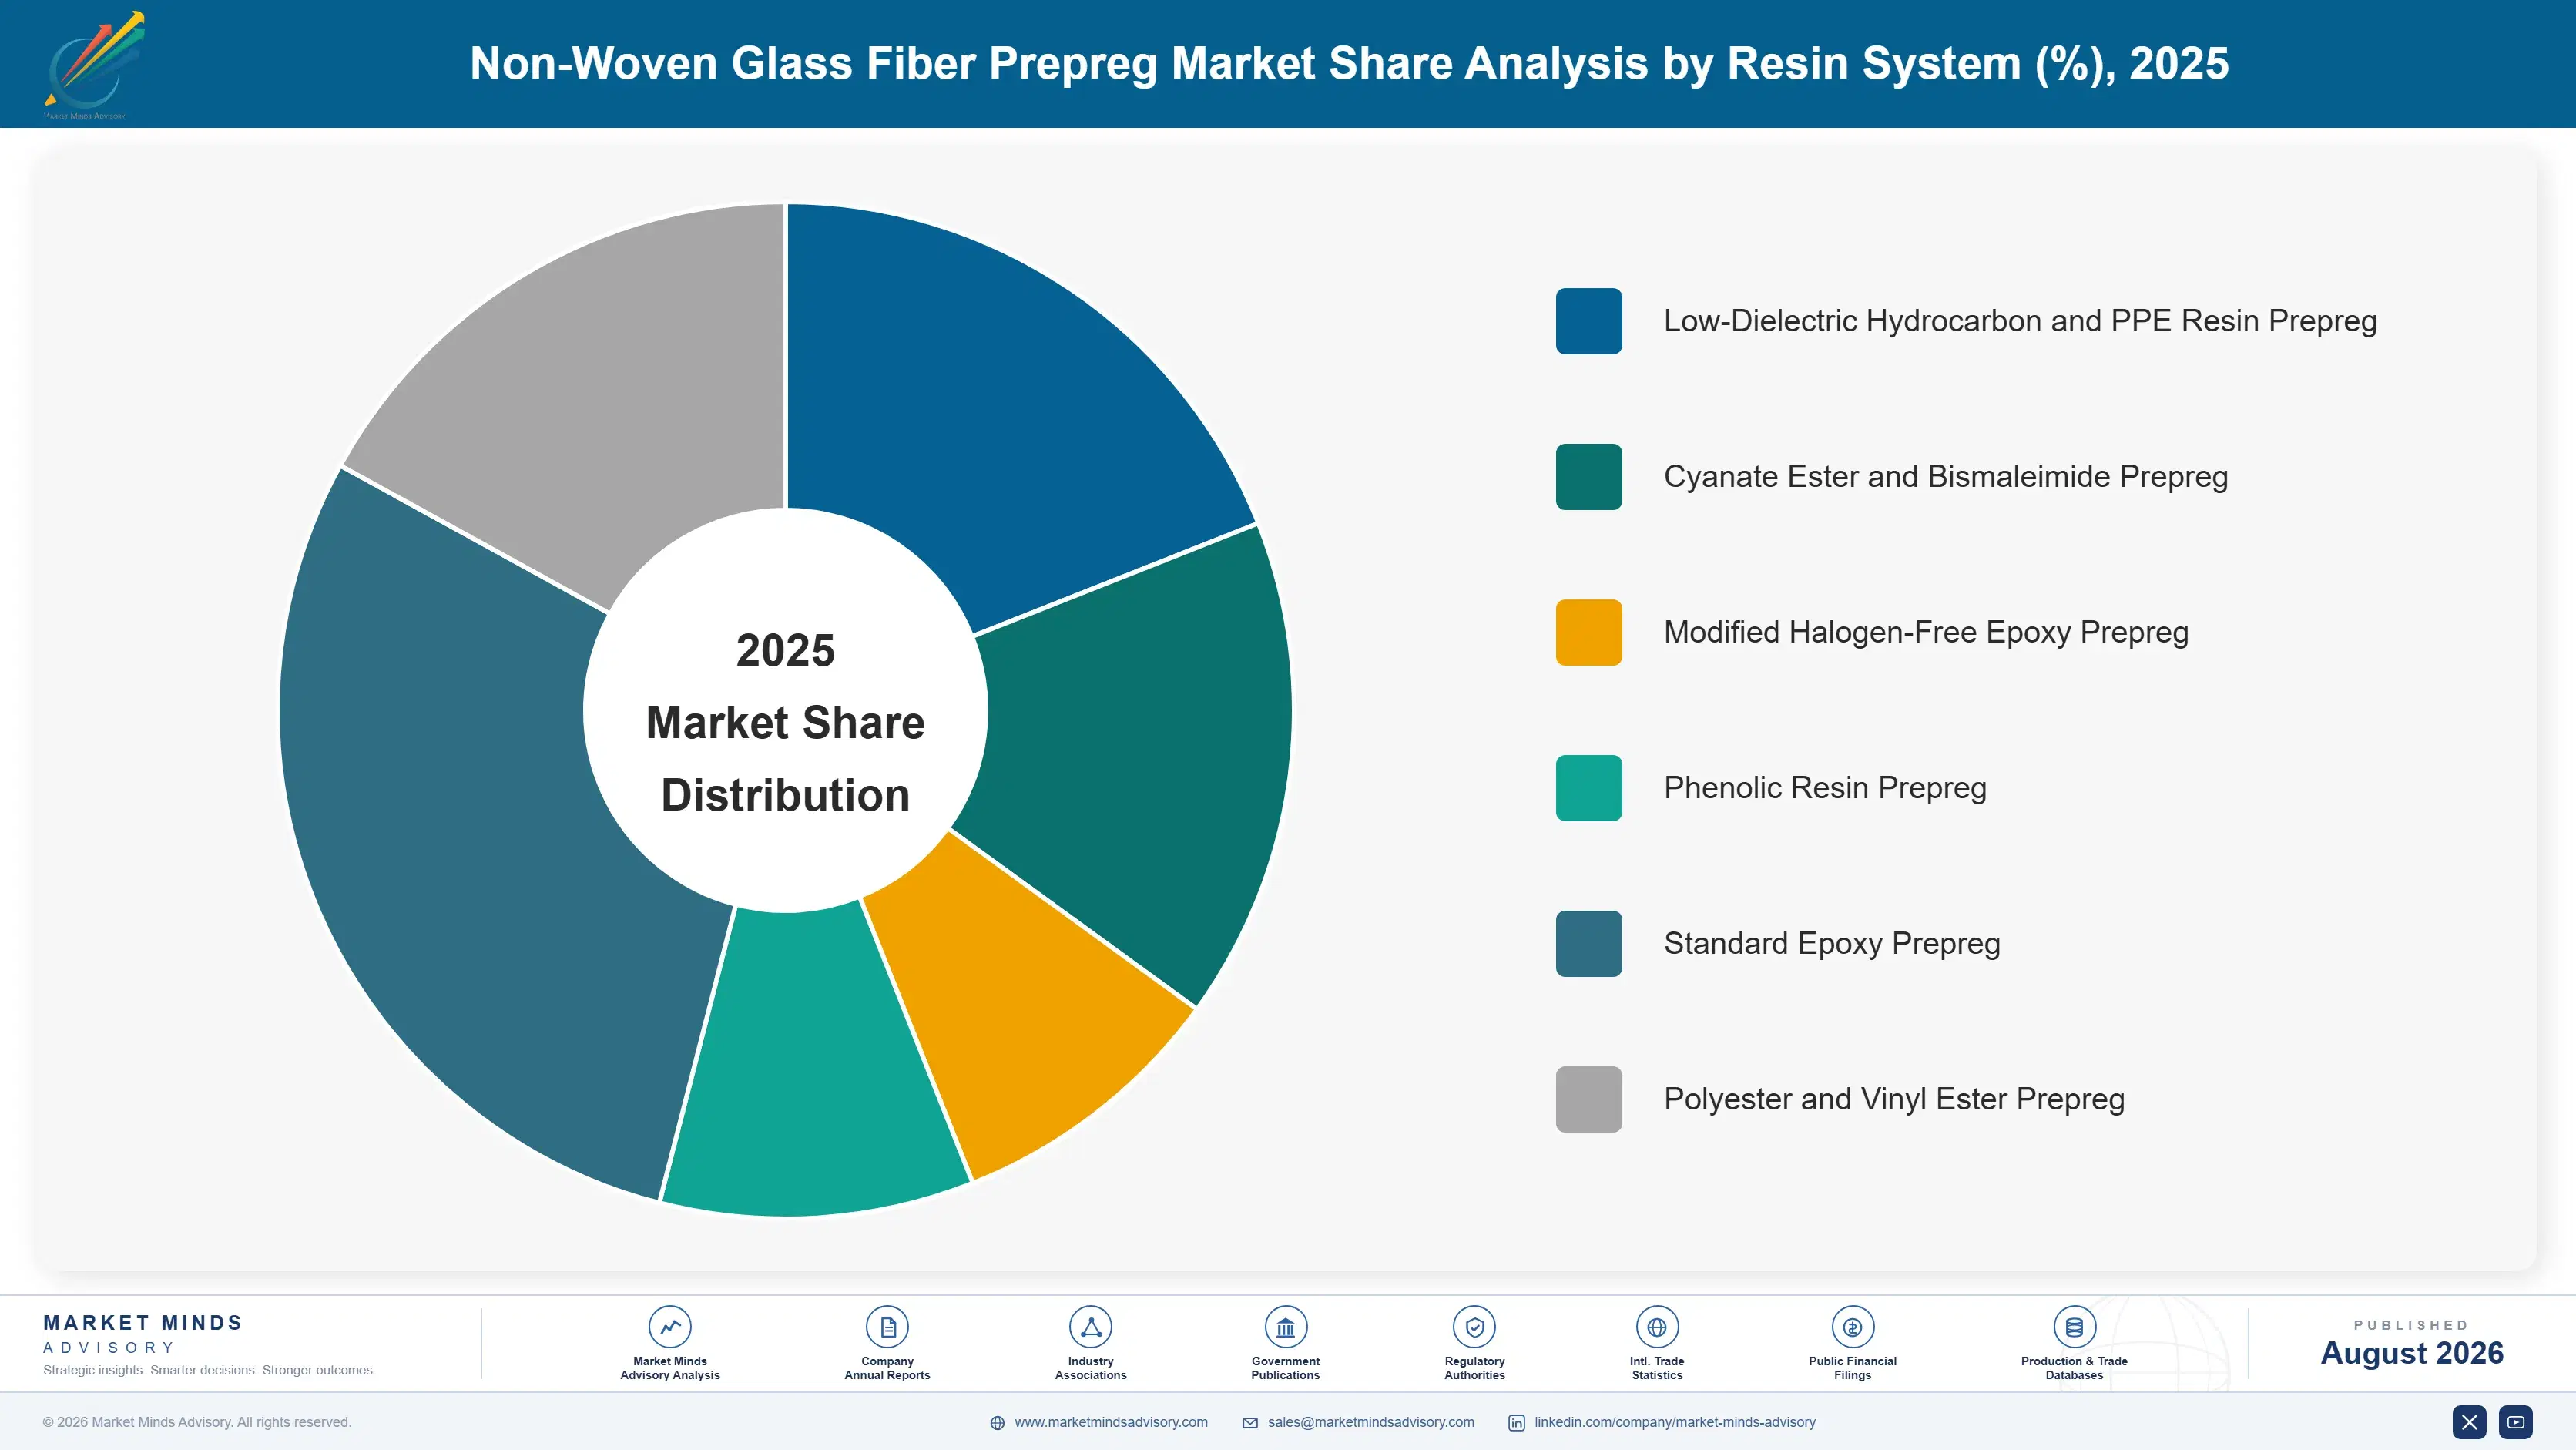
Segmentation here follows the thermoset resin system used to impregnate the glass veil, because that single choice determines dielectric and thermal performance, treater processing window, the capital equipment required and ultimately which customers a producer can qualify with at all. It remains the single dimension along which this industry genuinely divides itself commercially today.
non-woven-glass-fiber-prepreg-market-market-share-analysis-1787311387618

Low-Dielectric Hydrocarbon and PPE Resin Prepreg

The fastest segment at 12.0%, a full 1.50 times the market rate, covering hydrocarbon and polyphenylene ether resin systems specifically engineered for low dielectric constant and low loss tangent at high signalling frequencies. Demand comes almost entirely from data centre switching and accelerator boards, telecom infrastructure and automotive radar modules, all of which need signal integrity that epoxy chemistry simply cannot deliver. Realised pricing runs three to four times standard epoxy grade levels, and holds there. The binding constraint throughout is qualified treater capacity combined with low-dielectric glass veil availability, and neither of those expands quickly, which is why producers here allocate supply rather than compete on price at all.
CAGR 12.0%

Cyanate Ester and Bismaleimide Prepreg

Growing at 10.4% annually on high-temperature thermoset systems supplying aerospace interior panels, satellite structures, downhole well electronics and the most demanding automotive under-hood applications. These resins hold their mechanical and dielectric properties at service temperatures where ordinary epoxy softens, and they carry qualification burdens closer to aerospace practice than to ordinary electronics. Volumes here are modest but realised pricing is exceptional, and customer positions here last for the entire production life of an airframe or a well-logging tool. Processing is genuinely difficult: cure schedules are long, resin shelf life is genuinely short, and the cold storage logistics involved add cost that most producers badly underestimate before deciding to enter at all.
CAGR 10.4%
Full segment breakdown across 6 segments available in the complete report.

Regional Architecture and Country Demand Map

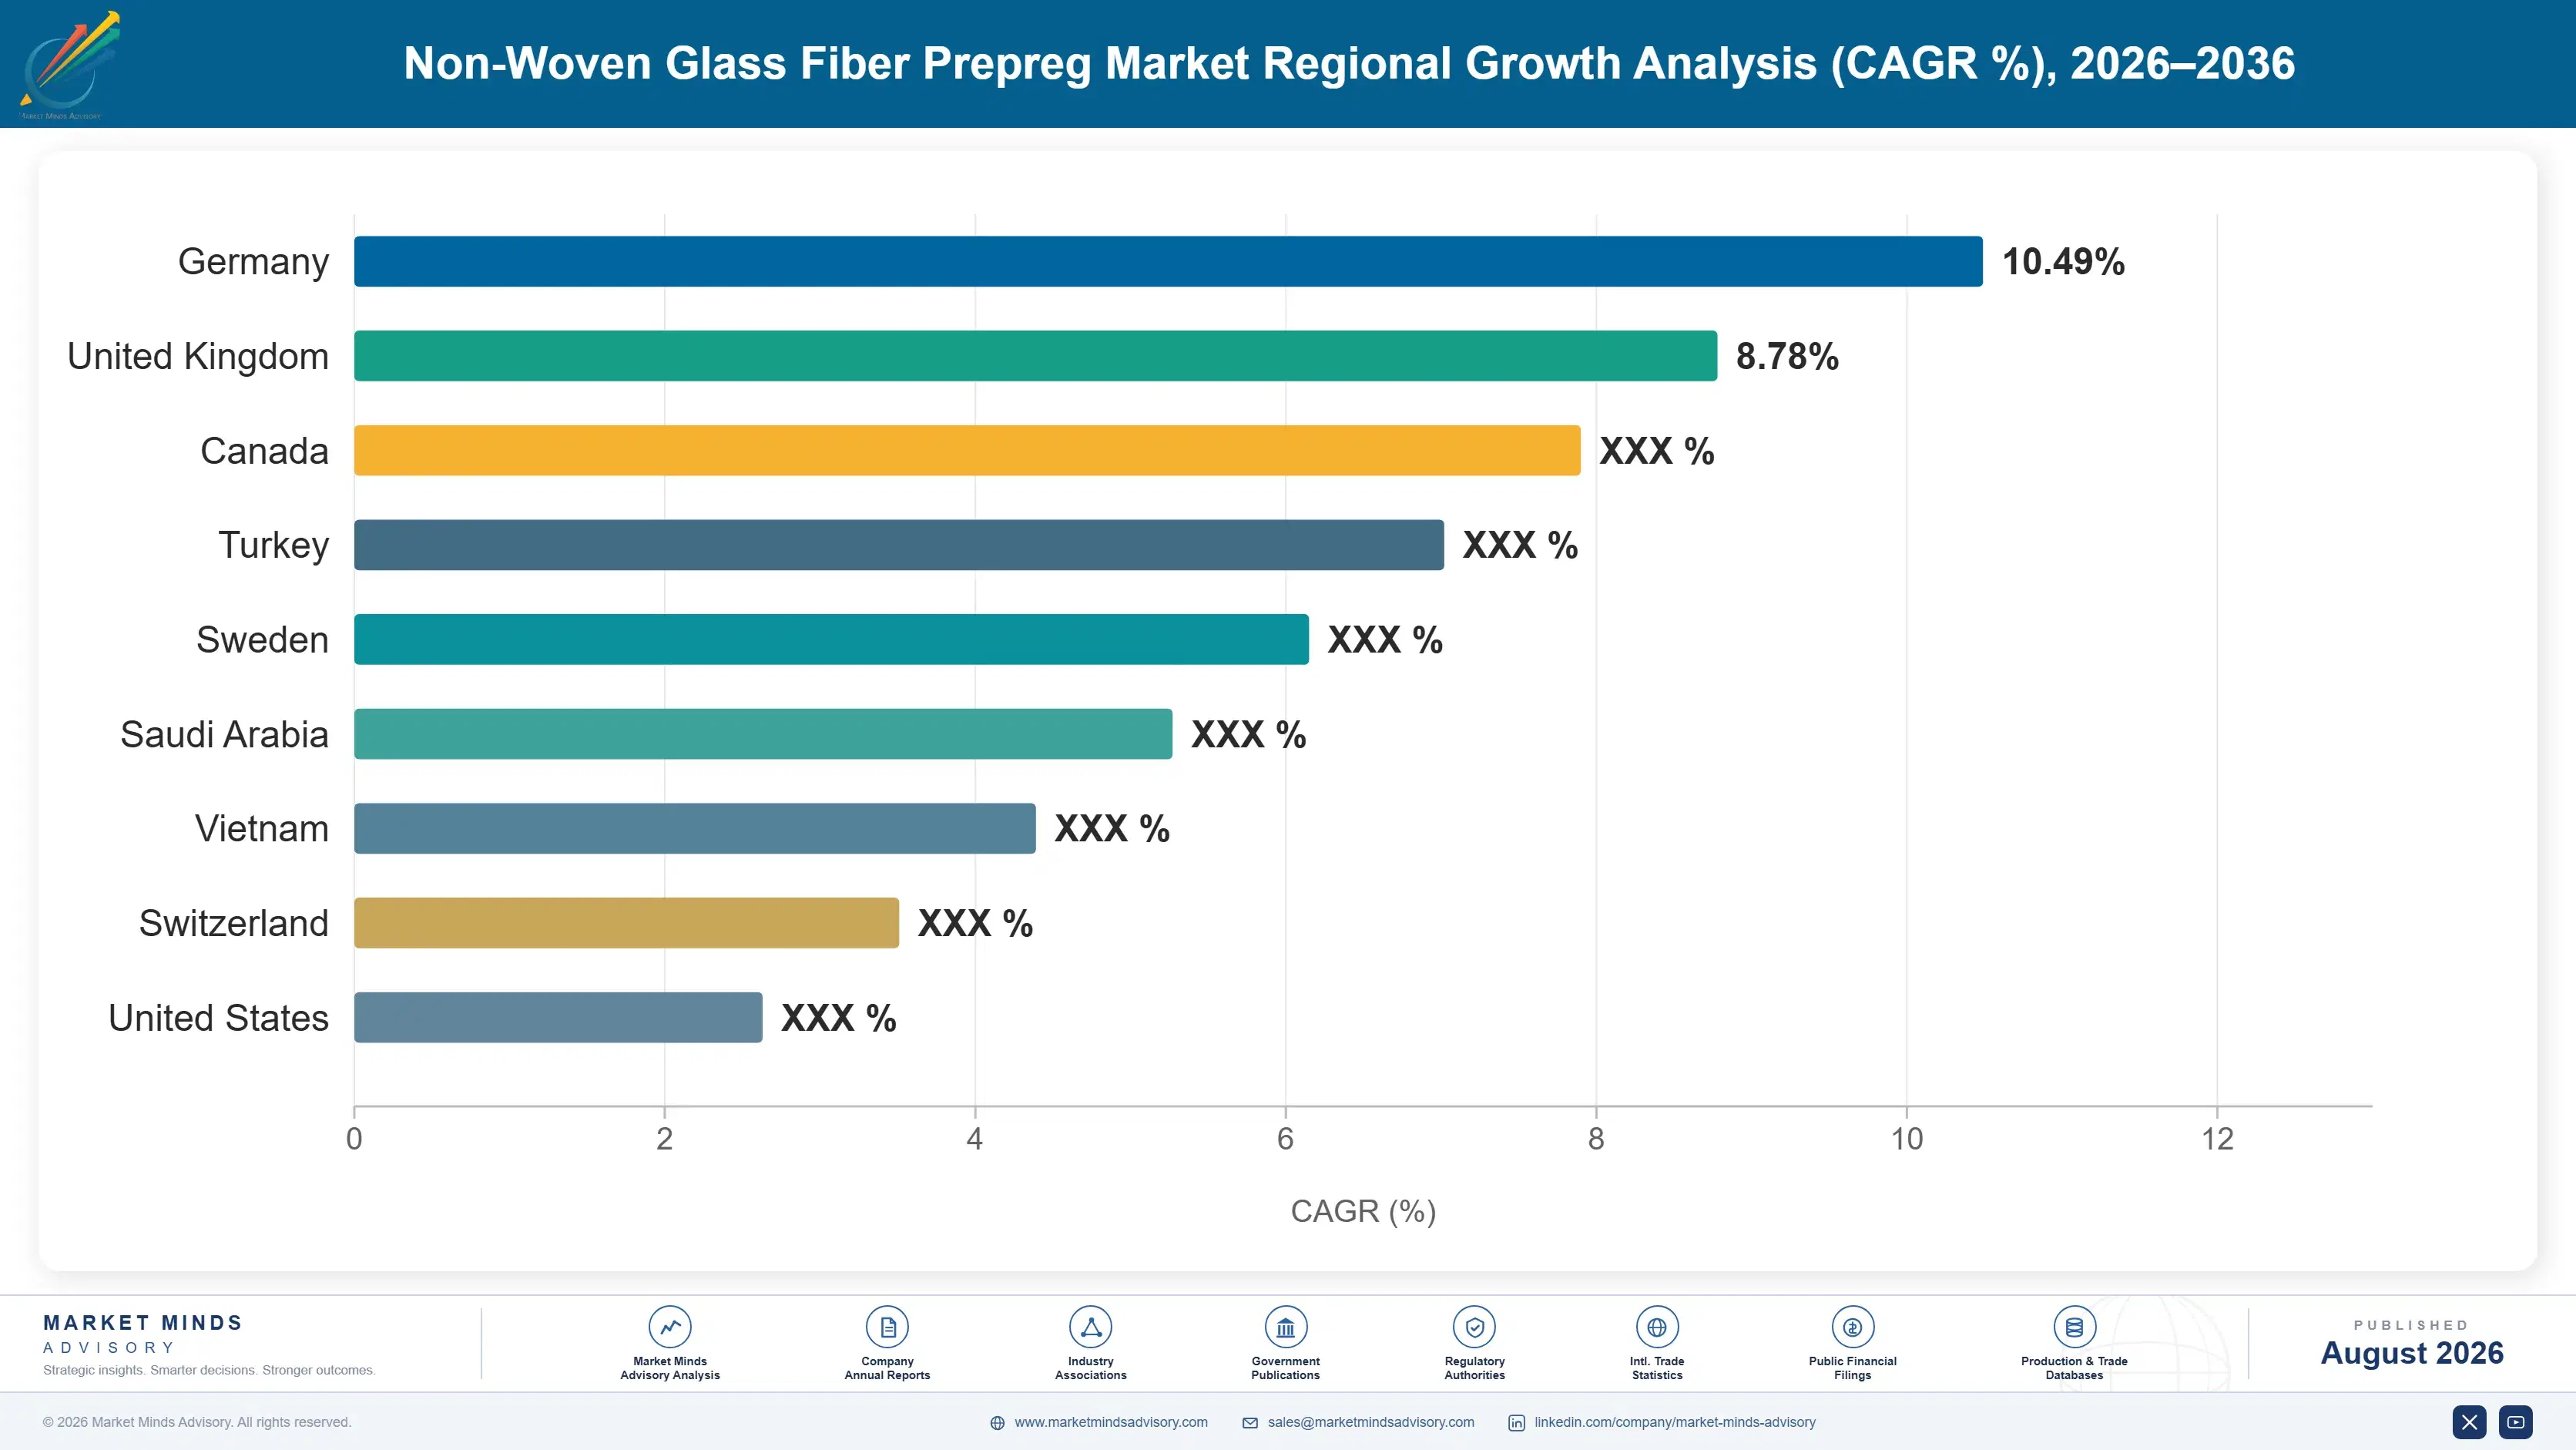
East Asia leads on treater capacity and proximity to board fabrication rather than on end demand alone. South Asia and Pacific grows fastest of all as Vietnamese and Thai board assembly scales up. North America and Western Europe hold the aerospace and high-reliability material positions instead.

East Asia

Thirty-six percent of global value sits here. Note: this exceeds the standard regional band because Chinese, Taiwanese, Japanese and Korean laminators own most of the world's qualified treater capacity and operate beside the board fabricators they supply. Taiwanese producers hold particularly strong positions in high-frequency material, and Japanese producers dominate the highest-reliability automotive and industrial grades. Chinese capacity covers 44% of global laminate and prepreg output and continues expanding, though increasingly into halogen-free and low-loss systems rather than commodity epoxy. Growth of 9.2% reflects data centre buildout and automotive electronics together, and treater utilisation across the region runs well above the global average. Korean laminators occupy a narrower but genuinely high-specification position.
Share: 36% | CAGR: 9.2% (2026 to 2036)

North America

Twenty percent of global value. Note: this sits below the standard regional band because domestic board fabrication is small relative to consumption and most electronics-grade material arrives as finished laminate rather than as prepreg. What the region does hold is the aerospace and defence position, where cyanate ester and bismaleimide qualification records matter far more than cost and where domestic supply is a procurement requirement. Growth of 7.4% reflects data centre construction and grid transformer demand together. Electrical insulation demand is substantial and growing, supported by transformer manufacturing investment responding to grid replacement programmes across the United States. Domestic prepreg capacity serves those defence and aerospace programmes far more than it serves any commercial electronics work.
Share: 20% | CAGR: 7.4% (2026 to 2036)
Regional intelligence for 5 additional markets available in the complete report: Western Europe, South Asia and Pacific, Latin America, Middle East and Africa, Eastern Europe. Contact sales@marketmindsadvisory.com.
non-woven-glass-fiber-prepreg-market-country-cagr-analysis-1787311388151

Where Prepreg Margin Actually Accumulates

Four commercial moves separate producers earning specification margins from those merely selling treater time. Each depends on holding something a customer cannot obtain elsewhere within its design cycle: qualified low-dielectric capacity, several resin systems on one line, secured glass veil allocation, or certification depth in electrical applications that takes years rather than money to assemble.

Convert Treater Lines To Low-Dielectric Systems Early

Low-dielectric hydrocarbon and PPE systems sell at three to four times standard epoxy pricing, and qualified capacity is short enough that producers allocate rather than quote against each other. Conversion costs $12 million to $22 million per line including oven and solvent handling changes, and takes about fourteen months with requalification. Producers who converted before 2024 are collecting that premium now. Those waiting for confirmed demand will pay the same capital and arrive as the premium compresses, which is exactly the same uncomfortable arithmetic that recurs across every materials transition of this kind.
Market Impact: Realises up to 4 times standard epo

Qualify Several Resin Systems On One Line

Each switching silicon generation restarts qualification rather than extending it, so a producer with one qualified chemistry re-enters the queue every cycle. Lines qualified across three or more resin systems win roughly 60% of programmes they bid against single-system competitors, because the fabricator avoids a fresh qualification when its requirement moves. The cost is throughput: changeovers consume line time and multi-system qualification is expensive to maintain. Changeover losses typically run six to nine percent of available line time. That friction is precisely what keeps most competitors on a single chemistry and this segment profitable.
Market Impact: Wins about 60% of contested board m

Secure Low-Dielectric Glass Veil Allocation Directly

Qualified low-dielectric glass veil is scarcer still than qualified treater capacity, and producers without secured allocation find their converted lines running standard epoxy instead. Multi-year offtake agreements, and in several cases equity participation in veil capacity, guarantee the supply that makes conversion economics work at all. Offtake typically requires firm volume commitments and premiums of 8% to 12% over spot veil pricing, alongside multi-year duration. Against finished prepreg selling at three to four times standard grade pricing, that premium is close to irrelevant to the overall economics of a converted line.
Market Impact: Secures veil at 12% premium over sp

Build Certification Depth In Electrical Insulation

Insulation-grade prepreg qualified to UL, IEC and individual transformer builder standards carries certification records that any competitor would take years to assemble, and transformer order backlogs extending three to four years make that demand unusually visible. Margins are modest at 24% to 32%, but the volume never stops and it loads treater lines right through electronics downturns that leave competitors idle. Producers carrying both report utilisation roughly 12 percentage points above electronics-only competitors across a full cycle, which quietly changes the economics of every other line standing on the same site.
Market Impact: Lifts treater utilisation by up to

Who Controls the Margin Pool

Concentration is high for a materials business. The five largest producers hold 49% of global revenue, measured on prepreg and laminate material revenue across all participants, and Panasonic Industry leads on the breadth of its qualified resin systems combined with automotive and industrial positions. The gap to the second tier is widest in qualification records rather than in treater capacity itself.
Competition runs on three dimensions. Qualified low-dielectric capacity is the sharpest, since board fabricators cannot substitute inside a design cycle and available supply is genuinely tight. Qualification breadth matters almost as much, because each silicon generation restarts the process and multi-system producers avoid rejoining the queue. Price competition is intense but confined to standard epoxy and industrial laminate grades, where Chinese producers without high-frequency capability compete hard for volume.

Two pressures are building. Chinese laminators have moved decisively into halogen-free and low-loss systems, and several now hold qualifications that would have been unavailable from the country five years ago. Meanwhile glass veil producers have recognised their position in the chain and are pricing accordingly, which compresses prepreg margins from upstream rather than from competitors. Rankings shift where low-dielectric qualification meets secured veil allocation, since neither is sufficient alone.
non-woven-glass-fiber-prepreg-market-company-positioning-matrix-1787311388706

Competitive Moat and Risk Dimensions

PANASONIC INDUSTRY

Moat: Broadest qualified resin portfolio

Qualifications across low-dielectric, halogen-free epoxy, high-temperature and insulation systems let the company follow a customer as its requirement changes without that customer restarting qualification elsewhere. Each silicon generation resets the process for single-chemistry competitors while the company simply moves the customer across its own qualified range instead.
PANASONIC INDUSTRY

Risk: Exposure to hyperscaler capital cycles

A growing share of high-margin volume depends on data centre programmes concentrated among very few buyers whose capital spending moves in steps rather than trends. The 2023 correction demonstrated how quickly that demand can pause. Insulation and automotive volumes cushion the swing but cannot absorb a sustained hyperscaler slowdown at the current portfolio mix.
ROGERS CORPORATION

Moat: High-frequency material performance leadership

Long-established positions in high-frequency dielectric materials give the company qualification records across telecom, radar and aerospace applications that competitors have repeatedly failed to displace. Design engineers specify by name in many radar and antenna applications, which is a position built over decades of field performance rather than through any pricing decision.
ROGERS CORPORATION

Risk: Narrow application concentration

The company competes where high-frequency performance decides, which is defensible but inherently a limited pool. Volume growth in this market comes substantially from mid-specification electronics and from electrical insulation, where the cost position is uncompetitive. Holding the performance end while the market grows elsewhere caps participation in the broader expansion underway.

Players Tracked

Prominent Players

Panasonic Industry
Rogers Corporation
Shengyi Technology
Elite Material
Isola Group

Other Key Players

Nan Ya Plastics
Doosan Electro-Materials
ITEQ Corporation
Taiwan Union Technology
Ventec International
AGC Multi Material
Resonac Holdings
Wazam New Materials
Kingboard Laminates
Arisawa Manufacturing
Von Roll
Krempel
Park Aerospace
Toray Advanced Composites
Hexcel

Recent Developments

FEBRUARY 2025

Shengyi Technology commissions low-loss treater capacity

Two new treater lines qualified for low-dielectric hydrocarbon resin systems entered commercial service in Guangdong, aimed squarely at the domestic data centre and telecom board programmes that had until then depended on imported Taiwanese and Japanese material for their high-frequency dielectric layers in every generation.
Signal: Chinese laminators are now closing the hig
JUNE 2025

Rogers expands radar-grade material capacity for automotive

Additional treater capacity for high-frequency automotive radar board material was commissioned at an existing site, responding directly to radar module adoption moving out of premium vehicles and into mid-range platforms where annual programme volumes run several times larger than anything the premium segment ever supplied.
Signal: Automotive radar is quietly becoming a lar
OCTOBER 2025

Von Roll secures multi-year glass veil supply agreement

A multi-year offtake agreement covering specified low-dielectric glass veil grades was concluded with a European glass veil producer, reflecting how veil allocation rather than installed treater capacity has now become the binding constraint on expanding qualified low-loss prepreg output right across this industry at present.
Signal: Glass veil allocation is now treated as a

What Drives Prepreg Production Cost

Resin systems account for roughly 41% of cost of goods, ranging from commodity epoxy through hydrocarbon and PPE chemistry costing several times more per kilogram. Glass veil contributes 24%, and low-dielectric grades carry a substantial premium over standard veil. Solvents add 9%, and energy for treater ovens and solvent recovery a further 13%, high enough that regional power pricing affects competitiveness directly.
The 2022 European energy shock hit treater economics hard. IEA data recorded European industrial gas and electricity prices at several times their historical range through that winter, and treater ovens together with solvent recovery are among the more energy-intensive operations in materials converting. Von Roll and Krempel both documented substantial energy cost pressure in reporting for the period. Asian producers gained relative position without any operational improvement, simply by holding cheaper power.

The competitive disadvantage mechanism runs through contract structure as much as through cost. Electronics customers negotiate quarterly while resin and veil move continuously, and insulation customers negotiate annually against multi-year transformer programmes. Producers weighted toward insulation carry the longest exposure to input movement. European and Japanese producers face the worst combination, buying resin at Western prices while supplying insulation contracts fixed a year or more ahead.
non-woven-glass-fiber-prepreg-market-cost-volatility-analysis-1787311388904

Index long insulation contracts to resin benchmarks

Annual and multi-year insulation pricing against continuously moving resin cost is the largest single source of margin damage in this business. Producers now negotiate indexation clauses referencing published epoxy and phosphorus flame retardant benchmarks, typically with a quarterly reset and a collar limiting total movement to seven percent in either direction across any given year.

Recover treater oven heat and solvent vapour

Treater ovens and solvent recovery dominate energy consumption and most of the exhaust heat currently leaves the building unused. Combined heat recovery and improved vapour capture cost roughly $3.5 million per line and cut energy cost of goods by around four percentage points, with payback inside four years at European power prices and much faster where carbon costs apply.

Pre-qualify a second glass veil source per grade

Single-sourced low-dielectric veil leaves converted treater lines idle whenever a supplier reallocates, and requalifying an alternate veil against board fabricator specifications takes months. Carrying a pre-qualified second source costs around $150,000 per grade family in testing and remains the cheapest protection available against the allocation decisions that veil producers make entirely outside any prepreg producer's control.

Portfolio Architecture for Margin Defence

Margin architecture tracks qualification burden almost exactly. Standard epoxy prepreg for industrial laminates and general electrical work runs at gross margins in the low twenties, competing against every producer with a treater line. Low-dielectric and high-temperature grades earn roughly twice that, and aerospace-qualified material more still.
The volume-versus-premium tension is unusually well balanced here, which is why the successful producers carry both. Treater lines need loading, and insulation and industrial laminate work provides it at predictable volumes that never stop. Low-dielectric work pays several times better but arrives in bursts tied to hyperscaler capital cycles and vehicle programme launches. A producer holding only the premium end watches expensive assets idle through corrections; one holding only volume never earns a return on conversion.

Value concentrates where qualification cost exceeds any plausible saving from switching. Aerospace cyanate ester positions are the clearest case, lasting the production life of an airframe. Low-dielectric board material sits close behind, locked for a design generation. Industrial laminate and general insulation work sits at the other extreme, where buyers hold certified suppliers but review them on ordinary purchasing cycles and move volume readily on delivered cost.

Volume / Commodity-Adjacent

Standard epoxy and polyester prepreg for industrial laminates, general electrical parts and low-specification insulation. Certification requirements are routine, supplier choice is wide, and buyers move on delivered cost. This work exists mainly to keep treater lines loaded through the year.
Gross Margin: 19-26%

Premium / Certified

Halogen-free epoxy and phenolic insulation grades qualified to transformer builder and appliance standards. Certification depth and consistent processing behaviour hold pricing, and transformer backlogs give the demand unusual visibility. Range reflects the spread between general insulation and high-reliability transformer work.
Gross Margin: 24-36%

Sustainability / Regulatory / Next-Generation

Low-dielectric hydrocarbon and PPE systems plus cyanate ester and bismaleimide grades for data centre, radar and aerospace applications. Qualified treater capacity and secured veil allocation, rather than the resin chemistry itself, justify the pricing achieved here.
Gross Margin: 42-58%
non-woven-glass-fiber-prepreg-market-portfolio-architecture-1787311389403

High-value Sub-segments and Strategic Watch-out

Low-Dielectric Board Material

High value on genuinely high growth at 12.0%, with the strongest realised pricing anywhere in this market today. Qualified treater capacity and low-dielectric veil allocation are both short, so the producers holding both allocate their supply rather than compete on price with anyone at all.
Gross Margin: 46-58%

Aerospace High-Temperature Grades

Excellent margins on steady growth at 10.4%, with customer positions lasting the entire production life of an airframe or a downhole tool. Volumes here are modest, but qualification burdens closer to aerospace practice than electronics keep the competitive field here extremely narrow and unusually stable.
Gross Margin: 44-56%

Industrial Laminate Grades

The loading backbone of every treater line in this industry, necessary for the asset economics but earning gross margins of around twenty percent. Chinese producers without any high-frequency capability compete this pool down hard, and no commercial decision available to any producer meaningfully changes that dynamic.
Gross Margin: 19-26%

Transformer Insulation Prepreg

The strategic watch-out in this portfolio. Order backlogs extending three to four years make this demand look entirely secure, but that visibility rests on grid investment programmes whose funding is political rather than commercial, and any policy reversal would remove the ballast holding treater utilisation up.
Gross Margin: 24-36%

How This Demand Actually Recurs

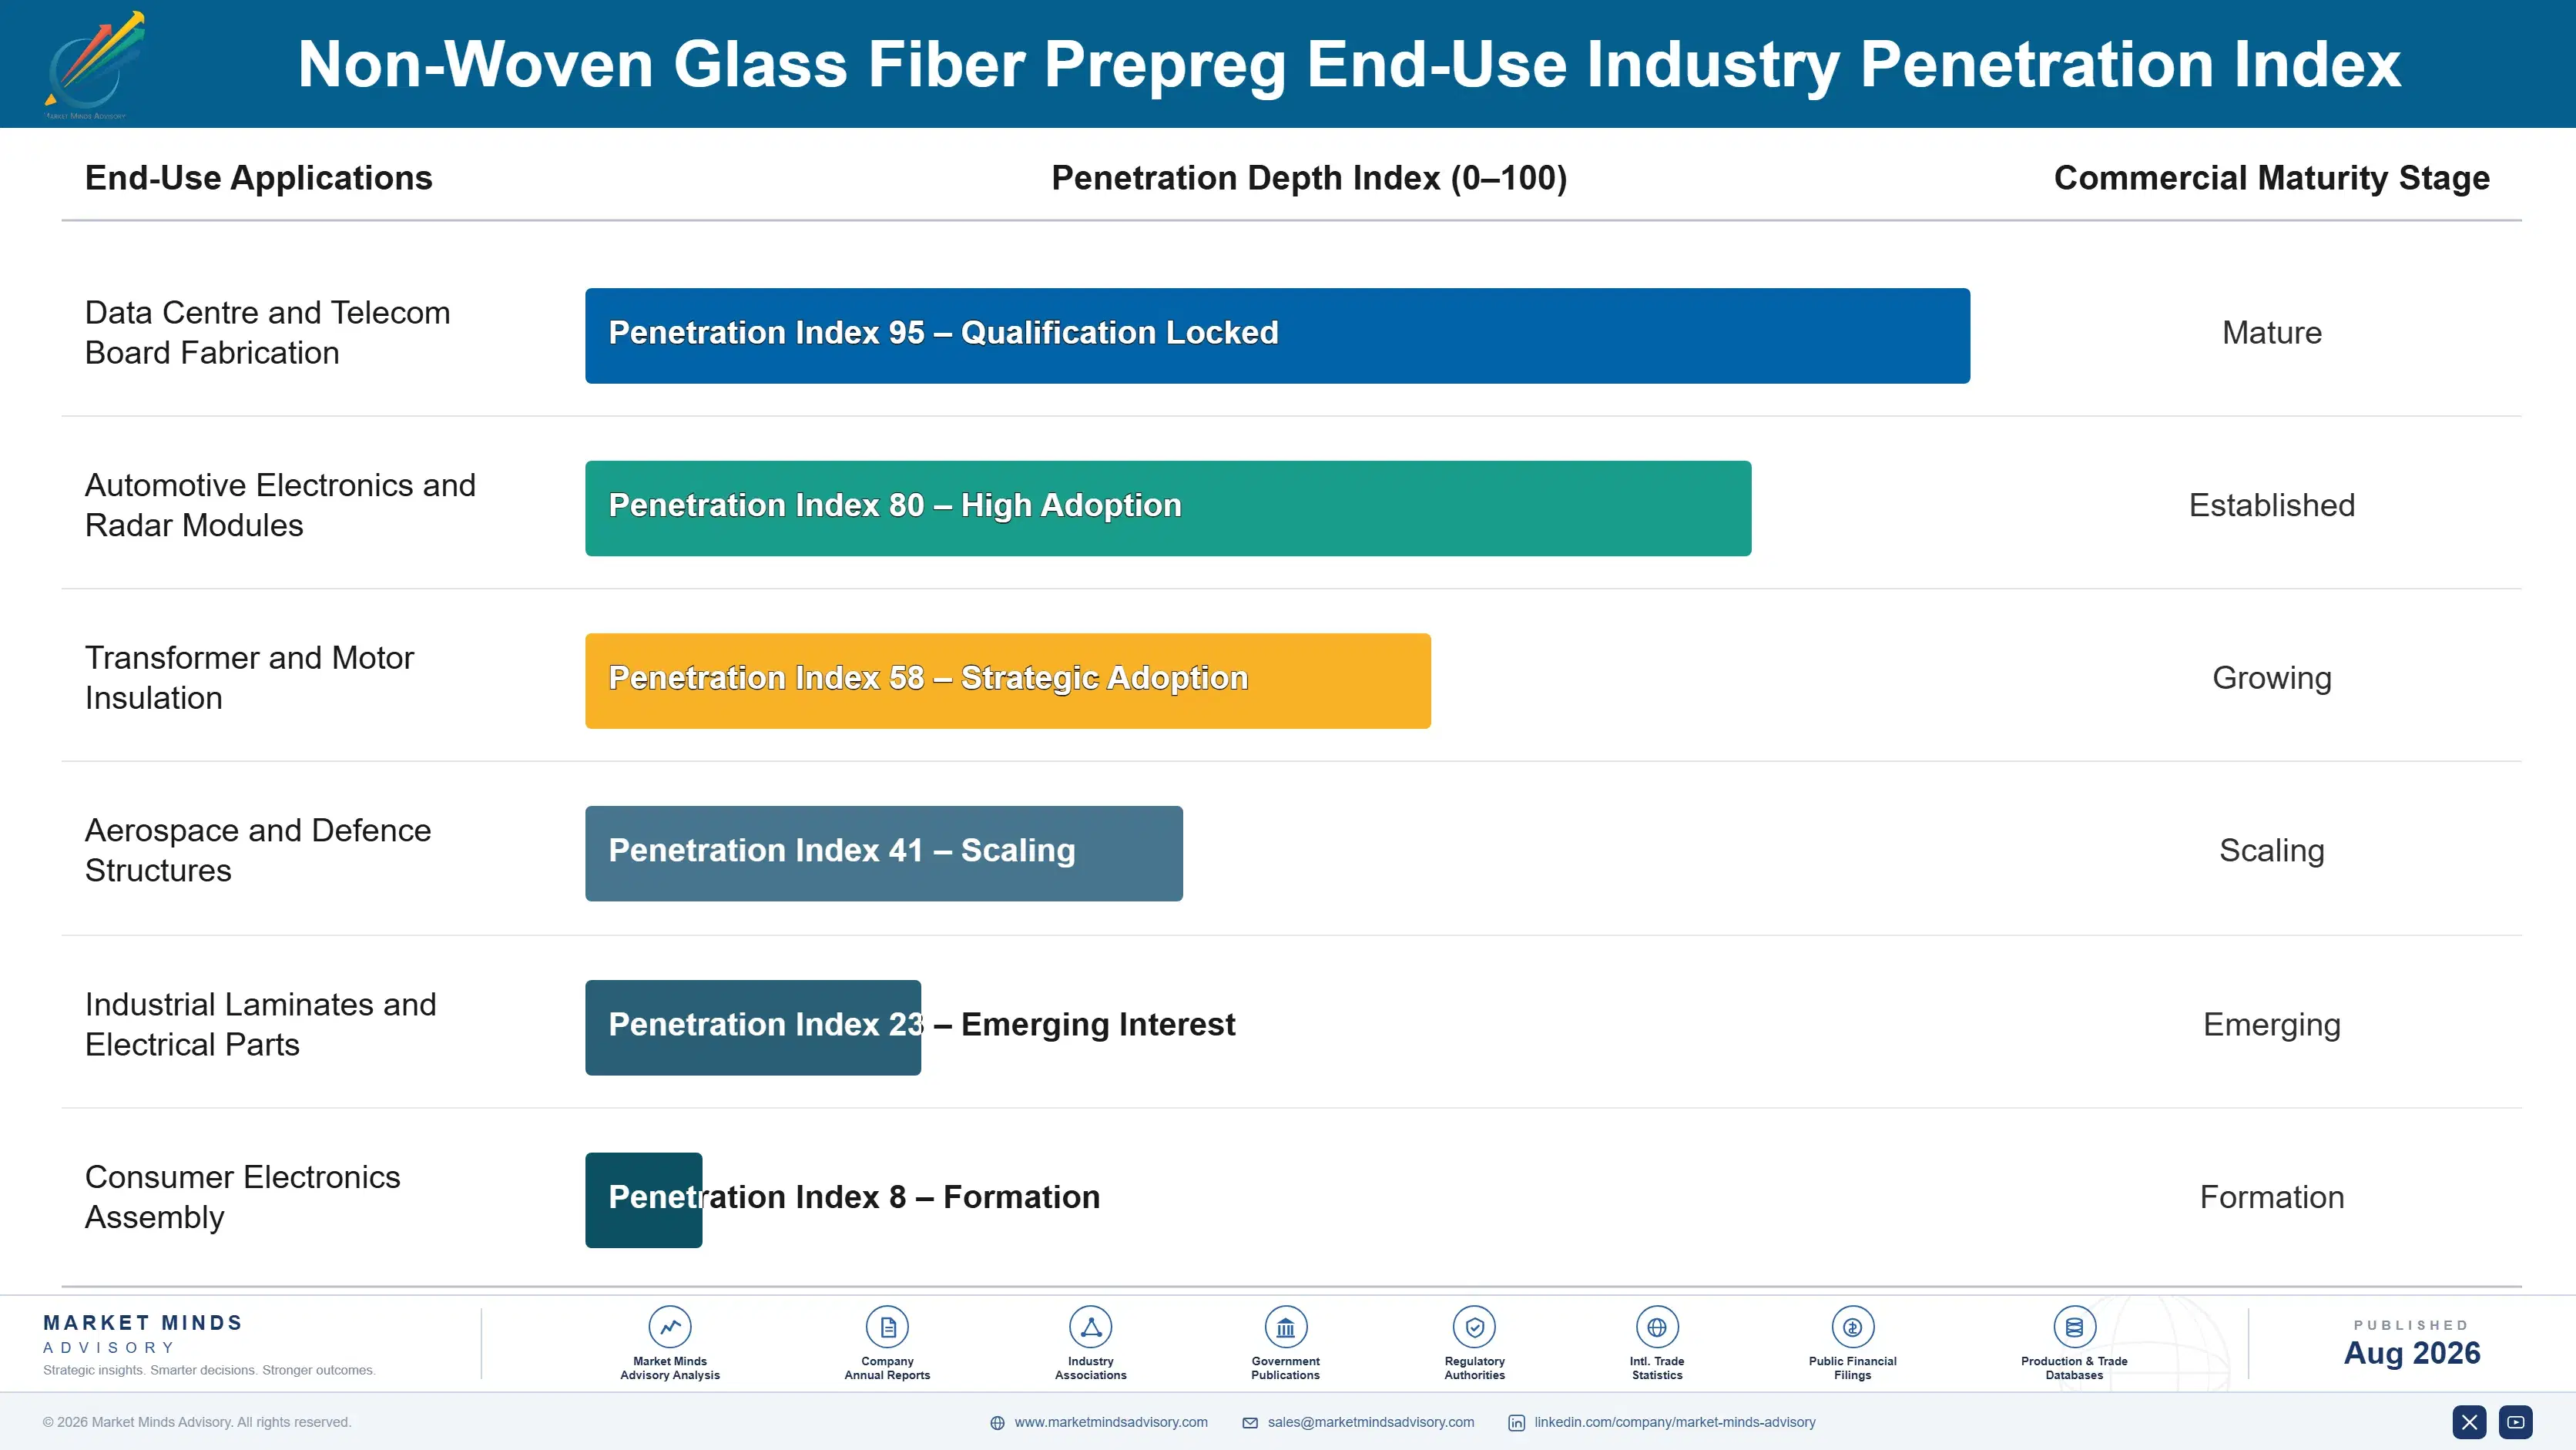
Prepreg revenue behaves as an annuity attached to a qualified design rather than a series of orders. Once material is qualified into a board stackup or a motor insulation system, it ships against that design for its production life, because requalification means the customer's own customers requalifying too.
Stickiness varies considerably by end use. Aerospace and defence positions are the tightest, holding for the production life of an airframe and effectively immune to competitive challenge once established. Transformer insulation sits close behind, since builders qualify materials into type-tested designs already approved by certification bodies. Data centre board material is tighter than its volatility suggests, locked for a design generation but reopening when the next silicon arrives. Industrial laminate work is barely sticky, with converters switching on delivered price whenever certification permits.

Buyer profiles have shifted noticeably. Material selection once sat with process engineers judging on resin flow, handling and price. It now involves signal integrity engineers, compliance functions and supply security teams asking about dielectric consistency across lots, halogen declarations and allocation guarantees. Producers whose commercial organisations still lead with data sheets and quotations find themselves talking to people for whom availability is the first question rather than the last.
non-woven-glass-fiber-prepreg-market-end-use-penetration-index-1787311389911

Where To Place Capital

These are among the four positions where our research anticipates prominent divergence between winners and laggards over the coming forecast period. Each is grounded in the demand model, the regulatory perimeter, and the announced capacity pipeline.
01 / LOW-DIELECTRIC CONVERSION TIMING

Convert treaters before the demand confirms itself

Qualified low-dielectric capacity is genuinely short, and producers who converted before 2024 are allocating supply at three to four times standard epoxy pricing rather than quoting against competitors for it. Conversion costs $12 million to $22 million per line and takes fourteen months including requalification, so committing requires a forecast rather than an order book. Boards that wait for confirmation will pay identical capital and arrive precisely as the pricing premium begins compressing against them rather than working in their favour.
02 / VEIL ALLOCATION SECURITY

Secure the glass before converting the line

Low-dielectric glass veil is scarcer still than qualified treater capacity, and converted lines without secured allocation end up running standard epoxy at ordinary commodity margins. Multi-year offtake, and in several cases direct equity participation in veil capacity, costs premiums of eight to twelve percent over spot pricing. Against finished prepreg selling at three to four times standard grade pricing, that premium is close to irrelevant, and the practical alternative is an expensively converted line running commodity material at commodity margins.
03 / QUALIFICATION BREADTH STRATEGY

Multiple resin systems beat one excellent chemistry

Each switching silicon generation restarts qualification rather than extending it, so single-chemistry producers rejoin the queue every cycle while multi-system lines simply move the customer across instead. Lines qualified across three or more resin systems win roughly 60% of the programmes they contest against single-system competitors. The throughput cost of changeovers and multi-system qualification maintenance is real, typically six to nine percent of available line time, and that friction is precisely what keeps the competitive field manageable for those who accept it.
04 / INSULATION VOLUME RETENTION

Keep the unglamorous work that loads treaters

Insulation and industrial laminate grades earn gross margins around 24% against low-dielectric material earning roughly double that, which makes dropping that work look superficially attractive to any board reviewing its portfolio mix on margin alone. Producers carrying both report treater utilisation roughly 12 percentage points above electronics-only competitors across a full business cycle. The 2023 correction showed exactly what happens to treater economics when hyperscaler demand pauses and there is simply no predictable insulation volume sitting underneath it to absorb the shock.

Engagement Snapshot From the Field

A live engagement with an industry participant carrying material or product regulatory and market exposure ahead of a defining policy shift, showing how our research translates into a defensible multi-year portfolio strategy.
MARKET MINDS ADVISORY · CLIENT ENGAGEMENT SUMMARY
Non-Woven Glass Fiber Prepreg Producer Strategic Portfolio Review and Transition Roadmap 2026·Investment Scenario on Non-Woven Glass Fiber Prepreg Exposure Evaluation 2025-26
CLIENT PROFILE
A privately held electrical insulation materials producer with annual revenue near $165 million (client-reported, unverified by MMA), operating four treater lines across two Central European sites. Roughly 84% of revenue came from transformer and motor insulation prepreg sold on annual and multi-year contracts, with no electronics-grade qualification anywhere in the portfolio and no low-dielectric capability at either site.
STRATEGIC CHALLENGE
Insulation margins had compressed by four points across three years as resin costs moved against fixed contracts, while the company watched competitors earn markedly better returns on electronics-grade material. The board wanted to establish whether converting a treater line for low-dielectric production represented a credible entry, and what the realistic timeline to any revenue would actually be.
MMA APPROACH
MMA modelled conversion economics against three demand scenarios, mapped qualification pathways through both board fabricators and laminators, and assessed low-dielectric glass veil availability against the client's likely allocation position as a new entrant. Findings were tested against 47 expert interviews covering fabricator qualification practice, veil supply arrangements and competitor conversion programmes across Europe and Asia.
KEY FINDINGS
  1. Low-dielectric pricing premiums were forecast to compress from roughly three and a half times standard epoxy toward two by 2030 as competing conversions across Asia completed.
  2. Glass veil allocation, not treater capacity, would gate the client's output, and as a new entrant it would rank behind established buyers during any period of tightness.
  3. Qualification through European laminators rather than Asian fabricators would cut roughly six months from a nineteen-month cycle but limited the addressable programme pool considerably.
  4. Indexing existing insulation contracts to resin benchmarks would recover an estimated $4.2 million annually (client-reported, unverified by MMA), exceeding the first three years of projected electronics margin.
CLIENT PROFILE
A privately held electrical insulation materials producer with annual revenue near $165 million (client-reported, unverified by MMA), operating four treater lines across two Central European sites. Roughly 84% of revenue came from transformer and motor insulation prepreg sold on annual and multi-year contracts, with no electronics-grade qualification anywhere in the portfolio and no low-dielectric capability at either site.
STRATEGIC CHALLENGE
Insulation margins had compressed by four points across three years as resin costs moved against fixed contracts, while the company watched competitors earn markedly better returns on electronics-grade material. The board wanted to establish whether converting a treater line for low-dielectric production represented a credible entry, and what the realistic timeline to any revenue would actually be.
MMA APPROACH
MMA modelled conversion economics against three demand scenarios, mapped qualification pathways through both board fabricators and laminators, and assessed low-dielectric glass veil availability against the client's likely allocation position as a new entrant. Findings were tested against 47 expert interviews covering fabricator qualification practice, veil supply arrangements and competitor conversion programmes across Europe and Asia.
KEY FINDINGS
  1. Low-dielectric pricing premiums were forecast to compress from roughly three and a half times standard epoxy toward two by 2030 as competing conversions across Asia completed.
  2. Glass veil allocation, not treater capacity, would gate the client's output, and as a new entrant it would rank behind established buyers during any period of tightness.
  3. Qualification through European laminators rather than Asian fabricators would cut roughly six months from a nineteen-month cycle but limited the addressable programme pool considerably.
  4. Indexing existing insulation contracts to resin benchmarks would recover an estimated $4.2 million annually (client-reported, unverified by MMA), exceeding the first three years of projected electronics margin.
RECOMMENDED STRATEGY
Phase 1: Phase one: index all insulation contracts to published resin benchmarks before committing any capital, recovering margin that requires no investment at all. Phase 2: Phase two: secure multi-year low-dielectric glass veil offtake ahead of conversion, treating allocation rather than treater capacity as the genuine entry gate. Phase 3: Phase three: convert one treater line only, qualifying through European laminators first and holding the remaining three lines on insulation volume throughout.
OUTCOME
The client indexed 79% of insulation contract value within six months and secured veil offtake before committing conversion capital, reporting recovered margin of approximately $3.8 million in the first full year (client-reported, unverified by MMA). Conversion of a single line proceeded on that basis, with the remaining treaters held deliberately on insulation volume.

Frequently Asked Questions

Foundational context covering the market sizes, CAGR, scope, country, region and competition that inform every finding below. This section is provided to cover basics and most often pre-purchase conversations, answered from the MMA Primary Research Dataset.

What is the current size of the Non-Woven Glass Fiber Prepreg Market?

The market was worth $1.4 billion in 2025 and is forecast to reach $1.51 billion in 2026. Growth reflects both volume expansion and a mix shift toward low-dielectric grades.

How large will the Non-Woven Glass Fiber Prepreg Market be by 2036?

MMA forecasts $3.26 billion by 2036, an expansion multiple of 2.16 times the 2026 base. That represents $1.75 billion of incremental value across the forecast period.

What is the CAGR for the Non-Woven Glass Fiber Prepreg Market 2026 to 2036?

The base case compound annual growth rate is 8.0%, with a bull case of 9.2% and a bear case of 6.8%. Historical growth from 2020 to 2025 also ran at 6.8%.

Which segment is growing fastest?

Low-dielectric hydrocarbon and PPE resin prepreg at 12.0%, a full 1.50 times the market rate. Data centre switching boards and automotive radar modules drive that demand.

Who are the major companies in the Non-Woven Glass Fiber Prepreg Market?

Panasonic Industry, Rogers Corporation, Shengyi Technology, Elite Material and Isola Group lead with 49% between them. Fifteen further producers hold meaningful grade or regional positions.

Which country is growing fastest?

Vietnam at 11.4%, as board fabrication relocates there from China. Almost no qualified treater capacity exists locally, so material still arrives from Taiwan and Japan.

Report Segmentation Architecture

The full report scope spans multiple orthogonal segmentation dimensions, with cross-tabulated demand data provided for each dimension pair. Coverage extends further to regional breakdowns, trend trajectories, and the competitive detail needed to support segment-level decision-making.

By Resin System

  • Low-Dielectric Hydrocarbon and PPE Resin Prepreg
  • Cyanate Ester and Bismaleimide Prepreg
  • Modified Halogen-Free Epoxy Prepreg
  • Phenolic Resin Prepreg
  • Standard Epoxy Prepreg
  • Polyester and Vinyl Ester Prepreg

By End-Use Industry

  • Data Centre and Telecom Board Fabrication
  • Automotive Electronics and Radar Modules
  • Transformer and Motor Insulation
  • Aerospace and Defence Structures
  • Industrial Laminates and Electrical Parts
  • Consumer Electronics Assembly

By Commercial Dimension

  • Direct Supply to Board Fabricators
  • Laminator and Converter Channel
  • Transformer Builder Supply Agreements
  • Distributor and Stockist Sales
  • Toll Impregnation and Custom Formulation

By Region

  • North America
  • Western Europe
  • East Asia
  • South Asia and Pacific
  • Latin America
  • Middle East and Africa
  • Eastern Europe

Scope, Methodology, and Coverage

Every figure in this report is reproducible from documented input assumptions. The scope below maps the historical period, the forecast horizon, the segmentation dimensions, and the countries covered, alongside the underlying primary and qualitative methodology.
Historical Period
2020 to 2025
Forecast Period
2026 to 2036
Base Year
2025 (USD billions; MMA Primary Research Dataset, August 2026)
Market Definition
This report covers non-woven glass fibre prepreg, defined as wet-laid glass veil, chopped strand mat or randomly oriented glass web impregnated with a thermoset resin system and supplied in partially cured B-stage form. Coverage spans standard epoxy, modified halogen-free epoxy, phenolic, polyester, vinyl ester, cyanate ester, bismaleimide and low-dielectric hydrocarbon and polyphenylene ether systems. Woven glass fabric prepreg, carbon and aramid fibre prepreg, dry glass veil supplied without resin, finished copper clad laminate and cured composite parts are excluded from scope.
Quantitative Units
USD billions at producer realised prices; volume in million square metres; gross margin percentages and treater utilisation by tier.
Segmentation Dimensions
Resin system, end-use industry, commercial dimension, region.
Regions Covered
North America, Western Europe, East Asia, South Asia and Pacific, Latin America, Middle East and Africa, Eastern Europe
Countries Covered
China, Taiwan, Japan, South Korea, Vietnam, Thailand, India, Malaysia, United States, Canada, Mexico, Germany, Austria, Switzerland, Italy, France, Brazil, Poland, Czechia, Turkey.
Key Companies Profiled
Panasonic Industry, Rogers Corporation, Shengyi Technology, Elite Material, Isola Group, Nan Ya Plastics, Doosan Electro-Materials, ITEQ Corporation, Von Roll, Krempel, and ten further producers.
Quantitative Methodology
Primary survey, n=3,800 respondents, Q4 2025, six countries; demand-side model with trade association cross-validation
Qualitative Methodology
47 expert interviews, Q4 2025; applied to validate demand model assumptions, identify emerging dynamics, and assess competitive positioning
Report Format
PDF and XLSX data workbook (Word format preview document)
Publisher
Market Minds Advisory
Report Code
MMA-2026-CHM-725
Published
August 2026
Contact
sales@marketmindsadvisory.com | www.marketmindsadvisory.com

Purchase the full Non-Woven Glass Fiber Prepreg Market Report (2026 to 2036).

The full report sets out ten-year forecasts for non-woven glass fibre prepreg by resin system, end-use industry and commercial model across seven regions. It quantifies treater conversion economics line by line and maps qualified low-dielectric capacity against committed board programme demand through 2030. Glass veil availability is modelled separately as the binding upstream constraint, with allocation positions assessed producer by producer. Competitive assessment covers twenty producers on a consistent revenue basis, separating qualification breadth from installed treater capacity. Findings draw on a quantitative survey of 3,800 respondents across six countries and 47 expert interviews conducted during the fourth quarter of 2025.
Ten-year forecasts by resin system and region
Treater conversion economics modelled line by line
Glass veil availability modelled as upstream binding constraint
Twenty-producer competitive assessment on consistent revenue basis
Qualification timelines benchmarked across fabricator and laminator routes
Margin architecture across three commercial portfolio tiers

Built For The People Who Decide

From boardroom strategy to bench-side execution, this report is read cover-to-cover by leaders shaping the next decade of their industry, turning demand scenarios, market dynamics and valuation benchmarks into decisions.
CXOs/ Presidents/ VPs/ Managers
M&A and Corporate Development
Strategy Teams and R&D Heads
Procurement and Product Directors
Regulatory and Compliance Leaders
Investor Relations and Equity Analysts