
Market Minds Advisory
Non-Fluorinated Barrier Technology Market

Non-Fluorinated Barrier Technology Market Analysis 2026-2036

Food packaging converters are converting PFAS-based grease barriers to non-fluorinated bio-polymer and mineral coatings as state-level PFAS bans and food-contact safety regulation make fluorinated barriers a direct global compliance liability.

Lead Analyst

Bilal Shaikh

Published

November 2026

Make Smarter Decisions with Customized Research Insights

Request a free sample report and evaluate market opportunities, growth trends, and competitive dynamics relevant to your business needs.

2025 MARKET VALUE$1.2BMarket Size 2025
2036 FORECAST VALUE$4.0BBase Case , 2026 to 2036
CAGR 2026 TO 203611.5 %Bull 12.8% / Bear 10.2%
INCREMENTAL OPPORTUNITY$2.6BNet 10- year value creation
EXPANSION MULTIPLE2.97x2036 value over 2026 base
Strategic Levers
M&A Pipeline
Regional Outlook
Country Rankings
Competitive Intelligence
Segmental Deep-dive
Call-Us : 91 93563 13602

Non-Fluorinated Barrier Technology Market Outlook

Non-fluorinated barrier technology is moving from a niche compliance alternative into a mandatory specification, as state-level PFAS bans and food-contact safety regulation make fluorinated grease barriers a direct cost and compliance liability for food packaging converters across most global retail and foodservice channels and markets studied today.
Three forces are converging: PFAS restriction and food-contact safety regulation that increasingly favors non-fluorinated coatings over fluorinated grease barriers across most jurisdictions worldwide today, food packaging brands standardizing non-fluorinated specification across entire paper and fiber portfolios rather than pilot categories only, and formulators closing the barrier-performance gap that long confined non-fluorinated coatings to low-grease applications only. Non-fluorinated grease and oil resistant coatings are the fastest-growing of five tracked technologies in this category today.
Competitively, diversified global specialty chemical and coating formulators with decades of barrier-chemistry scale are defending position against specialty regional converters expanding from single-customer programmes into multi-brand retail contracts nationwide and across most major export markets served today. Regulatory momentum across major food safety markets, combined with continued bio-polymer innovation, keeps pulling coating specification toward non-fluorinated formats faster than voluntary brand preference alone would have achieved.
Market Definition
The non-fluorinated barrier technology market covers bio-polymer, mineral-based, water-dispersion, and other PFAS-free barrier coatings applied to paper, molded fiber, and food packaging to provide grease, oil, and water resistance. It excludes fluorinated (PFAS-based) barrier coatings and general packaging printing inks tracked separately by MMA. Measured on its own, the water-based barrier coatings for food packaging market is valued by MMA at USD 1.4 billion in 2025, heading to USD 3.69 billion by 2036.
Base Year Value
$1.2B in 2025 (MMA Primary Research Dataset, October 2026)
Forecast Period
2026 to 2036, eleven discrete annual values
CAGR
11.5% base case. Bull 12.8%. Bear 10.2%.
Fastest Growth Segment
Non-Fluorinated Grease and Oil Resistant Coatings: 14.0% CAGR
Fastest Growth Country
France: 12.8% CAGR
Fastest Growth Region
South Asia and Pacific: 13.5% CAGR
Largest Region
North America: 30% of 2025 global value
Market Leaders
Solenis LLC, Archer Daniels Midland Company, Imerys S.A., Omya AG, Michelman Inc. Source: MMA Analysis based on company annual reports.
Primary Survey
n=3,800 procurement and R&D decision-makers, Q4 2025, six countries
Methodology
Demand-side build-up, cross-validated against public data, 47 expert interviews

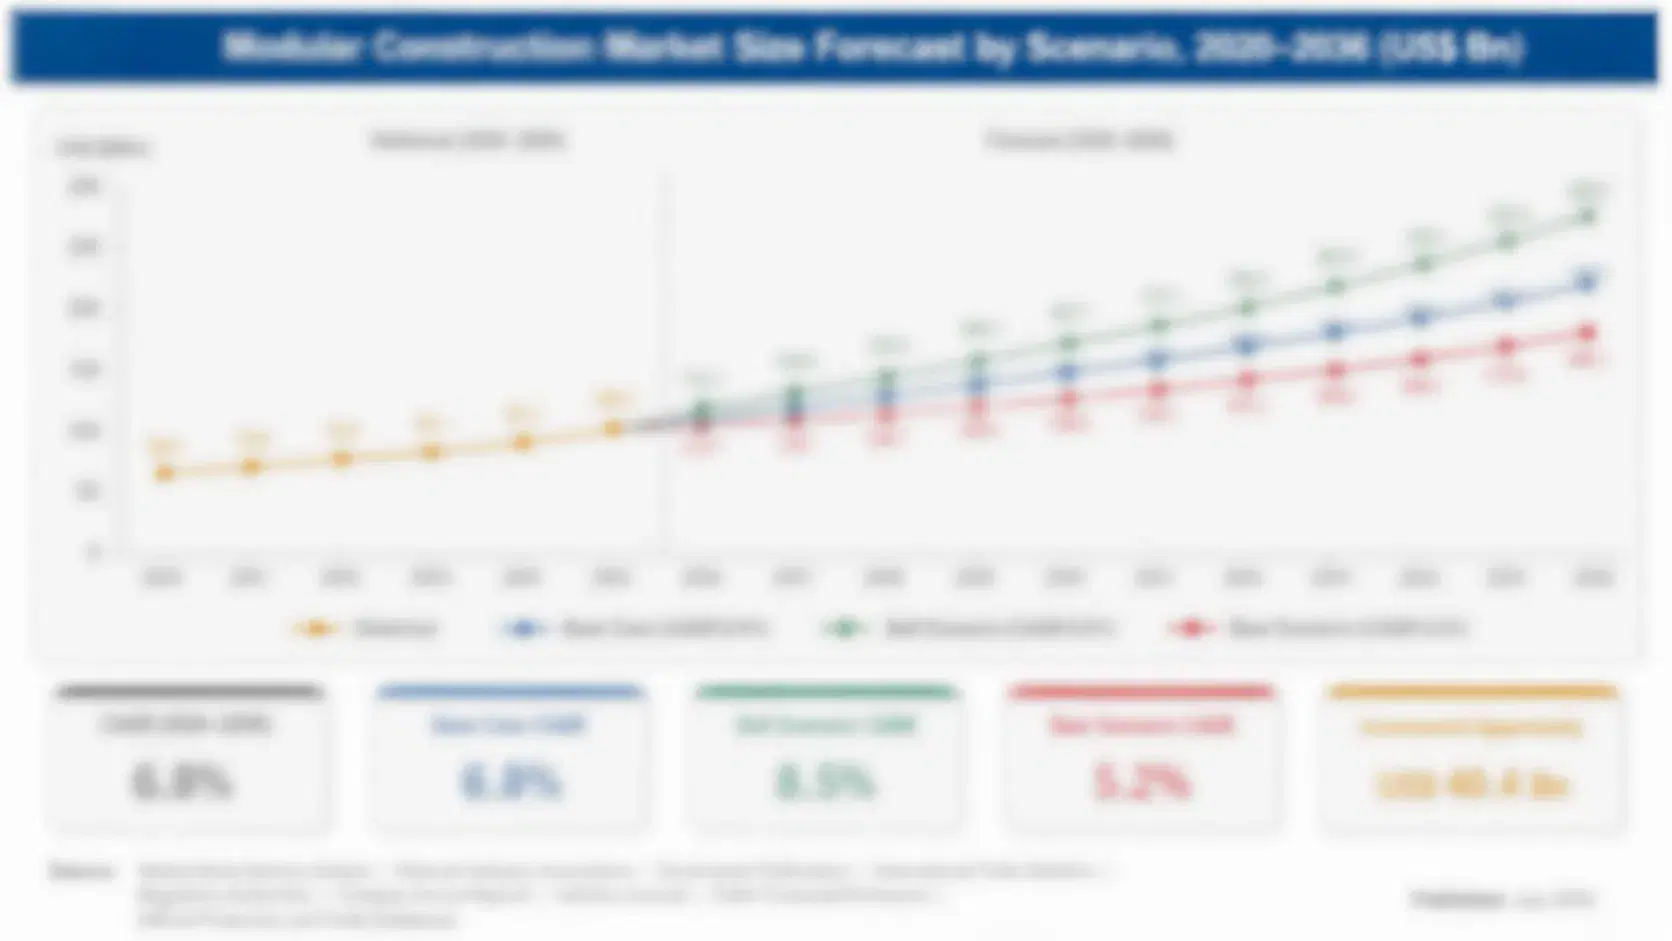
Non-Fluorinated Barrier Technology Base, Bull and Bear Cases

non-fluorinated-barrier-technology-market-size-forecast-scenario-1791601304542
Between 2020 and 2025, non-fluorinated barrier technology grew steadily as early adopter food packaging converters converted flagship paper and fiber lines to bio-polymer and mineral coatings, while most independent converters elsewhere continued relying on fluorinated grease barriers given unresolved barrier-performance and cost gaps across most packaging categories tracked worldwide throughout this entire gradual, uneven five-year transition period.
The base case assumes three mechanisms hold through 2036: PFAS restriction and food-contact safety regulation keeps extending into additional packaging categories and jurisdictions, food packaging brands keep consolidating non-fluorinated specification across entire paper and fiber portfolios rather than pilot categories alone, and formulators keep closing the remaining barrier-performance gap with fluorinated coatings. Together these push non-fluorinated barrier technology from a compliance-driven niche into a default packaging specification within the forecast window ahead across most major food safety and retail markets worldwide.
The bull case assumes a major global food packaging converter mandates non-fluorinated coating specification across its entire paper and fiber portfolio within eighteen months, pulling conversion volume sharply higher across peer converters simultaneously. The bear case assumes fluorinated coating costs fall faster than expected, giving converters a lower-cost compliance path that competes directly with non-fluorinated adoption on landed cost.

Why Fluorinated Coatings Became a Compliance Risk

Non-fluorinated barrier technology sits at the intersection of three converging forces: PFAS restriction and food-contact safety regulation that increasingly favors non-fluorinated coatings over fluorinated grease barriers, food packaging brands standardizing non-fluorinated specification across entire paper and fiber portfolios instead of pilot categories, and formulators closing the barrier-performance gap that long confined non-fluorinated coatings to low-grease applications. Formulators once limited to commodity-grade coatings are now qualifying premium formats.
TOP PRODUCING COUNTRY SHARE35%Anchors the largest share of non-fluorinated coating capacity today
MARKET CONCENTRATION (CR5)35%Formulators hold just over a third of share
AVERAGE SELLING PRICE PREMIUM15% above fluorinated equivalentsNon-fluorinated coatings price modestly above fluorinated equivalents overall
GREASE RESISTANCE PASS RATE85% to 93%Typical grease-resistance pass rate for non-fluorinated coating formats
FEEDSTOCK SHARE OF COGS41% of totalBio-polymer and mineral inputs dominate overall coating cost structures
QUALIFICATION CYCLE LENGTH6 to 10 weeksTypical duration of a coating's food-contact qualification process overall
Commercially, this remains a moderately concentrated market, since credible non-fluorinated coating formulation depends on a relatively small number of specialty chemical producers with both barrier-chemistry scale and food-contact validation engineering capability simultaneously. Diversified global specialty chemical formulators compete for enterprise brand contracts spanning multiple barrier categories, while specialty regional converters supply adjacent coating and lamination chemistries those diversified formulators increasingly license or acquire. Average selling prices for non-fluorinated coatings sit modestly above fluorinated equivalents.
Over the next decade, expect non-fluorinated barrier technology to extend well beyond grease-resistant paper into a mainstream specification across most foodservice, bakery, and molded fiber categories. Regulatory momentum across major food safety markets, alongside continued bio-polymer innovation, will likely accelerate this shift faster than voluntary brand preference alone would drive it.
"A grease-resistant wrapper used to be something nobody questioned until the lab results came back, and now it is the thing a formulator redesigns from scratch because the old fluorinated coating just became a liability."
Director, Sustainable Packaging and Bioplastic Films Practice · MMA Sustainable Packaging & Bioplastic Films Practice · October 2026

Key Trends in Non-Fluorinated Barrier Technology

Brands Standardize Non Fluorinated Coatings Nationwide Right Now

Major food packaging brands have begun standardizing on non-fluorinated coating specification across their entire paper and fiber portfolio rather than converting pilot categories alone, since portfolio-wide standardization simplifies both regulatory labeling documentation and supplier sourcing across dozens of product categories simultaneously. This is pulling formulators that previously supplied only isolated regional contracts into direct multi-brand platform development, since retailer contracts increasingly specify one PFAS-free standard across varied bakery, foodservice, and molded fiber applications. Brands that completed this standardization are citing reduced liability exposure directly in their compliance disclosures, pushing peer brands toward similar portfolio-wide commitments nationwide.
Market Impact: Covers coating volume worth $290M globally
Bio-Polymer Innovation Closes the Barrier Gap

Bio-polymer and mineral-dispersion coating technology has reached grease-resistance performance roughly equivalent to fluorinated barriers for most standard bakery and foodservice applications nationwide, closing a gap that previously confined non-fluorinated coatings to low-grease applications only across most global packaging categories studied closely worldwide. This is accelerating brand conversion decisions for demanding categories that previously required fluorinated barriers specifically to meet strict grease-resistance and oil-repellency requirements and standards. Formulators who closed this barrier gap earliest are capturing the bulk of new enterprise brand contracts as parity spreads across additional packaging categories nationwide and abroad.
Market Impact: Covers 14,000+ food packaging product lines

Non-Fluorinated Barrier Technology Strategic Opportunities

PFAS Bans Now Favor Non Fluorinated Coatings

Several major food safety markets have extended PFAS restriction and food-contact safety regulation to favor non-fluorinated coatings over fluorinated grease barriers previously treated identically under general packaging rules, pulling conversion volume well ahead of the pace voluntary brand sustainability commitments alone would have driven across the broader non-fluorinated coating category. This is forcing brands serving these markets to qualify non-fluorinated coatings across dozens of product categories simultaneously rather than one line at a time, compressing a transition that otherwise would have unfolded over many years. Brands who completed qualification earliest are capturing favorable pricing as jurisdictions extend similar regulation.
Market Impact: Trails fluorinated barrier rating by 11%

Food Brands Reach Portfolio-Wide PFAS-Free Targets

Major food packaging brands have extended corporate sustainability commitments that previously targeted only flagship product lines into specific, measurable PFAS-free-content targets for their entire packaging portfolio, pulling conversion volume forward well ahead of the pace regulation alone would have achieved across most major food safety markets tracked closely. This is forcing formulators serving these brands to qualify non-fluorinated coatings across their full product range rather than piloting a handful of flagship lines. Formulators who completed qualification earliest are capturing the bulk of new multi-year supply agreements as additional brands extend similar commitments broadly nationwide.
Market Impact: Costs 15% more than fluorinated coatings

What Holds Back Non-Fluorinated Barrier Technology Growth

Barrier Performance Still Trails for High-Grease Categories

Non-fluorinated coatings, even with improved bio-polymer technology, still show reduced grease-resistance confidence relative to fluorinated barriers for the most demanding high-grease categories, particularly deep-fried and oil-heavy foodservice applications where any barrier shortfall directly risks package failure before sale. The underlying cause is molecular structure: non-fluorinated polymer coatings fundamentally lack the carbon-fluorine bond strength that gives fluorinated barriers their grease resistance in ways that no single formulation process can fully reverse for every demanding grease class. Formulators are mitigating this with advanced multi-layer coating design and extended-exposure testing that extend confidence closer to fluorinated-equivalent levels for most grease categories.
Market Impact: Covers 19,000+ food packaging product categories

Production Cost Still Limits Value-Tier Brand Adoption

Non-fluorinated coating production and formulation costs remain meaningfully above fluorinated coating costs across most regional markets, since specialized bio-polymer chemistry and food-contact validation testing cost more than simply applying standard fluorinated coatings through established manufacturing channels at current adoption levels. The underlying cause is scale: non-fluorinated coating production volumes remain a smaller share of total barrier coating flow, so formulators have not achieved the full economies of scale that make fluorinated coating production so cost-efficient today. This limits adoption to premium brands rather than value-tier categories. Formulators are mitigating this by scaling steadily toward parity.
Market Impact: Matches fluorinated barrier performance at 91%
3 additional market trends, 3 additional growth drivers, and 2 additional restraints and challenges are covered in the full report. Contact sales@marketmindsadvisory.com to access the complete intelligence.

Non-Fluorinated Barrier Technology Segment CAGR Comparison

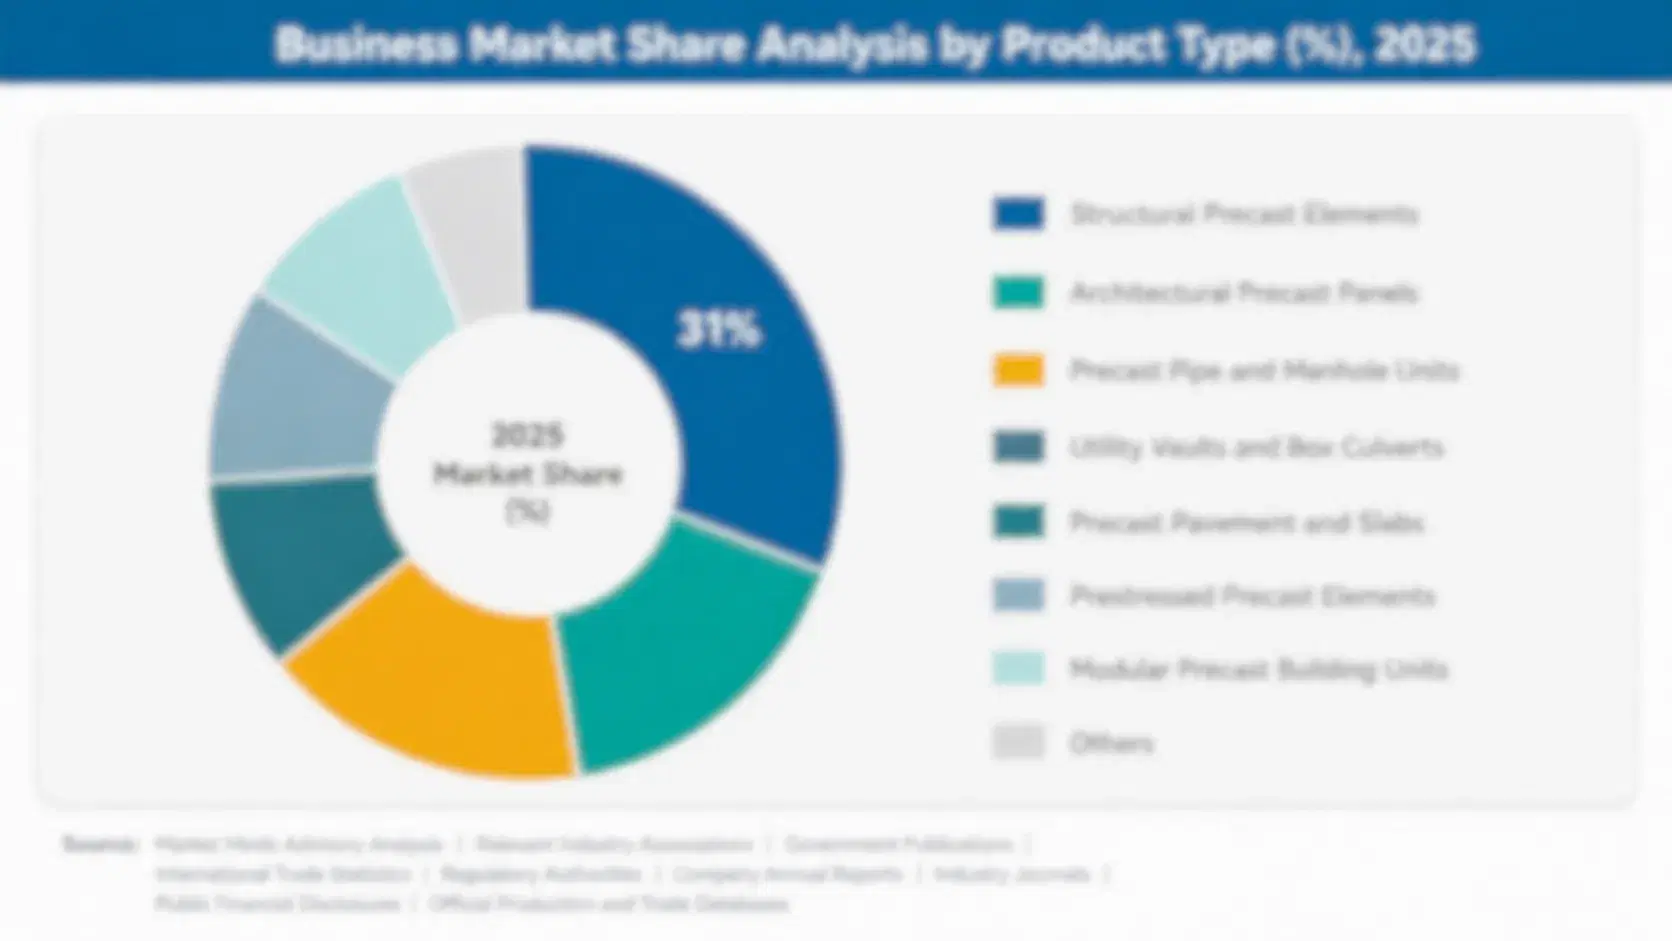
MMA segments the non-fluorinated barrier technology market by coating chemistry rather than by end-use application, since the same underlying formulation and converting platform increasingly serves multiple food packaging categories once a formulator qualifies the food-contact process and secures brand approval across product categories nationwide and abroad. Five coating chemistries are tracked in total across this category.
non-fluorinated-barrier-technology-market-market-share-analysis-1791601304716

Non-Fluorinated Grease and Oil Resistant Coatings

Non-fluorinated grease and oil resistant coatings combine bio-polymer film-forming chemistry with functional barrier additive technology to deliver grease-resistant paper and fiber packaging that meets food-contact safety thresholds without the PFAS compromise of earlier fluorinated barrier generations. Demand concentrates among bakery and foodservice brands seeking validated grease-resistance performance that meets both regulatory food-contact requirements and cost-reduction targets simultaneously across most packaging categories tracked. Growth runs well ahead of every other tracked chemistry as bio-polymer barrier technology reaches commercial viability across most major formulator networks tracked closely. Formulators with proven grease-resistant qualification are capturing the bulk of new enterprise brand contracts nationwide and abroad as adoption accelerates steadily each year across most markets studied today.
CAGR 14.0%

Bio-Polymer Barrier Coatings

Bio-polymer barrier coatings combine renewable polymer chemistry with multi-layer coating design to deliver barrier packaging that meets food-contact safety thresholds across a broader application range than mineral-based coatings typically serve today. Demand concentrates among premium food and foodservice brands seeking validated bio-based performance that meets both sustainability-positioning requirements and cost-reduction targets simultaneously across most packaging categories tracked closely nationwide. Growth trails non-fluorinated grease and oil resistant coatings only moderately, reflecting both strong brand interest in validated bio-polymer formats and continued formulation innovation that is lowering per-unit costs steadily across most participating formulators. Formulators with proven bio-polymer qualification are winning the largest multi-year brand agreements as adoption accelerates nationwide each year.
CAGR 12.5%
Full segment breakdown across 5 segments available in the complete report.

Non-Fluorinated Barrier Technology Regional Outlook

North America leads this market on state-level PFAS ban breadth and food-contact safety regulation scale today, with Western Europe and East Asia following closely behind each and every single passing calendar year without exception. South Asia and Pacific is growing fastest among all tracked regions studied.

North America

The United States drives the large majority of North American demand, reflecting both the largest state-level PFAS ban coverage globally and the most extensive established non-fluorinated coating formulator base covering most major retail and foodservice corridors nationwide and across most coating categories and formats studied. Major US food packaging brands are standardizing non-fluorinated specifications directly in retailer contracts, pulling formulator qualification forward faster than voluntary preference alone would have achieved across most food safety categories tracked. Canada's contribution is smaller but growing through its own federal food-contact regulations, generally following specifications closely aligned with US requirements given integrated cross-border retail supply chains. Formulators with proven barrier capability are winning the bulk of new contracts across this market today.
Share: 30% | CAGR: 12.5% (2026 to 2036)

Western Europe

Regulation defines Western Europe's position in this market more directly than pure production volume growth does elsewhere. The European Union's PFAS restriction proposal and food-contact safety regulation increasingly favors non-fluorinated coatings over fluorinated grease barriers across member states, giving the region a comprehensive compliance framework pushing food packaging brands toward non-fluorinated specification ahead of a staged compliance timeline. France hosts one of the strictest PFAS restrictions in the region, given its early national food packaging ban, while Germany and Denmark add further brand demand through large retail and export operations. Growth here trails East Asia and South Asia and Pacific because much of the initial compliance-driven conversion wave has already passed through the region's largest brands.
Share: 26% | CAGR: 10.0% (2026 to 2036)
Regional intelligence for 5 additional markets available in the complete report: East Asia, South Asia and Pacific, Latin America, Middle East and Africa, Eastern Europe. Contact sales@marketmindsadvisory.com.
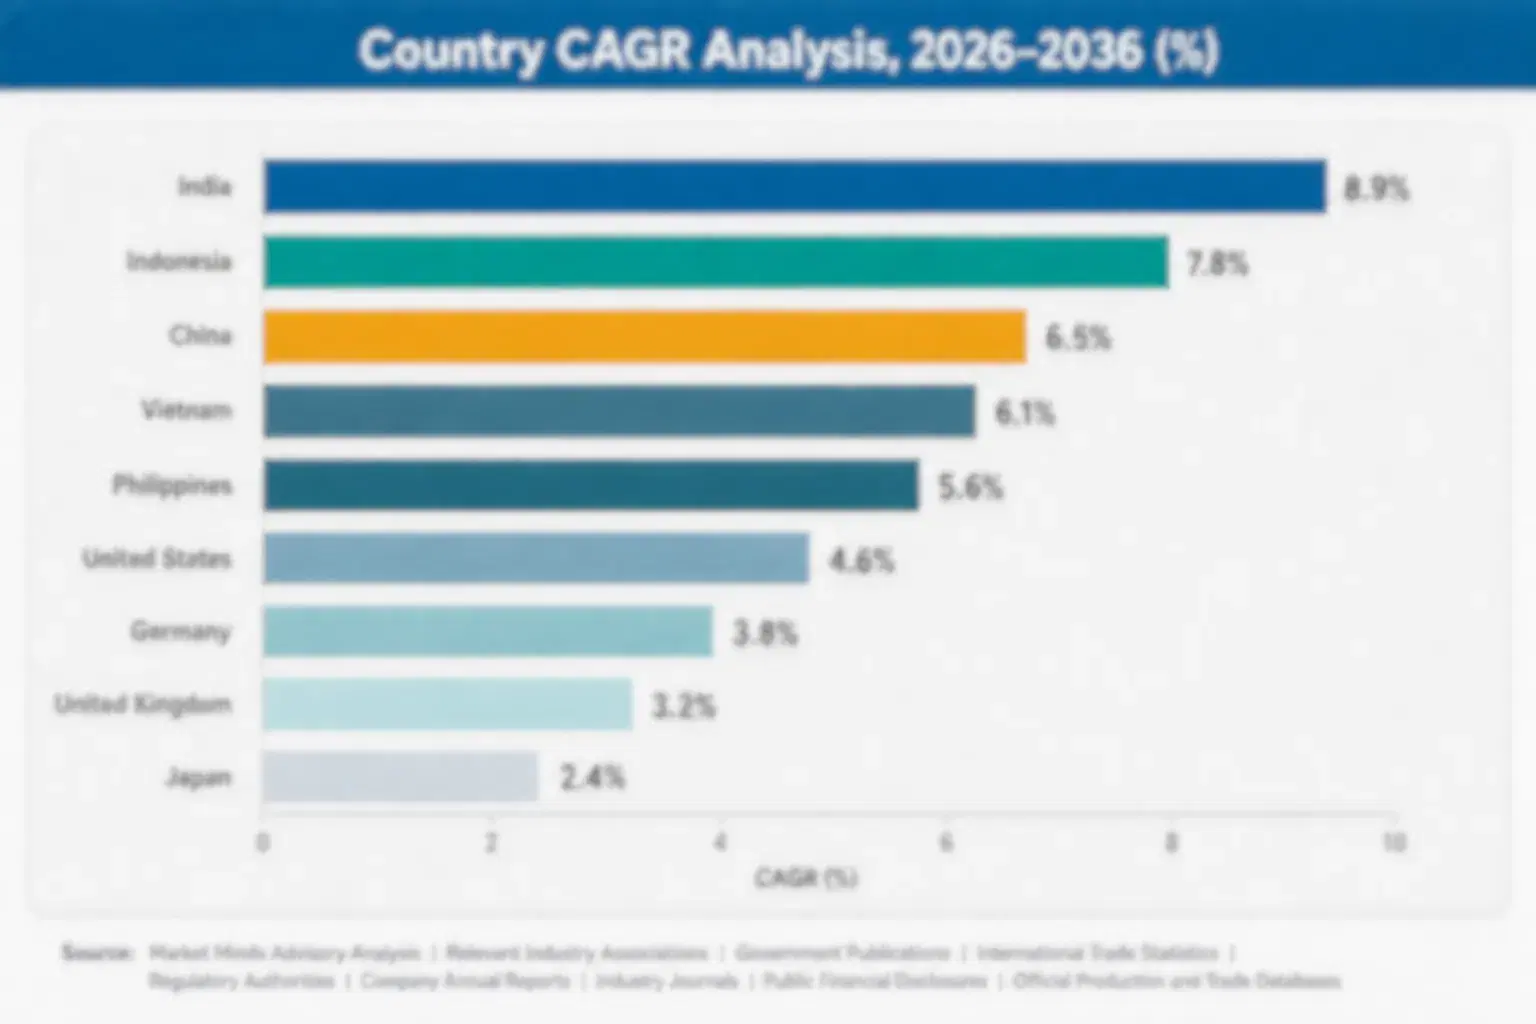
non-fluorinated-barrier-technology-market-country-cagr-analysis-1791601304895

Where Formulators Can Capture Premium Margin

Non-fluorinated barrier providers compete on bio-polymer chemistry breadth and brand co-development relationships more than on unit price alone, which opens several distinct routes to margin above the category average today. The clearest paths run through barrier technology licensing, portfolio-wide qualification programmes, brand co-development, and resin supply integration, each commanding a premium customers pay to simplify sourcing nationwide.

License Proprietary Bio Polymer Barrier Chemistry Early

Formulators that license proprietary bio-polymer barrier chemistry directly to competing formulators capture royalty revenue across a much broader customer base than a single exclusive operation would allow at comparable research investment and capital outlay each year without exception whatsoever across the entire category. This licensing-based positioning typically generates margin roughly 23% above direct formulation alone, reflecting the capital efficiency of licensing proven barrier chemistry rather than building formulation capacity for each individual brand relationship separately. Licensors with proven platforms are winning the largest multi-brand licensing agreements as this approach keeps spreading.
Market Impact: Generates licensing margin 23% above direct output today

Build Dedicated Portfolio Qualification Programmes Early

Formulators that build dedicated qualification programmes for portfolio-wide brand transitions capture multi-year supply agreements covering dozens of product categories simultaneously, rather than competing for individual line contracts one at a time against fragmented regional operators across the market each cycle and every single season without fail or exception whatsoever. This programme-based positioning typically prices at a premium of roughly 16% over equivalent volume sold through fragmented channels, reflecting the value brands place on a single formulator managing consistent qualification and compliance documentation across their full coating portfolio nationwide each year.
Market Impact: Prices programmes 16% above fragmented channel sales today

Co-Develop Non Fluorinated Formats With Food Brands

Formulators that co-develop coating specifications directly with food packaging brands capture contracts seeking barrier performance and compliance combinations that neither party can deliver alone at comparable cost or performance today across most demanding food safety categories and markets worldwide. This co-development approach typically prices at roughly 19% above standard non-fluorinated coatings sold independently, reflecting the joint testing investment and qualification coordination required between two previously separate supplier relationships across the industry. Formulators and brands who formalized this co-development earliest are winning the largest multi-year contracts as demand keeps spreading nationwide each year.
Market Impact: Prices co-developed formats 19% above standard output today

Integrate Backward Into Bio Polymer Supply Contracts

Larger formulators that integrate backward into dedicated bio-polymer resin supply contracts, rather than purchasing resin from third-party distributors, capture margin across both the resin and coating stages while insulating themselves from commodity price volatility that pure formulators must pass through to customers directly each cycle without exception across the category. This vertically integrated positioning typically prices finished non-fluorinated coatings at a premium of roughly 11% over equivalent volume made from distributor-sourced resin, reflecting the supply security and margin capture integrated formulators achieve across their full value chain nationwide today and going forward.
Market Impact: Prices integrated output 11% above distributor-sourced resin today

Non-Fluorinated Barrier Technology Value Chain and Margins

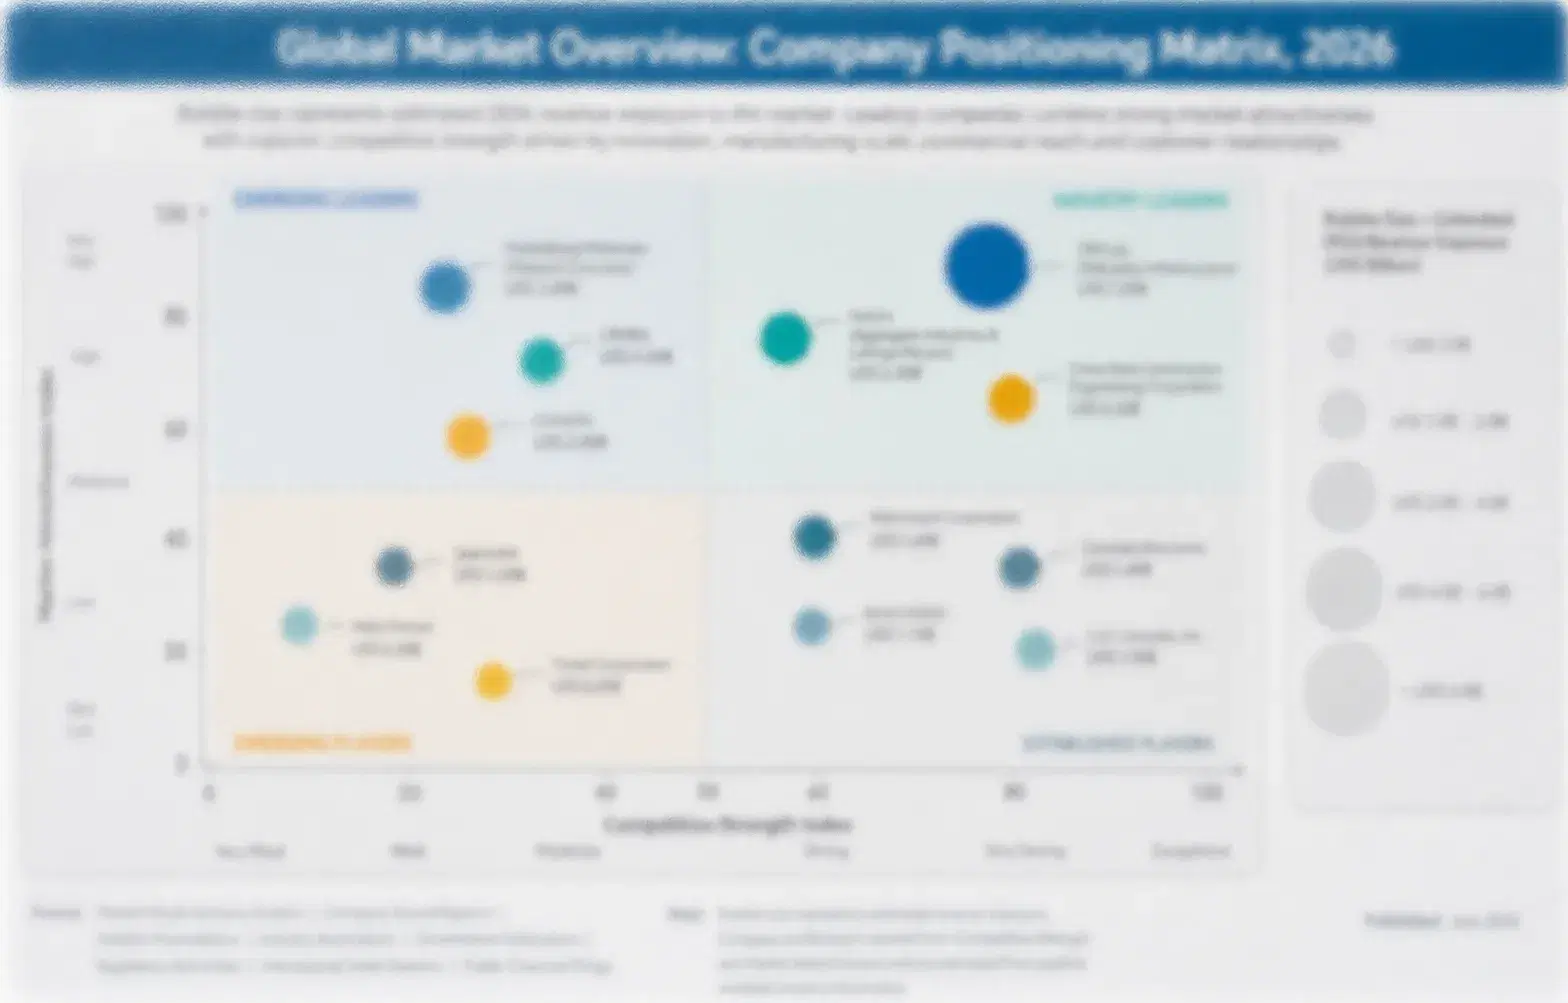
The competitive set spans diversified global specialty chemical formulators and specialty regional converters. CR5 sits at 35%, with Solenis LLC and Michelman Inc. holding leading positions as the largest diversified barrier coating platform and the proprietary bio-polymer technology leader respectively, while a long tail of regional formulators compete for remaining volume. The gap between the leaders and the next tier is widening as licensing matters more.
Current competitive activity centers on three fronts: bio-polymer barrier chemistry licensing that lets formulators extend performance without in-house formulation development, portfolio-wide qualification programmes that lock in multi-year brand relationships, and backward integration into resin supply contracts that insulates formulators from commodity volatility. Several mid-size formulators have also begun offering dedicated co-development as a differentiator today.

Emerging pressure comes from specialty regional converters expanding into multi-brand contracts from adjacent single-customer programmes, competing against diversified global formulators that built chemistry scale from legacy fluorinated coating manufacturing distribution. Expect consolidation over the next several years as these two previously separate competitive groups converge further, rather than either side building the core formulation competency from scratch on a timeline neither can afford given how quickly retailer standards continue reshaping the economics.
non-fluorinated-barrier-technology-market-company-positioning-matrix-1791601305073

Non-Fluorinated Barrier Technology Competitive Landscape

SOLENIS LLC

Moat: Largest Diversified Barrier Coating Platform

Solenis operates one of the largest diversified global specialty chemical and barrier coating formulator networks, giving it chemistry scale and brand relationship depth that smaller specialty regional formulators competing on one coating technology alone cannot easily replicate without comparable multi-decade manufacturing infrastructure and distribution networks worldwide.
SOLENIS LLC

Risk: Exposure to Capex Cycles

Solenis's non-fluorinated coating revenue depends heavily on overall paper mill and food packaging shipment volume cycles, exposing the business directly to retail demand swings and capital-expenditure timing in a way that diversified multi-category specialty chemical competitors simply do not experience to the same degree across their much broader operations.
MICHELMAN INC.

Moat: Proprietary Bio-Polymer Barrier Technology

Michelman's proprietary bio-polymer barrier coating technology gives it formulation performance depth and testing-validation scale that pure mineral-coating specialists competing on barrier thickness alone cannot easily replicate without comparable multi-decade coating research infrastructure, accumulated brand relationships, and well-established global distribution networks spanning many continents and markets worldwide.
MICHELMAN INC.

Risk: Dependence on Brand Capex Cycles

Michelman's non-fluorinated coating revenue concentrates heavily in food packaging brand capital-expenditure and procurement cycles, exposing the business directly to retail investment timing and resin price swings that diversified multi-sector competitors simply do not depend on as narrowly across their much broader global operations and revenue streams.

Players Tracked

Prominent Players

Solenis LLC
Archer Daniels Midland Company
Imerys S.A.
Omya AG
Michelman Inc.

Other Key Players

Kemira Oyj
Nippon Paper Industries Co., Ltd.
Stora Enso Oyj
Mondi Group
Sun Chemical Corporation
BASF SE
Dow Inc.
Croda International Plc
Cargill Inc.
Tate & Lyle PLC
Daicel Corporation
DIC Corporation
Synthomer Plc
Ecosynthetix Inc.
Omnova Solutions Inc.

Recent Developments

MARCH 2025

Solenis Expands Non-Fluorinated Coating Capacity

Solenis LLC announced a major expansion of its non-fluorinated barrier coating formulation and testing capacity, extending its production footprint to serve growing brand demand across multiple packaging categories and export markets worldwide. The expansion followed several multi-year supply agreements signed with major food packaging brands recently.
Signal: Signals that non-fluorinated coating providers are scaling toward mainstream retail procurement volume broadly across the entire industry.
JULY 2025

Michelman Signs Multi-Year Food Packaging Brand Agreement

Michelman Inc. signed a multi-year non-fluorinated coating supply agreement with a major global food packaging brand, securing committed volume well ahead of expected demand growth as non-fluorinated adoption accelerates nationwide across multiple packaging categories and formats today. The agreement includes joint bio-polymer development provisions nationwide and abroad.
Signal: Signals that diversified providers are prioritizing long-term brand relationships over spot-market sales broadly across the industry.
NOVEMBER 2025

Major Food Packaging Brand Mandates Non-Fluorinated Coatings Portfolio-Wide

A major global food packaging brand announced a mandate requiring non-fluorinated coating specification across its entire paper and fiber portfolio within a fixed multi-year timeline, extending requirements that previously applied only to select product lines nationwide today. Multiple formulators are competing for qualification across the expanded mandate today.
Signal: Signals that brand mandates are extending from select lines into full portfolio coverage broadly across the industry.

Bio-Polymer Inputs Drive Formulation Margin

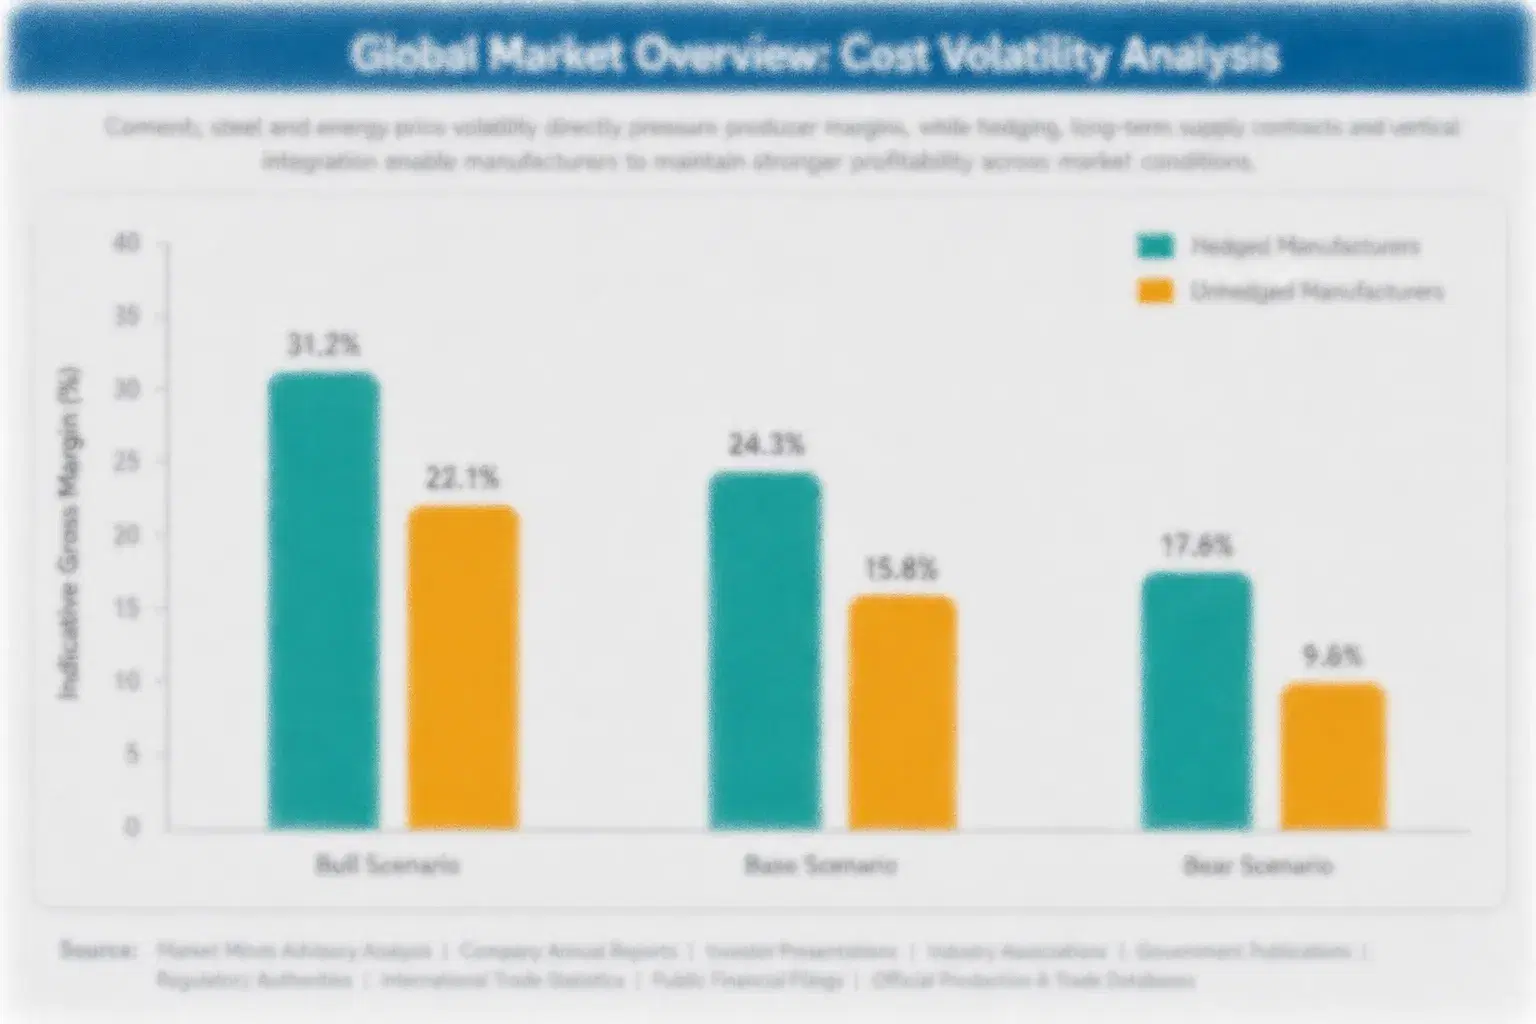
Bio-polymer and mineral dispersion inputs account for roughly 41% of formulation cost, with raw materials sourced from specialty chemical producers across the United States, Germany, and China, where production capacity continues expanding steadily year after year across most major global producing regions worldwide, supported by continued investment in dedicated formulation infrastructure built specifically to serve this growing category.
Bio-polymer feedstock costs rose sharply in 2022 as global supply chain disruption and energy cost spikes compressed specialty chemical output simultaneously, a volatility event several national chemical industry associations tracked through their feedstock price indices, compressing margins across formulators without long-term supply contracts in place at the time and forcing several smaller operators to renegotiate brand pricing mid-contract across multiple regions simultaneously and in several cases permanently.

Smaller regional formulators without direct bio-polymer supply relationships face a meaningful cost disadvantage, since they typically source raw materials through distributors at a markup that larger vertically integrated competitors avoid entirely. This gap is most pronounced for formulators serving value-tier food safety categories, where thinner margins leave less room to absorb distributor markups than premium brand accounts can comfortably tolerate overall.
non-fluorinated-barrier-technology-market-cost-volatility-analysis-1791601305258

Secure Multi-Year Bio Polymer Supply Contracts Early

Larger formulators increasingly negotiate multi-year bio-polymer supply agreements directly with specialty chemical producers, capturing predictable pricing well ahead of market volatility that spot-market buyers must absorb without any comparable contractual protection in place, insulating margins from short-term swings that smaller rivals cannot avoid without similar long-term agreements secured well in advance across the category.

Diversify Bio Polymer Sourcing Across Multiple Regions

Several formulators are qualifying bio-polymer sourcing from multiple geographic regions simultaneously, specifically to avoid single-region exposure to energy price spikes, trade policy, or producer disruption affecting any one sourcing area at a time during each peak demand period each year across the category, while maintaining consistent quality standards across every qualified sourcing region nationwide.

Integrate Backward Into Bio Polymer Production Directly

Larger formulators are integrating backward into dedicated bio-polymer production and compounding directly, capturing margin across both production stages while insulating themselves from feedstock cost volatility that pure formulators must pass through to customers directly each cycle across their network, reinforcing supply security during periods of constrained global bio-polymer capacity across most major producing regions nationwide.

Portfolio Architecture for Margin Defence

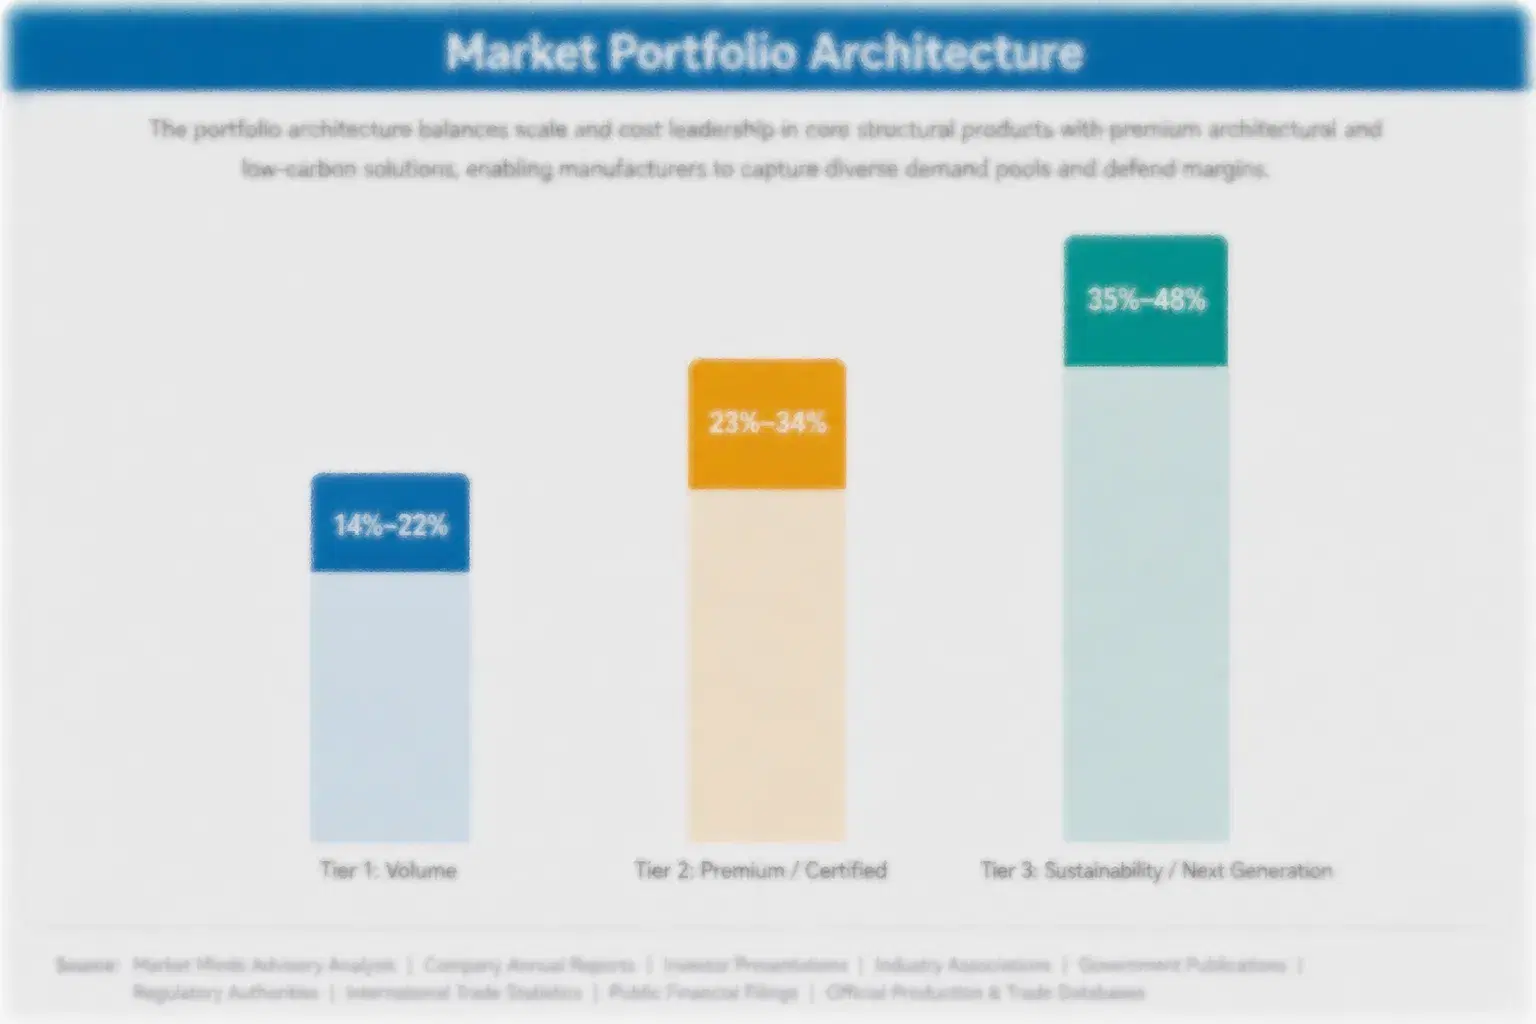
Non-fluorinated barrier technology splits into three commercial tiers with sharply different margin profiles. Volume commodity-adjacent formats, standard mineral-based coatings sold largely on price, carry gross margins typical of mature formulation operations. Premium certified formats, covering co-developed and bio-polymer-enhanced structures, command gross margins meaningfully above that. Sustainability and next-generation formats, including vertically integrated resin-to-coating production, sit at the top of the margin range as brands pay for barrier performance and supply security.
The tension running through this architecture is capacity allocation. Formulators that invested early in bio-polymer barrier chemistry licensing and food brand co-development can redirect operations toward premium portfolio-wide accounts paying meaningfully higher margin, while generalist formulators remain confined to the lower-margin commodity tier competing primarily on price. Several mid-size formulators are deliberately shrinking their standard coating commodity book to free capacity for premium co-developed work as those categories scale faster than commodity volume.

High-value margin pools concentrate in bio-polymer barrier chemistry licensing and vertically integrated resin-to-coating production, both growing faster than the category average. Formulators positioned in both pools simultaneously, rather than just one, are capturing the largest share of new premium contract wins as brands consolidate toward fewer, more capable supply partners overall.

Volume / Commodity-Adjacent Tier

Standard mineral-based coatings sold primarily on price with minimal differentiation, serving mainstream packaging accounts where buyers compete mainly on unit cost and supply reliability above almost every other consideration entirely.
Gross Margin

Premium / Certified Tier

Co-developed and bio-polymer-enhanced structures serving food packaging brands seeking validated barrier performance with certification documentation, where testing capability determines the winning formulator more than price alone across most demanding categories tracked today.
Gross Margin

Sustainability / Regulatory / Next-Generation Tier

Vertically integrated resin-to-coating production combining specialty chemical sourcing, formulation, and barrier testing under one supplier, commanding the highest margins in the category as brands increasingly prefer one accountable supply chain over fragmented sourcing nationwide.
Gross Margin
non-fluorinated-barrier-technology-market-portfolio-architecture-1791601305449

High-value Sub-segments and Strategic Watch-out

Bio Polymer Barrier Chemistry Licensing and Transfer Agreements

Bio-polymer barrier chemistry licensing that lets formulators extend performance without any in-house formulation development is both the highest-margin and fastest-growing segment tracked today, as brands seek genuine validated barrier performance across their most demanding global food, bakery, and foodservice categories tracked very closely nationwide and abroad.

Food Packaging Brand Co-Development Programmes

Non-fluorinated coatings co-developed between formulators and food packaging brands carry strong margin from joint testing investment, but volume growth trails bio-polymer licensing because co-development cycles require longer testing and qualification timelines between two separate parties involved in each new agreement signed nationwide and abroad each year.

Standard Coating Commodity Formats

The largest unit-volume segment by far, serving mainstream packaging accounts on thin, price-competitive margins, remains the revenue base most formulators still heavily depend on even as they reinvest proceeds into higher-margin co-developed categories each year across most formats, regions, and global markets tracked very closely.

Formulators Without Bio Polymer Licensing Capability

Formulators still offering only standard mineral-based coatings without any bio-polymer barrier chemistry licensing capability face a slow-motion competitive squeeze as brands increasingly favor suppliers who can match validated barrier performance across their full coating portfolio nationwide, over time and across most markets tracked very closely.

Why Brand Contracts Outlast Pricing Cycles

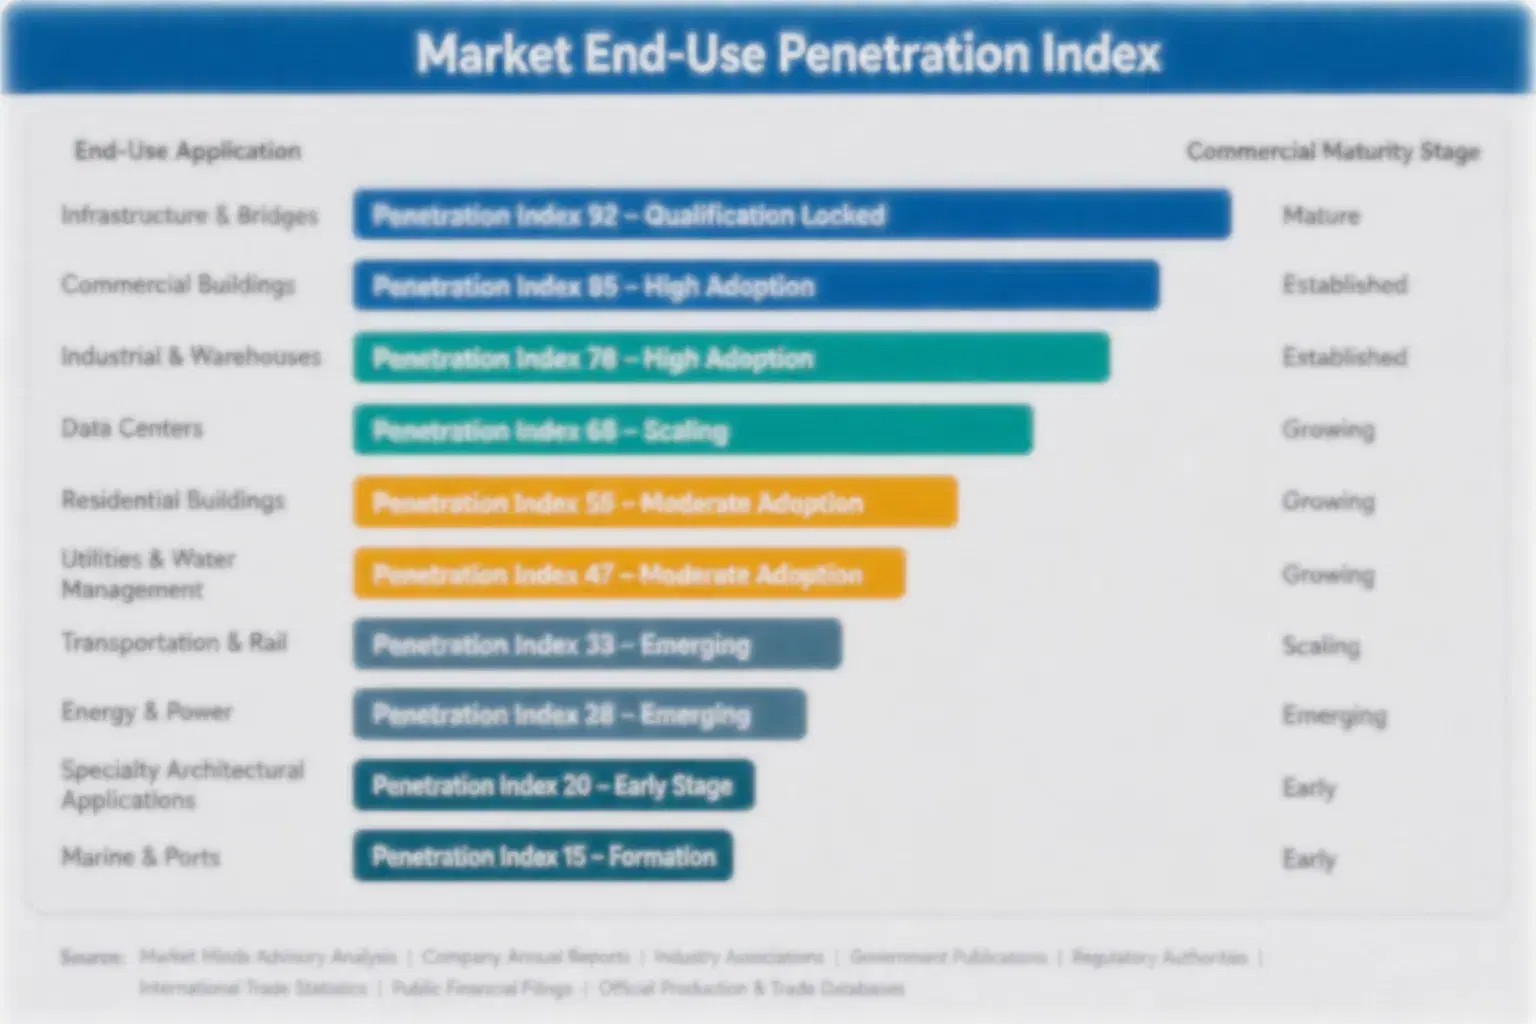
Once a formulator wins a food packaging brand portfolio-wide qualification agreement or a bio-polymer barrier chemistry licensing relationship, the arrangement behaves like an annuity rather than a one-time sale. Switching formulators mid-contract carries requalification risk across food-contact certification and retailer labeling documentation that brands rarely accept once a specification is running smoothly, so the incumbent formulator captures recurring volume across the agreement's full term.
Depth of adoption varies sharply by packaging category. High-grease foodservice categories facing the heaviest barrier exposure lock in the deepest formulator relationships because a barrier failure carries direct product-leak and brand-reputation consequences that are hard to requalify quickly, while lower-grease categories see more frequent price-driven switching on commodity formats where tolerances are looser. Mid-tier bakery brand programmes sit in between with tighter cost discipline.

Buyer profiles are shifting as coating material decisions move earlier into product development planning rather than being finalized after packaging line build-out. A decade ago, coating sourcing was a routine procurement line item decided late in retail planning; today, non-fluorinated versus fluorinated decisions increasingly factor into brand cost and compliance positioning set well ahead of contracting, giving formulators with proven barrier capability a seat earlier than commodity suppliers traditionally occupied.
non-fluorinated-barrier-technology-market-end-use-penetration-index-1791601305635

Where to Place Bets Now

These are among the four positions where our research anticipates prominent divergence between winners and laggards over the coming forecast period. Each is grounded in the demand model, the regulatory perimeter, and the announced capacity pipeline.
01 / BIO POLYMER LICENSING PRIORITY

License bio polymer barrier chemistry before rivals close gap

Brands increasingly want non-fluorinated coatings that match fluorinated barrier performance without losing cost advantages, and formulators without bio-polymer barrier chemistry licensing access cannot bid on these performance-sensitive contracts at all today across most major categories and markets worldwide. Technology developers who have already licensed this capability widely are generating margin twenty-three percent above direct formulation alone, capturing value that unlicensed competitors cannot access. This advantage should widen as more formulators pursue licensed barrier platforms nationwide over the coming years ahead of slower-moving rivals.
02 / PORTFOLIO QUALIFICATION PUSH

Build dedicated qualification programmes before mandates expand

Brands are consolidating non-fluorinated coating volume toward fewer qualified formulators, and suppliers without a dedicated qualification programme are losing access to entire product portfolios at once rather than competing line by line across fragmented regional accounts today across most major markets worldwide. The pricing premium for programme-based positioning is wide enough that leading formulators have already priced it sixteen percent above fragmented-channel sales nationwide. Formulators who wait risk losing these accounts permanently as mandates continue expanding across more brands nationwide each year.
03 / FOOD CO-DEVELOPMENT PUSH

Formalize brand partnerships before competitors do

Brands increasingly want non-fluorinated coatings combining barrier performance with food-contact certification, and formulators without a formalized co-development relationship cannot deliver this combination credibly at scale today across most demanding food safety categories and markets worldwide and well beyond every region tracked closely each year without fail. Formulators who have already formalized co-development are pricing output nineteen percent above standard alternatives, capturing margin that unpartnered competitors cannot access at all. This advantage should widen as more brands pursue combined-performance specifications across categories nationwide.
04 / BACKWARD RESIN INTEGRATION

Integrate backward into resin supply before margins compress

Formulators that integrate backward into dedicated bio-polymer resin supply contracts capture margin across both production stages while insulating themselves from commodity volatility that pure formulators must pass through to customers directly each cycle without exception across the entire category worldwide today and beyond. Integrated formulators are already pricing finished coatings eleven percent above equivalent distributor-sourced resin output, capturing margin that non-integrated competitors cannot access. Waiting too long to integrate risks ceding this cost advantage to faster-moving rivals permanently across every region served worldwide.

Engagement Snapshot From the Field

A live engagement with an industry participant carrying material or product regulatory and market exposure ahead of a defining policy shift, showing how our research translates into a defensible multi-year portfolio strategy.
MARKET MINDS ADVISORY · CLIENT ENGAGEMENT SUMMARY
Non-Fluorinated Barrier Technology Producer Strategic Portfolio Review and Transition Roadmap 2026·Investment Scenario on Non-Fluorinated Barrier Technology Exposure Evaluation 2025-26
CLIENT PROFILE
The client is a global food packaging brand with annual revenue of approximately $8.9 billion (client-reported, unverified by MMA), operating multiple production lines reliant on fluorinated grease barriers across its paper and fiber portfolio. The client faced rising state-level PFAS ban pressure across several key markets and sought an independent assessment of converting its coating supply to non-fluorinated alternatives nationwide.
STRATEGIC CHALLENGE
The brand needed to determine which product lines could convert to non-fluorinated coatings without compromising barrier performance requirements, and whether the transition could be phased gradually across its global supply chain without disrupting existing supplier relationships already established over many years of continuous operation and prior contract and audit history nationwide.
MMA APPROACH
MMA conducted a structured line-by-line assessment benchmarking barrier performance, cost premium, and formulator qualification timelines across both non-fluorinated and fluorinated coating alternatives, modeling the cost impact of continued fluorinated procurement against the full cost of a phased non-fluorinated conversion across the brand's entire global product portfolio and full supplier network.
KEY FINDINGS
  1. Roughly 41% of the client's coating portfolio could convert to non-fluorinated formats without any measurable barrier-performance compromise across its major product lines studied closely.
  2. Rising state-level PFAS bans made continued fluorinated procurement untenable within two years across three of the client's largest operating markets studied during the review.
  3. Bio-polymer formats outperformed fluorinated formats on both cost-reduction and compliance metrics for most high-volume product categories assessed very closely overall across the full review.
  4. The client's original conversion cost estimate overstated the bio-polymer technology premium by roughly 9%, a gap the assessment corrected before supplier contracts were finalized.
CLIENT PROFILE
The client is a global food packaging brand with annual revenue of approximately $8.9 billion (client-reported, unverified by MMA), operating multiple production lines reliant on fluorinated grease barriers across its paper and fiber portfolio. The client faced rising state-level PFAS ban pressure across several key markets and sought an independent assessment of converting its coating supply to non-fluorinated alternatives nationwide.
STRATEGIC CHALLENGE
The brand needed to determine which product lines could convert to non-fluorinated coatings without compromising barrier performance requirements, and whether the transition could be phased gradually across its global supply chain without disrupting existing supplier relationships already established over many years of continuous operation and prior contract and audit history nationwide.
MMA APPROACH
MMA conducted a structured line-by-line assessment benchmarking barrier performance, cost premium, and formulator qualification timelines across both non-fluorinated and fluorinated coating alternatives, modeling the cost impact of continued fluorinated procurement against the full cost of a phased non-fluorinated conversion across the brand's entire global product portfolio and full supplier network.
KEY FINDINGS
  1. Roughly 41% of the client's coating portfolio could convert to non-fluorinated formats without any measurable barrier-performance compromise across its major product lines studied closely.
  2. Rising state-level PFAS bans made continued fluorinated procurement untenable within two years across three of the client's largest operating markets studied during the review.
  3. Bio-polymer formats outperformed fluorinated formats on both cost-reduction and compliance metrics for most high-volume product categories assessed very closely overall across the full review.
  4. The client's original conversion cost estimate overstated the bio-polymer technology premium by roughly 9%, a gap the assessment corrected before supplier contracts were finalized.
RECOMMENDED STRATEGY
Phase 1: Phase 1 (Months 1 to 4): Convert the highest-volume, lowest-barrier-risk product lines to non-fluorinated coatings first across the brand's largest markets. Phase 2: Phase 2 (Months 5 to 10): Expand conversion to high-grease categories using validated multi-layer coating formats across the full product network. Phase 3: Phase 3 (Month 11 onward): Finalize multi-year supply agreements covering the full converted portfolio globally across every regional market served.
OUTCOME
The brand completed roughly 41% of its planned coating conversion within the first year and avoided a material increase in packaging compliance cost exposure across its three largest markets. The brand reported no measurable change in barrier-complaint rates following the conversion (client-reported, unverified by MMA).

Frequently Asked Questions

Foundational context covering the market sizes, CAGR, scope, country, region and competition that inform every finding below. This section is provided to cover basics and most often pre-purchase conversations, answered from the MMA Primary Research Dataset.

What is the current size of the Non-Fluorinated Barrier Technology Market?

The global market was valued at approximately $1.2 billion in 2025. This reflects bio-polymer, mineral-based, and water-dispersion barrier coatings used across food packaging worldwide today.

How large will the Non-Fluorinated Barrier Technology Market be by 2036?

MMA projects the market will reach approximately $3.97 billion by 2036, more than triple its 2025 starting base. Growth is driven by PFAS regulation and brand adoption.

What is the CAGR for the Non-Fluorinated Barrier Technology Market 2026 to 2036?

The market is projected to grow at a compound annual growth rate of 11.5% between 2026 and 2036. Bull and bear scenarios range from roughly 10.2% to 12.8%.

Which segment is growing fastest?

Non-fluorinated grease and oil resistant coatings are the fastest-growing segment, expanding at approximately 14.0% annually, well above the category average. This reflects rapid adoption as bio-polymer technology matures.

Who are the major companies in the Non-Fluorinated Barrier Technology Market?

Leading companies include Solenis, Archer Daniels Midland, Imerys, Omya, and Michelman. These five companies hold the leading qualified positions in the category today across most markets.

Which country is growing fastest?

France is the fastest-growing major country, expanding at approximately 12.8% annually as its early national PFAS ban accelerates non-fluorinated coating conversion. Local formulator capacity is also expanding alongside demand.

Non-Fluorinated Barrier Technology Segmentation by Type and Use

The full report scope spans multiple orthogonal segmentation dimensions, with cross-tabulated demand data provided for each dimension pair. Coverage extends further to regional breakdowns, trend trajectories, and the competitive detail needed to support segment-level decision-making.

By Coating Chemistry

  • Non-Fluorinated Grease and Oil Resistant Coatings
  • Bio-Polymer Barrier Coatings
  • Water-Based Dispersion Barrier Coatings
  • Mineral-Based Barrier Coatings
  • Non-Fluorinated Water Repellent Coatings

By End-Use Industry

  • Bakery and Pastry Packaging
  • Foodservice and Quick-Service Packaging
  • Molded Fiber Food Containers
  • Frozen and Refrigerated Food Packaging

By Commercial Dimension

  • Brand Direct Supply
  • Licensed Technology Supply
  • Distributor and Wholesale Supply
  • Co-Development Partnership Contracts

By Region

  • North America
  • Western Europe
  • East Asia
  • South Asia and Pacific
  • Latin America
  • Middle East and Africa
  • Eastern Europe

Scope, Methodology, and Coverage

Every figure in this report is reproducible from documented input assumptions. The scope below maps the historical period, the forecast horizon, the segmentation dimensions, and the countries covered, alongside the underlying primary and qualitative methodology.
Historical Period
2020 to 2025
Forecast Period
2026 to 2036
Base Year
2025 (USD billions; MMA Primary Research Dataset, October 2026)
Market Definition
The non-fluorinated barrier technology market covers bio-polymer, mineral-based, water-dispersion, and other PFAS-free barrier coatings applied to paper, molded fiber, and food packaging to provide grease, oil, and water resistance. It excludes fluorinated (PFAS-based) barrier coatings and general packaging printing inks tracked separately by MMA.
Quantitative Units
USD billions (current prices); unit volumes in million tonnes where cited
Segmentation Dimensions
By Coating Chemistry; By End-Use Industry; By Commercial Dimension; By Region
Regions Covered
North America, Western Europe, East Asia, South Asia and Pacific, Latin America, Middle East and Africa, Eastern Europe
Countries Covered
USA, Canada, Germany, France, Denmark, Netherlands, UK, China, Japan, South Korea, India, Australia, Indonesia, Brazil, Mexico, Argentina, UAE, Saudi Arabia, South Africa, Nigeria, Poland, Hungary, Czech Republic, Italy, Spain, Sweden, Switzerland, Colombia, Singapore, Vietnam, and additional markets relevant to this sector
Key Companies Profiled
Solenis LLC, Archer Daniels Midland Company, Imerys S.A., Omya AG, Michelman Inc., Kemira Oyj, Nippon Paper Industries Co., Ltd., Stora Enso Oyj, Mondi Group, Sun Chemical Corporation, BASF SE, Dow Inc., Croda International Plc, Cargill Inc., Tate & Lyle PLC, Daicel Corporation, DIC Corporation, Synthomer Plc, Ecosynthetix Inc., Omnova Solutions Inc.
Quantitative Methodology
Primary survey, n=3,800 respondents, Q4 2025, six countries; demand-side model with trade association cross-validation
Qualitative Methodology
47 expert interviews, Q4 2025; applied to validate demand model assumptions, identify emerging dynamics, and assess competitive positioning
Report Format
PDF and XLSX data workbook (Word format preview document)
Publisher
Market Minds Advisory
Report Code
MMA-2026-CHM-101
Published
October 2026
Contact
sales@marketmindsadvisory.com | www.marketmindsadvisory.com

Purchase the full Non-Fluorinated Barrier Technology Market Report (2026 to 2036).

The full report delivers a complete market model spanning 2020 to 2036, with segment-level and regional revenue breakdowns across all seven tracked geographies. It includes detailed profiles of twenty companies spanning diversified global specialty chemical formulators and specialty regional converters, competitive benchmarking on a revenue basis, and an independent assessment of moat durability and risk exposure for the two leading companies. Buyers receive the complete regional dataset beyond the two regions shown, along with extended commentary on bio-polymer cost exposure. A dedicated appendix covers bio-polymer barrier chemistry benchmarking and food packaging brand co-development case examples. Custom segment cuts and data extensions are available on request.
Twenty-company competitive benchmarking on a consistent basis
Full seven-region revenue and CAGR dataset
Segment-level margin and growth analysis across five chemistries
Bio-polymer cost exposure and mitigation strategy appendix
Bio-polymer barrier chemistry licensing and co-development case data
Custom segment and company-specific data extensions available

Built For The People Who Decide

From boardroom strategy to bench-side execution, this report is read cover-to-cover by leaders shaping the next decade of their industry, turning demand scenarios, market dynamics and valuation benchmarks into decisions.
CXOs/ Presidents/ VPs/ Managers
M&A and Corporate Development
Strategy Teams and R&D Heads
Procurement and Product Directors
Regulatory and Compliance Leaders
Investor Relations and Equity Analysts