Market Minds Advisory
Next Generation Immunotherapies Market

Next Generation Immunotherapies Market: Bispecific Antibodies, CAR-T Platforms, and Off-the-Shelf Cell Therapy Innovation

Oncologists are shifting first-line treatment protocols toward bispecific antibodies and next-generation CAR-T platforms as off-the-shelf manufacturing and improved safety profiles turn cell and antibody engineering from a last-resort option into a standard early-line therapeutic choice.

Lead Analyst

Alice Ballenger

Published

September 2026

Make Smarter Decisions with Customized Research Insights

Request a free sample report and evaluate market opportunities, growth trends, and competitive dynamics relevant to your business needs.

2025 MARKET VALUE$48.5BMarket Size 2025
2036 FORECAST VALUE$149.8BBase Case , 2026 to 2036
CAGR 2026 TO 203610.8 %Bull 12.1% / Bear 9.5%
INCREMENTAL OPPORTUNITY$96.1BNet 10- year value creation
EXPANSION MULTIPLE2.79x2036 value over 2026 base
Strategic Levers
M&A Pipeline
Regional Outlook
Country Rankings
Competitive Intelligence
Segmental Deep-dive
Call-Us : 91 93563 13602

Executive Snapshot and Market Trajectory

Manufacturing scalability, not clinical efficacy alone, is now the primary gate on next-generation immunotherapy adoption, and developers that solved off-the-shelf bispecific production two years ago are capturing first-line treatment share faster than cell therapy competitors still constrained by patient-specific manufacturing timelines. That shift is compressing time-to-market advantages across the industry.
The United States generates more next-generation immunotherapy commercial revenue than the rest of the world combined, pulling bispecific antibody and CAR-T manufacturing investment toward American biotech hubs while Merck, Bristol Myers Squibb, and Roche compete for the same oncology treatment centers. Tumor-infiltrating lymphocyte therapies are the fastest-growing modality, a small revenue base today but critical to treating solid tumors that earlier cell therapy generations could rarely address effectively at meaningful scale.
Five companies, Merck, Bristol Myers Squibb, Roche, Johnson & Johnson, and Novartis, hold roughly 54 percent of global next-generation immunotherapy revenue, a concentration built on decades of oncology clinical development infrastructure that newer entrants cannot replicate. FDA breakthrough therapy designations and accelerated approval pathways are pulling bispecific and cell therapy approvals forward on development timelines beyond what conventional oncology drug review would have allowed across most major global markets, meaningfully reshaping competitive timelines industry-wide today.
Market Definition
The next generation immunotherapies market covers bispecific and multispecific antibodies, CAR-T and other engineered cell therapies, tumor-infiltrating lymphocyte therapies, cancer vaccines, and next-generation checkpoint inhibitor combinations used to treat solid tumor and hematologic malignancies. It excludes first-generation single-target checkpoint inhibitor monotherapies, conventional chemotherapy, and non-oncology immunomodulator applications.
Base Year Value
$48.5B in 2025 (MMA Primary Research Dataset, August 2026)
Forecast Period
2026 to 2036, eleven discrete annual values
CAGR
10.8% base case. Bull 12.1%. Bear 9.5%.
Fastest Growth Segment
Tumor-Infiltrating Lymphocyte Therapies: 16.8% CAGR
Fastest Growth Country
China: 15.4% CAGR
Fastest Growth Region
South Asia and Pacific: 13.0% CAGR
Largest Region
North America: 32% of 2025 global value
Market Leaders
Merck, Bristol Myers Squibb, Roche, Johnson & Johnson, Novartis. Source: MMA Analysis based on company annual reports and investor filings.
Primary Survey
n=3,800 procurement and R&D decision-makers, Q4 2025, six countries
Methodology
Demand-side build-up, cross-validated against public data, 47 expert interviews

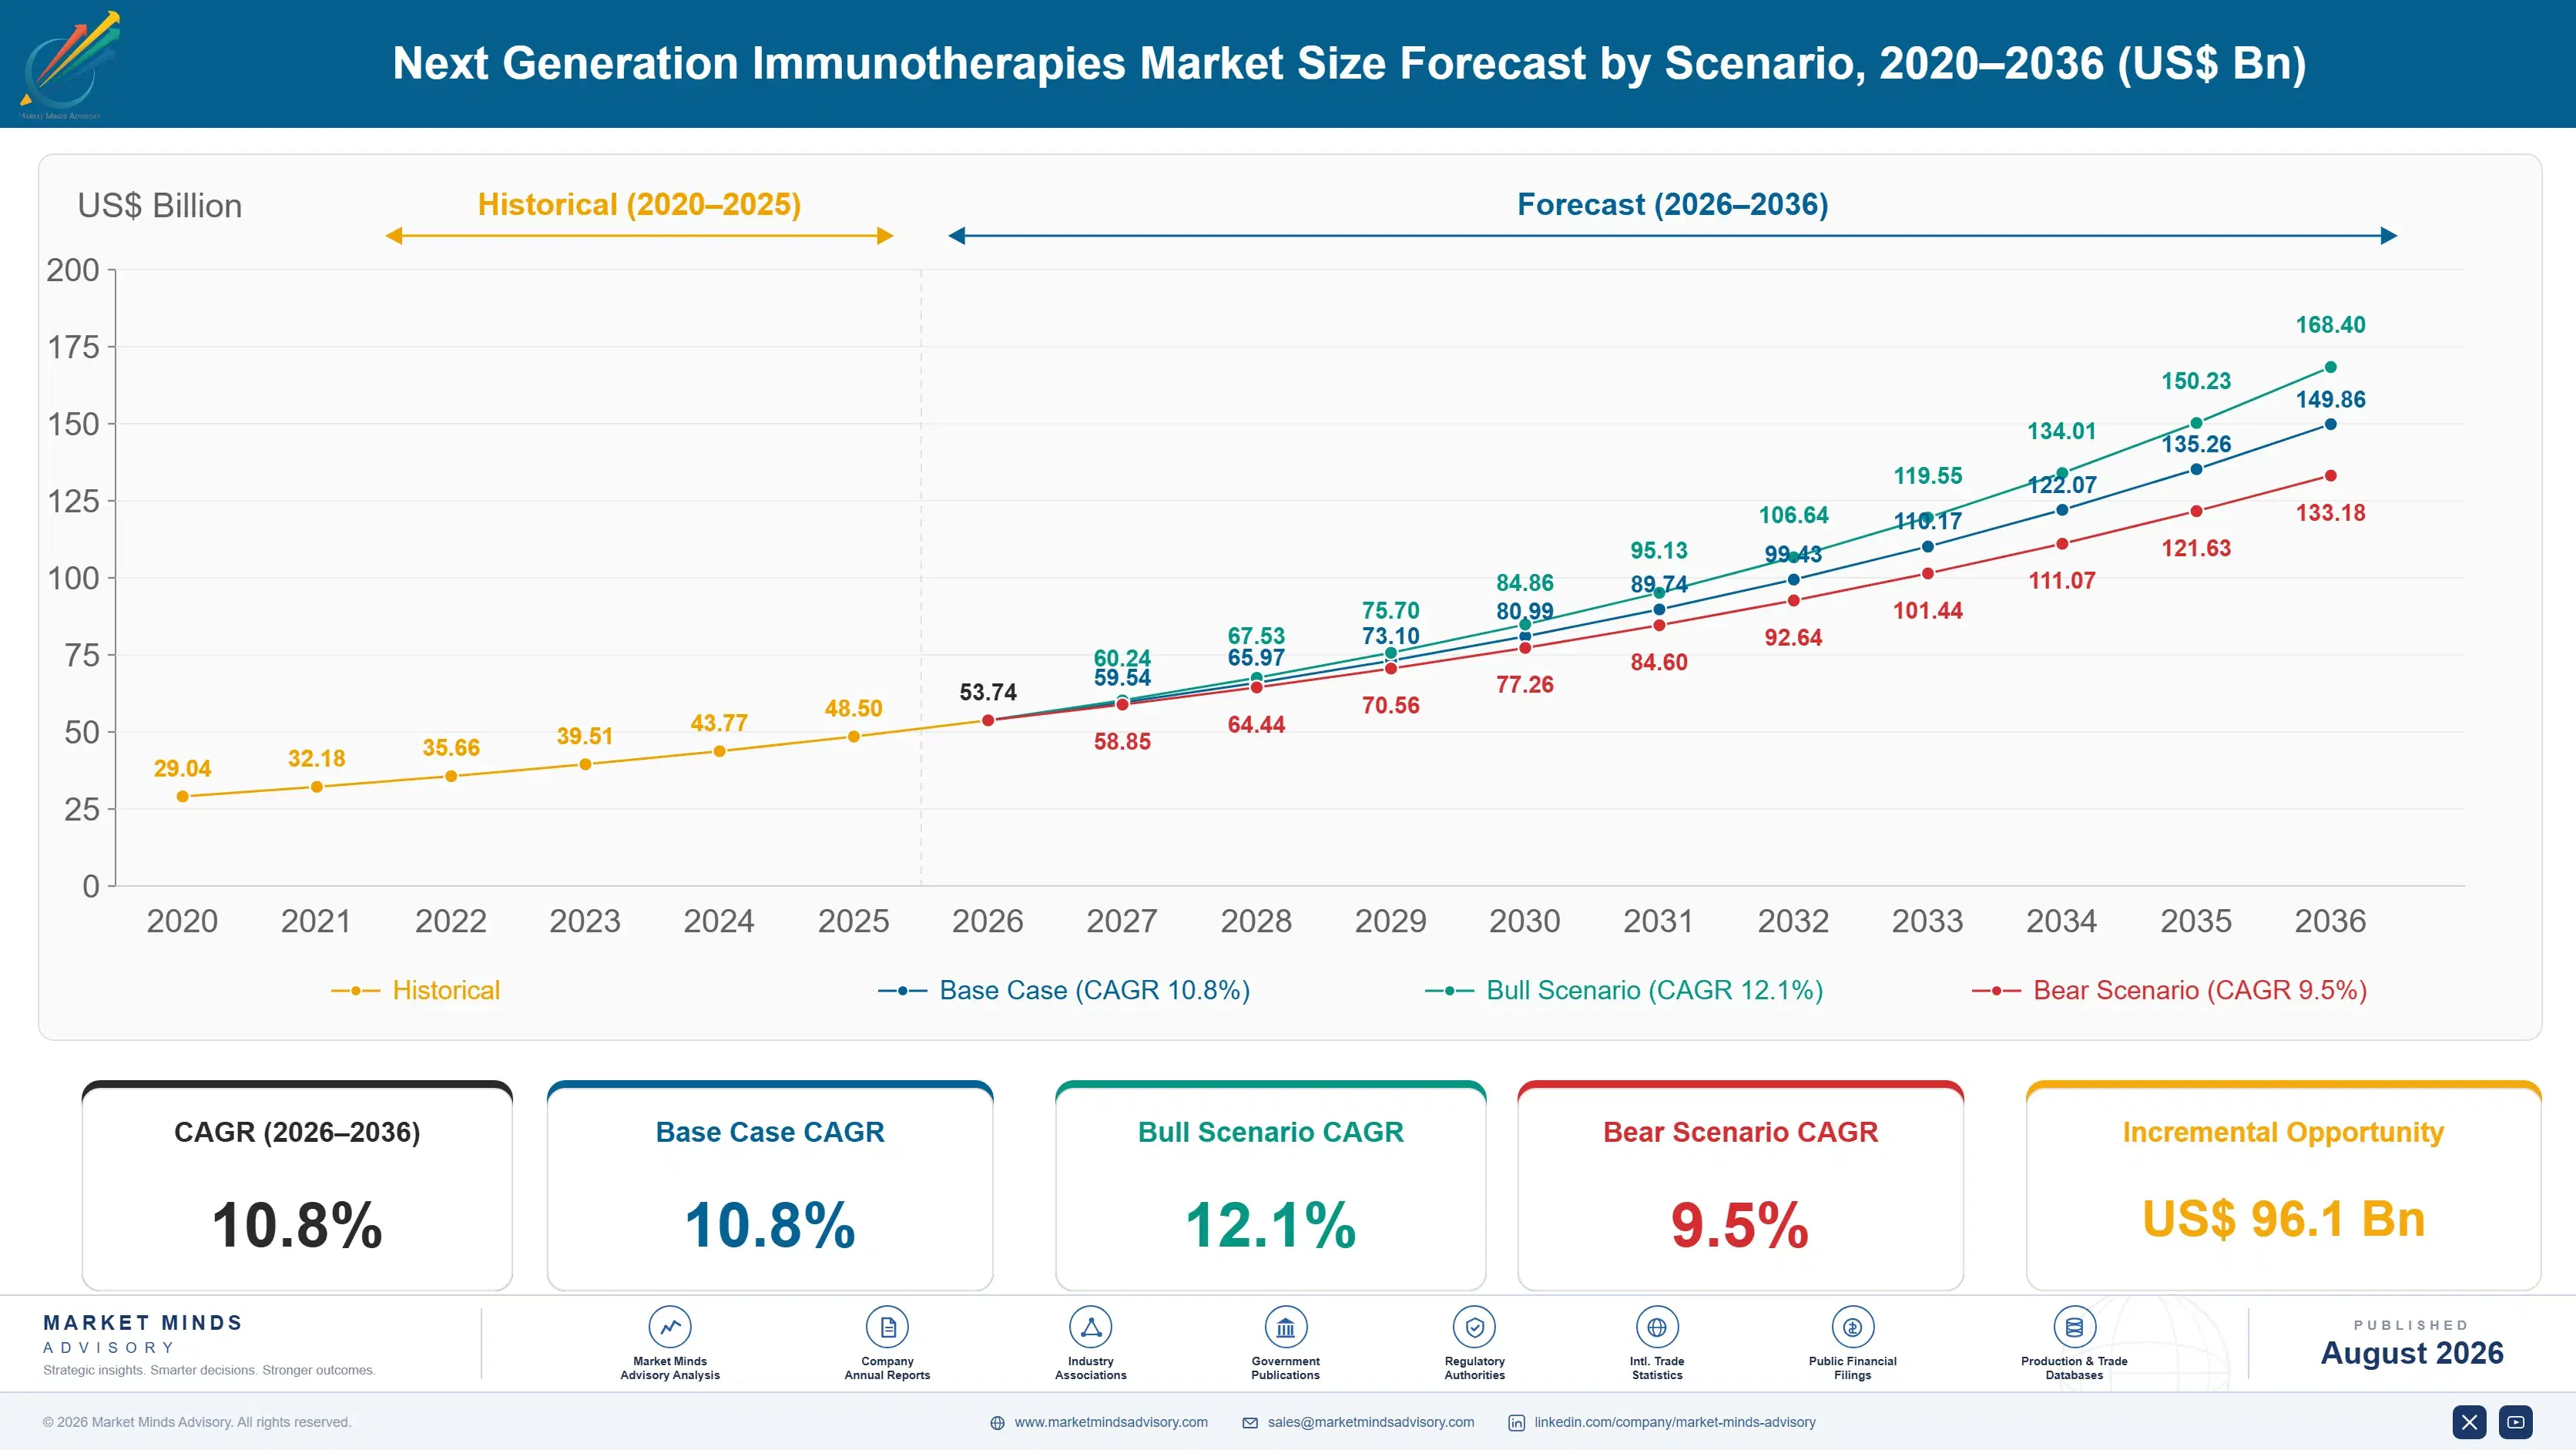
Next Generation Immunotherapies Market Forecast Scenarios

next-generation-immunotherapies-market-size-forecast-scenario-1787300030635
Next-generation immunotherapy revenue grew steadily from 2020 through 2025 as bispecific antibody approvals accelerated and CAR-T therapies expanded into earlier treatment lines beyond their original relapsed and refractory indications. Manufacturing capacity constraints limited cell therapy growth somewhat toward the end of the period, and the segment grew at roughly a 9.8 percent historical compound rate.
MMA's base case assumes 10.8 percent compound growth through 2036, anchored in three mechanisms. First, off-the-shelf bispecific antibody manufacturing is displacing patient-specific cell therapy in indications where both modalities show comparable efficacy. Second, tumor-infiltrating lymphocyte therapy approvals are opening solid tumor indications that earlier cell therapy generations could not address effectively. Third, Chinese biotech licensing deals are accelerating global bispecific pipeline development beyond what Western-only research investment would have funded.
A bull scenario near 12.1 percent follows if additional bispecific or cell therapy programmes achieve first-line approval before 2030, expanding addressable patient populations meaningfully. The bear case near 9.5 percent materialises if manufacturing capacity constraints or a high-profile safety signal in a leading cell therapy programme triggers broader regulatory caution across the category. Either scenario would meaningfully reshape near-term capital allocation decisions across the industry.

Manufacturing Scale Reshapes Competitive Positioning

Next-generation immunotherapies have moved from a last-resort treatment option into a mainstream early-line therapeutic category faster than most oncologists expected a decade ago, and that shift is reshaping how treatment centers plan capacity and staffing. Indications that would have stayed reserved for relapsed and refractory patients for another treatment generation are now approved for earlier use because clinical data increasingly shows these modalities outperforming conventional chemother
MARKET CONCENTRATION54%Five companies hold a meaningful but not dominant combined share
AVERAGE TREATMENT COST$380,000Reflects typical full-course bispecific or cell therapy pricing
US REVENUE SHARE52%United States generates the majority of global commercial revenue
MANUFACTURING COST SHARE38%Cell processing and antibody production dominate total treatment cost
FIRST-LINE APPROVAL RATE27%Share of approved therapies now used in earlier treatment lines
TRADE INTENSITYLowSpecialized manufacturing keeps most production close to treatment centers
Commercial activity concentrates in bispecific antibodies and CAR-T platforms, where proprietary target engineering and manufacturing scale give the five largest companies durable technical advantages. Tumor-infiltrating lymphocyte therapies remain a smaller but fast-scaling modality, increasingly attracting the pipeline investment that bispecific antibodies defined during the category's most recent commercial expansion.
The next decade will be shaped less by target discovery than by how fast manufacturing platforms can scale off-the-shelf production to match the patient volumes earlier-line approval creates. Companies that can bundle strong clinical data with credible manufacturing scale capture disproportionate share of the commercial opportunity each new approval generates. Companies slow to invest in manufacturing scale risk permanent exclusion from high-volume indications.
"The best antibody in the world is worthless if you can only manufacture enough doses for a clinical trial. Scale is the new differentiator."
Director, Oncology Immunotherapy and Cell Therapy Practice · MMA Oncology Immuno

Market Trends

Off-the-Shelf Bispecifics Displace Patient-Specific Cell Therapy

Bispecific antibody manufacturing scales far more easily than patient-specific CAR-T production, since a single manufacturing run can supply thousands of patients rather than requiring individualized cell processing for each treatment course. Treatment centers increasingly favour bispecific options where clinical data shows comparable efficacy to cell therapy, since bispecifics eliminate the weeks-long manufacturing wait that delays CAR-T treatment initiation for often rapidly progressing cancer patients. Merck and Roche both report that bispecific pipeline investment has grown substantially relative to cell therapy investment across their oncology portfolios, reflecting the commercial advantage of a modality that does not require per-patient manufacturing logistics.
Market Impact: Adds $4.2B in licensed pipeline value
Solid Tumor Cell Therapy Approvals Expand Addressable Market

Tumor-infiltrating lymphocyte therapies and next-generation CAR-T constructs are beginning to demonstrate meaningful efficacy in solid tumors, a category that earlier cell therapy generations largely failed to address given the immunosuppressive tumor microenvironment characteristic of most solid cancers. Iovance Biotherapeutics and other developers have advanced solid tumor programmes into commercial approval, representing a genuine expansion beyond the hematologic malignancies that defined cell therapy's first commercial decade. Success in solid tumors would multiply the category's addressable patient population many times over, since solid tumors represent the large majority of total cancer diagnoses worldwide.
Market Impact: Expands eligible patients by roughly 45%

Market Opportunities and Growth Drivers

Chinese Biotech Licensing Deals Accelerate Global Pipeline Development

Chinese biotech companies have originated a growing share of bispecific antibody and cell therapy candidates now licensed to major Western pharmaceutical companies for global development, reflecting China's maturing biotech research infrastructure and lower early-stage development costs relative to Western biotech. Major licensing deals between Chinese originators and companies including Merck and Bristol Myers Squibb have brought dozens of promising candidates into global late-stage development that would have required years of additional Western-funded discovery work. This dynamic is reshaping where pharmaceutical companies concentrate early-stage scouting investment, favouring Chinese biotech partnerships over in-house discovery programmes for next-generation immunotherapy candidates.
Market Impact: Caps treatment capacity by roughly 30%

Earlier-Line Approval Expansion Broadens Addressable Patient Population

Multiple bispecific antibodies and CAR-T therapies have expanded from relapsed and refractory indications into earlier treatment lines following strong clinical trial data, broadening the addressable patient population beyond the smaller pool of patients who have already failed multiple prior treatment lines. This earlier-line expansion represents a larger commercial opportunity than the original approval indications, since earlier-line patients represent a substantially larger population than the heavily pretreated patients these therapies originally targeted. Novartis and Johnson & Johnson have both prioritised earlier-line clinical trial investment because successful expansion multiplies commercial value more than any single new indication approval would on its own.
Market Impact: Excludes access for 70% of patients

Market Restraints and Challenges

Manufacturing Capacity Constraints Limit Cell Therapy Scale

Patient-specific CAR-T manufacturing requires collecting, engineering, and expanding each patient's own cells, and the root cause is inherent to the modality: this process cannot be batch-manufactured the way bispecific antibodies can, creating a hard capacity ceiling that limits how many patients can be treated regardless of clinical demand. That capacity constraint has periodically created treatment waitlists at major cancer centers, delaying treatment for patients whose rapidly progressing disease cannot tolerate delay. Developers including Novartis and Gilead are mitigating the constraint by investing in automated, closed-system manufacturing platforms that reduce per-patient processing time, though batch-scale manufacturing for cell therapy remains unsolved.
Market Impact: Cuts wait times by 3 weeks

Extremely High Treatment Cost Limits Broad Market Access

Next-generation immunotherapies carry list prices exceeding several hundred thousand dollars per course, and the root cause is economic: manufacturing complexity, clinical development cost, and a payer base that must fund treatment for a smaller population than conventional cancer therapies serve. That cost structure keeps therapies inaccessible across most middle-income and developing markets regardless of clinical need, concentrating revenue largely within wealthy healthcare systems capable of funding treatments at this price point. Developers including Bristol Myers Squibb are mitigating the barrier by negotiating installment payment structures with wealthy-market payers, though global access remains years away for most therapies.
Market Impact: Expands addressable patients by roughly 40%
3 additional market trends, 4 additional growth drivers, and 3 additional restraints and challenges are covered in the full report. Contact sales@marketmindsadvisory.com to access the complete intelligence.

Segment CAGR and Growth Architecture

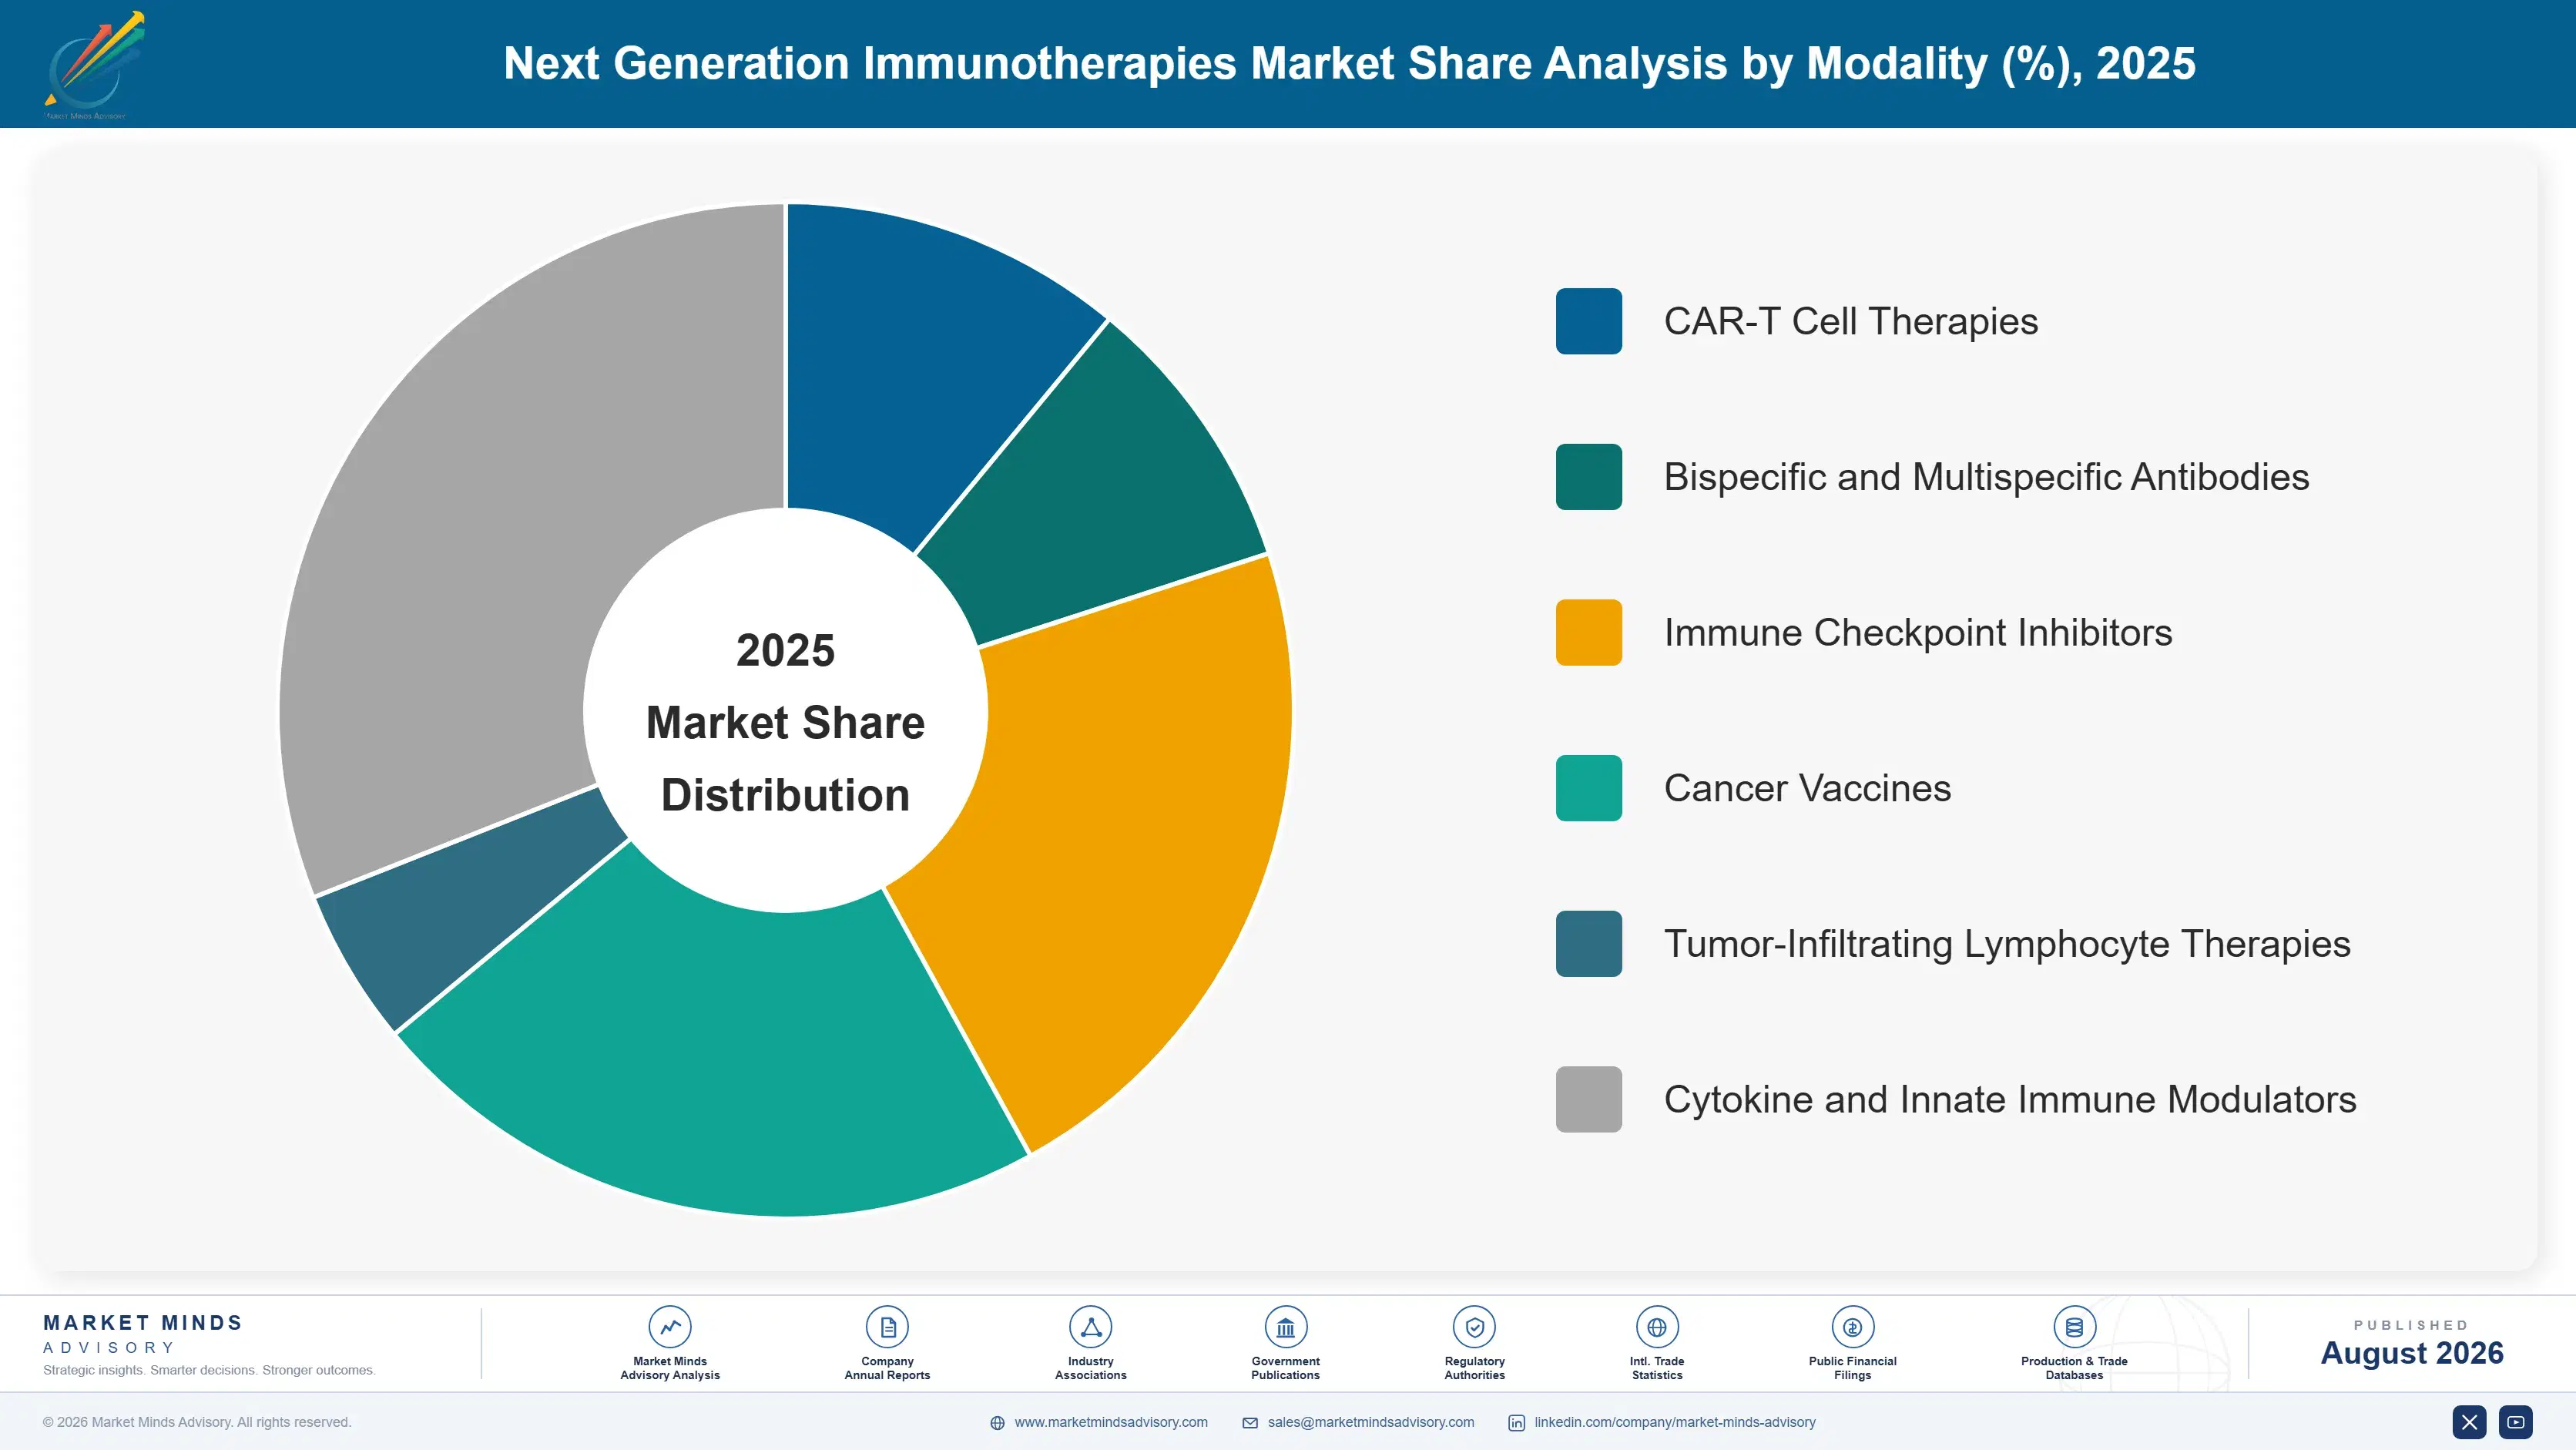
MMA segments the next generation immunotherapies market by modality, the classification oncologists and regulators actually structure treatment protocols and approval pathways against, rather than by target antigen or cancer type alone. Six modalities cover the addressable market, each with distinct manufacturing requirements, regulatory pathway maturity, and clinical positioning across solid tumor and hematologic malignancy treatment.
next-generation-immunotherapies-market-market-share-analysis-1787300031164

Tumor-Infiltrating Lymphocyte Therapies

Tumor-infiltrating lymphocyte therapies are growing fastest because they represent the first cell therapy modality to demonstrate meaningful efficacy in solid tumors, a category that earlier CAR-T generations failed to address given the immunosuppressive tumor microenvironment characteristic of most solid cancers. Iovance Biotherapeutics and other developers are advancing TIL programmes across multiple solid tumor types, competing to establish treatment protocols for indications that represent the large majority of total cancer diagnoses worldwide. Manufacturing complexity remains a constraint, since TIL therapy requires harvesting and expanding a patient's own tumor-infiltrating cells through a process more intensive than standard CAR-T manufacturing. Growth here is expected to broaden as manufacturing processes mature and solid tumor indications accumulate the clinical data needed for regulatory approval.
CAGR 16.8%

Bispecific and Multispecific Antibodies

Bispecific and multispecific antibodies are the second-fastest-growing modality as off-the-shelf manufacturing scalability increasingly displaces patient-specific cell therapy in indications where both approaches show comparable clinical efficacy. Merck and Roche both dominate this segment given their antibody engineering platforms and the manufacturing infrastructure that newer entrants find difficult to replicate at comparable scale. Chinese biotech originators are increasingly licensing promising bispecific candidates to Western pharmaceutical companies, accelerating pipeline development beyond what purely Western-funded discovery would have achieved on a comparable timeline. Growth here tracks closely with how successfully developers can expand bispecific indications into earlier treatment lines where the larger addressable patient population justifies continued manufacturing capacity investment. This modality's manufacturing advantage compounds as production volume scales further.
CAGR 14.5%
Full segment breakdown across 6 segments available in the complete report.

Regional Architecture and Country Demand Map

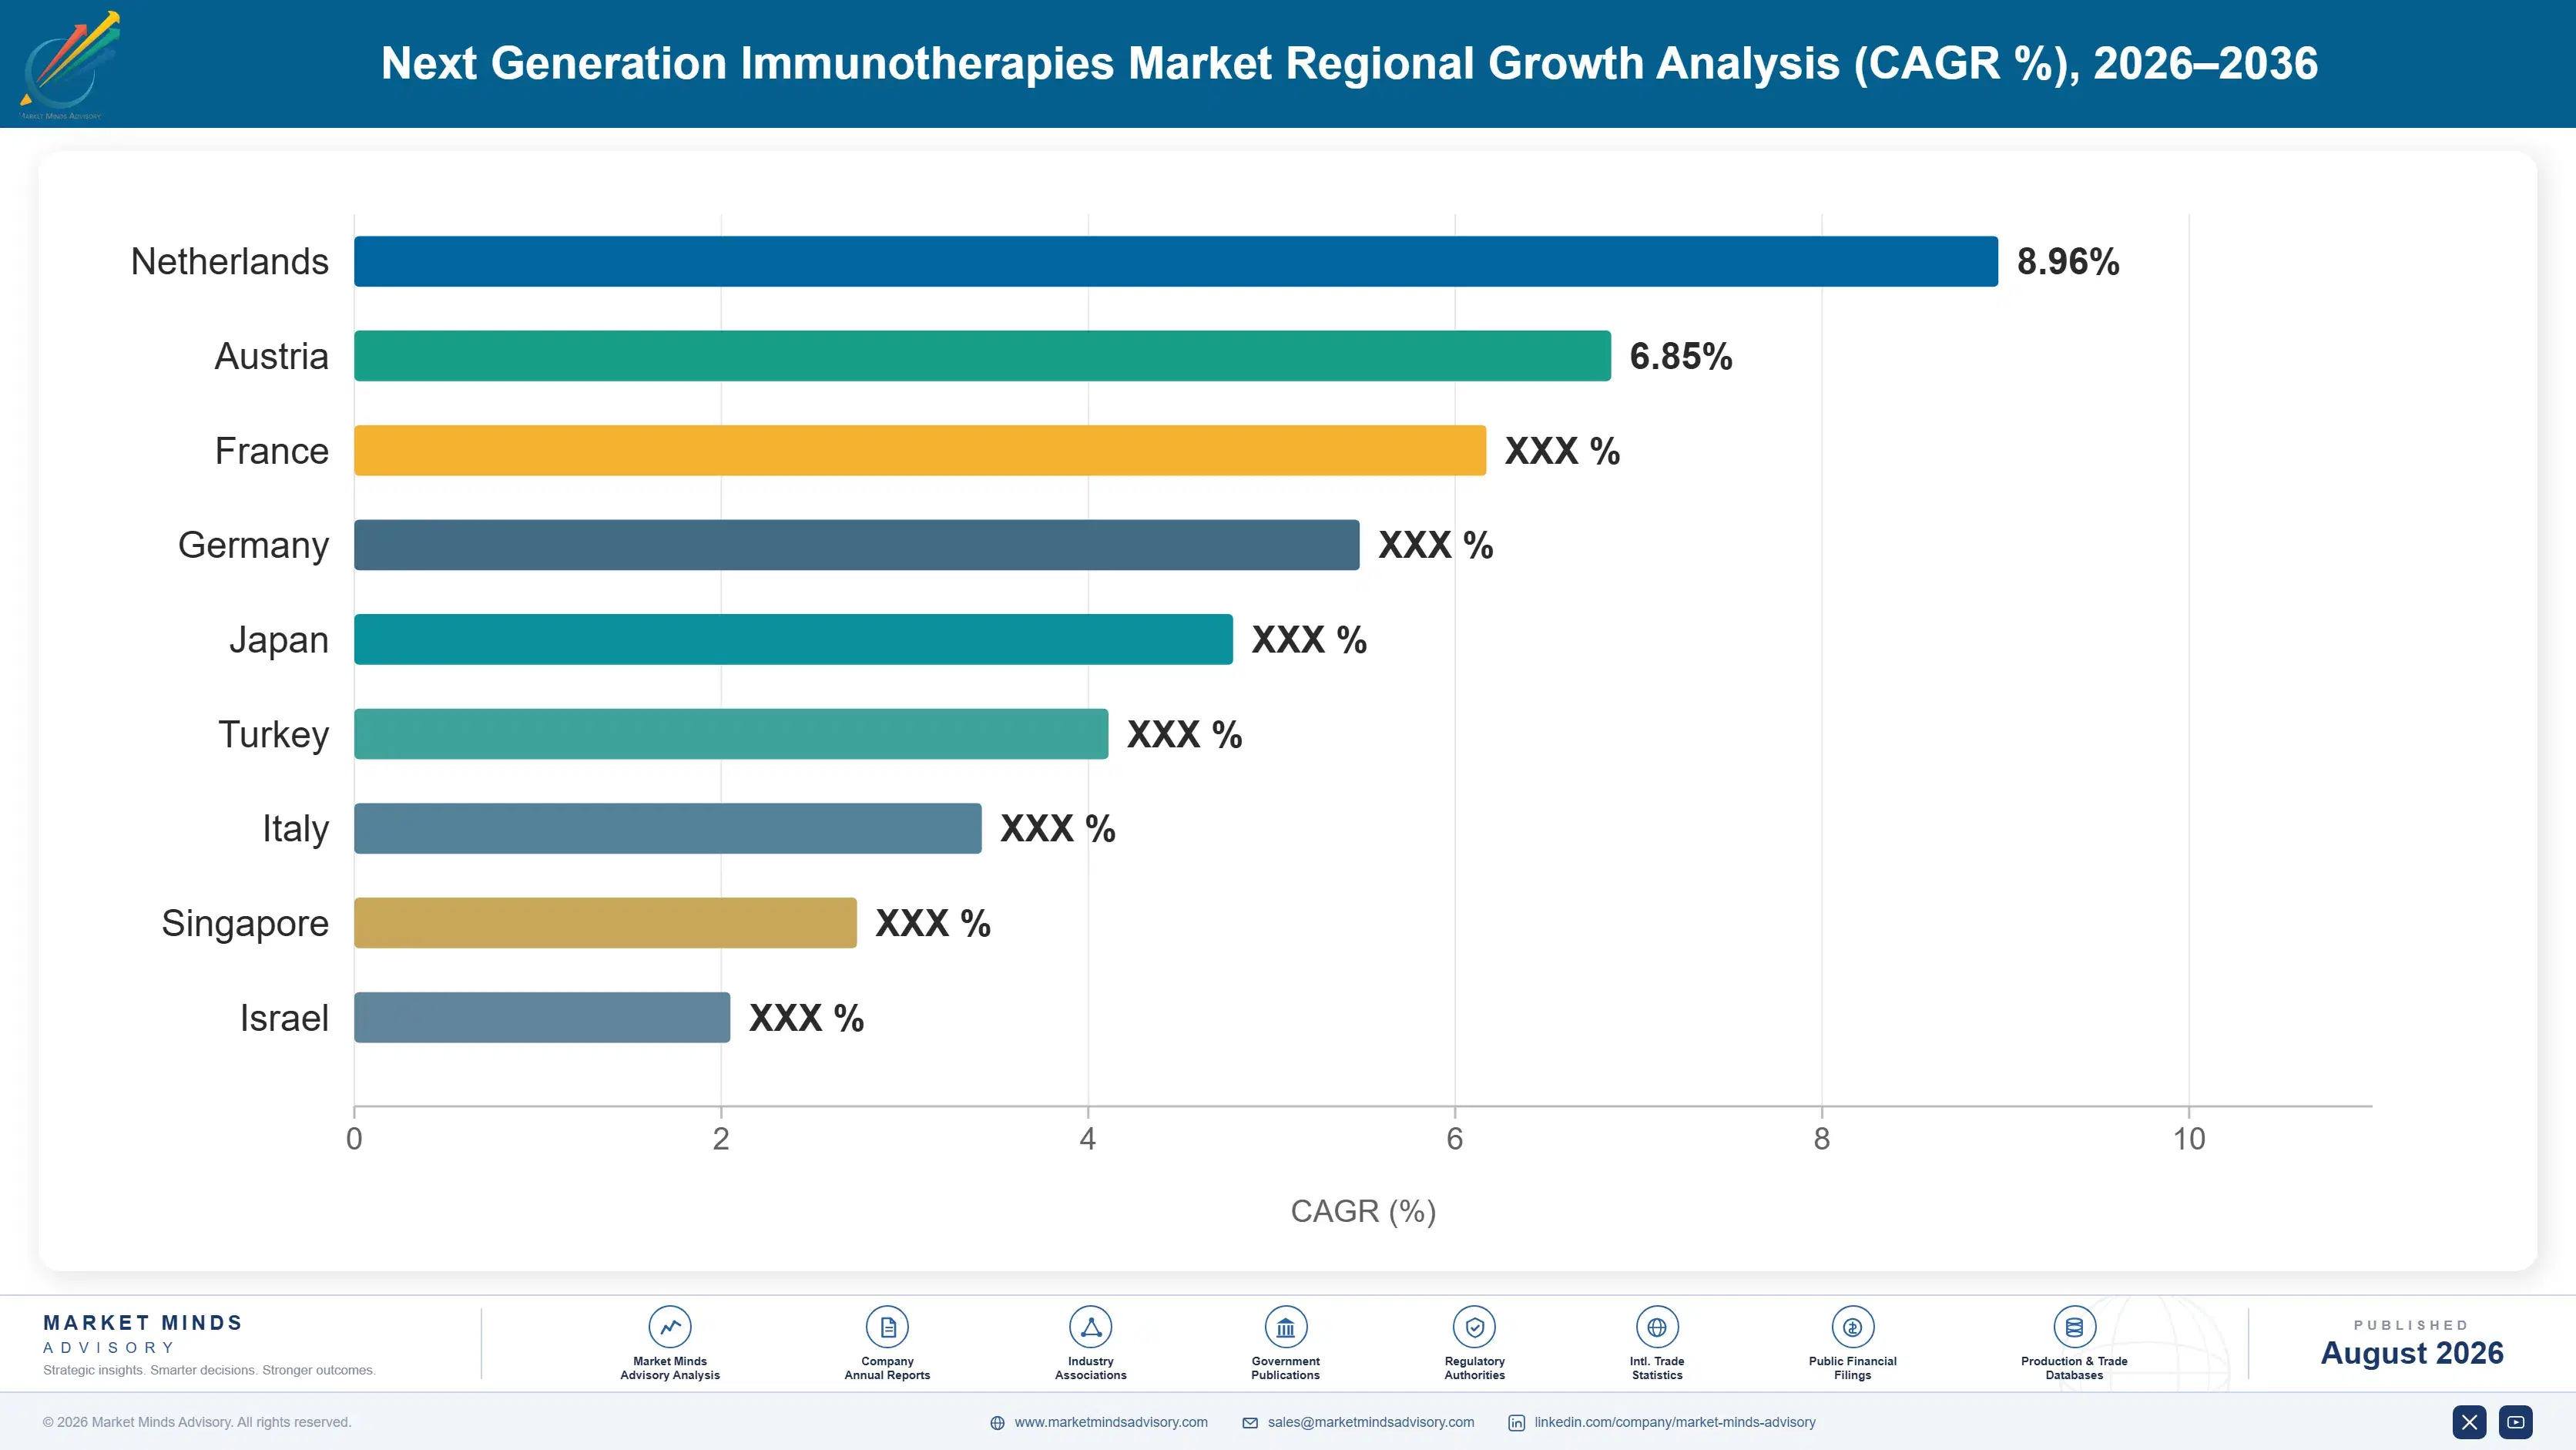
North America leads next-generation immunotherapy demand as the United States generates the majority of global commercial revenue and hosts the deepest concentration of oncology treatment infrastructure and specialized manufacturing capacity. Western Europe follows behind EMA's coordinated approval framework, while East Asia is scaling fastest behind expanding biotech licensing activity.

North America

The United States anchors global next-generation immunotherapy demand through the FDA's breakthrough therapy and accelerated approval pathways and the country's concentration of specialized oncology treatment centers capable of administering complex cell and antibody therapies. Merck, Bristol Myers Squibb, and Novartis all maintain their primary manufacturing and clinical operations domestically, giving American patients the fastest access to newly approved therapies relative to markets that depend on imported treatment capacity or delayed local regulatory review. Canadian healthcare systems generally follow FDA approval timelines with some lag for domestic regulatory review, while Mexican access remains more limited given the country's more constrained specialty healthcare reimbursement infrastructure for ultra-high-cost oncology treatments of this kind.
Share: 32% | CAGR: 10.5% (2026 to 2036)

Western Europe

Germany and the UK anchor Western European demand, both maintaining specialized oncology treatment centers and reimbursement frameworks capable of funding ultra-high-cost immunotherapy treatments through their national healthcare systems. The EMA's coordinated approval process increasingly synchronizes European timelines with FDA review, giving Roche and other European-headquartered developers a coordinated multinational pathway rather than requiring separate sequential regulatory processes across member states. The Nordic region's smaller but well-funded healthcare systems have moved quickly to establish reimbursement precedent for next-generation immunotherapies, giving Nordic patients meaningfully faster access than the broader European average despite the region's modest population size. Spain and Italy's healthcare systems have moved more slowly on reimbursement than Germany, reflecting centralized national pricing that limits regional flexibility.
Share: 23% | CAGR: 9.2% (2026 to 2036)
Regional intelligence for 5 additional markets available in the complete report: East Asia, South Asia and Pacific, Latin America, Middle East and Africa, Eastern Europe. Contact sales@marketmindsadvisory.com.
next-generation-immunotherapies-market-country-cagr-analysis-1787300031687

Manufacturing Scale and Earlier-Line Expansion Premiums

Companies extract value less through list price than through scaling off-the-shelf manufacturing to reduce per-dose cost, expanding indications into earlier treatment lines, and establishing first-mover positioning in solid tumors ahead of competitors in earlier trial phases. The levers below describe how each part of the value chain captures its share of a category shifting from rescue therapy toward standard treatment.

Off-the-Shelf Manufacturing Reduces Per-Dose Production Cost

Companies that scale off-the-shelf bispecific antibody manufacturing rather than depending on patient-specific cell processing reduce per-dose production cost as production volume increases, capturing margin that flows to commercial profitability rather than to complex per-patient logistics. Merck and Roche have both prioritised bispecific manufacturing investment because manufacturing cost represents roughly 38 percent of total treatment cost, the largest single cost category companies can meaningfully influence through direct scale investment. This manufacturing scale advantage compounds over time as cumulative production experience reduces cost, creating a durable advantage for companies that invested early relative to competitors still dependent on smaller-scale production.
Market Impact: Cuts per-dose manufacturing cost by roughly 25% at scale

Earlier-Line Expansion Multiplies Addressable Patient Value

Companies that expand approved therapies from relapsed and refractory indications into earlier treatment lines multiply the addressable patient population, since earlier-line patients represent a meaningfully larger population than the heavily pretreated patients these therapies originally targeted. Novartis and Johnson & Johnson have both prioritised earlier-line clinical trial investment because successful expansion increases total addressable revenue roughly 45 percent beyond what the original approval indication would generate. This expansion strategy requires substantial additional clinical trial investment, but it has proven the single most reliable way to multiply commercial value from an already-approved therapy without developing an entirely new asset.
Market Impact: Expands addressable revenue by roughly 45% per approval

Solid Tumor First-Mover Positioning Secures Category Leadership

Companies that achieve the first solid tumor approval for a cell therapy or bispecific modality capture a commercial and clinical precedent-setting position that later entrants find difficult to dislodge, since treatment centers and payers build infrastructure and protocols around whichever therapy establishes the category first. Iovance Biotherapeutics and other developers pursuing solid tumor indications are racing to establish this first-mover position, recognising that being first to prove a modality commercially viable in solid tumors creates advantages lasting 10-plus years beyond initial approval. This dynamic makes development speed a strategic priority that can outweigh incremental efficacy differences between competing programmes.
Market Impact: Establishes 10-plus years of durable category-defining precedent value

Combination Protocol Bundling Captures Higher-Value Treatment Courses

Companies that bundle next-generation immunotherapies into combination protocols with existing checkpoint inhibitors or targeted therapies capture 20 to 30 percent more total treatment course value than companies selling a single modality standalone, since combination protocols command premium pricing reflecting the clinical complexity of coordinated multi-drug regimens. Bristol Myers Squibb and Merck have both expanded combination protocol clinical trial investment to capture this bundled value, recognising that combination regimens represent the standard of care rather than an experimental add-on for many cancer types. This bundling strategy deepens treatment center relationships, since coordinated protocols require closer clinical collaboration than standalone treatment.
Market Impact: Adds roughly 20-30% to total treatment course value

Who Controls the Margin Pool

Five companies, Merck, Bristol Myers Squibb, Roche, Johnson & Johnson, and Novartis, hold roughly 54 percent of global next-generation immunotherapy revenue, a concentration built on decades of oncology clinical development infrastructure. The gap to challengers like Regeneron and Gilead narrows in specific modalities, cell therapy, where clinical data maturity matters less than in approved, commercially established bispecific indications.
Current competitive activity centres on three fronts: scaling off-the-shelf manufacturing to reduce per-dose cost and capture margin from patient-specific alternatives, expanding approved indications into earlier treatment lines that multiply addressable patient populations, and racing for first-mover positioning in solid tumor indications that will define the category's next commercial decade. Companies are licensing Chinese biotech candidates to accelerate pipeline development beyond in-house discovery timelines.

Emerging pressure comes from Chinese biotech originators developing bispecific and cell therapy candidates independently rather than solely as licensing partners, competing for direct commercial launch positioning rather than acting as pipeline sources for Western partners. Rankings are most likely to shift in solid tumor indications, where no incumbent holds the multi-decade commercial precedent that anchors the established hematologic malignancy hierarchy, leaving the category's next growth phase open to whichever company proves solid tumor commercial viability first.
next-generation-immunotherapies-market-company-positioning-matrix-1787300032206

Competitive Moat and Risk Dimensions

MERCK

Moat: Broadest Bispecific Clinical Pipeline

Merck has advanced more bispecific antibody candidates into late-stage trials across more cancer types than most rivals, giving it a pipeline breadth advantage that translates into multiple potential approval catalysts across a diversified indication base. That accumulated clinical development infrastructure, built over years of dedicated oncology investment, is difficult for competitors to replicate quickly.
MERCK

Risk: Heavy Dependence on Single Franchise

Merck's oncology revenue remains heavily weighted toward its established checkpoint inhibitor franchise, leaving it more exposed than diversified competitors if bispecific and cell therapy adoption accelerates faster than checkpoint inhibitor demand can be sustained. Competitors with more balanced modality portfolios face less concentrated transition risk.
BRISTOL MYERS SQUIBB

Moat: Deep Cell Therapy Manufacturing Experience

Bristol Myers Squibb's early CAR-T manufacturing investment gives it operational experience that newer cell therapy entrants lack, providing a quality and reliability track record that oncology treatment centers weigh heavily when selecting cell therapy partners for complex patient cases. That track record is difficult for newer manufacturing entrants to replicate without comparable years of operational history.
BRISTOL MYERS SQUIBB

Risk: Slower Bispecific Pipeline Development

Bristol Myers Squibb has moved more cautiously into bispecific antibody development than Merck and Roche, leaving it comparatively less positioned to capture the category's fastest-growing modality. Closing that gap will require faster bispecific pipeline investment than the company has historically prioritised. Rivals with earlier bispecific commitments continue extending their lead each quarter.

Players Tracked

Prominent Players

Merck
Bristol Myers Squibb
Roche
Johnson & Johnson
Novartis

Other Key Players

Pfizer
AbbVie
Regeneron Pharmaceuticals
Gilead Sciences
Legend Biotech
Iovance Biotherapeutics
Amgen
Sanofi
AstraZeneca
GSK
Moderna
BioNTech
2seventy bio
Adaptimmune
Autolus Therapeutics

Recent Developments

FEBRUARY 2026

Merck Receives Expanded Approval for Bispecific Antibody in Earlier Treatment Line

Merck received FDA approval to expand its lead bispecific antibody into an earlier treatment line in February 2026, following clinical trial data demonstrating meaningful efficacy improvement over standard second-line chemotherapy regimens. The expansion substantially broadens the therapy's addressable patient population beyond its original relapsed and refractory indication.
Signal: Confirms that earlier-line expansion is becoming the primary growth driver for approved bispecific antibody franchises broadly.
OCTOBER 2025

Iovance Biotherapeutics Advances Solid Tumor TIL Programme Into Late-Stage Trial

Iovance Biotherapeutics advanced its lead solid tumor tumor-infiltrating lymphocyte programme into late-stage trial design discussions with the FDA in October 2025, representing a step toward broader solid tumor cell therapy approval. The milestone followed years of early-stage trial data demonstrating a favourable efficacy profile in a solid tumor indication.
Signal: Signals that solid tumor cell therapy approval may arrive meaningfully sooner than the industry previously expected.
JUNE 2025

Bristol Myers Squibb Licenses Bispecific Candidate From Chinese Biotech

Bristol Myers Squibb signed a licensing agreement for a bispecific antibody candidate originated by a Chinese biotech company in June 2025, adding an asset to its oncology pipeline ahead of global clinical development. The deal followed a wave of licensing agreements between Western pharmaceutical companies and Chinese biotech originators.
Signal: Marks continued acceleration of Chinese biotech licensing as a primary pipeline sourcing strategy across the industry today.

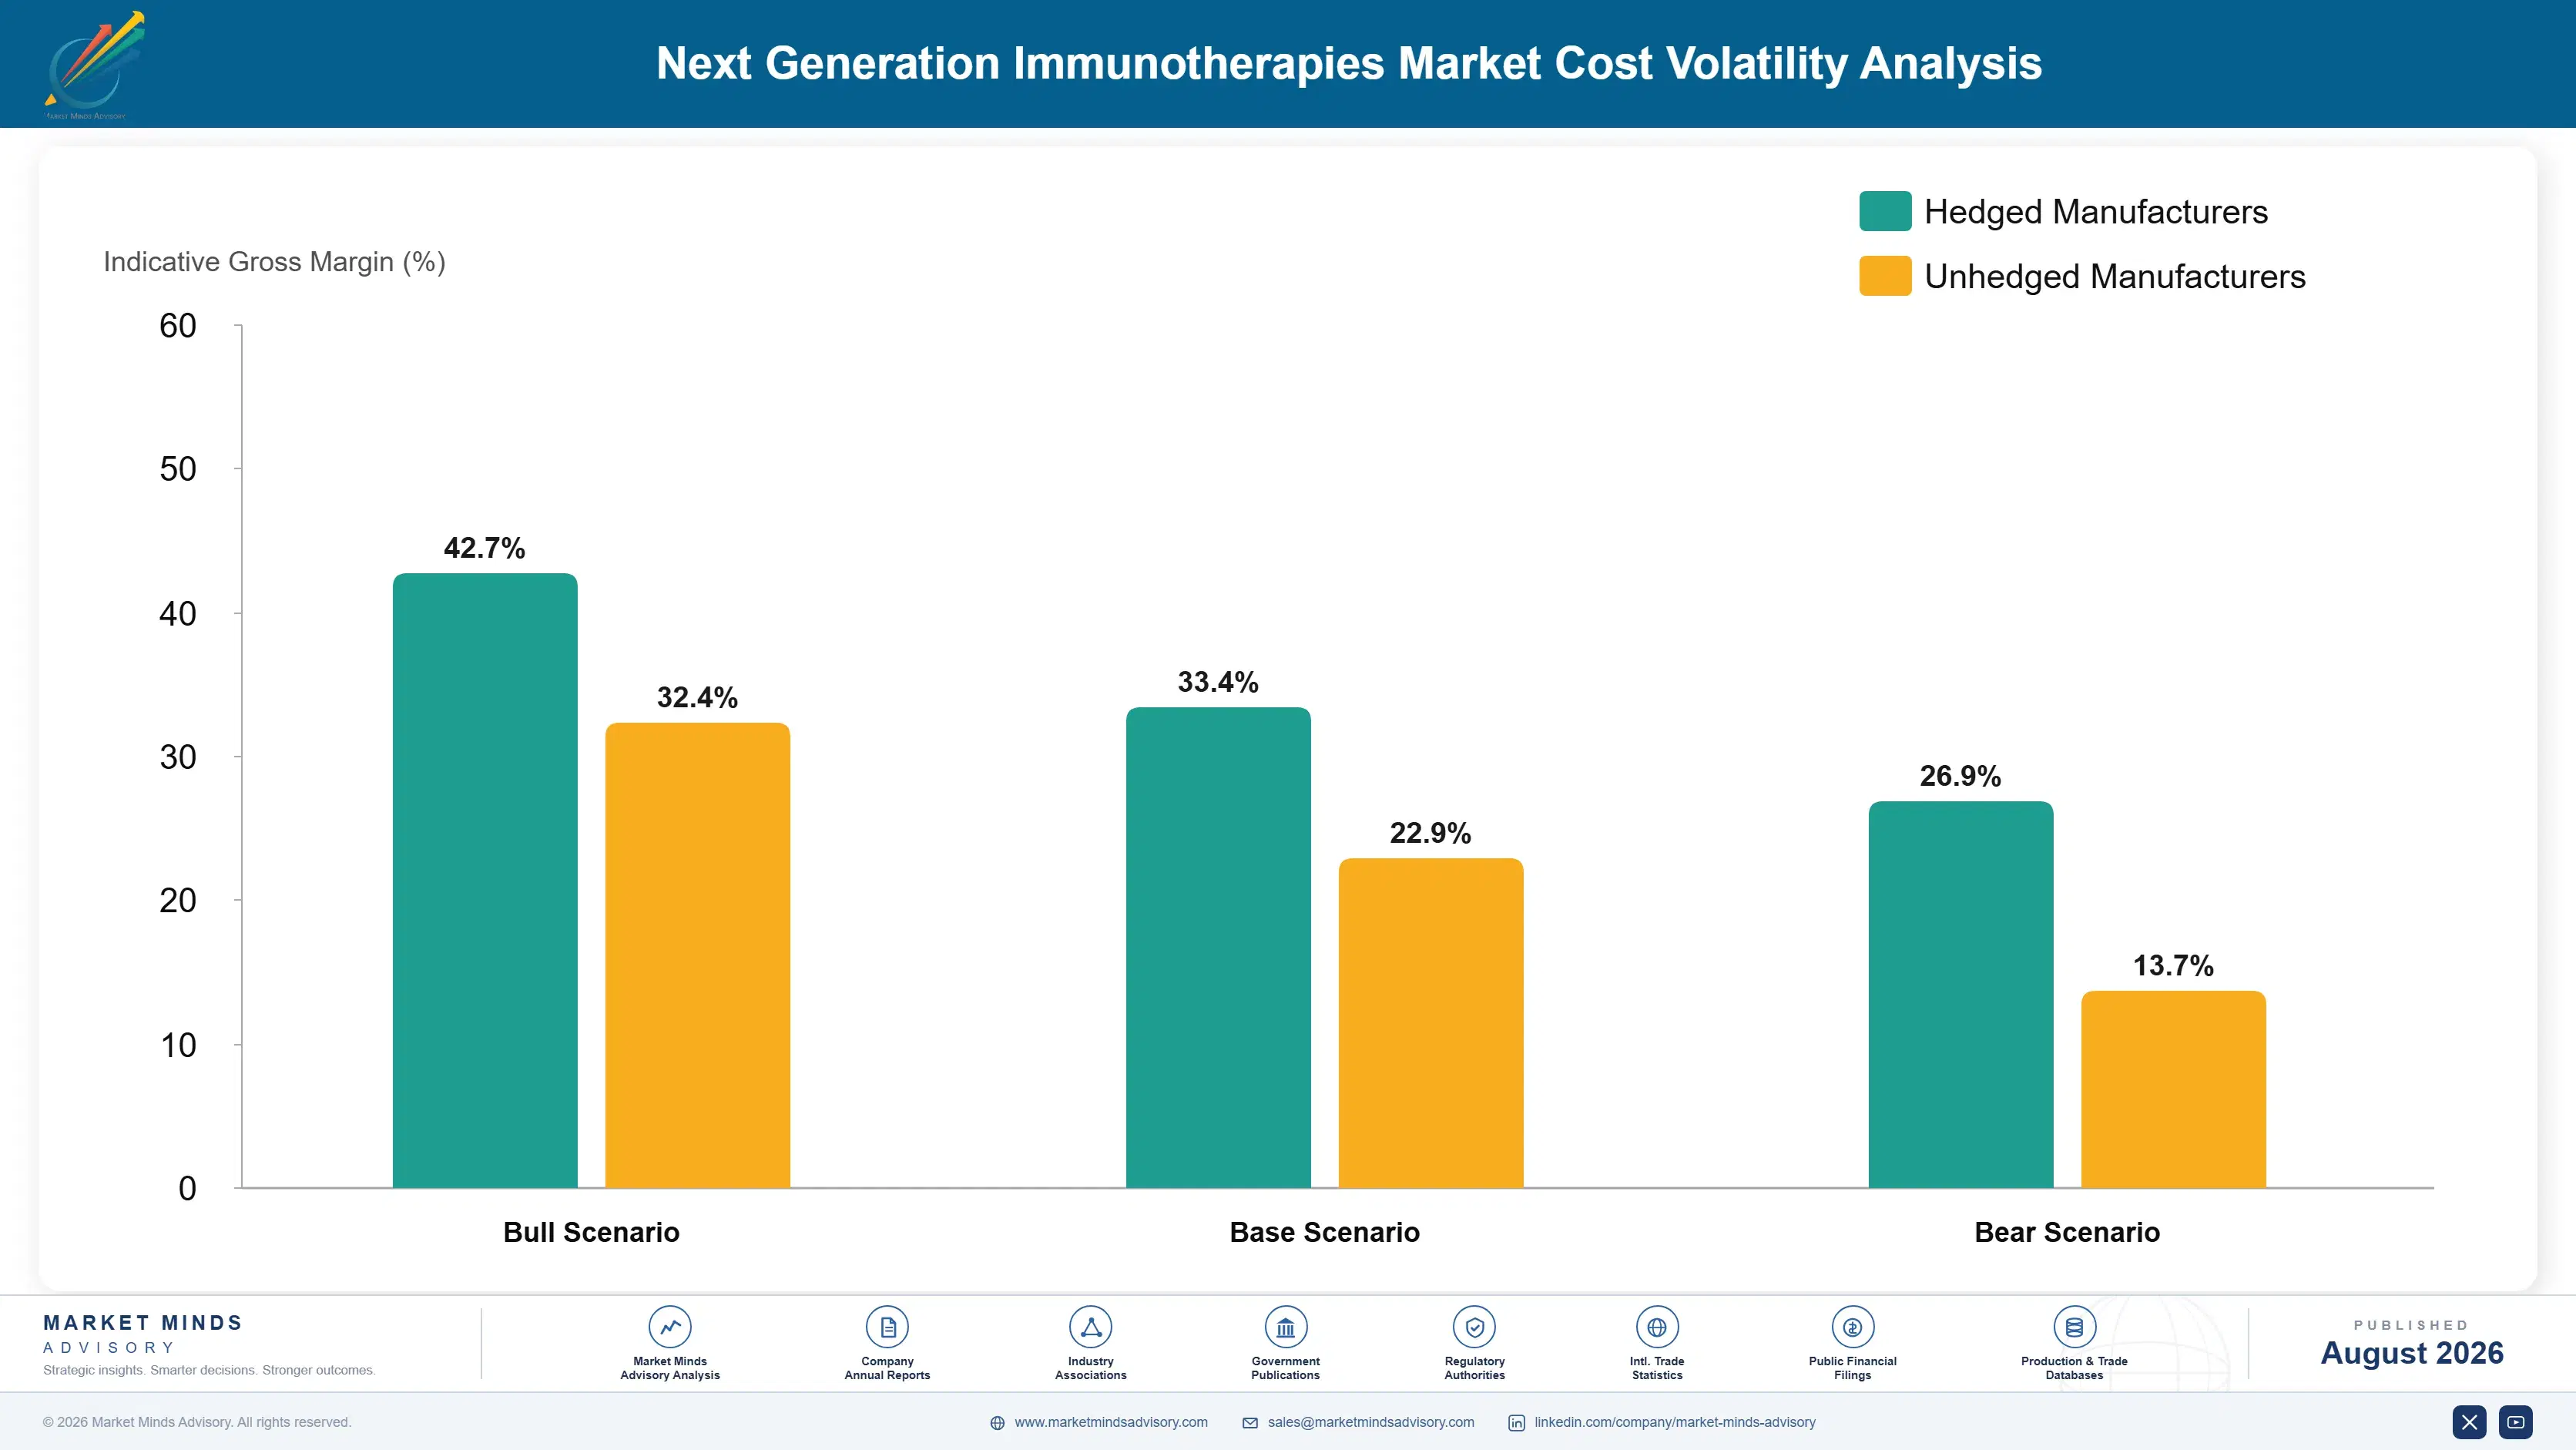
Cell Processing and Antibody Production Cost

Cell processing and antibody production represent the largest cost input for next-generation immunotherapies, accounting for roughly 38 percent of total treatment cost, concentrated among a small number of specialized manufacturing facilities capable of meeting the quality and sterility standards these therapies require. Raw material inputs including specialized cell culture media and antibody production cell lines add meaningful secondary cost exposure, sourced from a concentrated supplier base
Specialized cell therapy manufacturing capacity remained constrained through 2023 and into 2024 as demand from an expanding pipeline of approved and late-stage programmes outpaced available manufacturing capacity, and Novartis's fiscal year 2024 annual report cited manufacturing capacity constraints as a direct limit on commercial supply despite strong underlying demand. Companies responded by investing in automated manufacturing platforms and expanding facility capacity, reducing exposure to the capacity shortages that had previously constrained commercial treatment availability.

Vertically integrated companies with proprietary manufacturing capacity, including Novartis and Gilead, absorb capacity constraints more predictably than companies dependent on third-party contract manufacturers competing for the same limited specialized capacity. That gap gives integrated companies a durable cost and supply-security advantage over smaller clinical-stage competitors, during the capacity-constrained periods that have periodically delayed treatment availability across the category.
next-generation-immunotherapies-market-cost-volatility-analysis-1787300032403

Automated Manufacturing Platform Investment

Leading companies are investing in automated, closed-system manufacturing platforms that reduce per-patient processing time and labour dependency, easing the capacity constraints that have periodically limited cell therapy availability across the category. This approach requires substantial upfront capital investment but meaningfully reduces long-term exposure to manufacturing capacity shortages during periods of demand growth. Smaller developers rarely match this pace.

Long-Term Manufacturing Capacity Reservation Agreements

Companies without proprietary manufacturing capacity are signing long-term capacity reservation agreements directly with contract manufacturers to secure priority production slots ahead of anticipated demand growth, trading some flexibility for supply certainty. Smaller companies without comparable negotiating leverage remain more exposed to capacity allocation decisions made by larger competitors as available capacity tightens industry-wide each year.

Diversifying Raw Material Suppliers Across Regions

Manufacturers are qualifying additional cell culture media and antibody production cell line suppliers across multiple regions to reduce dependence on any single geographic source, protecting production continuity during periods of regional supply disruption. This diversification adds qualification cost but reduces the risk of a single supplier disruption halting commercial production across a company's full portfolio.

Portfolio Architecture for Margin Defence

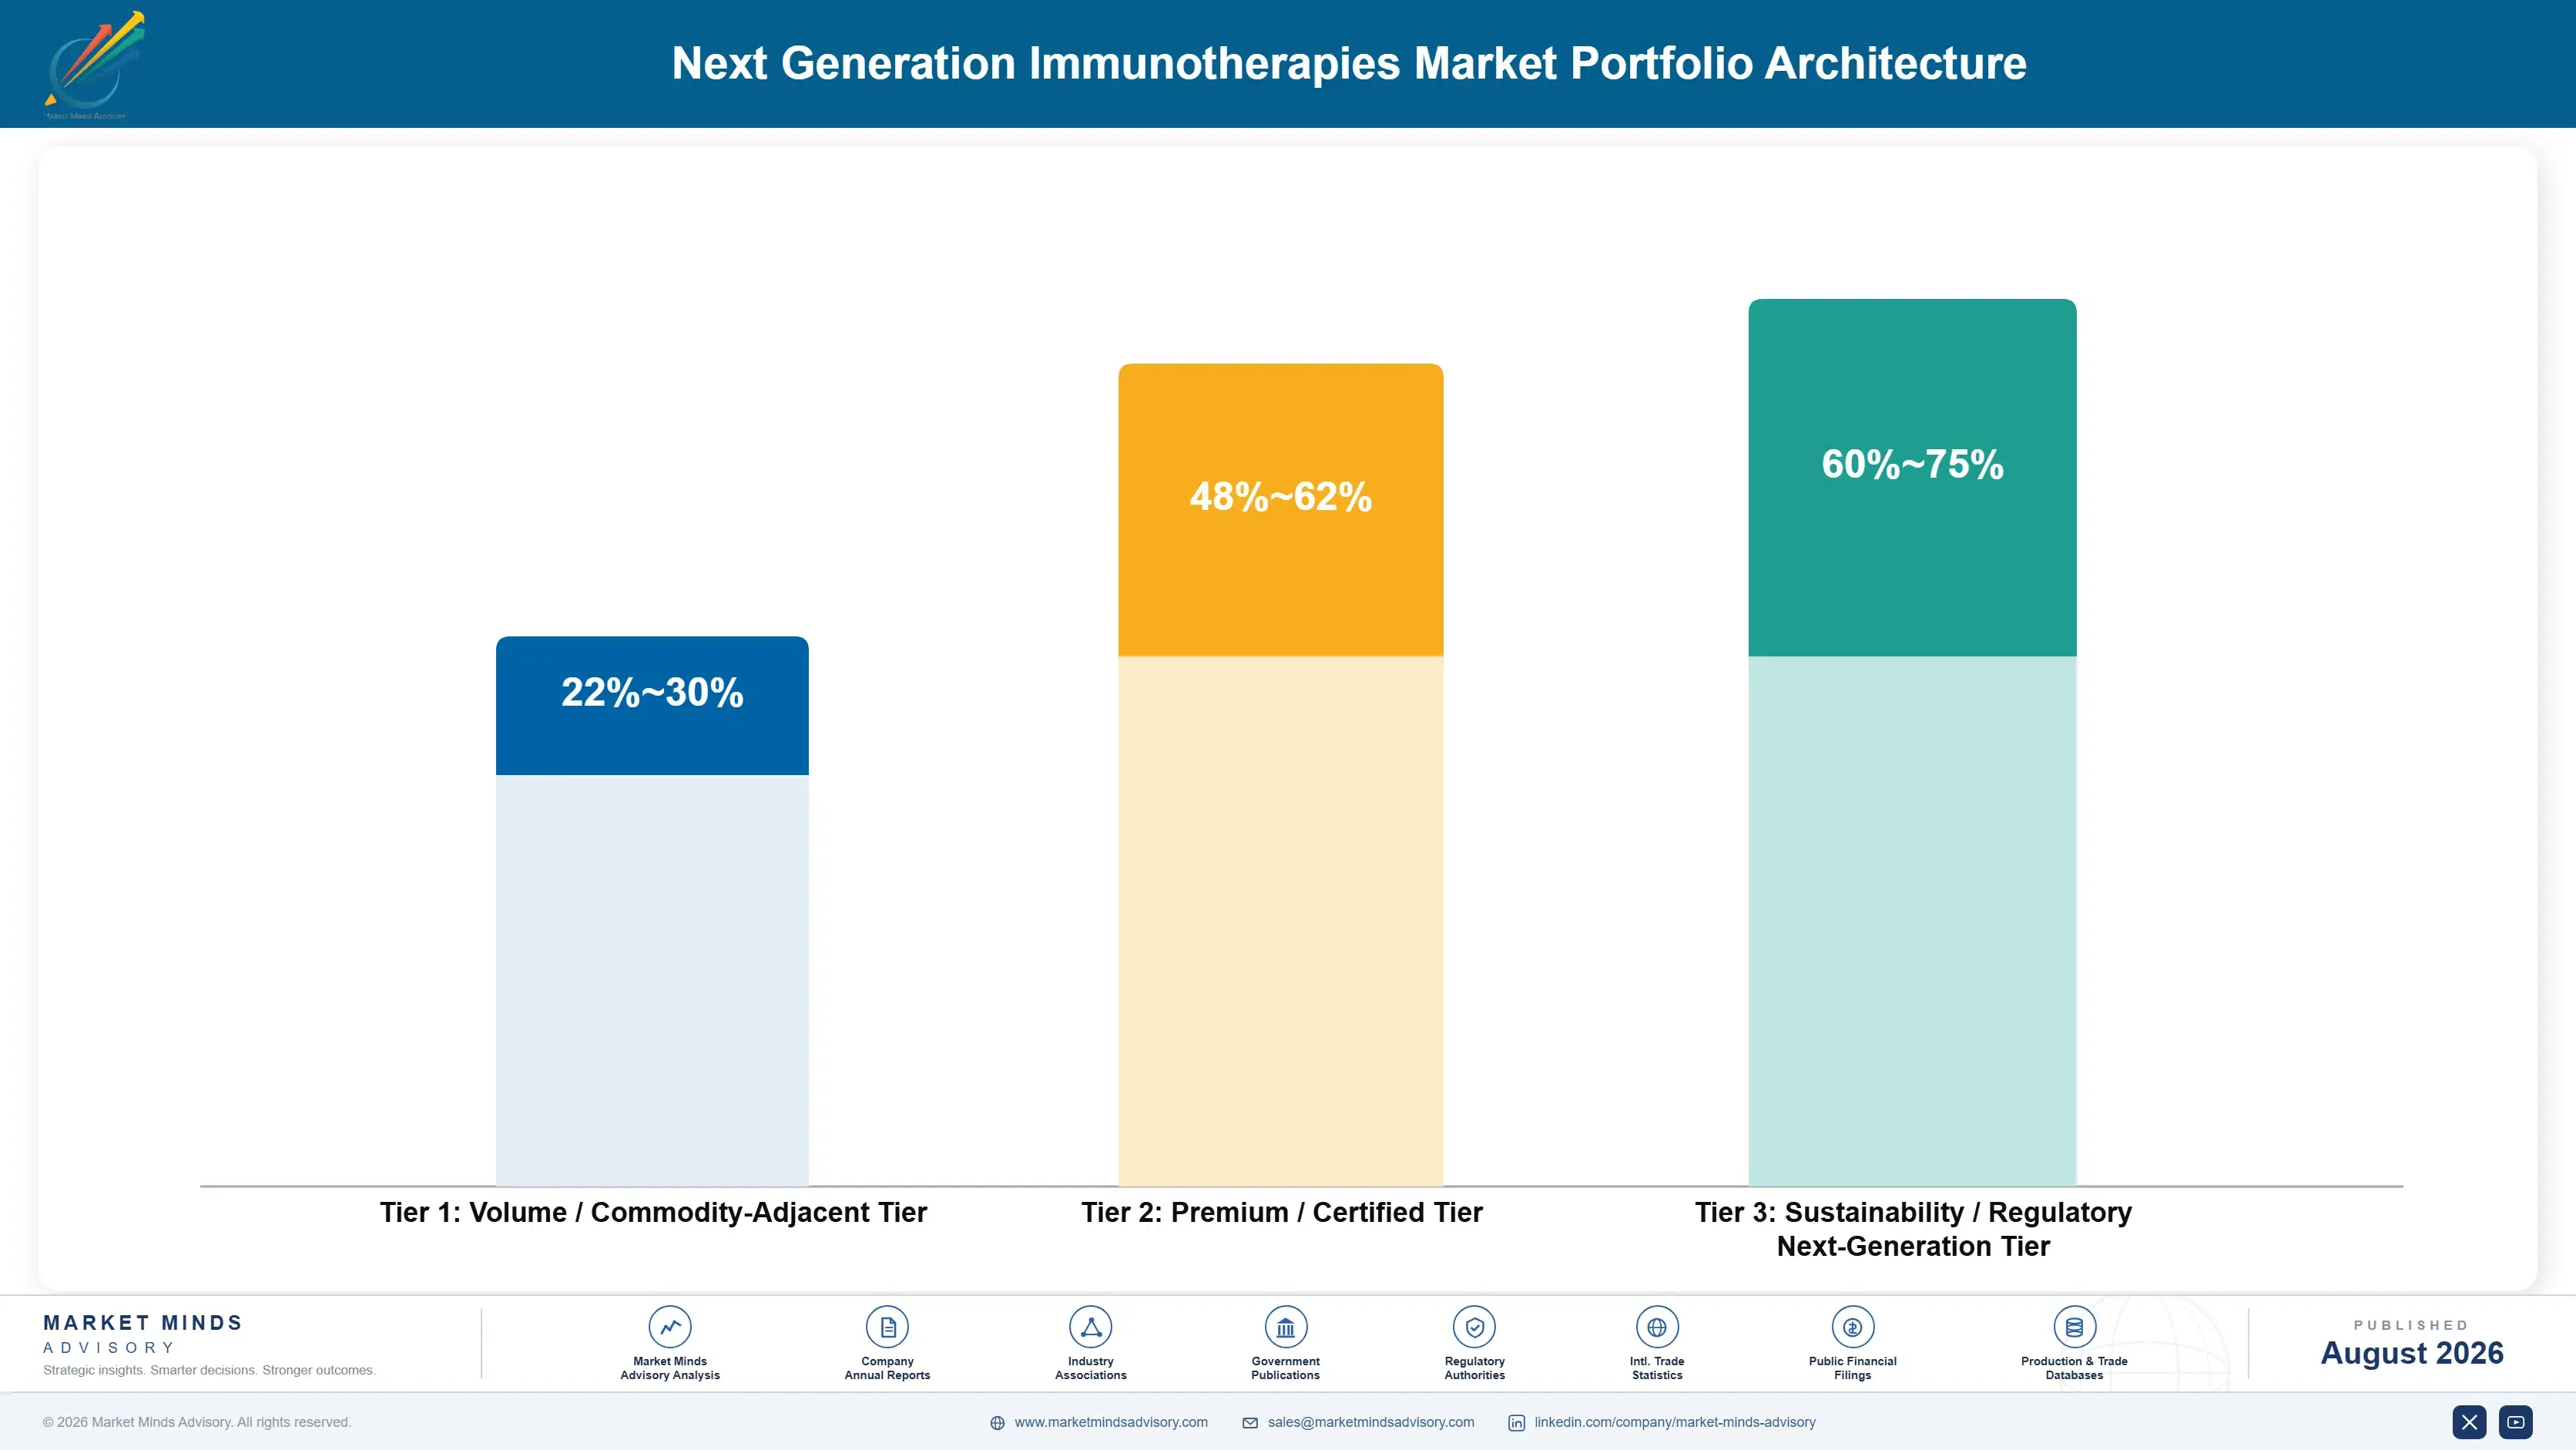
Next-generation immunotherapy companies operate across three margin tiers built around modality complexity and manufacturing scale rather than treatment volume. Commodity-adjacent early pipeline and licensing revenue sits at the volume base, approved bispecific and hematologic treatments occupy the middle at firmer margins, and solid tumor cell therapy and combination protocol approvals sit at the top, commanding premium value few companies can access. Most companies participate across all three
The volume-premium tension plays out in how companies allocate scarce manufacturing capacity: every unit dedicated to an approved hematologic indication is capacity not available for a solid tumor programme in trials, so companies prioritise solid tumor investment even when it constrains commercial volume in approved indications.

High-value margin pools concentrate in solid tumor cell therapy approvals and in combination protocol bundling that convert regulatory approval into sustained commercial revenue, both of which command valuation closer to platform technology economics than to single-indication oncology drug economics. Companies that can move from a single approved hematologic indication into a broader solid tumor portfolio capture more of total category value.

Volume / Commodity-Adjacent Tier

Platform licensing and early-stage pipeline revenue generated at scale across multiple partner programmes, priced close to established biotech licensing benchmarks with limited differentiation. This tier competes mainly on antibody engineering breadth.
Gross Margin: 22-30%

Premium / Certified Tier

Approved bispecific and hematologic cell therapy treatments requiring extensive regulatory and manufacturing infrastructure, commanding a defensible premium given the clinical validation behind each approved therapy. Buyers weigh manufacturing reliability heavily.
Gross Margin: 48-62%

Sustainability / Regulatory / Next-Generation Tier

Solid tumor cell therapy and combination protocol approvals carrying the deepest commercial infrastructure investment, sold primarily into the category's highest-value next-generation commercial opportunities. Pricing power here remains largely unproven. Few companies currently qualify to compete in this segment.
Gross Margin: 60-75%
next-generation-immunotherapies-market-portfolio-architecture-1787300032895

High-value Sub-segments and Strategic Watch-out

Solid Tumor Cell Therapy Approvals

Solid tumor cell therapy approvals carry the category's highest potential value and fastest growth, driven by patient populations orders of magnitude larger than prior hematologic approvals, though genuine commercial and manufacturing uncertainty keeps near-term revenue contribution modest for now. Early movers stand to define treatment protocols for the category.
Gross Margin: 60-75%

Combination Protocol Treatment Regimens

Combination protocols carry strong margins and steady growth, anchored in multi-year treatment center relationships that renew predictably as companies expand combination indications across additional cancer types. Renewal rates remain unusually high once a protocol becomes standard of care. Companies with proven protocols renew faster than newer entrants.
Gross Margin: 45-58%

Approved Hematologic Malignancy Treatments

Approved hematologic malignancy treatments remain the category's commercial anchor, growing steadily with patient diagnosis and treatment center adoption rates but carrying a naturally capped ceiling given the smaller size of hematologic patient populations. Companies defend this tier mainly to fund pipeline investment. Growth here is durable but inherently capped.
Gross Margin: 48-62%

Manufacturing-Constrained Cell Therapy Developers

Cell therapy developers dependent entirely on patient-specific manufacturing represent a durable competitive disadvantage versus bispecific-focused competitors, particularly as manufacturing capacity constraints periodically favour companies with scalable off-the-shelf production over per-patient manufacturing approaches. These developers risk losing commercial launch timing to better-capitalised rivals with scalable capacity.
Gross Margin: 28-40%

From Rescue Therapy to Standard Treatment

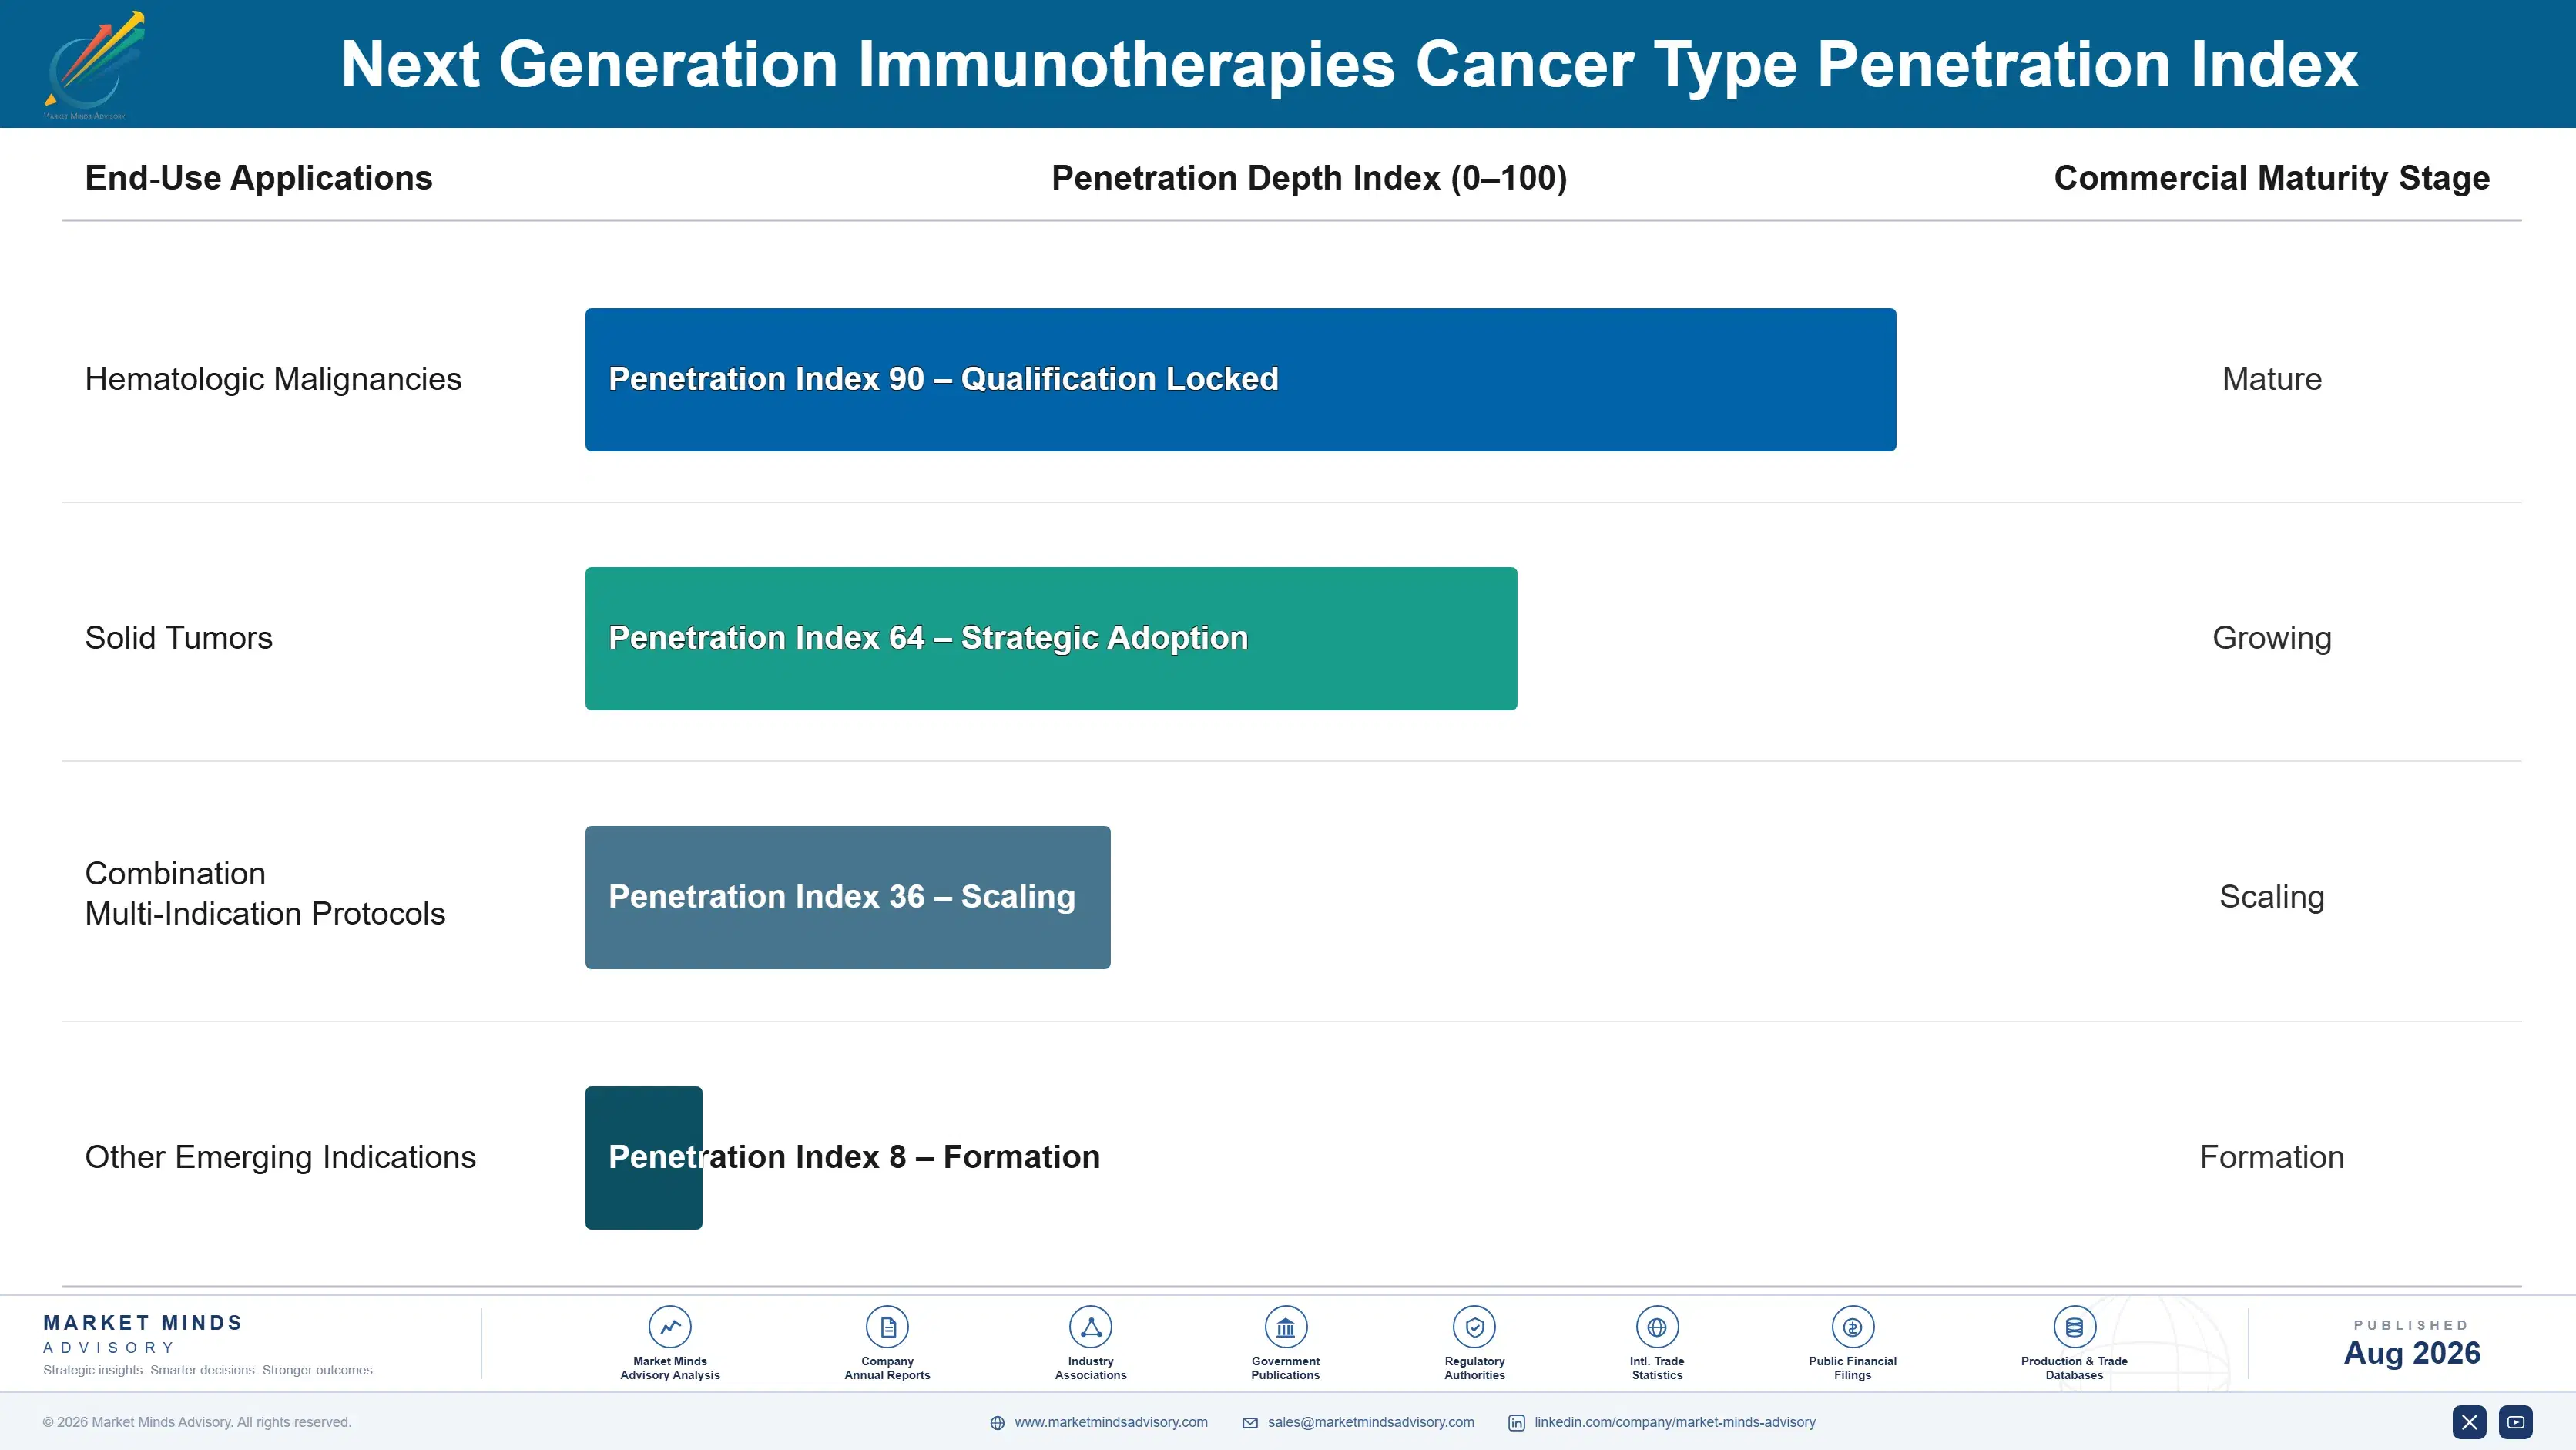
Next-generation immunotherapy demand is shifting from a rescue therapy reserved for relapsed and refractory patients toward a standard early-line treatment category that resembles a durable therapeutic platform more than a series of isolated rescue approvals. Companies that establish manufacturing infrastructure and clinical protocols in hematologic indications are positioning to extend that infrastructure into solid tumor indications, while treatment centers increasingly treat next-generation i
Adoption depth varies sharply by indication maturity. Hematologic malignancies show the deepest clinical precedent and fastest treatment center adoption, since oncologists have prescribed these modalities across multiple years of commercial experience. Solid tumor programmes show earlier-stage, more uncertain adoption patterns, since neither manufacturing scale nor clinical precedent has been fully established for widespread solid tumor cell therapy use.

A generational shift among prescribing oncologists is reinforcing the trend. Younger oncologists trained during the recent immunotherapy commercialization wave treat bispecific and cell therapy referral as standard practice, while veteran oncologists accustomed to conventional chemotherapy-first protocols are adapting more slowly, occasionally delaying referral until forced by clear patient demand or peer practice norms.
next-generation-immunotherapies-market-end-use-penetration-index-1787300033393

Where MMA Sees the Real Opportunity

These are among the four positions where our research anticipates prominent divergence between winners and laggards over the coming forecast period. Each is grounded in the demand model, the regulatory perimeter, and the announced capacity pipeline.
01 / MANUFACTURING SCALE INVESTMENT

Invest in off-the-shelf manufacturing capacity now

Companies that scale off-the-shelf bispecific manufacturing capacity now are capturing commercial revenue meaningfully faster than companies dependent on patient-specific cell processing that cannot match comparable production volumes. This positioning matters more than achieving marginal efficacy improvements over competing programmes, since manufacturing scale, not clinical data alone, increasingly determines which company captures the largest share of a rapidly growing addressable market. MMA recommends prioritising manufacturing scale investment over incremental clinical trial spending in the current three-year window, particularly for companies competing in high-volume indications.
02 / EARLIER-LINE EXPANSION FOCUS

Prioritise earlier-line clinical trial investment now

Earlier-line indication expansion represents the single most reliable way to multiply commercial value from an already-approved therapy, since earlier-line patient populations are substantially larger than the heavily pretreated populations these therapies originally targeted. Companies still concentrated purely in relapsed and refractory indications are leaving substantial addressable market value uncaptured relative to competitors already pursuing earlier-line expansion trials. MMA views earlier-line clinical trial investment as the highest-return near-term opportunity available within the category over the next three years, ahead of speculative new-modality research spending.
03 / SOLID TUMOR PIPELINE PRIORITY

Prioritise solid tumor cell therapy pipeline investment

Solid tumors represent the large majority of total cancer diagnoses worldwide, and companies that achieve first meaningful approval in solid tumor cell therapy capture commercial and clinical precedent that later entrants will find difficult to dislodge regardless of subsequent efficacy comparisons. Companies concentrated purely in hematologic indications face a meaningfully smaller addressable market than competitors pursuing solid tumor programmes actively. MMA recommends prioritising solid tumor pipeline investment ahead of competitors still weighing whether the manufacturing and regulatory risk justifies the required investment.
04 / CHINESE BIOTECH PARTNERSHIP

Build Chinese biotech licensing relationships now

Chinese biotech companies now originate a substantial and growing share of the world's most promising bispecific and cell therapy candidates, and companies without established Chinese licensing relationships face a genuinely difficult path to accessing this pipeline regardless of internal discovery investment. Competitors that moved early on Chinese licensing partnerships are capturing differentiated pipeline assets years ahead of companies still building these relationships from scratch. MMA recommends prioritising Chinese biotech partnership development as a durable, relatively capital-efficient pipeline sourcing strategy available to companies of every size.

Engagement Snapshot From the Field

A live engagement with an industry participant carrying material or product regulatory and market exposure ahead of a defining policy shift, showing how our research translates into a defensible multi-year portfolio strategy.
MARKET MINDS ADVISORY · CLIENT ENGAGEMENT SUMMARY
Next Generation Immunotherapies Producer Strategic Portfolio Review and Transition Roadmap 2026·Investment Scenario on Next Generation Immunotherapies Exposure Evaluation 2025-26
CLIENT PROFILE
The client is a mid-cap oncology biotech developer with a bispecific antibody programme approaching FDA approval for a relapsed and refractory hematologic malignancy indication within the following twelve months. The company reported a market capitalization in the low billions of dollars (client-reported, unverified by MMA) and had not yet developed a comprehensive manufacturing scale-up and earlier-line expansion strategy ahead of its anticipated approval.
STRATEGIC CHALLENGE
The client faced a compressed timeline to develop commercial manufacturing capacity and plan earlier-line expansion trials before a potential approval decision that could arrive faster than the client's existing manufacturing planning assumptions anticipated. Management needed a strategy that prepared the organization for rapid commercial launch while sequencing earlier-line trial investment to maximize long-term addressable market value.
MMA APPROACH
MMA's engagement team benchmarked the client's manufacturing scale-up timeline against comparable prior bispecific antibody launches, interviewed major treatment centers to assess earlier-line trial demand, and modelled manufacturing capacity requirements across three commercial launch scenarios. The team recommended a phased strategy that prioritised initial indication manufacturing readiness while sequencing earlier-line expansion trial investment to match confirmed commercial launch milestones.
KEY FINDINGS
  1. Manufacturing capacity requirements for the approved indication substantially exceeded the client's existing planning assumptions, which had been based on comparable but smaller prior programme launch experience.
  2. Treatment centers indicated meaningful willingness to begin earlier-line trial enrollment discussions ahead of formal approval (client-reported, unverified by MMA), provided the client initiated outreach early.
  3. Competing bispecific developers pursuing similar indications had already begun earlier-line expansion trials, creating meaningful urgency around the client's own trial sequencing timeline.
  4. Manufacturing automation investment reduced projected per-dose production cost more than the client's original manufacturing scale-up budget had assumed, freeing capital for earlier-line trial expansion instead.
CLIENT PROFILE
The client is a mid-cap oncology biotech developer with a bispecific antibody programme approaching FDA approval for a relapsed and refractory hematologic malignancy indication within the following twelve months. The company reported a market capitalization in the low billions of dollars (client-reported, unverified by MMA) and had not yet developed a comprehensive manufacturing scale-up and earlier-line expansion strategy ahead of its anticipated approval.
STRATEGIC CHALLENGE
The client faced a compressed timeline to develop commercial manufacturing capacity and plan earlier-line expansion trials before a potential approval decision that could arrive faster than the client's existing manufacturing planning assumptions anticipated. Management needed a strategy that prepared the organization for rapid commercial launch while sequencing earlier-line trial investment to maximize long-term addressable market value.
MMA APPROACH
MMA's engagement team benchmarked the client's manufacturing scale-up timeline against comparable prior bispecific antibody launches, interviewed major treatment centers to assess earlier-line trial demand, and modelled manufacturing capacity requirements across three commercial launch scenarios. The team recommended a phased strategy that prioritised initial indication manufacturing readiness while sequencing earlier-line expansion trial investment to match confirmed commercial launch milestones.
KEY FINDINGS
  1. Manufacturing capacity requirements for the approved indication substantially exceeded the client's existing planning assumptions, which had been based on comparable but smaller prior programme launch experience.
  2. Treatment centers indicated meaningful willingness to begin earlier-line trial enrollment discussions ahead of formal approval (client-reported, unverified by MMA), provided the client initiated outreach early.
  3. Competing bispecific developers pursuing similar indications had already begun earlier-line expansion trials, creating meaningful urgency around the client's own trial sequencing timeline.
  4. Manufacturing automation investment reduced projected per-dose production cost more than the client's original manufacturing scale-up budget had assumed, freeing capital for earlier-line trial expansion instead.
RECOMMENDED STRATEGY
Phase 1: Phase 1 (Months 1 to 6): Finalize commercial manufacturing capacity investment calibrated to projected first-year demand volume requirements across target markets. Phase 2: Phase 2 (Months 7 to 10): Initiate earlier-line expansion trial planning and treatment center outreach well ahead of the approval decision. Phase 3: Phase 3 (Months 11 to 12): Complete commercial launch readiness and begin earlier-line trial enrollment ahead of the approval decision.
OUTCOME
Following the engagement, the client reported entering commercial launch with manufacturing capacity calibrated to projected demand and earlier-line trial enrollment already underway well ahead of typical category timelines (client-reported, unverified by MMA). The phased manufacturing investment approach protected capital while ensuring adequate capacity was in place ahead of confirmed approval.

Frequently Asked Questions

Foundational context covering the market sizes, CAGR, scope, country, region and competition that inform every finding below. This section is provided to cover basics and most often pre-purchase conversations, answered from the MMA Primary Research Dataset.

What is the current size of the Next Generation Immunotherapies Market?

The global next generation immunotherapies market reached approximately $53.7 billion in 2026. Demand is concentrated in approved bispecific and hematologic cell therapies, with solid tumor programmes emerging as the next major growth driver.

How large will the Next Generation Immunotherapies Market be by 2036?

MMA projects the market will reach approximately $149.8 billion by 2036. That represents nearly a tripling of 2026 revenue across the ten-year forecast period, driven largely by solid tumor and combination protocol expansion.

What is the CAGR for the Next Generation Immunotherapies Market 2026 to 2036?

The base case compound annual growth rate is 10.8 percent. Bull and bear scenarios range from roughly 9.5 percent to 12.1 percent depending on regulatory and manufacturing developments.

Which segment is growing fastest?

Tumor-infiltrating lymphocyte therapies are growing fastest, at roughly 1.6 times the overall market rate. Solid tumor indication expansion is the primary driver behind that outperformance.

Who are the major companies in the Next Generation Immunotherapies Market?

Merck, Bristol Myers Squibb, Roche, Johnson & Johnson, and Novartis lead the market. Together they hold roughly 54 percent of global revenue, built on decades of oncology clinical development infrastructure.

Which country is growing fastest?

China is the fastest-growing major market, driven by rapidly expanding biotech licensing activity and domestic commercial launches. Its next-generation immunotherapy demand is expanding at roughly 15.4 percent annually.

Report Segmentation Architecture

The full report scope spans multiple orthogonal segmentation dimensions, with cross-tabulated demand data provided for each dimension pair. Coverage extends further to regional breakdowns, trend trajectories, and the competitive detail needed to support segment-level decision-making.

By Modality

  • CAR-T Cell Therapies
  • Bispecific and Multispecific Antibodies
  • Immune Checkpoint Inhibitors
  • Cancer Vaccines
  • Tumor-Infiltrating Lymphocyte Therapies
  • Cytokine and Innate Immune Modulators

By Cancer Type

  • Hematologic Malignancies
  • Solid Tumors
  • Combination Multi-Indication Protocols
  • Other Emerging Indications

By Commercial Dimension

  • Direct Commercial Sales
  • Combination Protocol Bundling
  • Platform Licensing and Royalty Revenue
  • Manufacturing Services and Contract Partnerships

By Region

  • North America
  • Western Europe
  • East Asia
  • South Asia and Pacific
  • Latin America
  • Middle East and Africa
  • Eastern Europe

Scope, Methodology, and Coverage

Every figure in this report is reproducible from documented input assumptions. The scope below maps the historical period, the forecast horizon, the segmentation dimensions, and the countries covered, alongside the underlying primary and qualitative methodology.
Historical Period
2020 to 2025
Forecast Period
2026 to 2036
Base Year
2025 (USD billions; MMA Primary Research Dataset, August 2026)
Market Definition
The next generation immunotherapies market covers bispecific and multispecific antibodies, CAR-T and other engineered cell therapies, tumor-infiltrating lymphocyte therapies, cancer vaccines, and next-generation checkpoint inhibitor combinations used to treat solid tumor and hematologic malignancies. It excludes first-generation single-target checkpoint inhibitor monotherapies, conventional chemotherapy, and non-oncology immunomodulator applications.
Quantitative Units
USD billions (current prices); approved patient treatment count where applicable
Segmentation Dimensions
By Modality; By Cancer Type; By Commercial Dimension; By Region
Regions Covered
North America, Western Europe, East Asia, South Asia and Pacific, Latin America, Middle East and Africa, Eastern Europe
Countries Covered
USA, China, Germany, France, UK, Japan, South Korea, India, Australia, Canada, Brazil, Mexico, Indonesia, Vietnam, Thailand, Malaysia, UAE, Saudi Arabia, South Africa, Nigeria, Turkey, Poland, Netherlands, Italy, Spain, Sweden, Switzerland, Argentina, Colombia, Singapore, and additional markets relevant to this sector
Key Companies Profiled
Merck, Bristol Myers Squibb, Roche, Johnson & Johnson, Novartis, Pfizer, AbbVie, Regeneron Pharmaceuticals, Gilead Sciences, Legend Biotech, Iovance Biotherapeutics, Amgen, Sanofi, AstraZeneca, GSK, Moderna, BioNTech, 2seventy bio, Adaptimmune, Autolus Therapeutics
Quantitative Methodology
Primary survey, n=3,800 respondents, Q4 2025, six countries; demand-side model with trade association cross-validation
Qualitative Methodology
47 expert interviews, Q4 2025; applied to validate demand model assumptions, identify emerging dynamics, and assess competitive positioning
Report Format
PDF and XLSX data workbook (Word format preview document)
Publisher
Market Minds Advisory
Report Code
MMA-2026-HLT-217
Published
August 2026
Contact
sales@marketmindsadvisory.com | www.marketmindsadvisory.com

Purchase the full Next Generation Immunotherapies Market Report (2026 to 2036).

The full report delivers a complete quantitative and qualitative assessment of the global next generation immunotherapies market across all seven regions. It includes detailed country-level sizing for the fifteen largest oncology treatment markets, full profiles of all twenty companies named in the competitive landscape, and a complete database of corporate developments and clinical milestones tracked over the trailing eighteen months. Analysts provide segment-by-segment margin benchmarking derived from primary interviews with forty-seven oncology and immunotherapy experts, alongside a regulatory pathway and manufacturing capacity tracker covering major jurisdictions. Buyers receive access to underlying data tables and a ninety-minute analyst briefing call included with purchase.
Country-level sizing for fifteen major oncology treatment markets
Full profiles of all twenty companies profiled
Regulatory pathway and manufacturing capacity tracker by jurisdiction
Segment-level margin benchmarking from primary expert interviews
Eighteen-month corporate development and clinical milestone database
Ninety-minute analyst briefing call included with purchase

Built For The People Who Decide

From boardroom strategy to bench-side execution, this report is read cover-to-cover by leaders shaping the next decade of their industry, turning demand scenarios, market dynamics and valuation benchmarks into decisions.
CXOs/ Presidents/ VPs/ Managers
M&A and Corporate Development
Strategy Teams and R&D Heads
Procurement and Product Directors
Regulatory and Compliance Leaders
Investor Relations and Equity Analysts