Market Minds Advisory
Neuromarketing Solutions Market

Neuromarketing Solutions Market: Neuromarketing Solutions Market: Panel Economics, Validation Pressure and Where Measurement Actually Sells 2026 to 2036

Brands buy this to settle internal arguments, not to discover anything new. That is a smaller and more durable market than the science-led pitch implies, and the vendors who accept it price far better.

Lead Analyst

Published

September 2026

Make Smarter Decisions with Customized Research Insights

Request a free sample report and evaluate market opportunities, growth trends, and competitive dynamics relevant to your business needs.

2025 MARKET VALUE$1.9BMarket Size 2025
2036 FORECAST VALUE$7.2BBase Case , 2026 to 2036
CAGR 2026 TO 203612.6 %Bull 13.9% / Bear 11.3%
INCREMENTAL OPPORTUNITY$5.0BNet 10- year value creation
EXPANSION MULTIPLE3.27x2036 value over 2026 base
Strategic Levers
M&A Pipeline
Regional Outlook
Country Rankings
Competitive Intelligence
Segmental Deep-dive
Call-Us : 91 93563 13602

Executive Snapshot and Market Trajectory.

Brands buy neuromarketing to settle internal arguments rather than to discover anything genuinely new. That is a smaller and considerably more durable market than the science-led pitch implies, and vendors who accept it price much better than those still selling revelation. Repeat purchase runs near 48%.
The market reaches USD 2.2 billion in 2026 and USD 7.2 billion by 2036, a 3.27 times expansion at 12.6% annually. Webcam facial and attention measurement platforms grow at 18.9%, half again the market rate of 12.6%, because software-only capture removed the laboratory cost that kept this work occasional. East Asia holds 26% of spending and India compounds fastest at 20.3% on advertising volume. Concentration is unusually low.
Five providers hold 34% of spending, very low for a research category, because laboratory operators, software platforms and agency practices compete for the same budget from completely different cost structures. Nielsen, Kantar, Ipsos, Tobii and iMotions lead. Roughly 71% of purchases include normative benchmarks, because a raw score means nothing without a category distribution behind it. Panel cost per respondent decides most of the rest. Test history is the asset rather than capture technology.
Market Definition
This report covers neuromarketing solutions: measurement services and platforms that capture non-declarative consumer response for marketing decisions. It spans webcam facial and attention measurement platforms, eye tracking hardware and services, electroencephalography testing, implicit response and reaction time testing, biometric sensing services, and the analysis and normative database products built on them. It excludes conventional survey research, market mix modelling, clinical neuroscience instruments, advertising media buying, and general marketing analytics software.
Base Year Value
$1.9B in 2025 (MMA Primary Research Dataset, September 2026)
Forecast Period
2026 to 2036, eleven discrete annual values
CAGR
12.6% base case. Bull 13.9%. Bear 11.3%.
Fastest Growth Segment
Webcam Facial And Attention Measurement Platforms: 18.9% CAGR
Fastest Growth Country
India: 20.3% CAGR
Fastest Growth Region
South Asia and Pacific: 14.9% CAGR
Largest Region
East Asia: 26% of 2025 global value
Market Leaders
Nielsen, Kantar, Ipsos, Tobii and iMotions lead on neuromarketing measurement platform and services revenue. Source: MMA Analysis.
Primary Survey
n=3,800 procurement and R&D decision-makers, Q4 2025, six countries
Methodology
Demand-side build-up, cross-validated against public data, 47 expert interviews

Neuromarketing Solutions Market Forecast Scenarios

neuromarketing-solutions-market-size-forecast-scenario-1789999081848
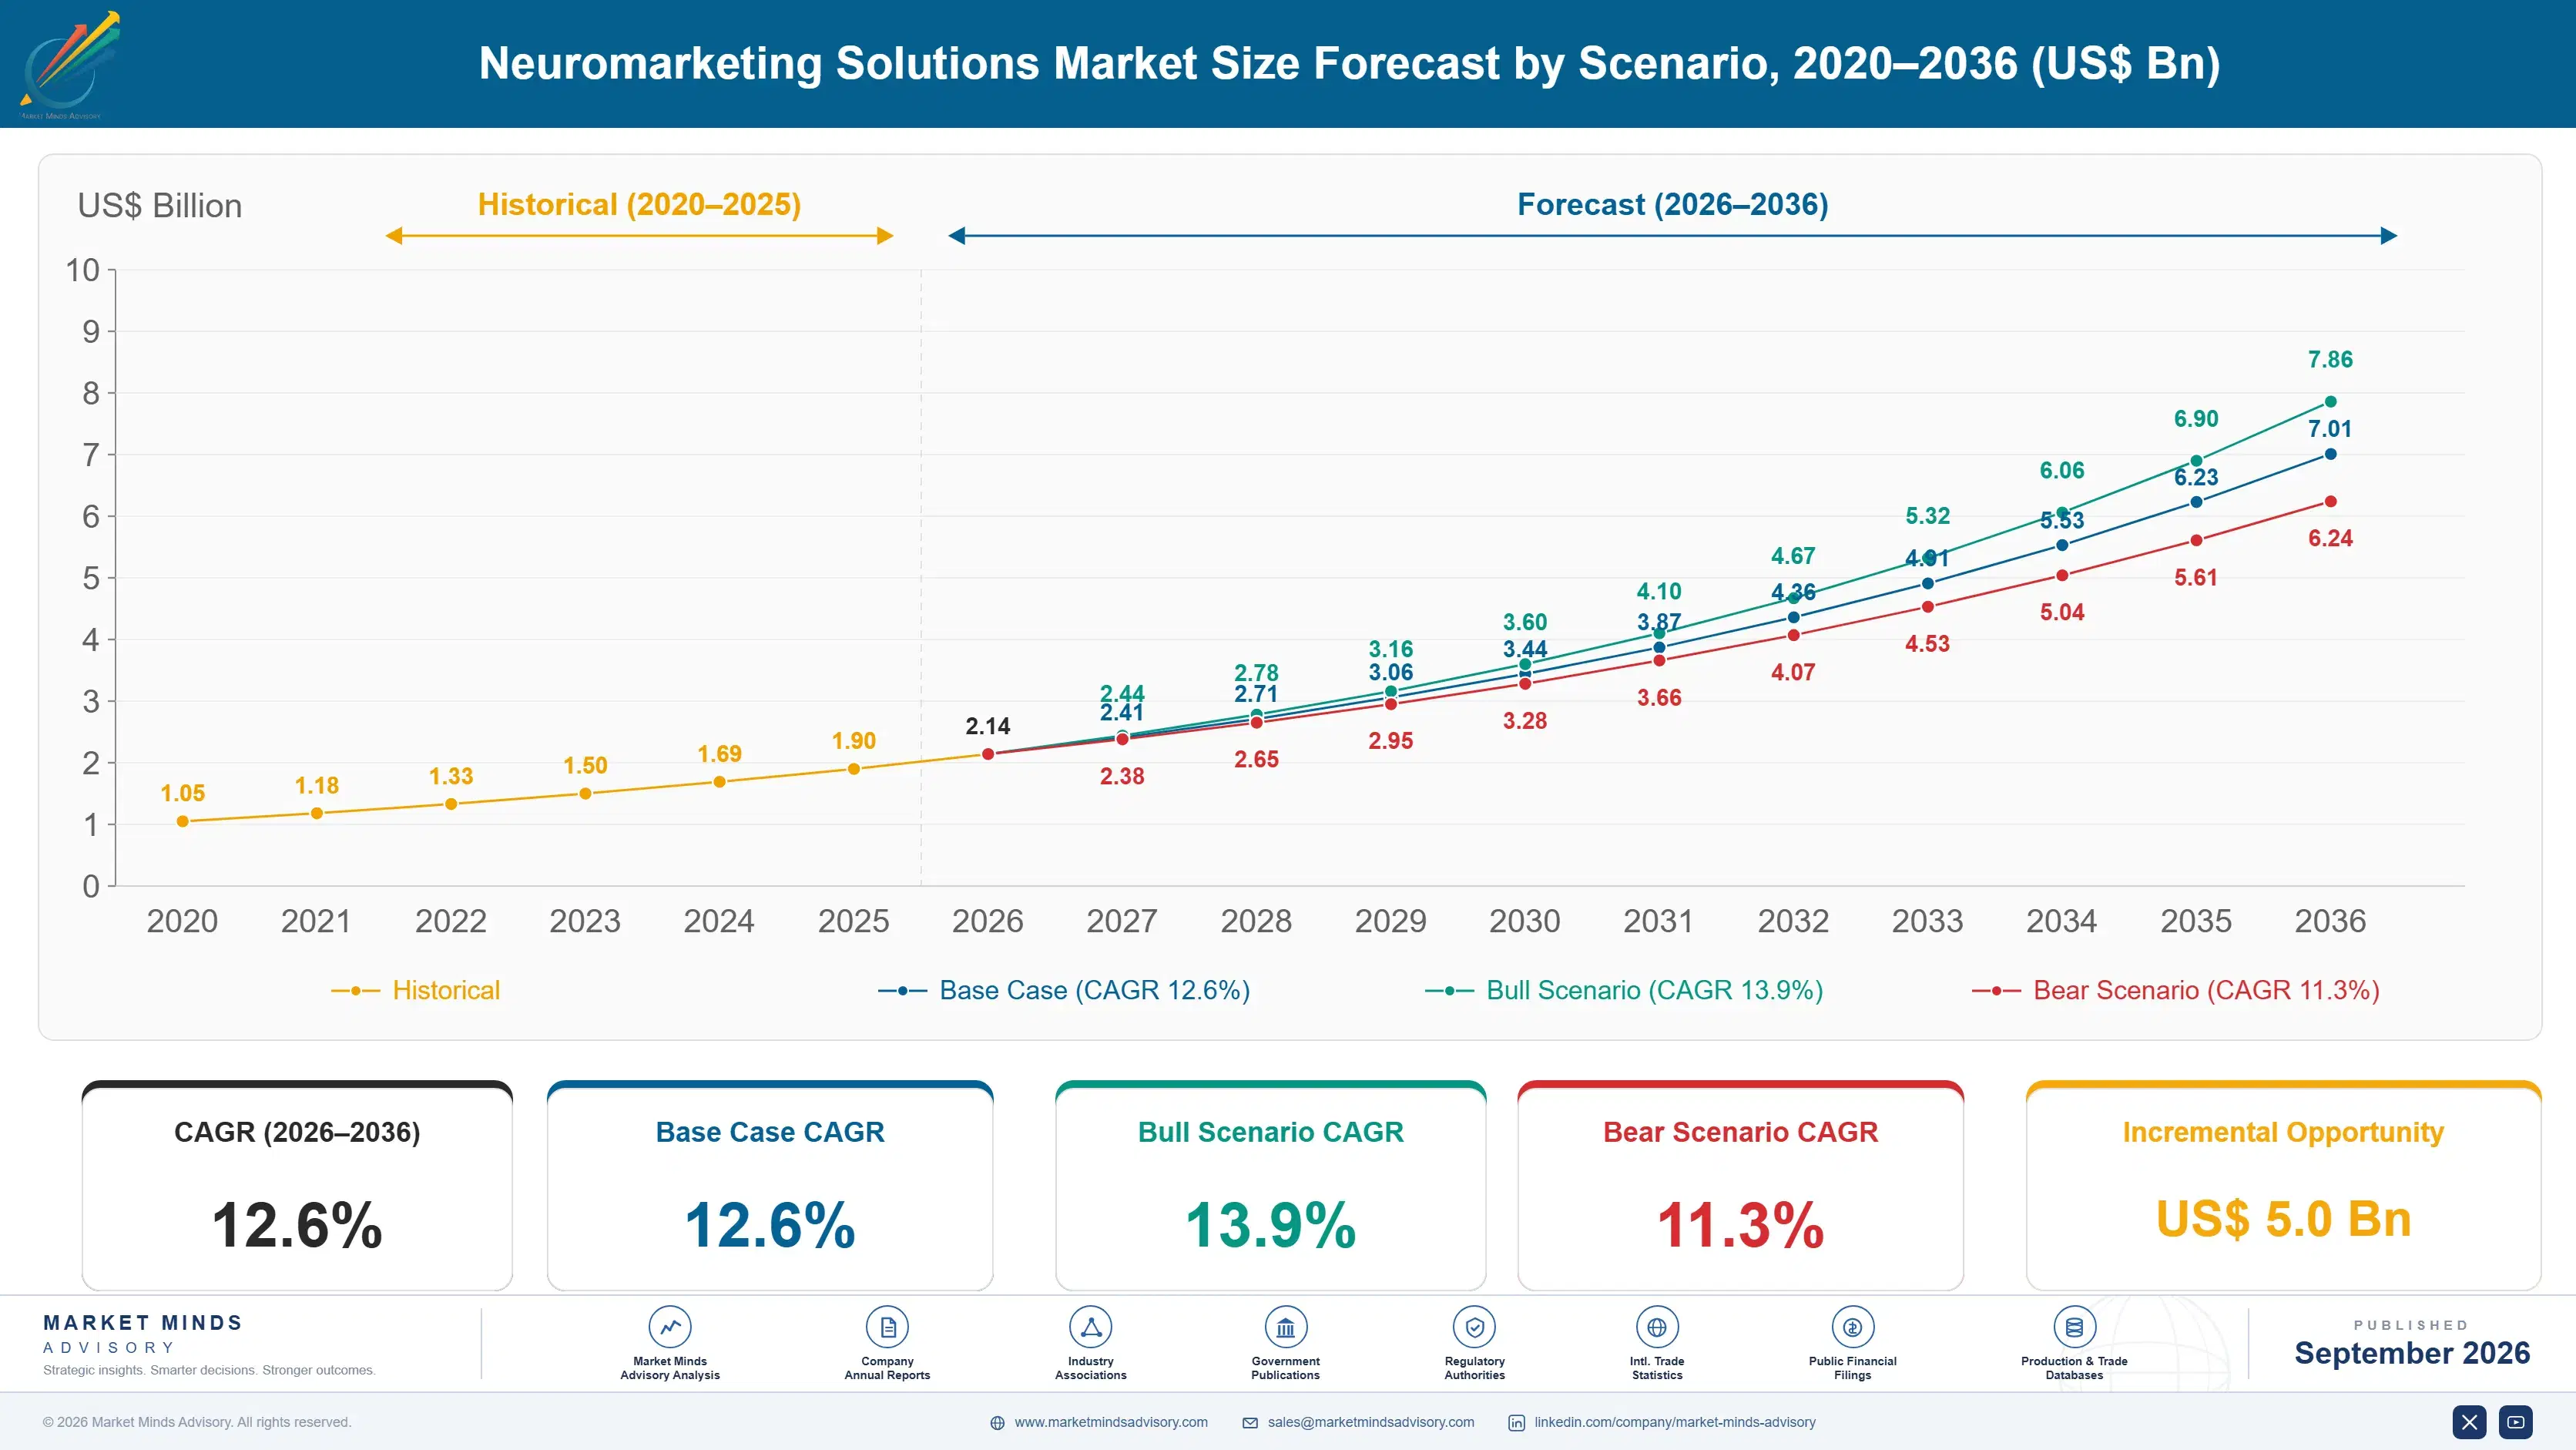
Between 2020 and 2025 the category compounded at 11.4%, and the shape of it changed completely. Laboratory testing with attached sensors was expensive enough that brands ran it once a year on a flagship campaign. Webcam capture removed the venue, the hardware and the recruitment cost, which turned an occasional exercise into something a team runs against every asset before launch.
The base case holds 12.6% on three mechanisms. Software-only capture keeps pushing cost per respondent down far enough that testing moves from annual to continuous. Normative databases keep growing more valuable than the individual test, because a score means nothing without a comparison set. And advertising volume keeps expanding fastest in markets where production budgets are small and pre-testing is therefore proportionally cheaper to justify. Those three mechanisms run largely independently of one another.
The bull case at 13.9% assumes measurement becomes embedded in creative production workflows rather than sitting as a separate research step, which would change purchase frequency entirely. The bear case at 11.3% is validation pressure, where marketing effectiveness bodies conclude the predictive claims are weaker than advertised and procurement reclassifies this as discretionary spending rather than as decision infrastructure.

Testing Settles Arguments, Not Science

Almost nobody buys this to learn something surprising. Brand teams buy it because two senior people disagree about a creative execution and somebody needs a number that is not another opinion. That is narrower than the science-led pitch suggests and considerably more durable, since disagreement is permanent. Repeat purchase runs near 48% within a year, which fits the argument-settling use far better than a discovery narrative would.
TOP FIVE CONCENTRATION34%Very low, reflecting laboratories competing against software platforms directly
WEBCAM CAPTURE SHARE57%Tests now run through software capture rather than physical laboratories
COST PER RESPONDENT FALL84%Decline in testing cost per participant across the past decade
NORMATIVE DATABASE ATTACH71%Purchases including comparison benchmarks alongside the measurement itself
PRE-LAUNCH TESTING RATE29%Advertising assets tested before launch rather than after release
REPEAT PURCHASE RATE48%Buyers commissioning further work within the following twelve months
Cost is what changed the category rather than the neuroscience. Testing cost per respondent fell roughly 84% across a decade as webcam capture removed venues, hardware and recruitment overhead, and around 57% of tests now run through software rather than in laboratories. That shift moved buying from an annual flagship exercise to something a team can run against every asset. Webcam facial and attention measurement platforms grow at 18.9% against 12.6% for the market.
The comparison set is worth more than the measurement. Roughly 71% of purchases include normative benchmarks, because a raw attention score tells a brand team nothing without a category distribution to place it against. Accumulated test history is therefore the real asset, which is why concentration sits at 34% while normative holders keep winning.
"The honest version of this business is that it produces a defensible number for a meeting where two directors disagree. Vendors who say that plainly close faster than the ones promising to reveal the subconscious, and they get invited back because the meeting happens again next quarter."
Director, Consumer Insight and Measurement Technology Practice · MMA Technology Practice · September 2026

Market Trends

Software Capture Replaced The Laboratory Entirely

Around 57% of tests now run through webcam capture rather than in physical laboratories, and cost per respondent fell roughly 84% across a decade as venues, hardware and recruitment overhead disappeared from the model. That converted an annual flagship exercise into something a brand team can run against every asset before launch. Webcam facial and attention measurement platforms grow at 18.9% against 12.6% for the market, and laboratory operators are competing against a cost base they cannot reach at all. Providers built around venue and hardware overhead are defending a model customers abandoned.
Market Impact: Repeat purchase runs near 48%

Normative Databases Outvalue The Individual Test

Roughly 71% of purchases now include normative benchmarks, because an attention or emotional response score means nothing to a brand team without a category distribution to place it against. That makes accumulated test history the genuine asset in this category rather than any capture technology, which is widely available. Providers entering with better measurement and no comparison set find themselves selling a number nobody can interpret, and buyers work that out during the first evaluation. History compounds with every study run and cannot be acquired any other way. The deepest holders keep the accounts carrying real budget.
Market Impact: India compounds at 20.3% yearly

Market Opportunities and Growth Drivers

Internal Disagreement Creates Permanent Repeat Demand

Brand teams commission this work to settle arguments about creative executions rather than to discover anything unexpected, and repeat purchase runs near 48% within twelve months because those arguments recur every campaign cycle. That is a narrower purpose than the science-led pitch suggests and a far more durable one. Vendors who name it plainly close faster and get invited back, while those promising revelation are judged against a standard the measurement cannot actually meet. Framing the purpose honestly also survives validation pressure considerably better than any predictive claim does. Honesty is the safer position here.
Market Impact: Only 29% test before launch

Advertising Volume Growth Concentrates In Cheaper Markets

India compounds at 20.3%, ahead of every other market, because advertising production volume is expanding quickly while individual production budgets stay small enough that pre-testing looks proportionally cheap against them. Only around 29% of assets are tested before launch globally, so headroom is considerable in markets adding campaigns fastest. Webcam capture is what makes that arithmetic work, since laboratory pricing would never have justified testing at those production budget levels. Testing at those budget levels was simply not possible when the work required a venue, dedicated hardware and recruited respondents attending in person.
Market Impact: Webcam capture covers 57% of tests

Market Restraints and Challenges

Validation Pressure Threatens The Category Premise

Marketing effectiveness bodies keep questioning whether non-declarative measures predict commercial outcomes better than simpler methods, and procurement notices when they do. The root cause is that published validation evidence is thinner than vendor claims imply and comes largely from the vendors themselves. Commercially this risks reclassification from decision infrastructure to discretionary research. Mitigation runs through independent validation studies, through outcome linkage against sales data, and through positioning around decision speed rather than predictive accuracy. Providers who never claimed predictive accuracy carry considerably less exposure to this than those who built their entire positioning around it.
Market Impact: Cost per respondent fell 84%

Privacy Rules Constrain Facial Capture Deployment

Biometric and facial data rules restrict webcam capture in several jurisdictions and require consent handling that adds friction to panel recruitment. The root cause is that facial response data is classified as biometric under multiple regimes regardless of how briefly it is processed. Commercially this raises panel cost in affected markets. Mitigation runs through on-device processing that never transmits imagery, through implicit reaction time testing needing no capture, and through jurisdictional panel routing. Method diversity has become a deployment requirement rather than a research preference, and providers holding only facial capture cannot serve the restricted markets at all.
Market Impact: Some 71% buy normative benchmarks
4 additional market trends, 3 additional growth drivers, and 2 additional restraints and challenges are covered in the full report. Contact sales@marketmindsadvisory.com to access the complete intelligence.

Segment CAGR and Growth Architecture

Segmentation follows measurement method, since each carries quite different cost per respondent, regulatory exposure and normative data requirements. Six methods cover the market: webcam facial and attention platforms, implicit response testing, eye tracking, electroencephalography, biometric sensing services, and normative analysis products. Buyer type and commercial route are separate dimensions handled elsewhere in this report.
neuromarketing-solutions-market-market-share-analysis-1789999082439

Webcam Facial And Attention Measurement Platforms

Webcam facial and attention measurement platforms grow at 18.9%, half again the market rate of 12.6%, because software-only capture removed the venue, hardware and recruitment overhead that kept this work occasional and expensive. Cost per respondent fell roughly 84% across a decade, and around 57% of tests now run this way rather than in laboratories. The constraint here is regulatory rather than technical: facial response data is classified as biometric in several jurisdictions, which raises panel cost and pushes providers toward on-device processing that never transmits imagery at all. Providers whose economics rest on venues and dedicated hardware cannot reach this cost base. Laboratory operators keep losing volume testing while retaining the flagship studies that still justify their pricing.
CAGR 18.9%

Implicit Response And Reaction Time Testing

Implicit response and reaction time testing compounds at 16.4% because it captures non-declarative response without recording anything classified as biometric, which sidesteps the regulatory friction constraining facial capture in several jurisdictions. It also runs on any device and needs no calibration, so panel recruitment costs less and reaches populations that webcam testing cannot. The method is less visually persuasive in a client presentation than a facial response heatmap, which is a genuine commercial disadvantage in a category bought largely to settle internal arguments. Stimulus design validity rather than any capture technology decides which providers produce results buyers will act on, and that expertise is scarcer than the software. Buyers work that out slowly.
CAGR 16.4%
Full segment breakdown across 6 segments available in the complete report.

Regional Architecture and Country Demand Map

East Asia holds 26% of spending, the largest regional share, because advertising production volume and consumer goods marketing budgets are both concentrated there at scale. North America follows at 25% on established research buying and normative database depth. India compounds fastest at 20.3% on rapid advertising production volume growth.

East Asia

East Asia takes 26% of spending, the largest regional share, because advertising production volume and consumer goods marketing budgets both sit here at a scale no other region matches. Chinese and Japanese brand teams commission testing at campaign frequency rather than annually, which suits webcam capture economics precisely. South Korean beauty and consumer electronics marketing generates unusually dense testing demand relative to market size. Growth at 13.7% runs above the global rate on production volume rather than on any increase in testing sophistication. Normative data specific to regional categories remains thinner than in North America, which is the constraint on what providers can charge for benchmark attachment across the region.
Share: 26% | CAGR: 13.7% (2026 to 2036)

North America

North America accounts for 25% of spending, where the deepest normative databases sit and where roughly 71% attachment of benchmark data to purchases is most pronounced. Nielsen, Kantar and Ipsos all operate substantial practices from here, and their accumulated test history is what defends position rather than any measurement capability. Validation pressure from marketing effectiveness bodies is also strongest here, which cuts both ways commercially. Growth at 13.2% sits above the global rate on testing frequency rather than new buyer adoption. Continuous per-asset testing has replaced flagship annual studies faster here than anywhere else, which suits software providers and squeezes agency practices priced on analyst time. Benchmark depth is what defends premium pricing here.
Share: 25% | CAGR: 13.2% (2026 to 2036)
Regional intelligence for 5 additional markets available in the complete report: Western Europe, South Asia and Pacific, Latin America, Middle East and Africa, Eastern Europe. Contact sales@marketmindsadvisory.com.
neuromarketing-solutions-market-country-cagr-analysis-1789999082963

Where Measurement Budgets Are Won

Buyers commission this to settle internal arguments rather than to discover anything, normative history is worth more than the measurement itself, and software capture has collapsed the cost that once made testing occasional. The four levers below follow those conditions rather than any argument about neuroscience. Each addresses a commercial condition rather than a methodological one.

Name The Argument-Settling Purpose Openly To Buyers

Repeat purchase runs near 48% within twelve months because creative disagreements recur every campaign cycle, not because buyers keep discovering new things. Vendors who describe the purpose plainly close faster and get invited back, while those promising to reveal the subconscious are judged against a standard no measurement here can meet. The honest framing also survives validation pressure considerably better, since it never claimed predictive accuracy that published evidence does not support. Only around 29% of assets are tested before launch, so the room inside existing accounts is considerable. Honesty also travels well internally.
Market Impact: Repeat purchase now runs near 48% every year

Build Normative History Before Selling Capability

Roughly 71% of purchases include benchmark data because a raw score means nothing without a category distribution behind it. Providers entering with better measurement and no comparison set are selling a number nobody can interpret, and buyers discover that during evaluation rather than afterwards. Accumulated test history is the durable asset here, which is why concentration sits at only 34% and yet the deepest normative holders keep winning the deals that carry real budget. History compounds with every study and cannot be bought. Concentration at 34% understates how firmly the deepest normative holders hold their accounts.
Market Impact: Fully 71% of buyers now require normative benchmarks

Price For Continuous Testing Not Annual Studies

Cost per respondent fell roughly 84% across a decade, which moved buying from one flagship study a year to testing against every asset before launch. Providers still pricing as project research are quoting against a purchase pattern their customers abandoned. Subscription and volume pricing matches how brand teams now work, and only around 29% of assets are currently tested before launch, so the headroom inside existing accounts is considerable. Cost per respondent falling 84% is what made that pattern possible, and providers who did not reprice are quoting studies against budgets meant for programmes.
Market Impact: Only 29% of all assets are currently tested

Offer Methods That Need No Biometric Capture

Facial response data is classified as biometric across several jurisdictions, which raises panel cost and blocks deployment outright in some markets. Implicit reaction time testing captures non-declarative response without recording anything regulated, runs on any device and needs no calibration at all. Providers holding only facial capture are constrained precisely where regulation is tightening, and around 57% of their testing model depends on a method that regulators keep examining. Method diversity is now a market access requirement rather than a research preference, and buyers in restricted jurisdictions ask about it first.
Market Impact: Webcam capture now covers fully 57% of tests

Who Controls the Margin Pool

Five providers hold 34% of neuromarketing spending, very low for a research category, because laboratory operators, software platforms and agency practices compete for the same budget from completely different cost structures. Nielsen, Kantar, Ipsos, Tobii and iMotions lead. All participants are assessed on neuromarketing measurement platform and services revenue rather than on broader research or hardware businesses they also run. Concentration has stayed low for a decade and shows no sign of consolidating.
Competition runs on normative database depth and panel cost per respondent far more than on measurement capability, which is widely available and improving everywhere. The second dimension is regulatory coverage, because facial capture is restricted in several jurisdictions and providers holding only that method cannot deploy where implicit testing competitors can. Measurement capability competes a distant third.

Pressure is emerging from creative production platforms embedding lightweight measurement directly into workflows, which removes the separate research purchase rather than competing for it. Rankings shift where advertising volume grows fastest and where biometric rules tighten, particularly across India, East Asia and Western Europe. Providers priced on analyst time are the most exposed to embedded measurement taking routine work away from them.
neuromarketing-solutions-market-company-positioning-matrix-1789999083521

Competitive Moat and Risk Dimensions

NIELSEN

Moat: Normative Database Depth

Nielsen holds accumulated test history across categories and markets that no entrant can assemble quickly, and roughly 71% of purchases include benchmark data precisely because a raw score is uninterpretable without it. That history compounds with every study run. Competitors with better capture technology and no comparison set are selling a number the buyer cannot place against anything.
NIELSEN

Risk: Laboratory Cost Structure

Normative depth was built through laboratory and panel operations carrying cost structures that software-only competitors do not have at all. Cost per respondent fell roughly 84% across a decade, and around 57% of tests now run through webcam capture. Benchmark depth defends the premium end while volume testing moves toward providers with far lower marginal cost per study.
TOBII

Moat: Eye Tracking Precision

Tobii holds eye tracking measurement precision that webcam capture approximates rather than matches, which retains value for shelf testing, packaging and physical retail research where accuracy genuinely matters. Those applications resist software substitution better than advertising asset testing does. The hardware position also supports academic and clinical adjacencies that pure marketing platforms cannot address at all.
TOBII

Risk: Hardware Dependence Exposure

Precision requiring dedicated hardware sits on the wrong side of a cost decline that removed roughly 84% of testing cost per respondent through software capture. Buyers accepting approximate measurement at a fraction of the price are the growth in this market. Hardware precision defends applications that matter commercially but represent a shrinking share of total testing volume.

Players Tracked

Prominent Players

Nielsen
Kantar
Ipsos
Tobii
iMotions

Other Key Players

Affectiva
Realeyes
Neurons
Sticky
EyeSee
Brainsigns
Neuro-Insight
SmartEye
Bitbrain
Emotiv
MindProber
Sensum
Noldus Information Technology
Gorilla Experiment Builder
Behavioral Signals

Recent Developments

MAY 2025

Effectiveness Bodies Question Predictive Validation Evidence

Marketing effectiveness bodies published assessments questioning whether non-declarative measures predict commercial outcomes better than simpler methods, an evidence development rather than any corporate transaction. Published validation comes largely from vendors themselves, and procurement functions have begun reclassifying this work as discretionary research rather than as decision infrastructure.
Signal: Vendors claiming predictive accuracy are now being judged against evidence that those same vendors produced themselves.
NOVEMBER 2024

Biometric Rules Restrict Facial Capture In Further Jurisdictions

Additional jurisdictions classified facial response data as biometric regardless of processing duration, a regulatory development rather than any corporate event. That raises panel cost and consent friction where around 57% of testing currently depends on webcam capture, pushing providers toward on-device processing and implicit response methods needing no recording.
Signal: Method diversity has become a market access requirement rather than a research preference for every provider.
AUGUST 2025

Creative Platforms Embed Lightweight Attention Measurement

Creative production platforms began embedding lightweight attention measurement directly into asset workflows, a capability development rather than any acquisition or partnership. That removes the separate research purchase for routine assets rather than competing on price, while leaving benchmark-dependent decisions with providers holding accumulated normative history.
Signal: Embedded measurement takes the routine testing away and leaves only decisions that genuinely need comparison sets.

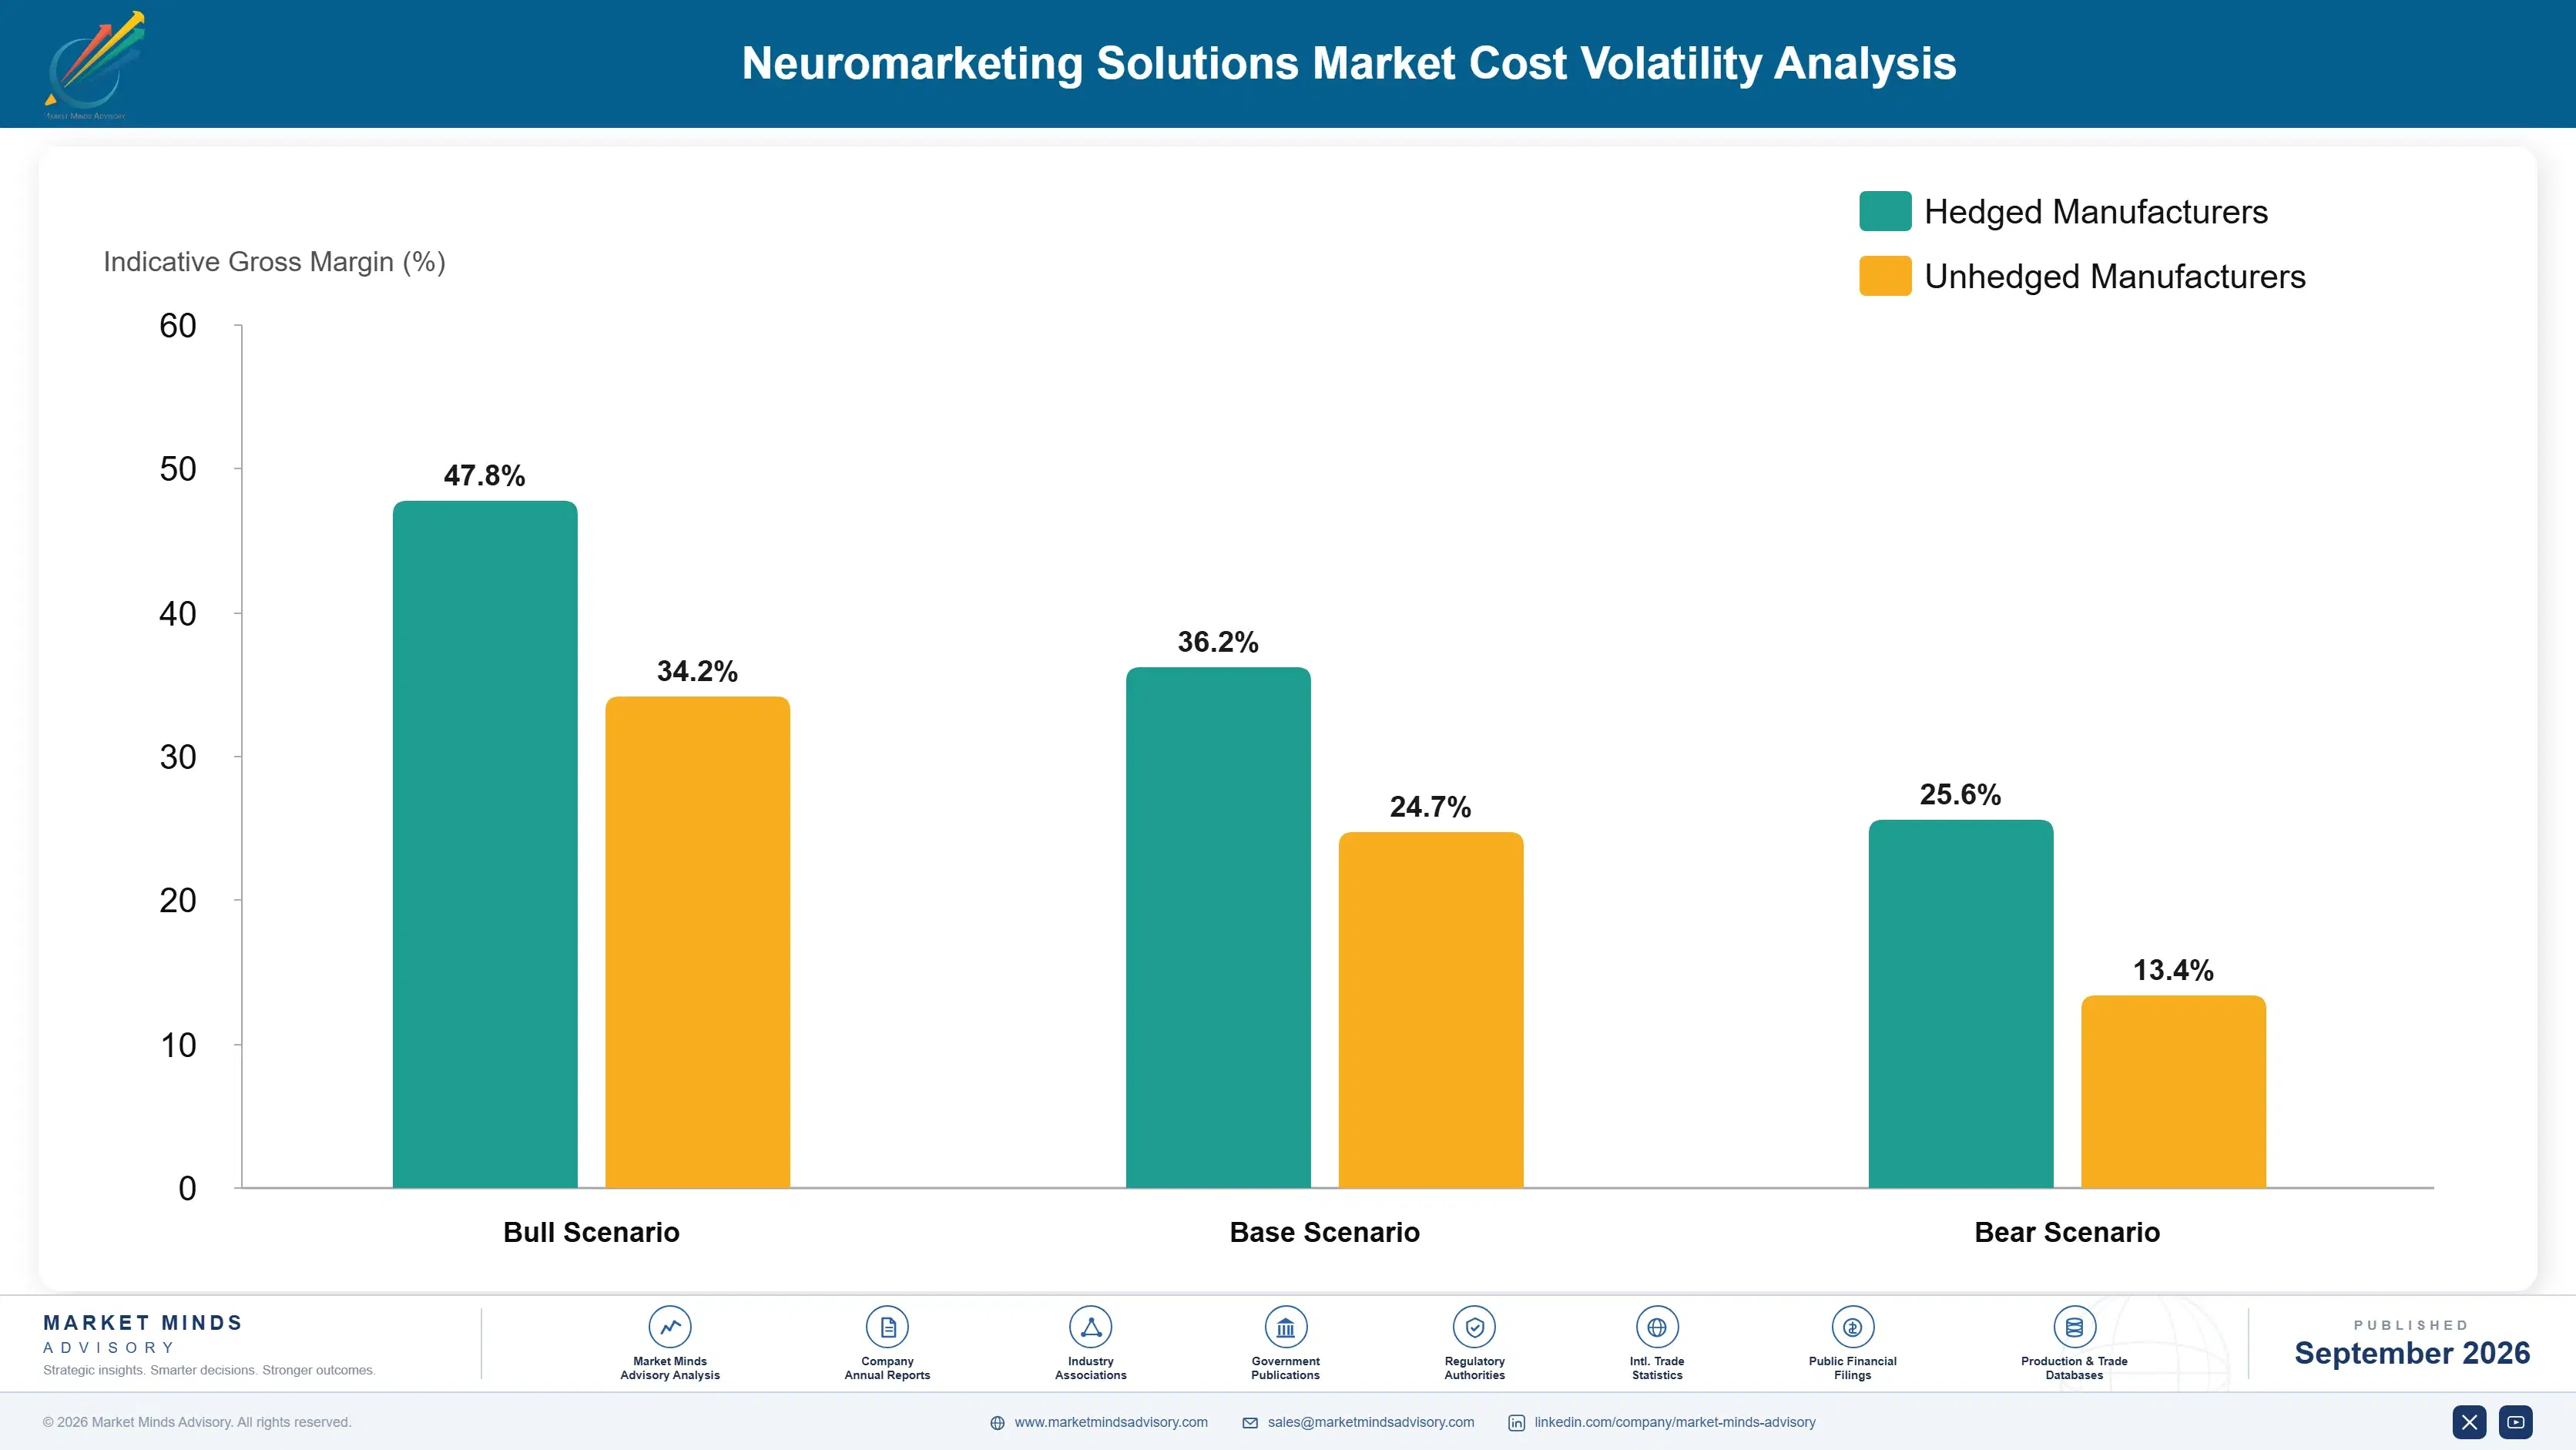
What A Test Costs To Run

Panel recruitment and respondent incentives absorb roughly 38% of provider cost, paid to panel suppliers whose pricing varies sharply by market and by demographic difficulty. Analysis and reporting labour takes around 24%, and remains stubbornly manual in a category where clients expect interpretation rather than output. Platform engineering absorbs about 17%, with consent and compliance handling taking most of the remaining balance.
Panel costs rose across several markets through 2023 and 2024 as respondent supply tightened and consent requirements lengthened recruitment for facial capture studies specifically. Nielsen Annual Report 2024 and Ipsos Annual Report 2024 both record panel access and data protection compliance among principal operating variables. Providers running proprietary panels absorbed considerably less of that increase than those buying respondents on the open market did. Fielding times lengthened in the affected markets.

The competitive disadvantage mechanism is analysis labour rather than panel price. A provider whose reporting is largely manual carries cost that scales directly with study count, while one automating interpretation against normative data does not. Exposure concentrates among agency practices and laboratory operators, since their premium positioning depends on the analyst time that automation is precisely designed to remove from the model.
neuromarketing-solutions-market-cost-volatility-analysis-1789999083724

Automate Interpretation Against Normative Comparison Sets

Analysis and reporting labour absorbs roughly 24% of provider cost and scales directly with study count rather than staying flat. Automating interpretation against normative data converts analyst hours into product capability the client sees as faster turnaround. The constraint is normative depth rather than software, which is why providers without accumulated test history cannot pursue this route at all.

Run Proprietary Panels In High Volume Markets

Panel recruitment and incentives absorb roughly 38% of cost, and open market respondent pricing rose across several markets as supply tightened. Proprietary panels in the markets carrying most volume insulate margin and shorten fielding times. Building them is slow and justifies itself only where study volume is genuinely high, which is a smaller set of markets than most assume.

Process Facial Data On Device Without Transmission

Consent and compliance handling adds cost and recruitment friction wherever facial response data is classified as biometric, which is now several jurisdictions and rising. Processing on device and transmitting only derived measures reduces the regulatory surface considerably. The engineering investment is real, and it converts a market access problem into an ordinary product requirement that competitors without it cannot meet.

Portfolio Architecture for Margin Defence

Margin architecture separates on how much analyst time each method consumes. Electroencephalography and biometric sensing services earn least, since both require supervised sessions and heavy interpretation labour. Eye tracking sits above on hardware position and shelf testing demand. Webcam attention platforms, implicit response testing and normative analysis products earn most, because each scales across studies without adding proportional analyst hours.
The volume versus premium tension runs between continuous testing and flagship studies, which reward opposite operating models entirely. Volume requires automated interpretation and panel cost discipline at low prices per study. Premium requires analyst depth and bespoke design at prices that only major campaign decisions justify. Providers attempting both usually carry premium cost structures into volume pricing and lose money quietly on the larger half.

High-value pools concentrate in normative analysis products and in implicit response testing, and neither is reached through measurement capability. Normative products require accumulated test history that compounds only with time and study volume. Implicit testing requires validated stimulus design rather than any capture technology. Both explain why concentration sits at 34% while the deepest normative holders keep winning the decisions that carry real budget.

Volume / Commodity-Adjacent

Electroencephalography and biometric sensing services, both requiring supervised sessions and heavy interpretation labour that scales directly with study count. The twelve point spread separates providers running proprietary panels from those buying respondents on open markets at rising prices.
Gross Margin: 26% to 38%

Premium / Certified

Eye tracking hardware and services, where measurement precision retains genuine value for shelf, packaging and physical retail testing that webcam capture only approximates. The thirteen point spread tracks how much of each provider's volume is hardware-dependent against software-delivered work.
Gross Margin: 44% to 57%

Sustainability / Regulatory / Next-Generation

Webcam attention platforms, implicit response testing and normative analysis products, each scaling across studies without adding proportional analyst hours to the cost base. The sixteen point spread reflects normative depth, which compounds only with accumulated study history.
Gross Margin: 62% to 78%
neuromarketing-solutions-market-portfolio-architecture-1789999084227

High-value Sub-segments and Strategic Watch-out

Webcam Facial And Attention Measurement Platforms

Grows at 18.9% because software capture removed venue, hardware and recruitment overhead from the model entirely. The sixteen point spread reflects normative depth. Biometric classification in several jurisdictions is the constraint rather than any technical limitation. On-device processing is the route around it. Deployment is otherwise blocked.
Gross Margin: 62% to 78%

Implicit Response And Reaction Time Testing

Grows at 16.4% by capturing non-declarative response without recording anything classified as biometric anywhere. The sixteen point spread reflects stimulus design validity. Less visually persuasive in client presentations, which matters in an argument-settling purchase. Regulatory exposure is close to nil. Any device runs it without calibration.
Gross Margin: 62% to 78%

Eye Tracking Hardware And Services

Grows at 9.8% on shelf, packaging and physical retail testing where precision genuinely matters to the decision. The thirteen point spread reflects hardware dependence. Software approximation keeps taking the advertising asset testing that once justified the equipment. Physical retail work still requires the hardware. Advertising work keeps migrating away.
Gross Margin: 44% to 57%

Electroencephalography Testing Services

Grows at 4.6%, slowest of the six methods, on supervised sessions carrying costs that software capture removed elsewhere. The twelve point spread reflects panel ownership. Validation pressure falls hardest on the method making the strongest scientific claims. Supervised sessions cannot scale down. Validation pressure lands hardest here.
Gross Margin: 26% to 38%

Why Buyers Come Back

The annuity here is disagreement rather than curiosity. Brand teams commission this work when senior people differ about a creative execution and somebody needs a number that is not another opinion, and that situation recurs every campaign cycle without fail. Repeat purchase near 48% within twelve months follows directly from that. Vendors who understood that sell against a permanent condition.
Depth varies by whether the provider holds the comparison set. A buyer with three years of testing history at one provider cannot move without abandoning the benchmarks that make new scores interpretable, and roughly 71% of purchases include those benchmarks. A buyer commissioning individual studies has no such constraint and will move for price. Accumulated history converts an ordinary supplier relationship into one with genuine switching cost attached.

The buyer has changed more than the method has. A research function evaluated methodology rigour and sample design against academic standards. A brand team evaluates whether the number arrives before the creative review meeting. A procurement function evaluates cost per study against declining market rates. Providers organised entirely around the first buyer are selling to somebody who no longer approves most of this spending.
neuromarketing-solutions-market-end-use-penetration-index-1789999084736

What Wins Measurement Work

These are among the four positions where our research anticipates prominent divergence between winners and laggards over the coming forecast period. Each is grounded in the demand model, the regulatory perimeter, and the announced capacity pipeline.
01 / PURPOSE FRAMING HONESTY

Sell Argument Resolution, Not Subconscious Revelation

Brand teams commission this work to settle disagreements about creative executions rather than to discover anything genuinely unexpected, and repeat purchase near 48% within twelve months follows from arguments that recur every campaign cycle. Vendors describing that purpose plainly close faster and get invited back the following quarter. Those promising to reveal the subconscious are judged against a standard that published validation evidence does not currently support anywhere, which makes the honest framing commercially safer as well as more accurate.
02 / NORMATIVE ASSET BUILDING

Accumulate History Before Selling Measurement

Roughly 71% of purchases include normative benchmarks because a raw attention or emotional response score means nothing without a category distribution to place it against properly. Providers entering with better capture technology and no comparison set are selling a number the buyer simply cannot interpret. Accumulated test history compounds with every study and cannot be acquired quickly, which is why deep normative holders keep winning budget ahead of providers with materially better capture technology and considerably more capital behind them.
03 / CONTINUOUS PRICING DESIGN

Price Per Asset, Not Per Study

Cost per respondent fell roughly 84% across a decade, which moved buying from one flagship annual study toward testing against every asset before it launches. Providers still pricing as project research are quoting against a purchase pattern their own customers abandoned some years ago. Only around 29% of assets are tested before launch, so the expansion headroom inside existing accounts is considerable and largely unclaimed by providers still quoting flagship study pricing against budgets that were never meant for single studies.
04 / METHOD DIVERSITY COVERAGE

Hold A Method Regulators Do Not Restrict

Facial response data is classified as biometric across several jurisdictions, which raises panel cost and blocks deployment outright in some markets where clients still need testing done. Implicit reaction time testing captures non-declarative response without recording anything regulated at all. Providers holding only facial capture are constrained precisely where regulation keeps tightening, and around 57% of testing depends on that exposed method, which is a market access problem rather than a product one that no amount of measurement quality resolves.

Engagement Snapshot From the Field

A live engagement with an industry participant carrying material or product regulatory and market exposure ahead of a defining policy shift, showing how our research translates into a defensible multi-year portfolio strategy.
MARKET MINDS ADVISORY · CLIENT ENGAGEMENT SUMMARY
Neuromarketing Solutions Producer Strategic Portfolio Review and Transition Roadmap 2026·Investment Scenario on Neuromarketing Solutions Exposure Evaluation 2025-26
CLIENT PROFILE
A consumer goods advertiser running annual flagship neuromarketing studies on its largest campaigns while testing nothing else, and increasingly unable to explain what the studies had changed. Marketing leadership had approved renewal of the same programme for a fourth year, without anybody establishing which decisions the previous three years of testing had actually influenced. Nobody had traced the studies to decisions.
STRATEGIC CHALLENGE
Insight wanted deeper methodology on fewer campaigns to strengthen the evidence. Brand teams wanted faster answers on more assets and had stopped waiting for study results. Nobody had reconciled those positions, and the annual research budget was being spent on studies that arrived after the creative decisions they were meant to inform.
MMA APPROACH
MMA traced each of the previous three years of studies to the decisions they were commissioned to support, establishing whether results arrived before or after those decisions were taken. We modelled cost per asset tested under continuous pricing against the existing flagship model. Work drew on 47 expert interviews conducted in Q4 2025 alongside the advertiser's own campaign and research records.
KEY FINDINGS
  1. Around 68% of study results had arrived after the creative decision they were commissioned to inform had already been taken by brand teams.
  2. Testing 1 flagship campaign annually cost more than testing every major asset would have cost under continuous pricing from the same provider.
  3. Brand teams had stopped consulting results entirely, and 2 of 3 recent campaigns proceeded without anybody opening the study (client-reported, unverified by MMA).
  4. Normative benchmarks accumulated across the three years were the only element of the whole programme that brand teams still described as genuinely useful.
CLIENT PROFILE
A consumer goods advertiser running annual flagship neuromarketing studies on its largest campaigns while testing nothing else, and increasingly unable to explain what the studies had changed. Marketing leadership had approved renewal of the same programme for a fourth year, without anybody establishing which decisions the previous three years of testing had actually influenced. Nobody had traced the studies to decisions.
STRATEGIC CHALLENGE
Insight wanted deeper methodology on fewer campaigns to strengthen the evidence. Brand teams wanted faster answers on more assets and had stopped waiting for study results. Nobody had reconciled those positions, and the annual research budget was being spent on studies that arrived after the creative decisions they were meant to inform.
MMA APPROACH
MMA traced each of the previous three years of studies to the decisions they were commissioned to support, establishing whether results arrived before or after those decisions were taken. We modelled cost per asset tested under continuous pricing against the existing flagship model. Work drew on 47 expert interviews conducted in Q4 2025 alongside the advertiser's own campaign and research records.
KEY FINDINGS
  1. Around 68% of study results had arrived after the creative decision they were commissioned to inform had already been taken by brand teams.
  2. Testing 1 flagship campaign annually cost more than testing every major asset would have cost under continuous pricing from the same provider.
  3. Brand teams had stopped consulting results entirely, and 2 of 3 recent campaigns proceeded without anybody opening the study (client-reported, unverified by MMA).
  4. Normative benchmarks accumulated across the three years were the only element of the whole programme that brand teams still described as genuinely useful.
RECOMMENDED STRATEGY
Phase 1: Phase one: stop the flagship annual study, since results consistently arrive after the decisions they exist to inform have already been taken. Phase 2: Phase two: move to continuous per-asset testing at the same total budget, preserving the normative benchmarks that brand teams actually value. Phase 3: Phase three: set a turnaround requirement inside the creative calendar rather than a methodology requirement sitting entirely outside of it.
OUTCOME
The advertiser replaced its flagship study with continuous per-asset testing at the same annual budget (client-reported, unverified by MMA). Asset coverage rose substantially and brand teams began consulting results because they arrived before decisions. Turnaround against the creative calendar is now the contracted requirement, which is the change that outlasted the engagement.

Frequently Asked Questions

Foundational context covering the market sizes, CAGR, scope, country, region and competition that inform every finding below. This section is provided to cover basics and most often pre-purchase conversations, answered from the MMA Primary Research Dataset.

What is the current size of the Neuromarketing Solutions Market?

Global value reaches USD 2.2 billion in 2026, measured as measurement platform and services revenue across six methods. The 2025 base was USD 1.9 billion.

How large will the Neuromarketing Solutions Market be by 2036?

The market reaches USD 7.2 billion by 2036, an increase of USD 5.0 billion across the forecast period. That represents 3.27 times expansion from the 2026 base.

What is the CAGR for the Neuromarketing Solutions Market 2026 to 2036?

The base case runs at 12.6% annually, with a bull case at 13.9% if measurement embeds into creative production workflows and a bear case at 11.3% if validation pressure reclassifies the spending.

Which segment is growing fastest?

Webcam facial and attention measurement platforms grow at 18.9%, half again the market rate of 12.6%. Software capture removed the venue, hardware and recruitment cost entirely.

Who are the major companies in the Neuromarketing Solutions Market?

Nielsen, Kantar, Ipsos, Tobii and iMotions lead on measurement platform and services revenue, holding 34% between them. Affectiva and Realeyes hold smaller specialist positions in the category.

Which country is growing fastest?

India leads at 20.3%, as advertising production volume expands while individual production budgets stay small enough to make pre-testing proportionally cheap. Indonesia and Brazil follow.

Report Segmentation Architecture

The full report scope spans multiple orthogonal segmentation dimensions, with cross-tabulated demand data provided for each dimension pair. Coverage extends further to regional breakdowns, trend trajectories, and the competitive detail needed to support segment-level decision-making.

By Measurement Method

  • Webcam Facial And Attention Measurement Platforms
  • Implicit Response And Reaction Time Testing
  • Normative Analysis And Benchmark Products
  • Eye Tracking Hardware And Services
  • Biometric Sensing Services
  • Electroencephalography Testing Services

By End-Use Industry

  • Consumer Packaged Goods Brands
  • Retail And Commerce Operators
  • Media And Entertainment Companies
  • Financial Services Marketing
  • Automotive And Consumer Durables
  • Public Sector And Health Communications

By Commercial Dimension

  • Direct Advertiser Commissioning
  • Advertising Agency Procurement
  • Research Agency Subcontracting
  • Platform Subscription Licensing
  • Creative Platform Embedded Delivery
  • Academic And Institutional Licensing

By Region

  • North America
  • Western Europe
  • East Asia
  • South Asia and Pacific
  • Latin America
  • Middle East and Africa
  • Eastern Europe

Scope, Methodology, and Coverage

Every figure in this report is reproducible from documented input assumptions. The scope below maps the historical period, the forecast horizon, the segmentation dimensions, and the countries covered, alongside the underlying primary and qualitative methodology.
Historical Period
2020 to 2025
Forecast Period
2026 to 2036
Base Year
2025 (USD billions; MMA Primary Research Dataset, September 2026)
Market Definition
This report covers neuromarketing solutions: measurement services and platforms capturing non-declarative consumer response for marketing decisions, spanning webcam facial and attention measurement, eye tracking, electroencephalography, implicit response and reaction time testing, biometric sensing, and the normative analysis products built on them. It excludes conventional survey research, market mix modelling, clinical neuroscience instruments, media buying, and general marketing analytics software.
Quantitative Units
USD millions, measurement platform and services revenue basis; studies commissioned; cost per respondent trends as percentages; webcam capture share of tests; normative benchmark attachment rates; repeat purchase rates within twelve months.
Segmentation Dimensions
Measurement method; end-use industry; commercial commissioning route; geography across seven regions.
Regions Covered
North America, Western Europe, East Asia, South Asia and Pacific, Latin America, Middle East and Africa, Eastern Europe
Countries Covered
United States, Canada, United Kingdom, Germany, France, Netherlands, Spain, Italy, Poland, Czechia, China, Japan, South Korea, India, Australia, Indonesia, Brazil, Mexico, South Africa, United Arab Emirates.
Key Companies Profiled
Nielsen, Kantar, Ipsos, Tobii, iMotions, Affectiva, Realeyes, Neurons, EyeSee, SmartEye, Bitbrain, Emotiv, Noldus Information Technology, MindProber, Behavioral Signals.
Quantitative Methodology
Primary survey, n=3,800 respondents, Q4 2025, six countries; demand-side model with trade association cross-validation
Qualitative Methodology
47 expert interviews, Q4 2025; applied to validate demand model assumptions, identify emerging dynamics, and assess competitive positioning
Report Format
PDF and XLSX data workbook (Word format preview document)
Publisher
Market Minds Advisory
Report Code
MMA-2026-TEC-951
Published
September 2026
Contact
sales@marketmindsadvisory.com | www.marketmindsadvisory.com

Purchase the full Neuromarketing Solutions Market Report (2026 to 2036).

This report sizes the global neuromarketing solutions market from 2026 to 2036 across six measurement methods, six industries and seven regions. It explains why brand teams commission this work to settle internal arguments rather than to discover anything, and why that narrower purpose supports repeat purchase near 48% within twelve months. Cost per respondent falling roughly 84% through webcam capture is analysed as the change that moved buying from annual studies to continuous testing. Normative benchmark attachment at roughly 71% is examined as the real competitive asset. Regional analysis explains why East Asia holds 26% of spending.
Six measurement methods sized through to 2036
Cost per respondent decline quantified across a decade
Normative benchmark attachment analysed as competitive position
Twenty named providers assessed on measurement revenue
Four revenue levers with quantified commercial impact
Anonymised advertiser programme redesign engagement documented in full

Built For The People Who Decide

From boardroom strategy to bench-side execution, this report is read cover-to-cover by leaders shaping the next decade of their industry, turning demand scenarios, market dynamics and valuation benchmarks into decisions.
CXOs/ Presidents/ VPs/ Managers
M&A and Corporate Development
Strategy Teams and R&D Heads
Procurement and Product Directors
Regulatory and Compliance Leaders
Investor Relations and Equity Analysts