Market Minds Advisory
Neurology Services Market

Neurology Services Market: The Constraint Is Neurologists, Not Demand

A commercial reading of neurological care delivery, where diagnosed prevalence rises every year against a physician supply that expands slowly, and waiting lists rather than reimbursement now set what gets treated.

Lead Analyst

Alice Ballenger

Published

September 2026

Make Smarter Decisions with Customized Research Insights

Request a free sample report and evaluate market opportunities, growth trends, and competitive dynamics relevant to your business needs.

2025 MARKET VALUE$142.6BMarket Size 2025
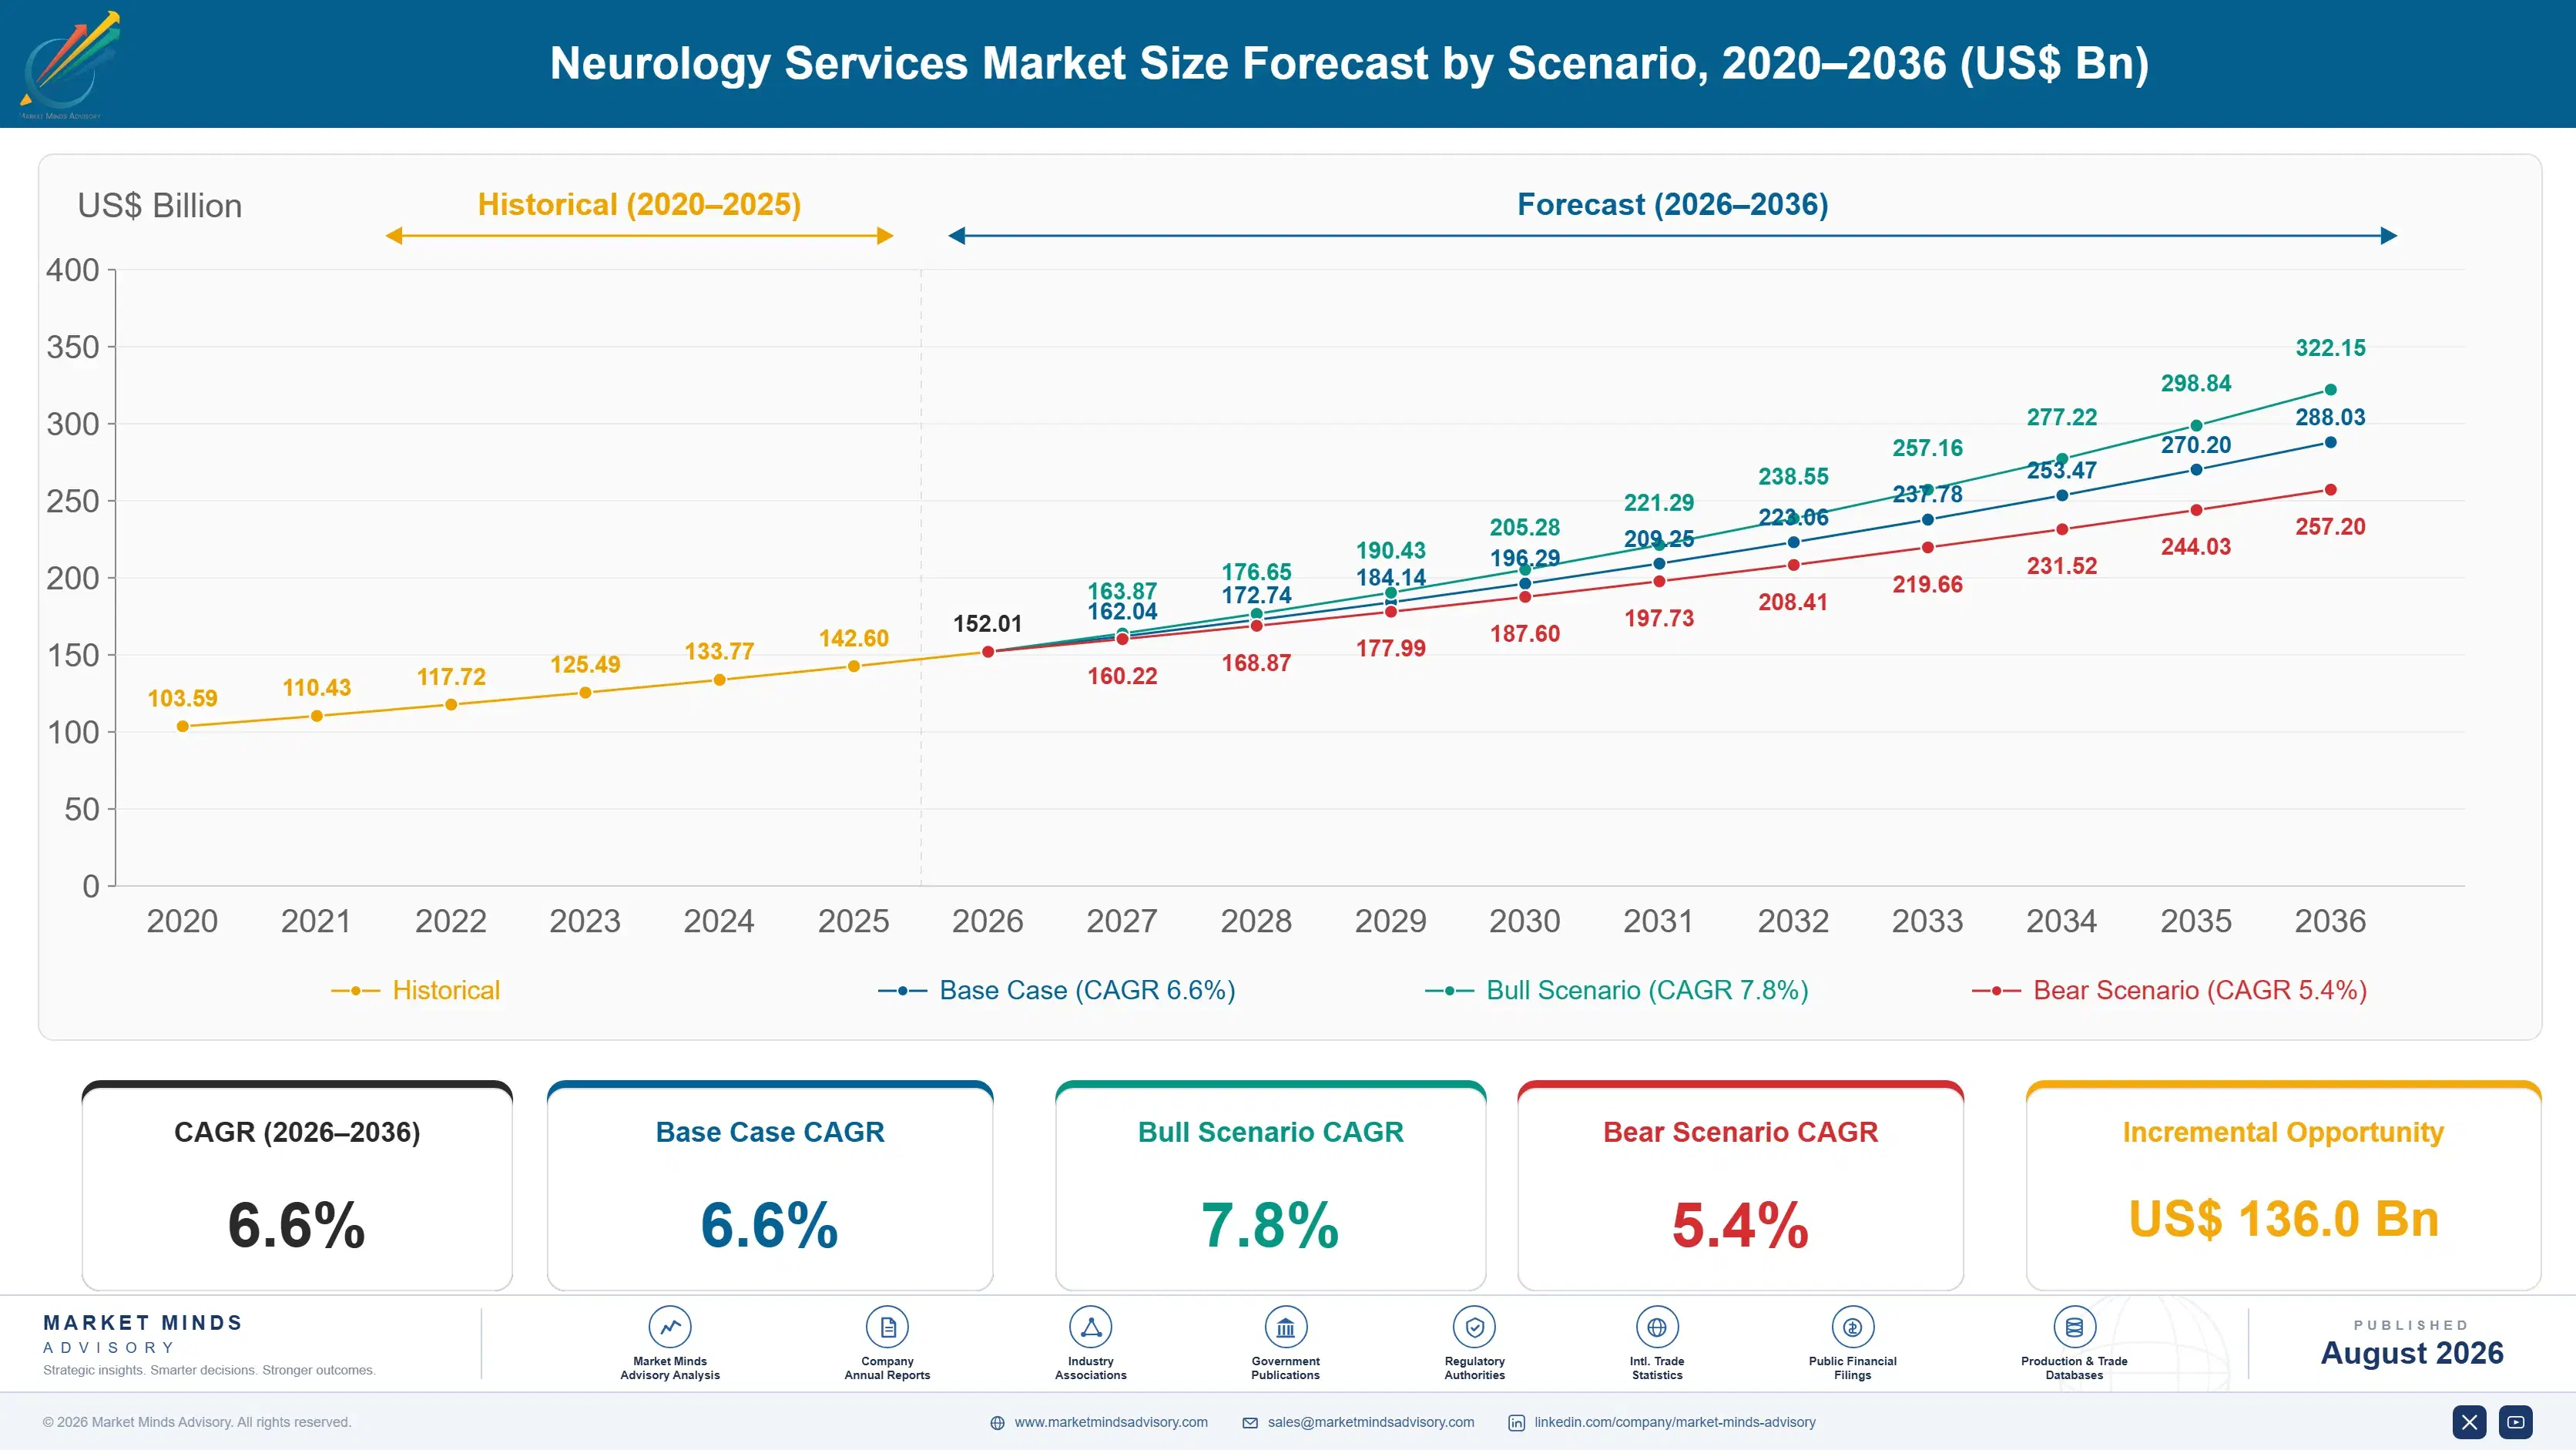
2036 FORECAST VALUE$288.1BBase Case , 2026 to 2036
CAGR 2026 TO 20366.6 %Bull 7.8% / Bear 5.4%
INCREMENTAL OPPORTUNITY$136.0BNet 10- year value creation
EXPANSION MULTIPLE1.89x2036 value over 2026 base
Strategic Levers
M&A Pipeline
Regional Outlook
Country Rankings
Competitive Intelligence
Segmental Deep-dive
Call-Us : 91 93563 13602

Executive Snapshot and Market Trajectory

Demand for neurological care is not the problem and has not been for years. There are not enough neurologists, the training pipeline takes a decade, and every new disease-modifying therapy that arrives lands on the same overloaded clinic. Access, not appetite, decides this market. Nothing else explains the market.
The market stands at USD 142.6 billion in 2025 and reaches USD 288.05 billion by 2036 at a 6.6% CAGR. Neurodegenerative disease management grows fastest at 10.4%, about 1.58 times the overall rate, as amyloid-targeting therapies convert Alzheimer's care from observation into an infusion and monitoring pathway. North America holds 32% of value on reimbursement rates and specialist density, while India posts the quickest national growth at 11.2%.
Fragmentation is almost total, with the top five holding roughly 9% of neurology service revenue across academic centres, hospital departments, and independent practices that answer to entirely different economics. Two forces pull against each other. Diagnosed prevalence keeps rising with ageing populations and better imaging, while neurologist supply grows at a fraction of that rate and burnout is pushing experienced clinicians out of clinical practice early. Retention matters more than recruitment now.
Market Definition
The neurology services market covers the clinical diagnosis, treatment, and ongoing management of disorders of the nervous system, spanning neurodegenerative disease management, epilepsy and seizure care, stroke and cerebrovascular services, headache and pain neurology, and neuromuscular and movement disorder care. Neurosurgery and interventional procedures billed as surgical services, diagnostic imaging equipment and in vitro diagnostic products, pharmaceutical and device product revenue, psychiatric and mental health services, and rehabilitation services delivered outside neurological specialty care are excluded.
Base Year Value
$142.6B in 2025 (MMA Primary Research Dataset, August 2026)
Forecast Period
2026 to 2036, eleven discrete annual values
CAGR
6.6% base case. Bull 7.8%. Bear 5.4%.
Fastest Growth Segment
Neurodegenerative Disease Management: 10.4% CAGR
Fastest Growth Country
India: 11.2% CAGR
Fastest Growth Region
South Asia and Pacific: 8.6% CAGR
Largest Region
North America: 32% of 2025 global value
Market Leaders
HCA Healthcare, Mayo Clinic, Cleveland Clinic, Fresenius Helios, Ramsay Health Care. Source: MMA Analysis based on company annual reports.
Primary Survey
n=3,800 procurement and R&D decision-makers, Q4 2025, six countries
Methodology
Demand-side build-up, cross-validated against public data, 47 expert interviews

Neurology Services Market Forecast Scenarios

neurology-services-market-size-forecast-scenario-1787332057158
Growth from 2020 to 2025 compounded near 5.5%, and deferred care rather than demand shaped the pattern. Elective neurology consultations collapsed through 2020, then ran above trend as backlogs cleared, while stroke presentations fell in ways that concerned clinicians at the time. Teleneurology moved from a marginal service to a standard one inside eighteen months. That single change did more for access than a decade of workforce planning.
Three mechanisms carry the base case to 6.6%. First, diagnosed prevalence, since ageing populations and wider imaging access keep converting undiagnosed neurological disease into managed patients. Second, disease-modifying therapy pathways, where new Alzheimer's and neuromuscular treatments require infusion, monitoring, and imaging surveillance that did not previously exist. Third, teleneurology and extended practice models, which stretch a fixed neurologist supply across more patients rather than waiting for a training pipeline that will not deliver.
The bull case at 7.8% assumes disease-modifying therapy uptake accelerates and extended practice models take hold widely, which would convert latent demand into billed activity. The bear case at 5.4% assumes neurologist shortages bind harder than expected, payers restrict amyloid therapy coverage further, and waiting lists in publicly funded systems simply lengthen rather than resolving into treated volume.

A Physician Shortage Wearing A Market's Clothes

Demand rests on three foundations. Diagnosed prevalence provides the volume, since ageing populations and wider imaging keep finding disease that previously went unnamed. Therapy availability provides the value growth, because a condition with disease-modifying treatment generates infusion, monitoring, and imaging activity observation never did. And specialist supply provides the ceiling, since neurologist numbers are fixed and no way exists to add more inside a decade.
MARKET CONCENTRATIONCR5: 9%Among the most fragmented service markets in specialty healthcare
NEUROLOGISTS PER POPULATION1 to 4Specialists per hundred thousand people across developed markets
NEW PATIENT WAIT TIME6 to 30 weeksTypical delay for a first specialist consultation appointment
TELENEUROLOGY SHAREAbout 23%Consultations delivered remotely rather than in person today
PHYSICIAN COST SHAREAbout 54%Specialist compensation as a portion of service delivery cost
TRAINING PIPELINE LENGTH10 to 13 yearsTime from medical school entry to independent specialist practice
Commercially the striking feature is that the binding constraint is a person. Physician compensation is roughly 54% of delivery cost, and the training pipeline runs 10 to 13 years from medical school entry, so capacity cannot be bought at any price short term. New patient waits of six to 30 weeks are the result. Every service model that works stretches existing clinicians rather than adding new.
The decade ahead turns on how much of the workload can move away from the neurologist. Teleneurology already handles about 23% of consultations and removes travel rather than clinician time. Advanced practice providers, nurse-led monitoring, and remote data review shift genuine workload. Neurodegenerative management at 10.4% growth is where pressure concentrates, because amyloid therapies bring surveillance that consumes the scarcest resource in the system.
"Every business case in neurology assumes you can hire the neurologist. You cannot, and you will not be able to in 2036 either. The organisations that grow are the ones designing a service around that fact instead of treating it as a recruitment problem somebody else will fix."
Director, Specialty Care Services and Clinical Workforce Practice · MMA Healthca

Market Trends

Amyloid Therapies Convert Observation Into Managed Pathways

Alzheimer's care was for decades a diagnosis followed by supportive management and very little billable activity. Amyloid-targeting therapies changed that entirely, since eligibility requires biomarker confirmation, treatment requires regular infusion, and safety monitoring requires scheduled imaging for oedema and haemorrhage. Each treated patient now generates a pathway of appointments, scans, and reviews that did not previously exist. The bottleneck is neither drug supply nor patient willingness but infusion capacity and neurologist time for the monitoring reviews, which is why uptake has trailed approval by years. Approval created the pathway; capacity decides the volume.
Market Impact: Prevalence doubles every 5 years
Teleneurology Becomes Standard Rather Than Marginal Service

Remote consultation moved from a curiosity to roughly 23% of neurology contacts inside eighteen months during the pandemic, and it has not retreated because neurology suits it unusually well. Much of a follow-up appointment is history taking and medication review rather than physical examination, and the patients least able to travel are frequently the ones with movement disorders and epilepsy. The gain is access and geographic reach rather than clinician productivity, since a remote consultation consumes the same physician hour as an in-person one does. Access improves while clinician capacity stays exactly the same.
Market Impact: Redesign lifts throughput about 30%

Market Opportunities and Growth Drivers

Ageing Populations Convert Prevalence Into Diagnosed Patients

Dementia, Parkinson's disease, stroke, and peripheral neuropathy all rise sharply with age, and the population over seventy-five is growing in every developed market and most middle-income ones. Wider access to imaging finds disease that previously went unnamed, which converts prevalence into diagnosed patients who then require ongoing management rather than a single episode. This is the most predictable demand in specialty medicine because it depends on demography rather than policy or clinical fashion. Nothing about the trend is cyclical and nothing about it reverses. Demography rather than policy drives every part of it.
Market Impact: Training runs 10 to 13 years

Extended Practice Models Stretch A Fixed Specialist Supply

Advanced practice providers, specialist nurses, and pharmacist-led medication reviews take genuine workload off the neurologist rather than simply relocating it, which is the only lever that increases capacity inside a decade. Nurse-led epilepsy clinics, remote seizure diary review, and protocol-driven infusion monitoring all operate without a physician present for routine cases. Organisations that redesign the pathway around who must be involved treat considerably more patients per neurologist. Those that treat the shortage as a recruitment problem simply wait alongside everybody else recruiting from the same pool. The lever is organisational rather than financial.
Market Impact: Criteria exclude 60% of patients

Market Restraints and Challenges

Neurologist Supply Cannot Expand Inside A Decade

Developed markets run one to four neurologists per hundred thousand people, and training a replacement takes 10 to 13 years from medical school entry, which makes capacity fixed on any commercial planning horizon. The root cause is a training pipeline whose length nobody can compress and residency places funded on budgets set years in advance. Commercially this caps volume regardless of demand or reimbursement. Participants mitigate through extended practice models, teleneurology reach, protocol-driven pathways that remove routine cases, and retention programmes aimed squarely at burnout. Compensation escalation follows without adding any capacity.
Market Impact: Monitoring adds 5 imaging studies

Payer Restriction Limits Disease-Modifying Therapy Pathways

Amyloid-targeting treatments and several neuromuscular therapies arrive with high acquisition costs and demanding monitoring requirements, and payers have responded with restrictive eligibility criteria, prior authorisation, and registry participation conditions. The root cause is uncertainty about magnitude of clinical benefit against very substantial total pathway cost. Commercially this leaves centres with infusion capacity they cannot fill and eligible patients they cannot treat. Providers mitigate through registry data collection, biomarker pathway investment that shortens eligibility confirmation, and outcome agreements negotiated directly with payers. Infusion chairs stand idle while patients who would qualify keep waiting.
Market Impact: Remote handles 23% of consultations
4 additional market trends, 3 additional growth drivers, and 2 additional restraints and challenges are covered in the full report. Contact sales@marketmindsadvisory.com to access the complete intelligence.

Segment CAGR and Growth Architecture

Segmentation follows clinical condition group, a single classification describing the neurological disorder family being managed. Each group carries its own care pathway, workforce requirement, therapy availability, and reimbursement basis, so commercial economics track the condition rather than the setting delivering care. End-use setting and payer channel appear separately within the framework as their own distinct dimensions.
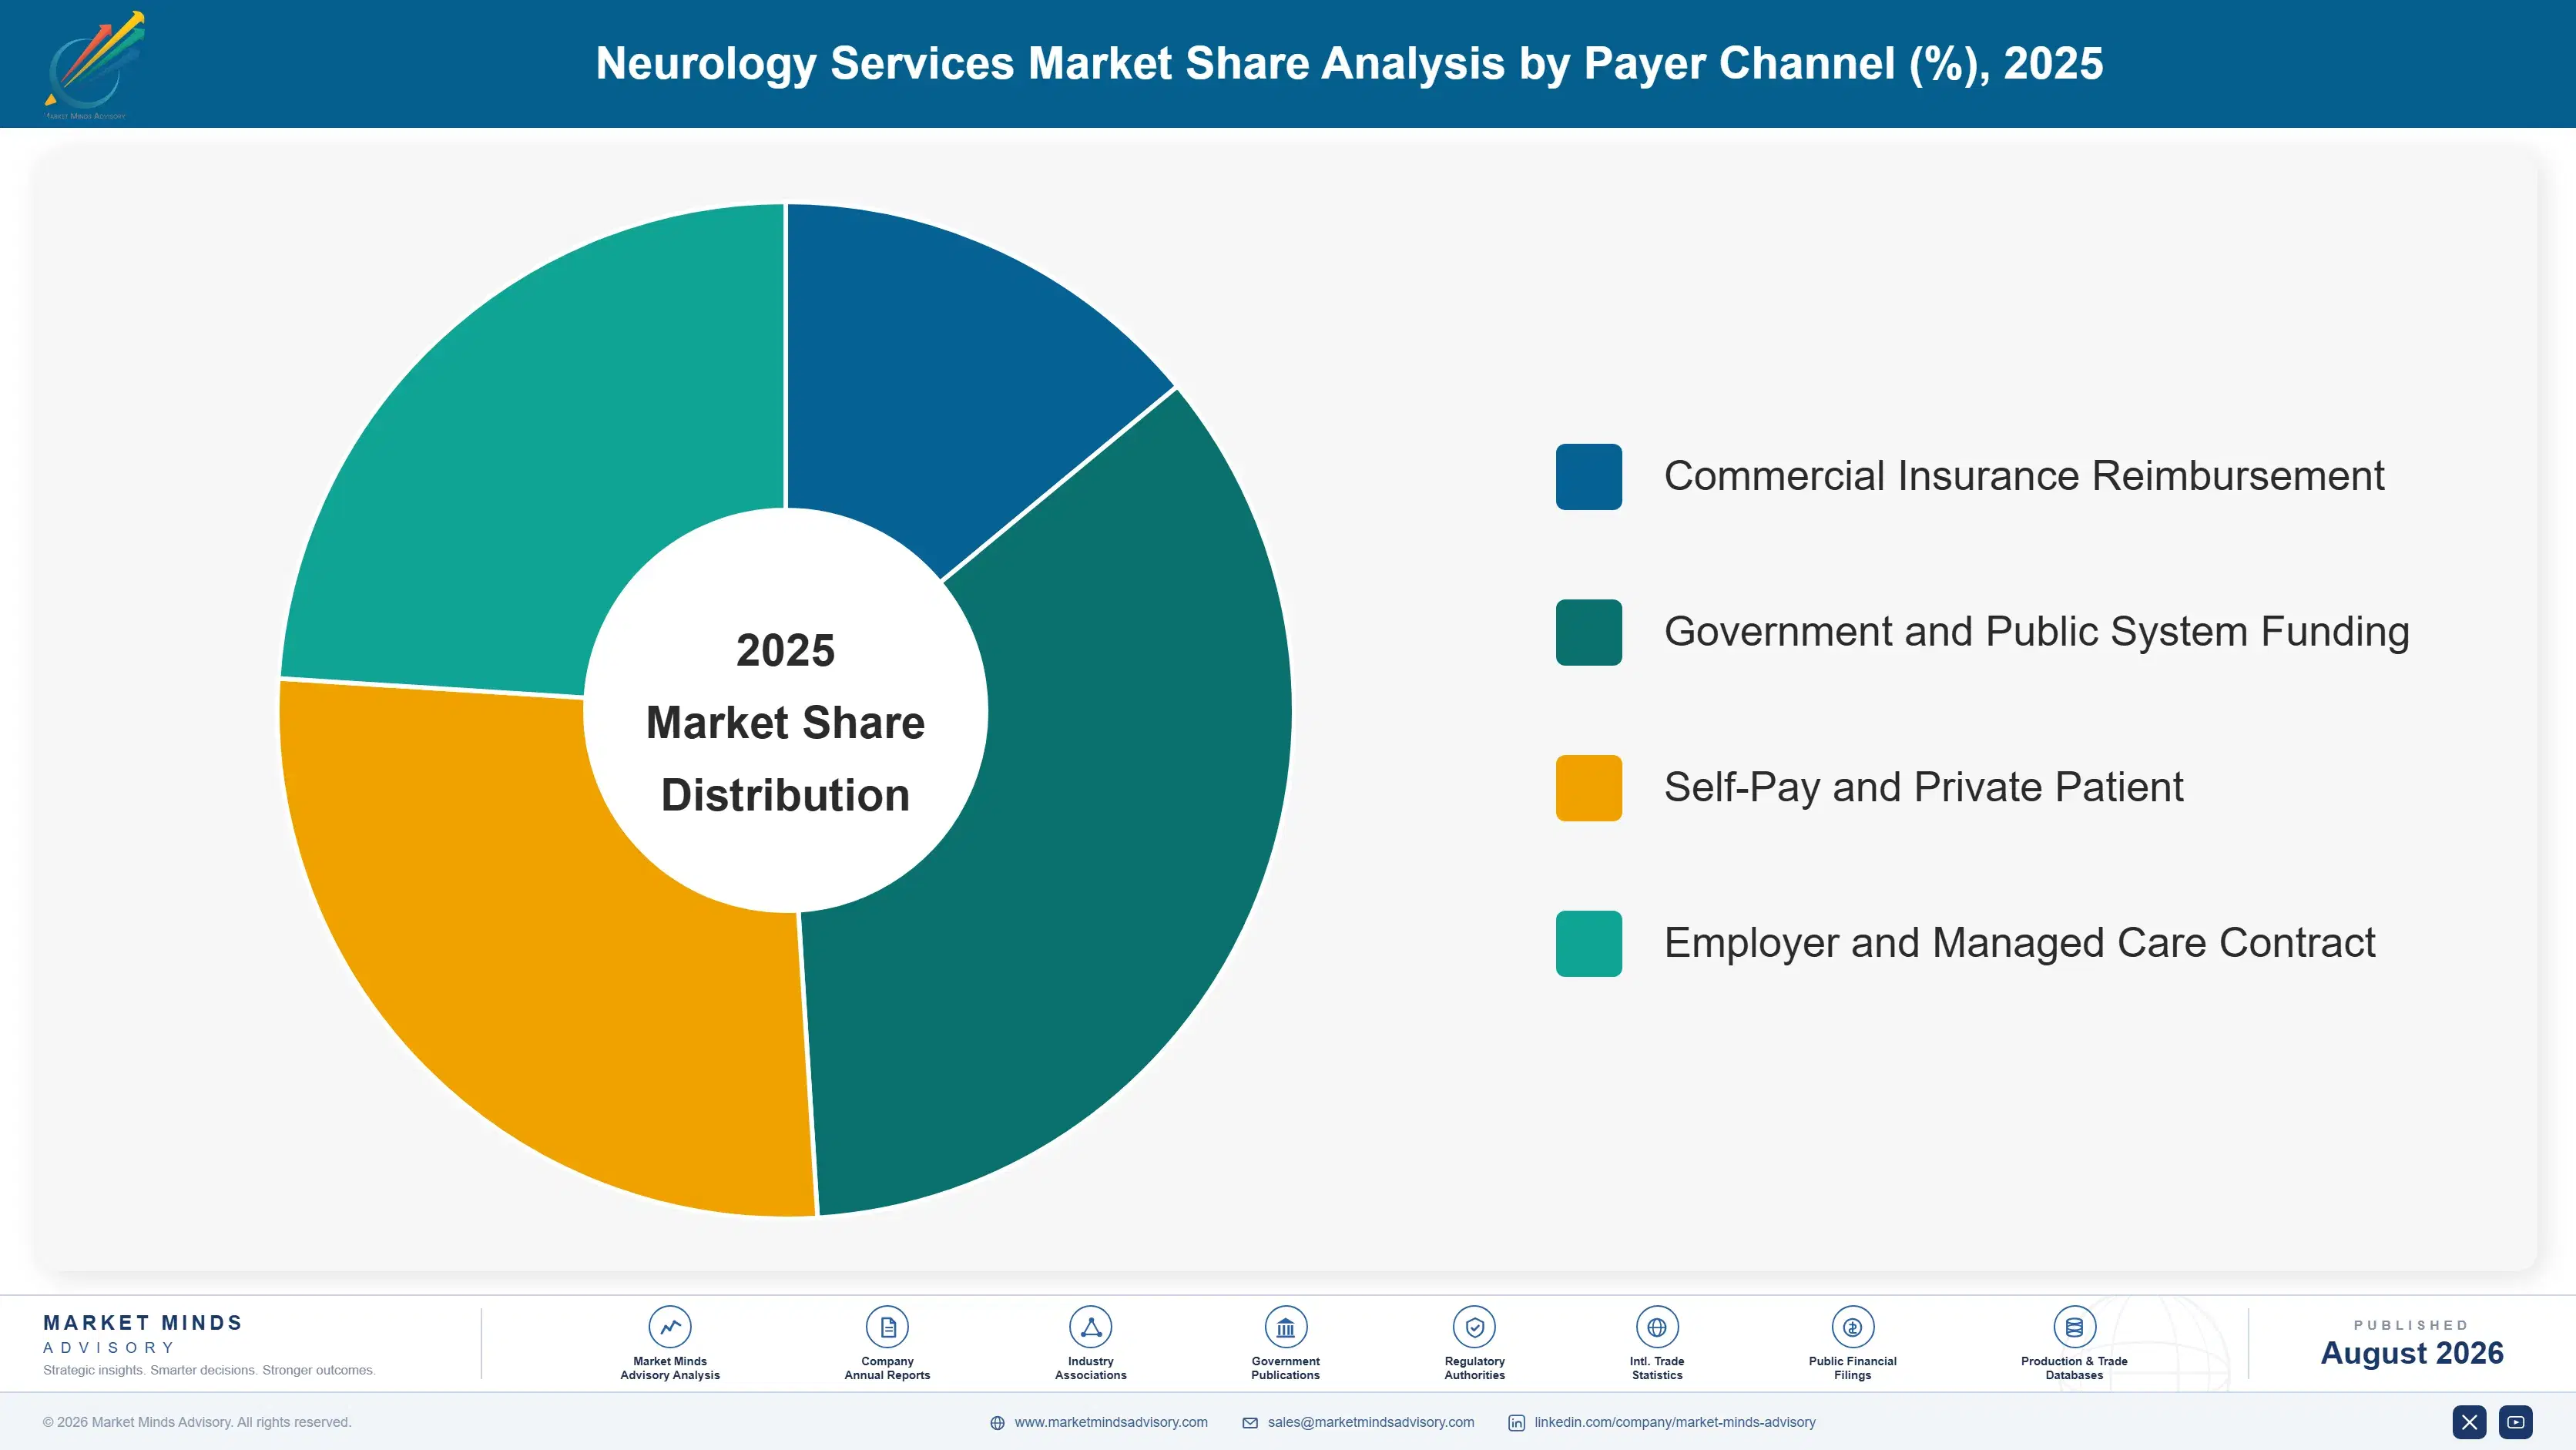
neurology-services-market-market-share-analysis-1787332057736

Neurodegenerative Disease Management

Neurodegenerative disease management grows fastest at 10.4%, about 1.58 times the overall 6.6% rate, and therapy availability rather than prevalence explains the acceleration. Alzheimer's care was a diagnosis followed by supportive management until amyloid-targeting treatments arrived, and each treated patient now needs biomarker confirmation, scheduled infusion, and imaging surveillance for oedema and haemorrhage. Parkinson's and motor neurone care generate their own escalating management pathways. The constraint is infusion capacity and neurologist time for monitoring reviews rather than drug supply, which is why uptake has trailed approval by years in every market. Payer eligibility restrictions compound that considerably. Centres lacking infusion capacity and biomarker confirmation simply refer these patients away entirely.
CAGR 10.4%

Epilepsy and Seizure Care

Epilepsy and seizure care grows at 7.8%, the second-fastest condition group, and it is the part of neurology where service redesign has gone furthest. Nurse-led clinics, remote seizure diary review, and protocol-driven medication titration all operate without a neurologist present for routine cases, which is why some centres manage several times the caseload per specialist that others do. Drug-resistant epilepsy still requires intensive specialist input, video monitoring, and surgical assessment. Long-term monitoring units are capacity constrained almost everywhere. The economics reward organisations that separate routine management from complex assessment rather than treating every patient identically. Video monitoring unit capacity remains the binding constraint on the complex end of this group.
CAGR 7.8%
Full segment breakdown across 5 segments available in the complete report.

Regional Architecture and Country Demand Map

Specialist density and reimbursement levels together set this distribution rather than population. North America leads on both payment rates and neurologists per head, while South Asia and Pacific grows quickest as diagnosis reaches populations that previously had no specialist access at all. Waiting lists reveal more than spending does.

North America

North America holds 32% of value, and payment rates rather than patient numbers explain how far its share exceeds its share of diagnosed disease. Reimbursement per consultation and per infusion sits well above other regions, and specialist density is among the highest anywhere at the top end. Amyloid therapy pathways launched here first and the infusion and imaging surveillance activity around them is furthest developed. Neurologist burnout and early retirement are nonetheless well documented and a genuine constraint on capacity. Growth of 6.0% reflects therapy pathway expansion against a workforce that is not growing to match it. Routine consultation volume is steadily migrating toward telehealth and lower-cost community settings here.
Share: 32% | CAGR: 6.0% (2026 to 2036)

Western Europe

Publicly funded capacity rather than clinical capability constrains this market. Western Europe holds 25% of value, with specialist training and clinical standards among the best anywhere while waiting lists for a first neurology consultation run to many months across the United Kingdom, Italy, and Spain. Amyloid therapy access has been considerably slower than in North America because health technology assessment bodies have questioned benefit against total pathway cost. German and French capacity is better funded and waits are shorter. Growth of 5.0% is the slowest of the seven regions, reflecting budget-constrained systems where demand is visible but unfunded. Demand is visible everywhere and funded almost nowhere in the public systems.
Share: 25% | CAGR: 5.0% (2026 to 2036)
Regional intelligence for 5 additional markets available in the complete report: East Asia, South Asia and Pacific, Latin America, Middle East and Africa, Eastern Europe. Contact sales@marketmindsadvisory.com.
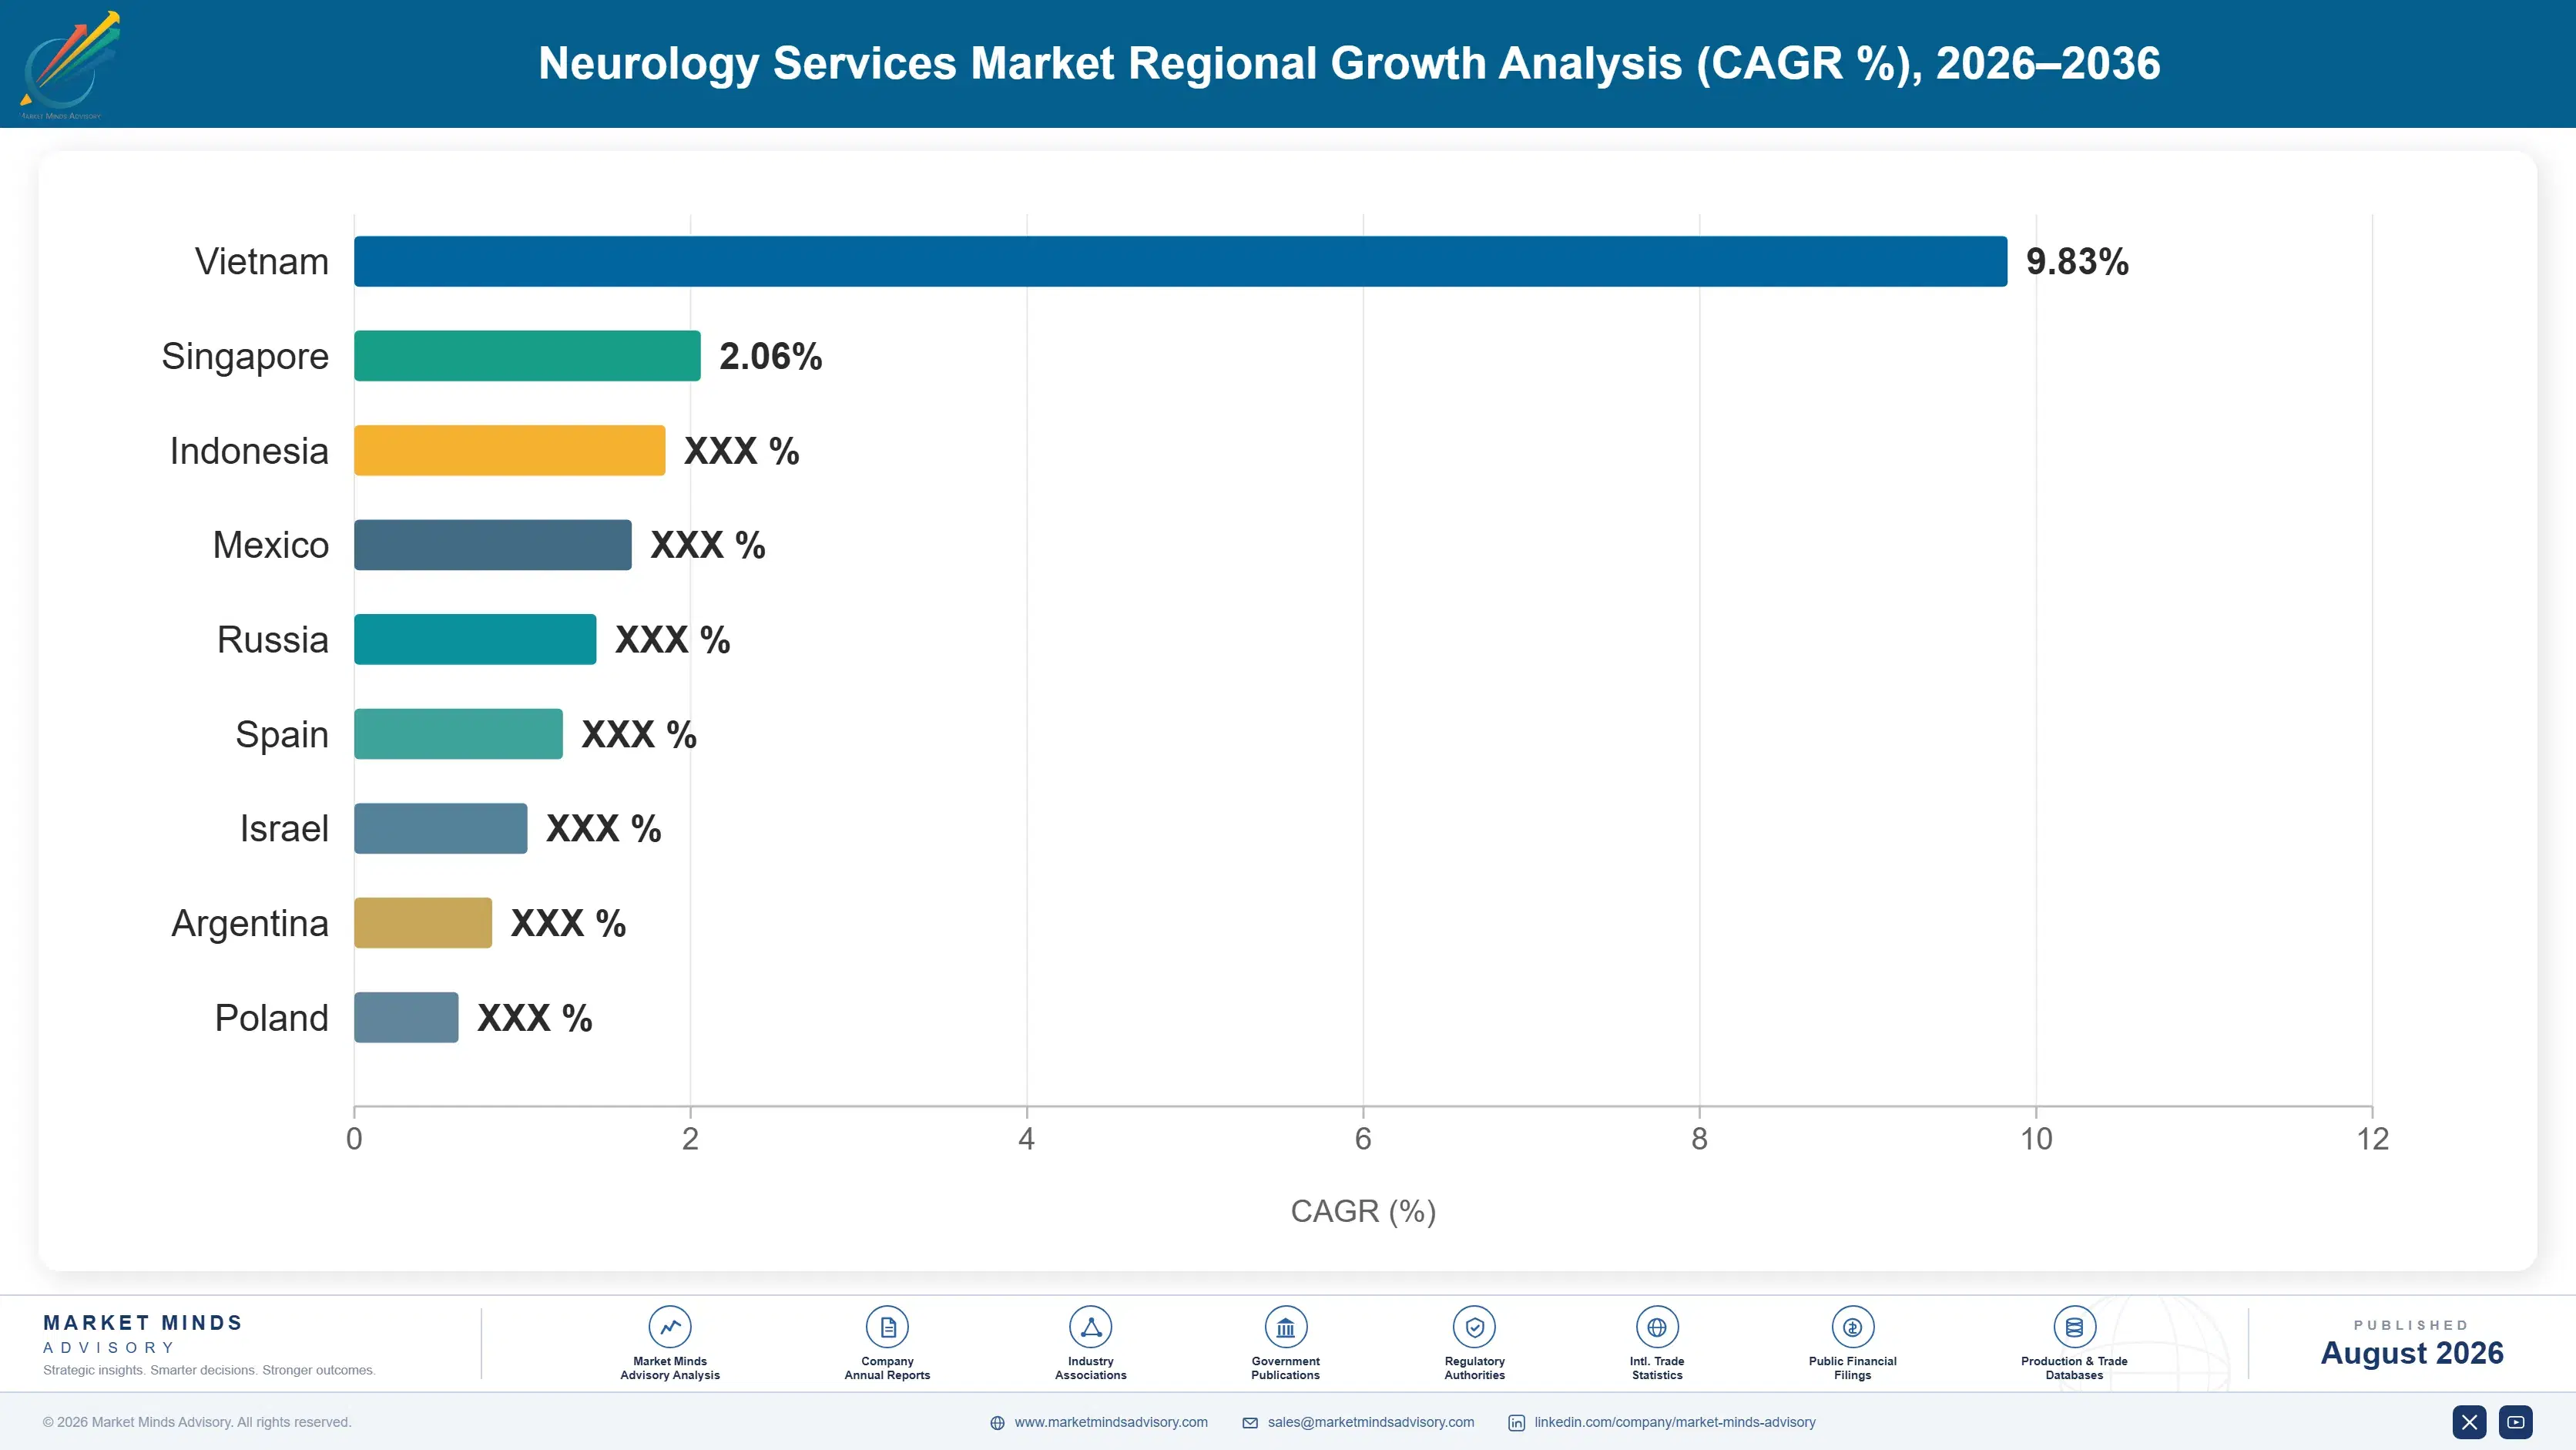
neurology-services-market-country-cagr-analysis-1787332058245

Where Neurology Services Actually Earn Return

Recruiting your way out of a neurologist shortage is not a strategy, because every competitor is recruiting from the same pool. The four moves below work with the constraint instead: removing routine work from the specialist, building infusion and biomarker capacity, holding registry data payers require, and reaching patients teleneurology can serve. None of them is a recruitment plan.

Move Routine Workload Off The Neurologist

Physician compensation is roughly 54% of delivery cost and specialist supply is fixed for a decade, so the only genuine capacity lever is deciding what actually requires a neurologist. Nurse-led epilepsy clinics, protocol-driven medication titration, pharmacist medication review, and remote diary assessment all handle routine cases without physician presence. Centres that redesign the pathway treat considerably more patients per specialist, with throughput gains around 30% where it is done properly. Those treating the shortage as a recruitment problem wait in the same queue as everybody else. The audit itself costs nothing but honesty.
Market Impact: Pathway redesign lifts specialist t

Build Infusion And Biomarker Capacity Ahead Of Demand

Amyloid therapy uptake has trailed approval by years, and infusion chairs plus biomarker confirmation pathways rather than drug supply are the reason. A centre with confirmed eligibility testing and scheduled infusion capacity treats patients that a competitor refers away, and each of those patients carries a monitoring pathway of roughly 5 imaging studies alongside the treatment. Building before payer criteria loosen puts capital at risk. It also means being the referral destination when they do, which is worth considerably more. Payer criteria will loosen and the referral flows to whoever built early.
Market Impact: Monitoring adds roughly 5 imaging s

Collect The Registry Data Payers Are Demanding

Payers have attached registry participation, prior authorisation, and outcome reporting to disease-modifying therapy coverage, and roughly 60% of otherwise eligible patients fall outside current criteria. A provider already collecting structured outcome data is positioned to negotiate coverage expansion and outcome-based agreements that a provider without it simply cannot enter. The data collection burden is real and falls on clinical staff who have no spare capacity. Doing it anyway is what converts a restricted pathway into a funded one over several years. That is a multi-year position rather than a quarterly one.
Market Impact: Current criteria exclude roughly 60

Use Teleneurology To Reach Beyond The Catchment

Remote consultation already handles about 23% of contacts and suits neurology unusually well, since much of a follow-up is history and medication review rather than examination. It does not save clinician time, which is the common misunderstanding, but it does extend reach into districts with no resident specialist and it removes travel for patients with movement disorders. That converts geographic catchment from a physical radius into a licensing question. Providers treating it as a pandemic measure rather than a growth channel are leaving referral volume unclaimed. Licensing work is cheap against the volume it opens.
Market Impact: Remote consultation already covers

Who Controls the Margin Pool

Fragmentation is almost total: the top five hold roughly 9% of neurology service revenue, across academic medical centres, hospital departments, private group practices, and telehealth providers. The gap between leaders and challengers is subspecialty depth and pathway design rather than clinical quality, which is broadly comparable in developed markets. All participants here are assessed on one basis, revenue from neurological clinical service delivery, excluding neurosurgical procedures, imagi
Competition runs along four lines. First, subspecialty depth, since complex epilepsy, movement disorder, and neuromuscular referrals go where the expertise sits. Second, pathway design, because throughput per neurologist varies several-fold between centres treating identical caseloads. Third, infusion and biomarker capacity, which decides who can actually deliver disease-modifying therapy. Fourth, referral network position, as neurology is almost entirely a referred specialty.

Pressure is building from two directions. Workforce shortage and burnout are pulling experienced clinicians out of practice faster than training replaces them, which favours organisations that need fewer specialist hours per patient. Meanwhile payer restriction on therapy pathways rewards providers holding registry data. Rankings should favour centres with redesigned pathways and biomarker capability over those defending referral position on reputation alone.
neurology-services-market-company-positioning-matrix-1787332058766

Competitive Moat and Risk Dimensions

MAYO CLINIC

Moat: Subspecialty depth and referral gravity

Mayo holds subspecialty depth across epilepsy, movement disorders, neuromuscular disease, and neuro-oncology that very few institutions match, which draws the complex referrals carrying the highest value per patient. Its research position means new therapy pathways establish there before elsewhere. Integrated imaging, biomarker, and infusion capability lets it deliver disease-modifying treatment where community neurology must refer away.
MAYO CLINIC

Risk: Capacity ceiling and cost position

Complex referral volume is limited by the same specialist supply constraining everybody else, and reputation cannot create clinician hours. Cost per episode is high relative to community providers, which payers increasingly scrutinise for cases that do not genuinely need academic input. Routine neurology volume is also steadily migrating toward lower-cost settings and telehealth providers.
HCA HEALTHCARE

Moat: Network scale and stroke coverage

HCA operates neurology services across a very large hospital network with stroke care coverage that captures emergency presentations at scale, which is the highest-acuity and best-reimbursed entry point into neurological care. Network breadth lets it move routine follow-up to lower-cost settings while concentrating specialists where acuity justifies them. Employed physician models give it more pathway control than referral-dependent competitors hold.
HCA HEALTHCARE

Risk: Recruitment exposure and payer mix

Growth depends on recruiting neurologists into markets where academic centres and private practice compete for the same small pool, and compensation escalation follows. Payer mix across a large network includes considerable government-funded volume reimbursed well below commercial rates. Subspecialty depth for complex cases is also thinner than academic centres offer, which sends the highest-value referrals elsewhere.

Players Tracked

Prominent Players

HCA Healthcare
Mayo Clinic
Cleveland Clinic
Fresenius Helios
Ramsay Health Care

Other Key Players

Tenet Healthcare
Universal Health Services
Ascension
Kaiser Permanente
Massachusetts General Brigham
Johns Hopkins Medicine
Apollo Hospitals
Fortis Healthcare
Max Healthcare
IHH Healthcare
Netcare
Rede D Or
NeuroOne Health Partners
SOC Telemed
Teladoc Health

Recent Developments

JANUARY 2025

Payers tighten registry and monitoring conditions on amyloid therapy

Additional payers attached registry participation, prior authorisation, and imaging surveillance conditions to coverage of amyloid-targeting Alzheimer's treatments, narrowing the eligible population against approved labels. These were coverage decisions rather than commercial transactions, and they left centres holding infusion capacity they could not fill with confirmed patients.
Signal: Regulatory approval creates a pathway whil
AUGUST 2024

Nurse-led neurology clinic models expand across health systems

Health systems widened nurse-led epilepsy and movement disorder clinics with protocol-driven titration and remote monitoring, handling routine cases without a neurologist present. These were service redesign programmes rather than acquisitions or joint ventures, and they addressed the only capacity lever available inside a decade of workforce planning.
Signal: Throughput per specialist varies several-f
APRIL 2024

Teleneurology licensing arrangements widen across jurisdictions

Several jurisdictions extended or made permanent the cross-border licensing arrangements that allow remote neurological consultation across state and national lines. These were regulatory changes rather than corporate events, and they converted geographic catchment from a physical radius into a licensing question for every provider. Catchment became a legal question.
Signal: Licensing rather than physical distance no

Clinician Compensation, Imaging, Infusion, Facilities

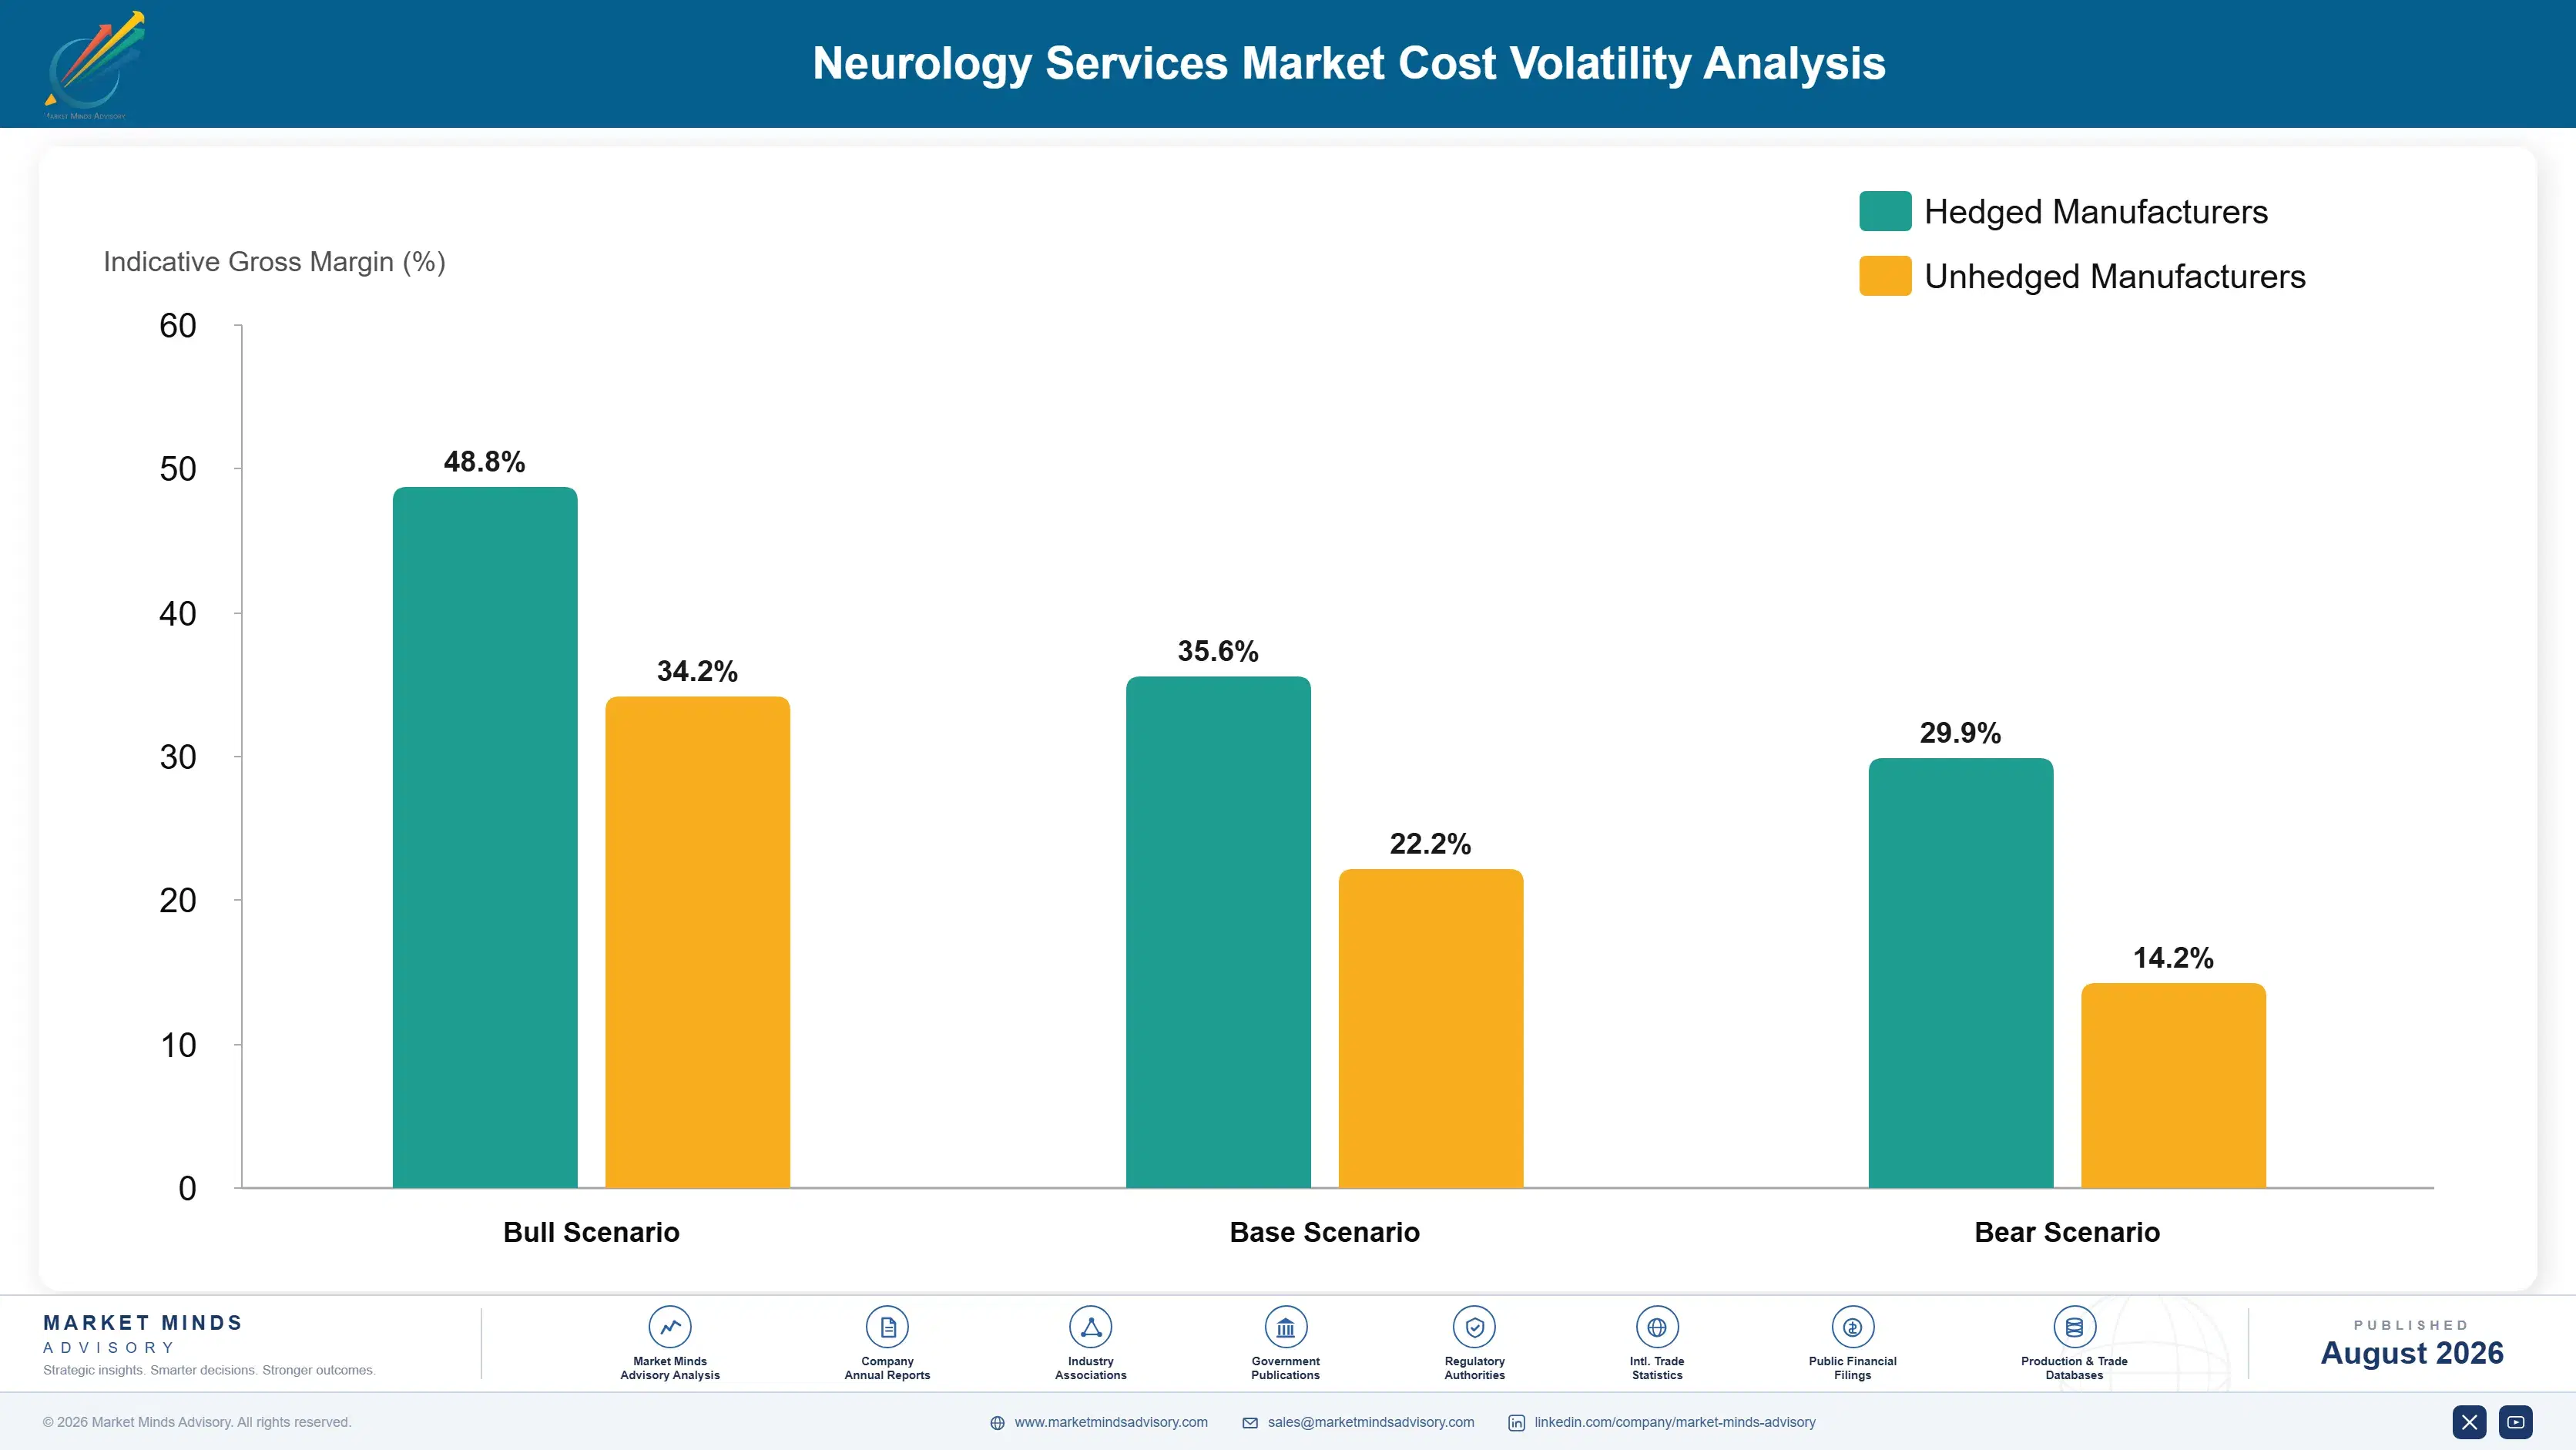
This is a labour business and the cost sheet says so plainly. Neurologist and advanced practice provider compensation runs roughly 54% of service delivery cost, set by a market where demand exceeds supply everywhere. Imaging and diagnostic testing adds 14% to 20%, infusion delivery including drug handling and chair time 10% to 18% where therapy pathways exist, and facilities and administration a further 12% to 17%.
Neurologist compensation has inflated well above general medical wage growth since 2021, as health systems competed for a supply that does not respond to price, and locum rates rose further still. Compensation disclosures across large hospital operators including HCA Healthcare reflected specialist wage pressure in those periods. Reimbursement per consultation moved barely at all over the same window, which compressed neurology department margins in almost every setting.

Exposure separates by pathway design, not by scale. A service where advanced practice providers handle routine follow-up carries far less specialist cost per patient than one routing everything through a neurologist, and the difference compounds across a caseload. Geography matters too, since rural and secondary city services pay recruitment premiums that metropolitan academic centres do not, and frequently rely on locums at multiples of employed cost.
neurology-services-market-cost-volatility-analysis-1787332058960

Design the pathway around who must genuinely be present

Specialist compensation is over half of delivery cost and supply is fixed, so throughput per neurologist is what matters. Auditing each appointment type against whether a physician is genuinely required finds a substantial share is not. Nurse-led clinics absorb it. The work is organisational, not capital, which is why some centres manage several times the caseload others do.

Build retention programmes before recruitment budgets

Replacing a departing neurologist takes many months at locum rates that run at multiples of employed cost, and the training pipeline offers nothing inside a decade. Administrative burden reduction, scheduling control, and subspecialty time cost far less than one locum year. Health systems funding recruitment while ignoring why clinicians leave are buying the same person back at escalating prices.

Group infusion capacity rather than spreading it thin

Infusion chairs, pharmacy handling, and monitoring imaging carry real fixed cost, and a centre running them below capacity loses money on every therapy pathway it offers. Concentrating disease-modifying therapy delivery at fewer sites with genuine volume improves utilisation and lets specialist monitoring reviews be batched. Patients travel further, which is a real access cost to weigh honestly against the economics.

Portfolio Architecture for Margin Defence

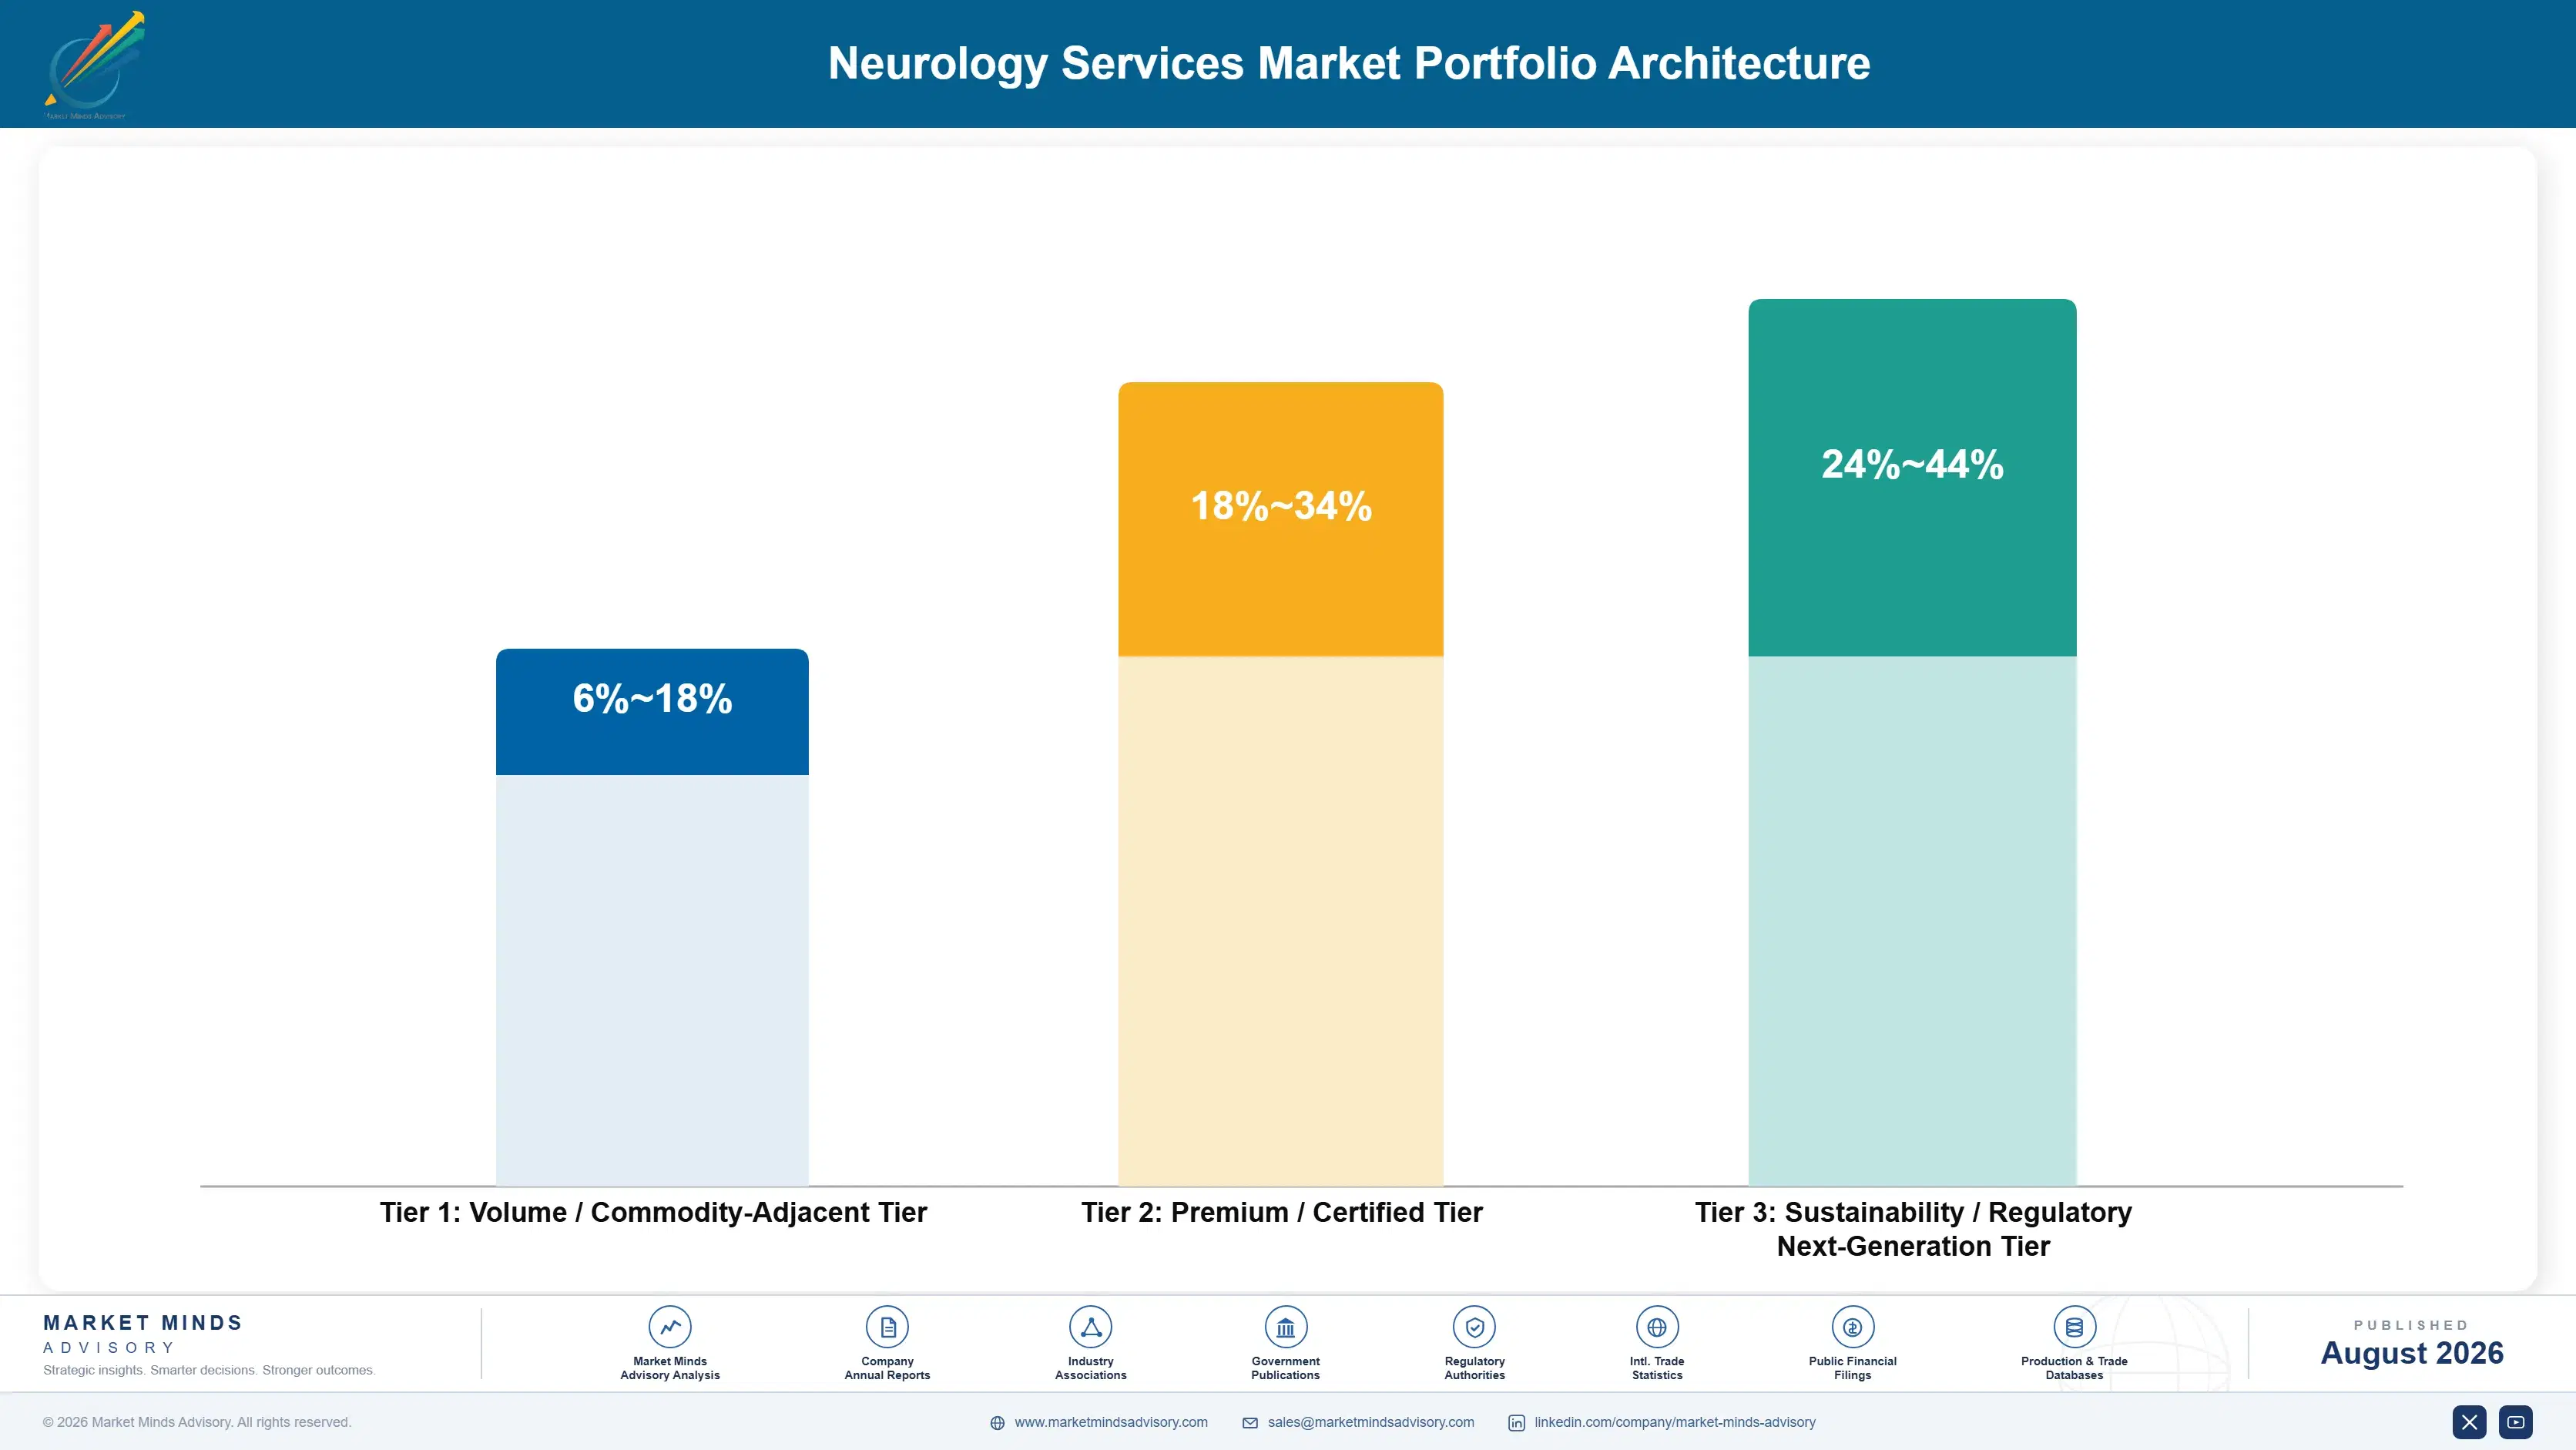
The portfolio splits into three tiers with different economics. Routine follow-up and general neurology consultation form the volume tier, where reimbursement is fixed, throughput decides everything, and a physician is frequently not required at all. Subspecialty assessment and monitoring earn more because expertise narrows the field considerably. Disease-modifying therapy pathways and complex intervention price against capability rather than against a competing appointment slot.
The tension runs between routine volume that fills the clinic and complex work that earns the return. General neurology follow-up keeps the referral relationship alive, maintains the catchment, and generates the base from which complex cases emerge. Yet it consumes the scarcest resource in the system at the lowest reimbursement. Services handling this well move routine follow-up to advanced practice providers while concentrating specialist hours on assessment and therapy pathways.

High-value pools concentrate where capability or capacity limits competition: disease-modifying therapy delivery with infusion and biomarker confirmation, complex epilepsy assessment with video monitoring, movement disorder programmes with device therapy capability, and neuromuscular subspecialty care. All four escape the standard consultation tariff. Routine general neurology follow-up sits at the other end, where the fee is fixed and the only variable is how much specialist time it consumes.

Volume / Commodity-Adjacent Tier

Routine general neurology consultation and stable follow-up reimbursed at fixed tariff. The range is wide because pathway design determines whether a neurologist or an advanced practice provider delivers the appointment at identical reimbursement.
Gross Margin: 6-18%

Premium / Certified Tier

Subspecialty assessment in epilepsy, movement disorders, and neuromuscular disease, including video monitoring and complex diagnostics. The range is wide because subspecialty depth varies enormously between centres and referral acuity follows it directly.
Gross Margin: 18-34%

Sustainability / Regulatory / Next-Generation Tier

Disease-modifying therapy pathways, device-based movement disorder programmes, and registry-backed outcome contracts. The range is wide because payer coverage restriction varies sharply and infusion capacity utilisation differs greatly between centres. Utilisation drives the difference.
Gross Margin: 24-44%
neurology-services-market-portfolio-architecture-1787332059455

High-value Sub-segments and Strategic Watch-out

Neurodegenerative Disease Management

High value and high growth at 10.4%, the fastest condition group, on amyloid therapies converting Alzheimer's care from observation into a managed infusion and surveillance pathway. Infusion capacity and neurologist monitoring time rather than drug supply are the binding constraints on uptake. Uptake has trailed approval considerably.
Gross Margin: 24-44%

Epilepsy and Seizure Care

High value with strong growth at 7.8%, and the condition group where service redesign has gone furthest through nurse-led clinics and remote diary review. Drug-resistant cases still need intensive specialist input, and monitoring unit capacity is constrained almost everywhere. Redesign explains most of the variance between centres.
Gross Margin: 18-34%

Stroke and Cerebrovascular Services

The volume core by a wide margin, growing at 6.2% on ageing populations and expanding thrombolysis network coverage. Acuity supports reimbursement better than outpatient neurology does, though it depends on emergency infrastructure rather than on any clinic pathway design. Pathway design matters less here than infrastructure.
Gross Margin: 14-30%

Headache and Pain Neurology

The strategic watch-out, growing at 6.8% on migraine therapies that have genuinely changed treatment, while much of the volume can be managed in primary care or by advanced practice providers. Specialist involvement is hard to justify economically for routine cases. Primary care absorbs much of it already.
Gross Margin: 10-24%

How Neurology Referral Positions Hold

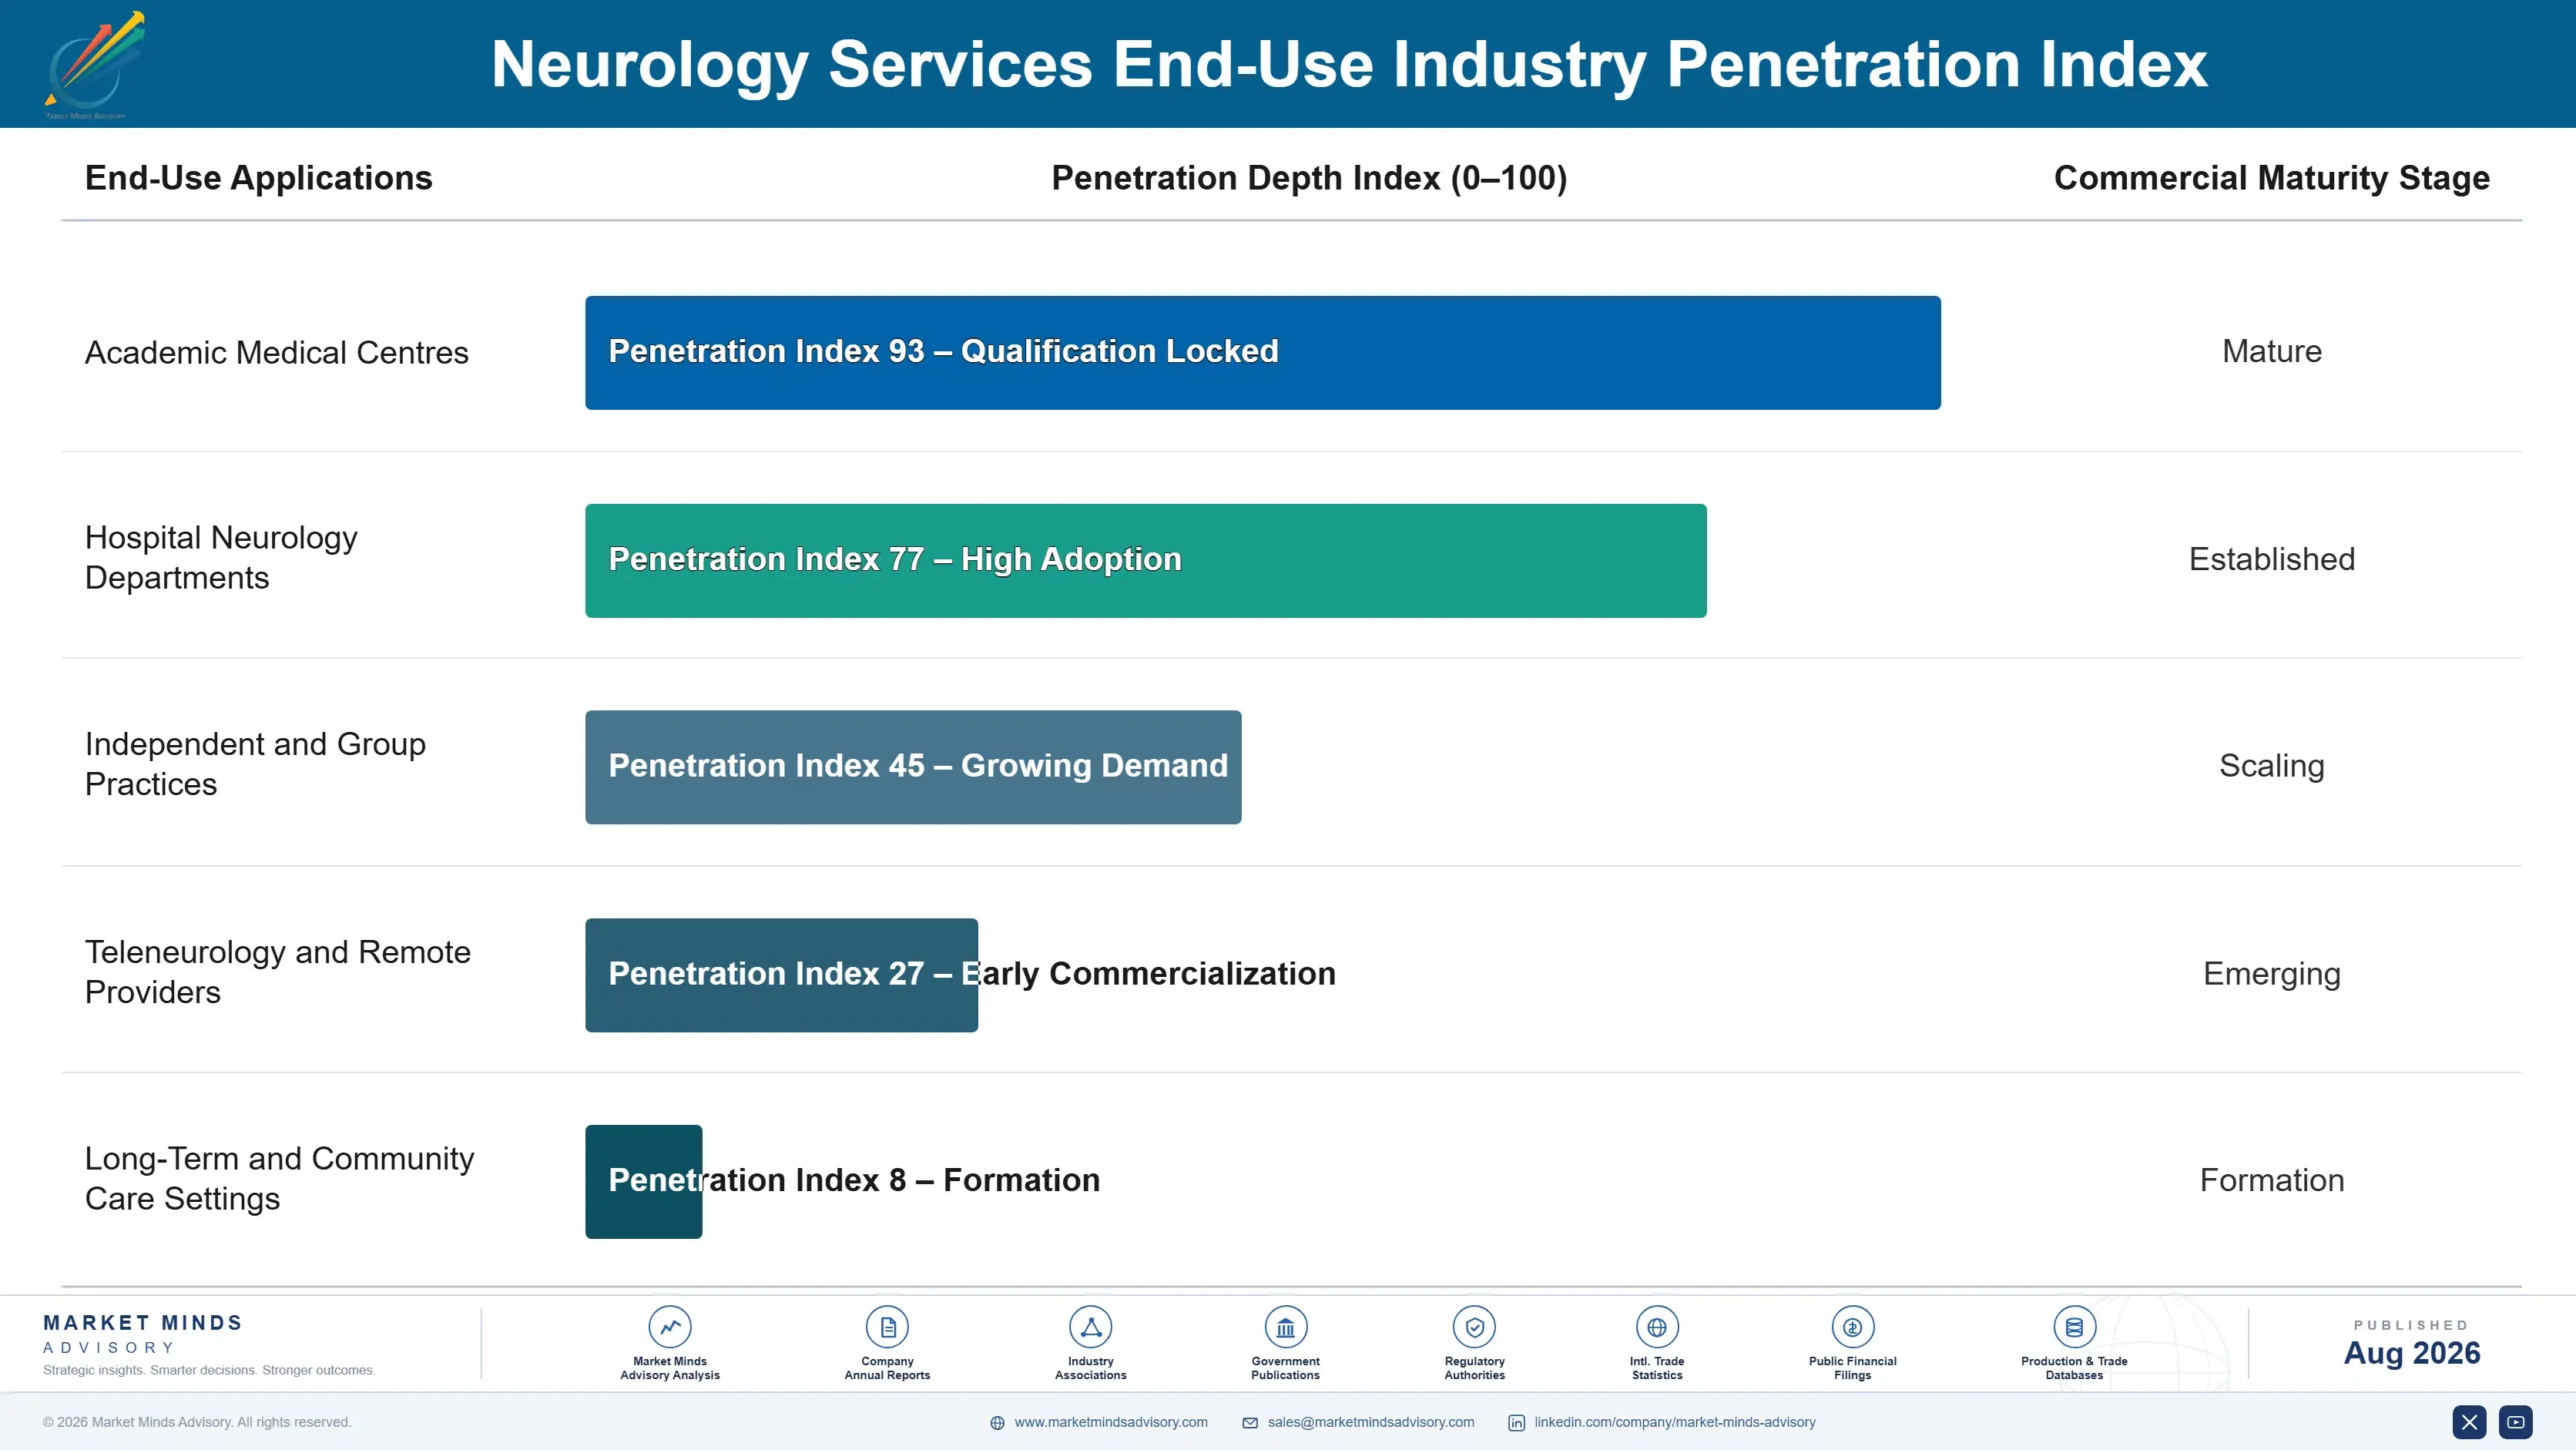
Demand commits at referral and repeats as follow-up for conditions chronic by definition. A patient established with a neurology service returns for years, and the referring physician sends the next patient wherever the last one was handled competently. That makes referral relationships the durable asset rather than any episode. The genuine competitive moments are a referring practice changing habit, a new therapy pathway, and any waiting list long enough to push referrals elsewhere.
Stickiness varies by condition complexity and pathway involvement. Disease-modifying therapy patients stick hardest, since infusion scheduling and imaging surveillance tie them to one centre entirely. Complex epilepsy and movement disorder patients stick nearly as firmly through subspecialty relationship and device programmes. Routine general neurology sticks least, moving with waiting times and travel distance because the follow-up is largely interchangeable between competent providers.

Buyer profiles have shifted from referring physicians choosing on reputation toward payers, health system administrators, and increasingly patients comparing waiting times directly. Payers now attach coverage conditions that decide whether a pathway is deliverable at all. That change rewards services publishing access times, holding registry data, and demonstrating throughput per specialist, and penalises those relying on reputation while patients wait thirty weeks.
neurology-services-market-end-use-penetration-index-1787332059941

Our Call On Neurology Services

These are among the four positions where our research anticipates prominent divergence between winners and laggards over the coming forecast period. Each is grounded in the demand model, the regulatory perimeter, and the announced capacity pipeline.
01 / PATHWAY REDESIGN PRIORITY

You cannot recruit your way out of this shortage

Specialist compensation is roughly 54% of delivery cost and the training pipeline runs 10 to 13 years, so neurologist supply is fixed on any planning horizon a business actually uses. The only genuine capacity lever is deciding which appointments require a physician at all, and auditing that honestly finds that a substantial share do not. Centres redesigning around nurse-led clinics and protocol titration achieve throughput gains near 30%, while those funding recruitment queue alongside every competitor for exactly the same people.
02 / THERAPY CAPACITY BUILD

Infusion chairs decide who treats, not approvals

Amyloid therapy uptake has trailed regulatory approval by several years, and infusion capacity plus biomarker confirmation pathways rather than drug availability explain almost all of that particular gap. A centre with confirmed eligibility testing and scheduled chair time treats patients a competitor must refer away, and each carries a monitoring pathway of roughly five imaging studies alongside the treatment course itself. Building before payer criteria loosen puts capital at risk and makes you the obvious referral destination when they finally do.
03 / REGISTRY DATA DISCIPLINE

Coverage expansion goes to whoever has the data

Payers have now attached registry participation and outcome reporting to disease-modifying therapy coverage, and roughly 60% of otherwise eligible patients currently fall outside the criteria actually being applied. A provider already collecting structured outcome data can negotiate both coverage expansion and outcome-based agreements that a provider without any of it simply cannot enter at all. The collection burden falls entirely on clinical staff who already have no spare capacity, which is precisely why so few competitors will ever do it properly.
04 / ACCESS TIME TRANSPARENCY

Patients now compare waiting lists, not reputations

Referring physicians increasingly send patients wherever they will actually be seen, and patients themselves now compare access times directly in a way they simply did not a decade ago. A thirty-week wait loses referral volume regardless of institutional reputation or any amount of subspecialty depth. Publishing access times is uncomfortable for services that cannot meet them, which is exactly why doing it credibly converts pathway redesign into referral share rather than leaving it as an internal efficiency story nobody outside sees.

Engagement Snapshot From the Field

A live engagement with an industry participant carrying material or product regulatory and market exposure ahead of a defining policy shift, showing how our research translates into a defensible multi-year portfolio strategy.
MARKET MINDS ADVISORY · CLIENT ENGAGEMENT SUMMARY
Neurology Services Producer Strategic Portfolio Review and Transition Roadmap 2026·Investment Scenario on Neurology Services Exposure Evaluation 2025-26
CLIENT PROFILE
A regional health system operating neurology services across nine hospitals engaged MMA after new patient waits reached 34 weeks and two neurologists resigned within a quarter. The client reported 21 neurologists against an establishment of 27, locum spend of about USD 6 million annually, and referrals declining despite the waiting list lengthening (client-reported, unverified by MMA).
STRATEGIC CHALLENGE
Recruiting six neurologists in a market where academic centres and private practice competed for the same candidates was not realistic at any compensation the board would approve. Referring practices were already sending patients elsewhere, which meant the waiting list was falling for the wrong reason. The board needed capacity without new specialists, before the referral base eroded further.
MMA APPROACH
MMA audited every appointment type against whether a neurologist was genuinely required, which internal planning had never examined. We compared throughput per specialist across the nine sites to see whether the variation reflected caseload or pathway design. We then modelled what the two resignations had actually cost in locum spend and lost referral volume, rather than treating them as a recruitment line item.
KEY FINDINGS
  1. Roughly 46% of appointments were routine follow-up that protocol and nurse-led review could handle, which no site had systematically reallocated (client-reported, unverified by MMA).
  2. Throughput per neurologist varied by a factor of 2.4 across the nine sites on comparable caseloads, and pathway design explained almost all of the difference.
  3. Locum cover cost roughly 3.1 times employed compensation, so the two vacancies were consuming more than the retention measures the board had declined to fund.
  4. Referral decline had begun before the waiting list peaked, which meant referring practices were reacting to access reputation rather than to published waits (client-reported, unverified by MMA).
CLIENT PROFILE
A regional health system operating neurology services across nine hospitals engaged MMA after new patient waits reached 34 weeks and two neurologists resigned within a quarter. The client reported 21 neurologists against an establishment of 27, locum spend of about USD 6 million annually, and referrals declining despite the waiting list lengthening (client-reported, unverified by MMA).
STRATEGIC CHALLENGE
Recruiting six neurologists in a market where academic centres and private practice competed for the same candidates was not realistic at any compensation the board would approve. Referring practices were already sending patients elsewhere, which meant the waiting list was falling for the wrong reason. The board needed capacity without new specialists, before the referral base eroded further.
MMA APPROACH
MMA audited every appointment type against whether a neurologist was genuinely required, which internal planning had never examined. We compared throughput per specialist across the nine sites to see whether the variation reflected caseload or pathway design. We then modelled what the two resignations had actually cost in locum spend and lost referral volume, rather than treating them as a recruitment line item.
KEY FINDINGS
  1. Roughly 46% of appointments were routine follow-up that protocol and nurse-led review could handle, which no site had systematically reallocated (client-reported, unverified by MMA).
  2. Throughput per neurologist varied by a factor of 2.4 across the nine sites on comparable caseloads, and pathway design explained almost all of the difference.
  3. Locum cover cost roughly 3.1 times employed compensation, so the two vacancies were consuming more than the retention measures the board had declined to fund.
  4. Referral decline had begun before the waiting list peaked, which meant referring practices were reacting to access reputation rather than to published waits (client-reported, unverified by MMA).
RECOMMENDED STRATEGY
Phase 1: Phase 1 (0 to 6 months): Reallocate routine follow-up to nurse-led clinics and protocol titration at the three highest-volume sites first. Phase 2: Phase 2 (6 to 18 months): Fund retention measures costing a fraction of current locum spend before attempting any further recruitment. Phase 3: Phase 3 (18 to 30 months): Publish access times to referring practices and rebuild referral volume on demonstrated capacity rather than reputation.
OUTCOME
The client cut new patient waits from 34 weeks to 15 without adding a neurologist, by reallocating routine follow-up and standardising pathways across sites. Locum spend fell by roughly 58% as retention improved, and referral volume recovered once access times were published and consistently met (client-reported, unverified by MMA).

Frequently Asked Questions

Foundational context covering the market sizes, CAGR, scope, country, region and competition that inform every finding below. This section is provided to cover basics and most often pre-purchase conversations, answered from the MMA Primary Research Dataset.

What is the current size of the Neurology Services Market?

The global neurology services market is valued at USD 142.6 billion in 2025, covering neurodegenerative, epilepsy, stroke, headache, and neuromuscular clinical care. Neurosurgery, imaging equipment, and pharmaceutical products are excluded.

How large will the Neurology Services Market be by 2036?

The market is forecast to reach USD 288.05 billion by 2036 in the base case, about 1.89 times the 2026 level. That represents incremental value of roughly USD 136.03 billion across the decade.

What is the CAGR for the Neurology Services Market 2026 to 2036?

The market grows at a 6.6% CAGR in the base case, with bull and bear scenarios at 7.8% and 5.4%. The spread turns mainly on specialist supply and disease-modifying therapy coverage.

Which segment is growing fastest?

Neurodegenerative disease management grows fastest at 10.4%, about 1.58 times the overall rate, as amyloid therapies create infusion and surveillance pathways. Epilepsy and seizure care follows at 7.8%.

Who are the major companies in the Neurology Services Market?

Leading providers include HCA Healthcare, Mayo Clinic, Cleveland Clinic, Fresenius Helios, and Ramsay Health Care. Fragmentation is almost total, with the top five holding roughly 9% of neurology service revenue.

Which country is growing fastest?

India grows fastest at an 11.2% CAGR, as private neurology departments and teleneurology reach populations with no resident specialist. China and Indonesia follow on tertiary capacity expansion.

Report Segmentation Architecture

The full report scope spans multiple orthogonal segmentation dimensions, with cross-tabulated demand data provided for each dimension pair. Coverage extends further to regional breakdowns, trend trajectories, and the competitive detail needed to support segment-level decision-making.

By Clinical Condition Group

  • Neurodegenerative Disease Management
  • Epilepsy and Seizure Care
  • Stroke and Cerebrovascular Services
  • Headache and Pain Neurology
  • Neuromuscular and Movement Disorder Care

By End-Use Industry

  • Academic Medical Centres
  • Hospital Neurology Departments
  • Independent and Group Practices
  • Teleneurology and Remote Providers
  • Long-Term and Community Care Settings

By Payer Channel

  • Commercial Insurance Reimbursement
  • Government and Public System Funding
  • Self-Pay and Private Patient
  • Employer and Managed Care Contract

By Region

  • North America
  • Western Europe
  • East Asia
  • South Asia and Pacific
  • Latin America
  • Middle East and Africa
  • Eastern Europe

Scope, Methodology, and Coverage

Every figure in this report is reproducible from documented input assumptions. The scope below maps the historical period, the forecast horizon, the segmentation dimensions, and the countries covered, alongside the underlying primary and qualitative methodology.
Historical Period
2020 to 2025
Forecast Period
2026 to 2036
Base Year
2025 (USD billions; MMA Primary Research Dataset, August 2026)
Market Definition
The neurology services market comprises the delivery and billing of clinical services for the diagnosis, treatment, and ongoing management of disorders of the nervous system, valued at provider service revenue received from insurers, public health systems, employers, and patients. It spans neurodegenerative disease management including disease-modifying therapy pathways, epilepsy and seizure care including monitoring and drug-resistant assessment, stroke and cerebrovascular services, headache and pain neurology, and neuromuscular and movement disorder care including device therapy programmes, together with the associated consultation, infusion delivery, monitoring, and care coordination activity. Neurosurgical and interventional procedures billed as surgical services, diagnostic imaging equipment and in vitro diagnostic products, pharmaceutical and medical device product revenue, psychiatric and mental health services, general rehabilitation delivered outside neurological specialty care, and long-term custodial care are excluded.
Quantitative Units
USD billions (current prices); activity in millions of consultations and treated patients
Segmentation Dimensions
By Clinical Condition Group; By End-Use Industry; By Payer Channel; By Region
Regions Covered
North America, Western Europe, East Asia, South Asia and Pacific, Latin America, Middle East and Africa, Eastern Europe
Countries Covered
USA, Canada, UK, Germany, France, Italy, Spain, Netherlands, Sweden, Switzerland, Japan, China, South Korea, Australia, India, Indonesia, Vietnam, Thailand, Brazil, Mexico, Argentina, Chile, Colombia, UAE, Saudi Arabia, South Africa, Nigeria, Turkey, Poland, Romania, and additional markets relevant to this sector
Key Companies Profiled
HCA Healthcare, Mayo Clinic, Cleveland Clinic, Fresenius Helios, Ramsay Health Care, Tenet Healthcare, Universal Health Services, Ascension, Kaiser Permanente, Massachusetts General Brigham, Johns Hopkins Medicine, Apollo Hospitals, Fortis Healthcare, Max Healthcare, IHH Healthcare, Netcare, Rede D Or, NeuroOne Health Partners, SOC Telemed, Teladoc Health
Quantitative Methodology
Primary survey, n=3,800 respondents, Q4 2025, six countries; demand-side model with trade association cross-validation
Qualitative Methodology
47 expert interviews, Q4 2025; applied to validate demand model assumptions, identify emerging dynamics, and assess competitive positioning
Report Format
PDF and XLSX data workbook (Word format preview document)
Publisher
Market Minds Advisory
Report Code
MMA-2026-HLT-316
Published
August 2026
Contact
sales@marketmindsadvisory.com | www.marketmindsadvisory.com

Purchase the full Neurology Services Market Report (2026 to 2036).

The full MMA Neurology Services report sizes the market across five clinical condition groups, five delivery settings, four payer channels, and seven regions through 2036. It profiles 20 providers on a consistent basis of neurological clinical service revenue, scoring each on subspecialty depth, pathway design, infusion and biomarker capacity, and referral network position. Scenario models quantify how specialist supply, disease-modifying therapy coverage, and extended practice adoption move both volume and achievable margin by condition group. The report also includes throughput per specialist benchmarking, access time comparison by market, disease-modifying therapy coverage mapping across payers, and workforce supply projections against diagnosed prevalence.
Five-condition and four-channel market sizing to 2036
Twenty-provider benchmark on neurological clinical service revenue
Throughput per specialist benchmarking across comparable caseloads
Access time comparison by market and condition group
Disease-modifying therapy coverage mapping across major payers
Workforce supply projections against rising diagnosed prevalence

Built For The People Who Decide

From boardroom strategy to bench-side execution, this report is read cover-to-cover by leaders shaping the next decade of their industry, turning demand scenarios, market dynamics and valuation benchmarks into decisions.
CXOs/ Presidents/ VPs/ Managers
M&A and Corporate Development
Strategy Teams and R&D Heads
Procurement and Product Directors
Regulatory and Compliance Leaders
Investor Relations and Equity Analysts