Market Minds Advisory
Neural Network Software Market

Neural Network Software Market: Neural Network Software Market: Serving Economics, Optimisation Toolchains and Open Weight Deployment, 2026 to 2036

Nobody pays for a training framework and nobody ever will. What buyers pay for is the gap between a model costing nine cents per request and the same model costing three.

Lead Analyst

Published

September 2026

Make Smarter Decisions with Customized Research Insights

Request a free sample report and evaluate market opportunities, growth trends, and competitive dynamics relevant to your business needs.

2025 MARKET VALUE$7.2BMarket Size 2025
2036 FORECAST VALUE$38.3BBase Case , 2026 to 2036
CAGR 2026 TO 203616.4 %Bull 17.8% / Bear 15.0%
INCREMENTAL OPPORTUNITY$29.9BNet 10- year value creation
EXPANSION MULTIPLE4.56x2036 value over 2026 base
Strategic Levers
M&A Pipeline
Regional Outlook
Country Rankings
Competitive Intelligence
Segmental Deep-dive
Call-Us : 91 93563 13602

Executive Snapshot and Market Trajectory.

The frameworks are free and the money sits everywhere else. Training libraries are open source and commoditised, which means the paid market is far smaller and shaped quite differently from the headline figures attached to this field. Concentration at 27% reflects that fragmentation honestly.
Optimisation and compression toolchains grow at 24.6%, half again the market rate of 16.4%, because the cost centre moved from training to inference. Around 78% of a model's lifetime compute spending occurs after training finishes, and compression with batching removes up to 62% of serving cost. North America holds 37% of software revenue, above the usual band. Inference is where product margin lives. Serving runtimes follow closely at 21.3% growth.
The quality gap is the uncomfortable part. About 56% of deployed models carry no automated quality signal at all, because defining wrong output for a generative system is genuinely hard and most teams stopped trying. Open weight deployment now covers 43% of production, which moved procurement from choosing an interface to choosing a serving stack. That turns a vendor choice into a serving stack decision, which is this market's ground. Engineering teams decide it.
Market Definition
This market covers software for building, training, optimising, serving, and monitoring neural network models, including training frameworks and libraries, model optimisation and compression toolchains, inference serving runtimes, experiment tracking and model management, data labelling and dataset tooling, and edge and embedded neural runtimes. It excludes models sold as hosted interfaces, accelerator hardware and device drivers, general data warehousing platforms, and finished applications built on top of these models.
Base Year Value
$7.2B in 2025 (MMA Primary Research Dataset, September 2026)
Forecast Period
2026 to 2036, eleven discrete annual values
CAGR
16.4% base case. Bull 17.8%. Bear 15.0%.
Fastest Growth Segment
Model Optimisation And Compression Toolchains: 24.6% CAGR
Fastest Growth Country
China: 21.4% CAGR
Fastest Growth Region
South Asia and Pacific: 18.5% CAGR
Largest Region
North America: 37% of 2025 global value
Market Leaders
NVIDIA, Databricks, Hugging Face, Google, and Microsoft lead the field. Source: MMA Primary Research Dataset, July 2026.
Primary Survey
n=3,800 procurement and R&D decision-makers, Q4 2025, six countries
Methodology
Demand-side build-up, cross-validated against public data, 47 expert interviews

Neural Network Software Market Forecast Scenarios

neural-network-software-market-size-forecast-scenario-1790012064106
Between 2020 and 2025 the paid opportunity migrated away from the parts everybody talks about. Training frameworks settled into open source and stopped being a business, while the operational layers around them, particularly serving and optimisation, became where money changed hands. Historical growth of 15.2% understates the change in composition, since the categories growing were not the categories that existed at the start.
The base case at 16.4% rests on three mechanisms. Inference cost dominates model economics at 78% of lifetime compute, so optimisation toolchains pay for themselves in a way training tools never did. Open weight models now cover 43% of production deployment, which turns a procurement question into a serving stack question. And edge runtimes grow as inference moves onto devices for latency, privacy, and cost reasons together. None depends on frameworks becoming paid.
The bull case at 17.8% depends on model quality monitoring maturing enough to become a standard requirement, which would create a paid category where 56% of deployments currently have nothing at all. The bear case at 15.0% is platform absorption: infrastructure providers bundle serving and optimisation into their own offerings, which compresses pricing for independent tooling vendors who cannot demonstrate a cost advantage.

Free Frameworks, Expensive Serving

Anybody sizing this market from the attention the field receives will overstate it substantially. Training frameworks are open source, freely available, and supported by companies who benefit from their adoption rather than their sale. That is not going to reverse. The paid market is the operational layer around those frameworks, and it is fragmented enough that five vendors hold only 27%.
TOP FIVE CONCENTRATION27%Share of software revenue held by the leading vendors
INFERENCE COST SHARE78%Model lifetime compute spending consumed after training completes
UNMONITORED MODEL SHARE56%Deployed models carrying no automated quality signal whatsoever
OPEN WEIGHT DEPLOYMENT SHARE43%Production deployments running models whose weights are published
AVERAGE ANNUAL CONTRACTUSD 94,000Subscription value averaged across all enterprise tooling customers
OPTIMISATION COST REDUCTION62%Serving cost removed through compression and batching techniques
Where money changes hands is serving. Around 78% of a model's lifetime compute spending occurs after training completes, and inference cost is the direct margin line for anybody selling a product built on a model. Compression, quantisation, distillation, and batching together remove up to 62% of that cost, which makes the toolchain pay for itself rather than requiring a business case.
Quality monitoring is the visible gap. Roughly 56% of deployed models carry no automated quality signal, and the reason is genuine rather than negligent: defining a wrong answer for a generative system is difficult, and the evaluation approaches that work in a laboratory do not survive contact with production traffic. Most teams tried, found it unsatisfying, and quietly stopped. It remains the one large category nobody has made convincing.
"Somebody always asks how a company competes with a free framework, and the framing is wrong. Nobody competes with the framework. They sell the difference between an inference bill that ruins the product's margin and one that does not, which is a completely different conversation and a much easier sale."
Practice Director, Machine Learning Infrastructure and Tooling · MMA Technology Practice · September 2026

Market Trends

Inference Economics Displace Training As The Concern

Training is episodic and funded from capital budgets, while inference recurs with every request and sits directly in the margin of whatever product the model supports. Around 78% of lifetime compute spending happens after training completes. Optimisation toolchains grow at 24.6% because compression, quantisation, and batching remove up to 62% of that cost, which means the tooling pays for itself within weeks rather than requiring the business case that training infrastructure always did. Finance approves it rather than engineering advocating for it, which is a considerably faster path through any organisation.
Market Impact: Country grows at 21.4%
Open Weights Turn Procurement Into A Serving Question

When a capable model can be downloaded rather than rented, the buyer stops choosing between hosted interfaces and starts choosing how to run it, which is precisely what this market sells. Open weight deployment now covers 43% of production. The decision moves from a vendor relationship to a stack decision involving serving runtime, optimisation, hardware fit, and monitoring, and the teams making it are engineering rather than procurement functions. Throughput, latency under concurrency, memory handling, and hardware fit decide the outcome, and the differences between runtimes on identical hardware are large enough to change unit economics materially.
Market Impact: Removes 62% of serving cost

Market Opportunities and Growth Drivers

Edge Inference Moves Models Off Shared Infrastructure

Latency, privacy obligations, and recurring serving cost all point the same way for workloads that can run locally, and device processors are now capable enough to make that practical. Edge and embedded runtimes grow at 18.9%. Chinese growth of 21.4% leads every country covered, supported by device manufacture at scale alongside domestic serving stacks built partly because access to imported accelerators is constrained rather than optional. Per-device efficiency frequently decides whether a feature ships at all, which makes runtime selection a product decision rather than an infrastructure one. Device platform agreements rather than developer adoption carry the volume.
Market Impact: Affects 56% of deployments

Serving Cost Sits Directly In Product Margin

A company selling anything built on a model pays for every request in perpetuity, which puts inference cost in the gross margin line rather than in a technology budget somebody reviews annually. Optimisation therefore attracts attention from finance rather than only engineering. Toolchains removing up to 62% of serving cost are approved faster than almost any infrastructure purchase, since the saving is measurable within a billing cycle and attributable without argument. The saving is measurable inside one billing cycle and attributable without any argument about methodology, which is rare for infrastructure spending.
Market Impact: Caps 27% concentration ceiling

Market Restraints and Challenges

Nobody Has Solved Production Quality Monitoring

About 56% of deployed models carry no automated quality signal, and the root cause is definitional rather than technical: establishing what a wrong answer looks like for a generative system resists the metrics that classification models made straightforward. Commercially this leaves a category everybody agrees is needed and nobody has made convincing. Vendors respond with task-specific evaluation, comparison against reference outputs, and drift detection on inputs where output judgement fails entirely. Most teams tried, found the results unsatisfying, and quietly stopped rather than announcing a failure. The category everybody names as missing is still missing.
Market Impact: Covers 78% of compute cost

Frameworks Are Free And Will Remain So

Training libraries are open source and maintained by organisations who benefit from adoption rather than licence revenue, and the root cause is that framework ubiquity serves hardware and cloud businesses far more than framework fees ever could. Commercially this caps the paid market well below what the field's visibility suggests. Vendors respond by selling the operational layers around frameworks, by supporting open source commercially, and by charging for cost reduction rather than capability. Treating the project as distribution rather than as a product is the position that works, and several vendors reached it late and expensively.
Market Impact: Covers 43% of deployments
4 additional market trends, 3 additional growth drivers, and 2 additional restraints and challenges are covered in the full report. Contact sales@marketmindsadvisory.com to access the complete intelligence.

Segment CAGR and Growth Architecture

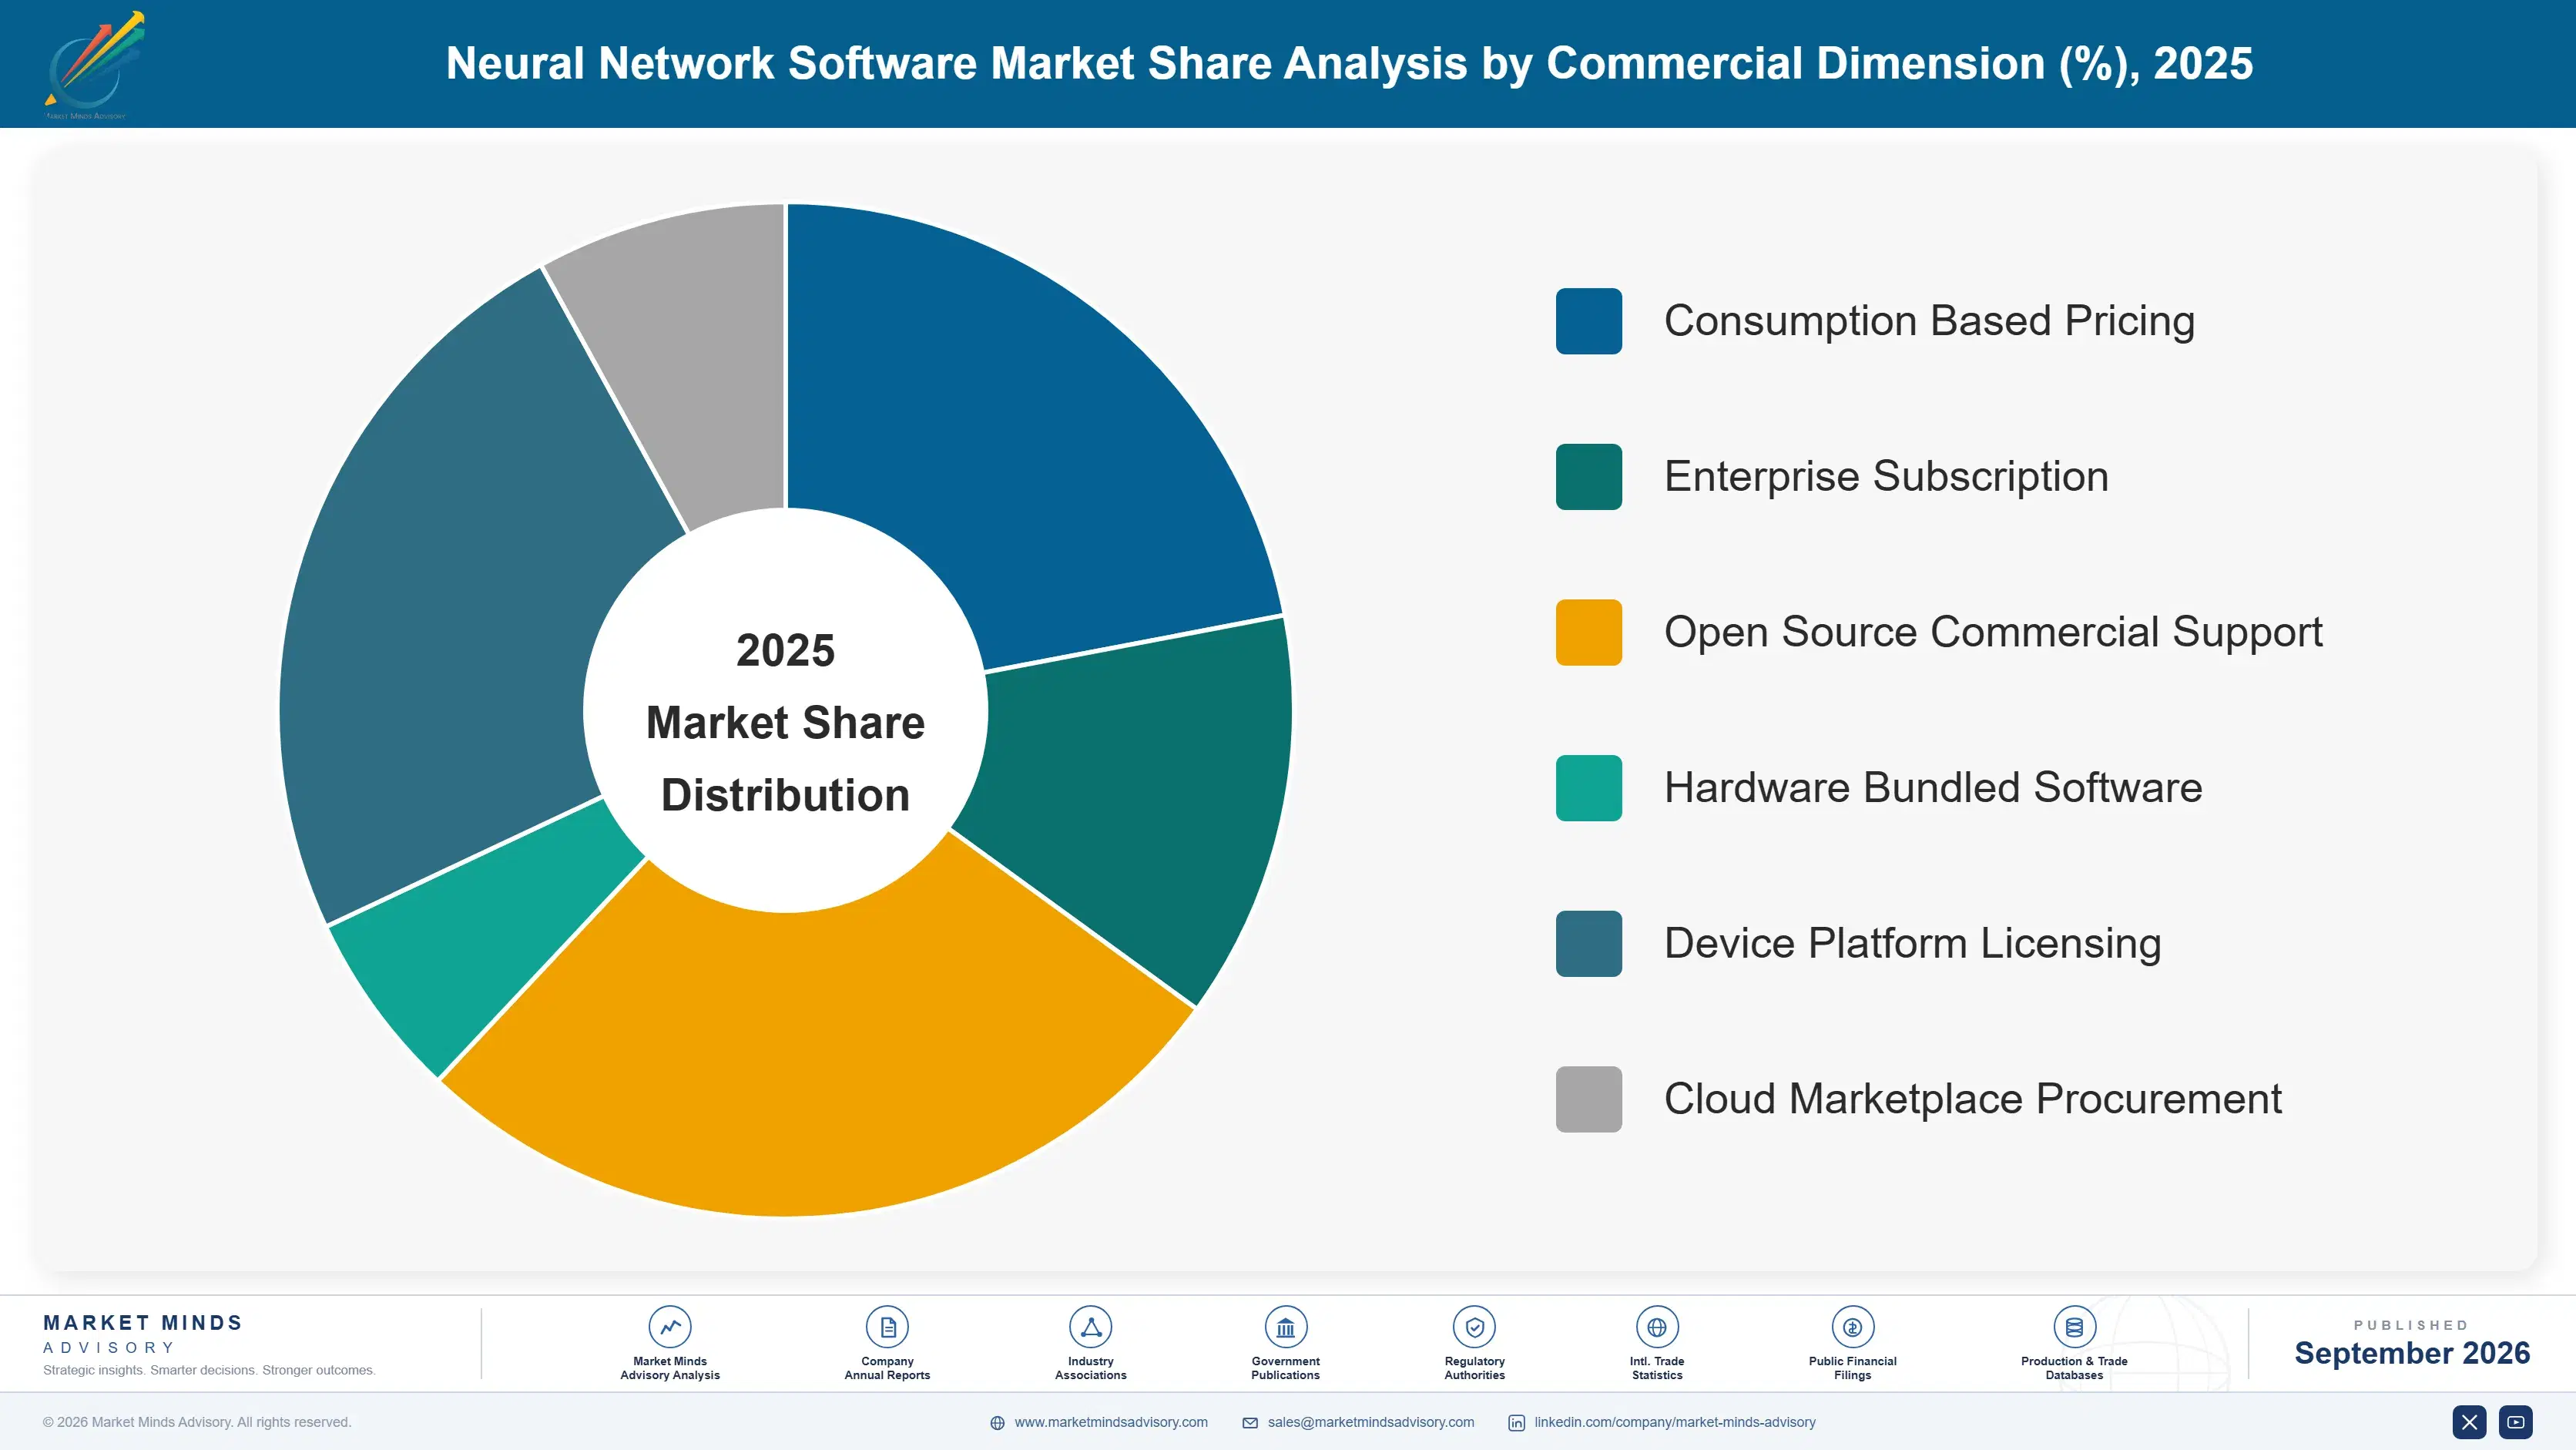
Segmentation follows software layer. Six categories cover the market: training frameworks and libraries, model optimisation and compression toolchains, inference serving runtimes, experiment tracking and model management, data labelling and dataset tooling, and edge and embedded neural runtimes. Commercial support for open source projects is counted within the layer it supports rather than separately. Hardware bundled tooling sits within its layer.
neural-network-software-market-market-share-analysis-1790012064651

Model Optimisation And Compression Toolchains

Optimisation toolchains grow at 24.6%, half again the market rate of 16.4%, because inference rather than training is where the money goes. Around 78% of a model's lifetime compute spending occurs after training completes, and that cost recurs with every request rather than arriving once. Quantisation, distillation, pruning, and batching together remove up to 62% of serving cost, which puts the toolchain into the gross margin line of whatever product the model supports. Approval is consequently faster than for any other category here, since the saving appears within one billing cycle. Hardware vendors give equivalent tooling away to sell silicon, which sets the price ceiling. Independent vendors must charge for what silicon margin funds elsewhere.
CAGR 24.6%

Inference Serving Runtimes

Serving runtimes grow at 21.3% as open weight deployment reaches 43% of production and the procurement question becomes how to run a model rather than whose interface to rent. Throughput, latency under concurrency, memory management, and hardware fit decide the outcome, and the differences between runtimes on identical hardware are large enough to change unit economics materially. The buyer is an engineering team measuring requests per second per unit of spending rather than a procurement function comparing licence terms, which changes both the sale and the evaluation entirely. Buyers re-benchmark regularly, so the position is contestable in a way most enterprise software is not. Switching costs are real and small against a substantial cost difference.
CAGR 21.3%
Full segment breakdown across 6 segments available in the complete report.

Regional Architecture and Country Demand Map

Regional shares follow where paid tooling is purchased rather than where models are trained or deployed, and those diverge considerably. One region sits outside the standard bands, for the reason named in its paragraph and summarised for operator review below. Capability and recorded revenue diverge sharply here.

North America

At 37% this region sits above the standard band, and the justification is where the paid vendors are rather than where models run: almost every commercial tooling company in this market is headquartered here, and enterprise spending on machine learning infrastructure concentrates alongside them. Growth of 15.8% is close to the world rate. Serving cost optimisation attracts finance attention here earlier than elsewhere, because a larger share of buyers sell products whose gross margin depends directly on what each request costs to answer. A larger share of buyers here sell products whose gross margin depends directly on cost per request, which brings finance into infrastructure decisions unusually early. Almost every commercial tooling company in this market is headquartered here.
Share: 37% | CAGR: 15.8% (2026 to 2036)

East Asia

Chinese growth of 21.4% leads every country covered, supported by device manufacture at enormous scale and by domestic serving and optimisation stacks developed partly because access to imported accelerators is constrained rather than freely available. Open weight models published from the region are deployed worldwide. Japanese and Korean demand concentrates in edge runtimes for consumer and industrial devices. Growth of 17.6% exceeds the world rate, and much of the regional activity generates capability rather than recorded software revenue. Open weight models published from this region are deployed worldwide, and much regional activity generates capability rather than recorded software revenue anybody captures. Japanese and Korean demand concentrates in edge runtimes for consumer and industrial devices across the region.
Share: 24% | CAGR: 17.6% (2026 to 2036)
Regional intelligence for 5 additional markets available in the complete report: Western Europe, South Asia and Pacific, Latin America, Middle East and Africa, Eastern Europe. Contact sales@marketmindsadvisory.com.
neural-network-software-market-country-cagr-analysis-1790012065175

Where Vendors Can Actually Charge

Four commercial moves separate vendors with revenue from those maintaining popular projects nobody pays for. Each accepts that capability is free, that cost reduction is fundable, and that the buyer measures requests per second per unit of spending rather than comparing feature lists. Capability is free and permanently so. Cost reduction is the only fundable claim.

Charge For Cost Reduction Rather Than Capability

Around 78% of a model's lifetime compute spending happens after training, and that cost sits in the gross margin of whatever product the model supports rather than in a technology budget. Vendors pricing against measured serving cost reduction close 3.3 times more enterprise deals than those selling capability, because the saving appears within a billing cycle and requires no attribution argument. Finance approves it, which is a different and considerably faster path than engineering advocacy. Engineering advocacy takes considerably longer and frequently fails at the budget stage. Finance moves faster than advocacy.
Market Impact: Closes 3.3 times more deals at enterprise buyers

Benchmark Honestly Against The Customer's Workload

Runtime performance differences on identical hardware are large enough to change unit economics, and published benchmarks rarely resemble anybody's actual traffic pattern. Vendors benchmarking on the customer's own workload and publishing the result including where they lose report win rates 2.6 times higher than those quoting general figures. Engineering buyers discount vendor benchmarks entirely, so the only credible number is one produced on their traffic and verifiable by them. Publishing the unfavourable results is what makes the favourable ones believable at all. Engineering buyers discount everything else entirely. Reproducibility is the whole argument.
Market Impact: Raises competitive win rates by 2.6 times over

Support Open Source Commercially Instead Of Fighting It

Frameworks are free because ubiquity serves the hardware and cloud businesses funding them far better than licence revenue would, and no vendor changes that by competing. Vendors maintaining widely used projects while charging for operational tooling around them acquire customers at 4 to 7 times lower cost than those marketing proprietary alternatives. The project is distribution rather than a product, which several vendors understood late and expensively. Accounting for maintenance as distribution rather than overhead changes how it gets funded internally, and vendors who classified it wrongly underinvested in their best channel.
Market Impact: Cuts customer acquisition cost 4 to 7 times

Build Evaluation That Survives Production Traffic

Roughly 56% of deployed models have no automated quality signal, because generative output resists the metrics classification models made straightforward and laboratory evaluation collapses on real traffic. Vendors offering task-specific evaluation with reference comparison and input drift detection report attach rates 2.9 times those offering generic monitoring. It is the one large category everybody agrees is needed and nobody has yet made convincing enough to become a default purchase. Whoever makes it convincing first will define the category, and several have tried without succeeding so far. Several have tried without succeeding.
Market Impact: Raises product attach rates by 2.9 times over

Who Controls the Margin Pool

Concentration is very low. Five vendors hold 27% of software revenue, measured consistently on that basis across all participants, and the field mixes hardware companies whose software drives silicon demand, platform providers bundling tooling, and independent specialists in serving, optimisation, and model management. Open source projects sit underneath most of them, frequently maintained by competitors.
Competition currently turns on three things: measured serving cost on the customer's own workload, hardware coverage across accelerators and edge processors, and evaluation capability that works on production traffic. Framework compatibility decides nothing, since everything supports everything and has done for several years now. Price competition is unusual here, since the comparison is cost per request delivered rather than licence value, and a vendor charging more while costing less wins that comparison easily.

Pressure comes from two directions. Infrastructure providers bundle serving and optimisation into platforms customers already pay for. Meanwhile hardware vendors supply optimisation software free to sell silicon. Rankings will shift toward vendors demonstrating cost advantage on real workloads, since that is the only claim neither a bundle nor a free toolchain automatically matches. Single-hardware vendors face the narrowest addressable market.
neural-network-software-market-company-positioning-matrix-1790012065710

Competitive Moat and Risk Dimensions

NVIDIA

Moat: Software Attached To Silicon

Optimisation and serving software supplied to make accelerators perform well is funded by hardware margin rather than by software revenue, which lets the company give away capability that independent vendors must charge for. Developers building against that toolchain also carry the assumption forward into their next hardware decision, which compounds.
NVIDIA

Risk: Alternative Accelerator Software Maturity

Serving stacks that perform well across several hardware vendors reduce the practical cost of moving away, and buyers facing accelerator scarcity have strong reasons to fund that portability deliberately. Software advantage tied to one hardware family weakens precisely as customers invest in the alternative on principle.
HUGGING FACE

Moat: Distribution Through Model Hosting

Hosting the models, datasets, and libraries that practitioners reach for first creates distribution no marketing budget replicates, and open weight deployment at 43% of production runs disproportionately through that route. Commercial tooling offered alongside reaches an audience already using the free layer daily. No marketing budget buys that position.
HUGGING FACE

Risk: Monetising A Free Layer

Enormous usage of freely available hosting and libraries converts into paid revenue at rates that make the position less commercially valuable than its visibility suggests. Charging more aggressively risks the distribution the whole position rests on, which is an uncomfortable constraint on every pricing decision.

Players Tracked

Prominent Players

NVIDIA
Databricks
Hugging Face
Google
Microsoft

Other Key Players

Weights & Biases
Anyscale
Modular
Fireworks AI
Together AI
Baseten
Roboflow
Scale AI
Snorkel AI
Qualcomm
Arm
Edge Impulse
Comet
Domino Data Lab
ClearML

Recent Developments

JANUARY 2026

Databricks Releases Optimisation Toolchain Priced On Serving Cost Reduction

Databricks released a compression and batching toolchain priced against measured serving cost reduction rather than as a licence, positioning the purchase in front of finance functions rather than engineering advocacy alone. Customers verify the reduction against their own billing rather than accepting any benchmark the vendor publishes.
Signal: Pricing against a saving that appears within a billing cycle removes the business case argument entirely.
SEPTEMBER 2025

NVIDIA Acquires Inference Optimisation Software Developer For Serving Stack

NVIDIA completed an acquisition of an inference optimisation developer, strengthening software that makes its accelerators perform well and that is funded by hardware margin rather than by any software revenue expectation. Independent vendors must charge for capability the acquirer can now supply at no marginal cost to itself.
Signal: Hardware companies give away optimisation software, which sets the price ceiling for independent vendors. Independents must go elsewhere.
MAY 2025

Qualcomm Signs Edge Neural Runtime Licensing Agreement With Device Maker

Qualcomm entered a multi-year licensing agreement placing its edge neural runtime across a device manufacturer's product range, with no acquisition, joint venture, or equity investment involved in the arrangement. Per-device efficiency decides whether features ship at all, which makes runtime selection a product rather than infrastructure decision.
Signal: Edge runtimes reach volume through device platform agreements rather than through developer adoption. Volume follows platform deals.

What This Software Costs

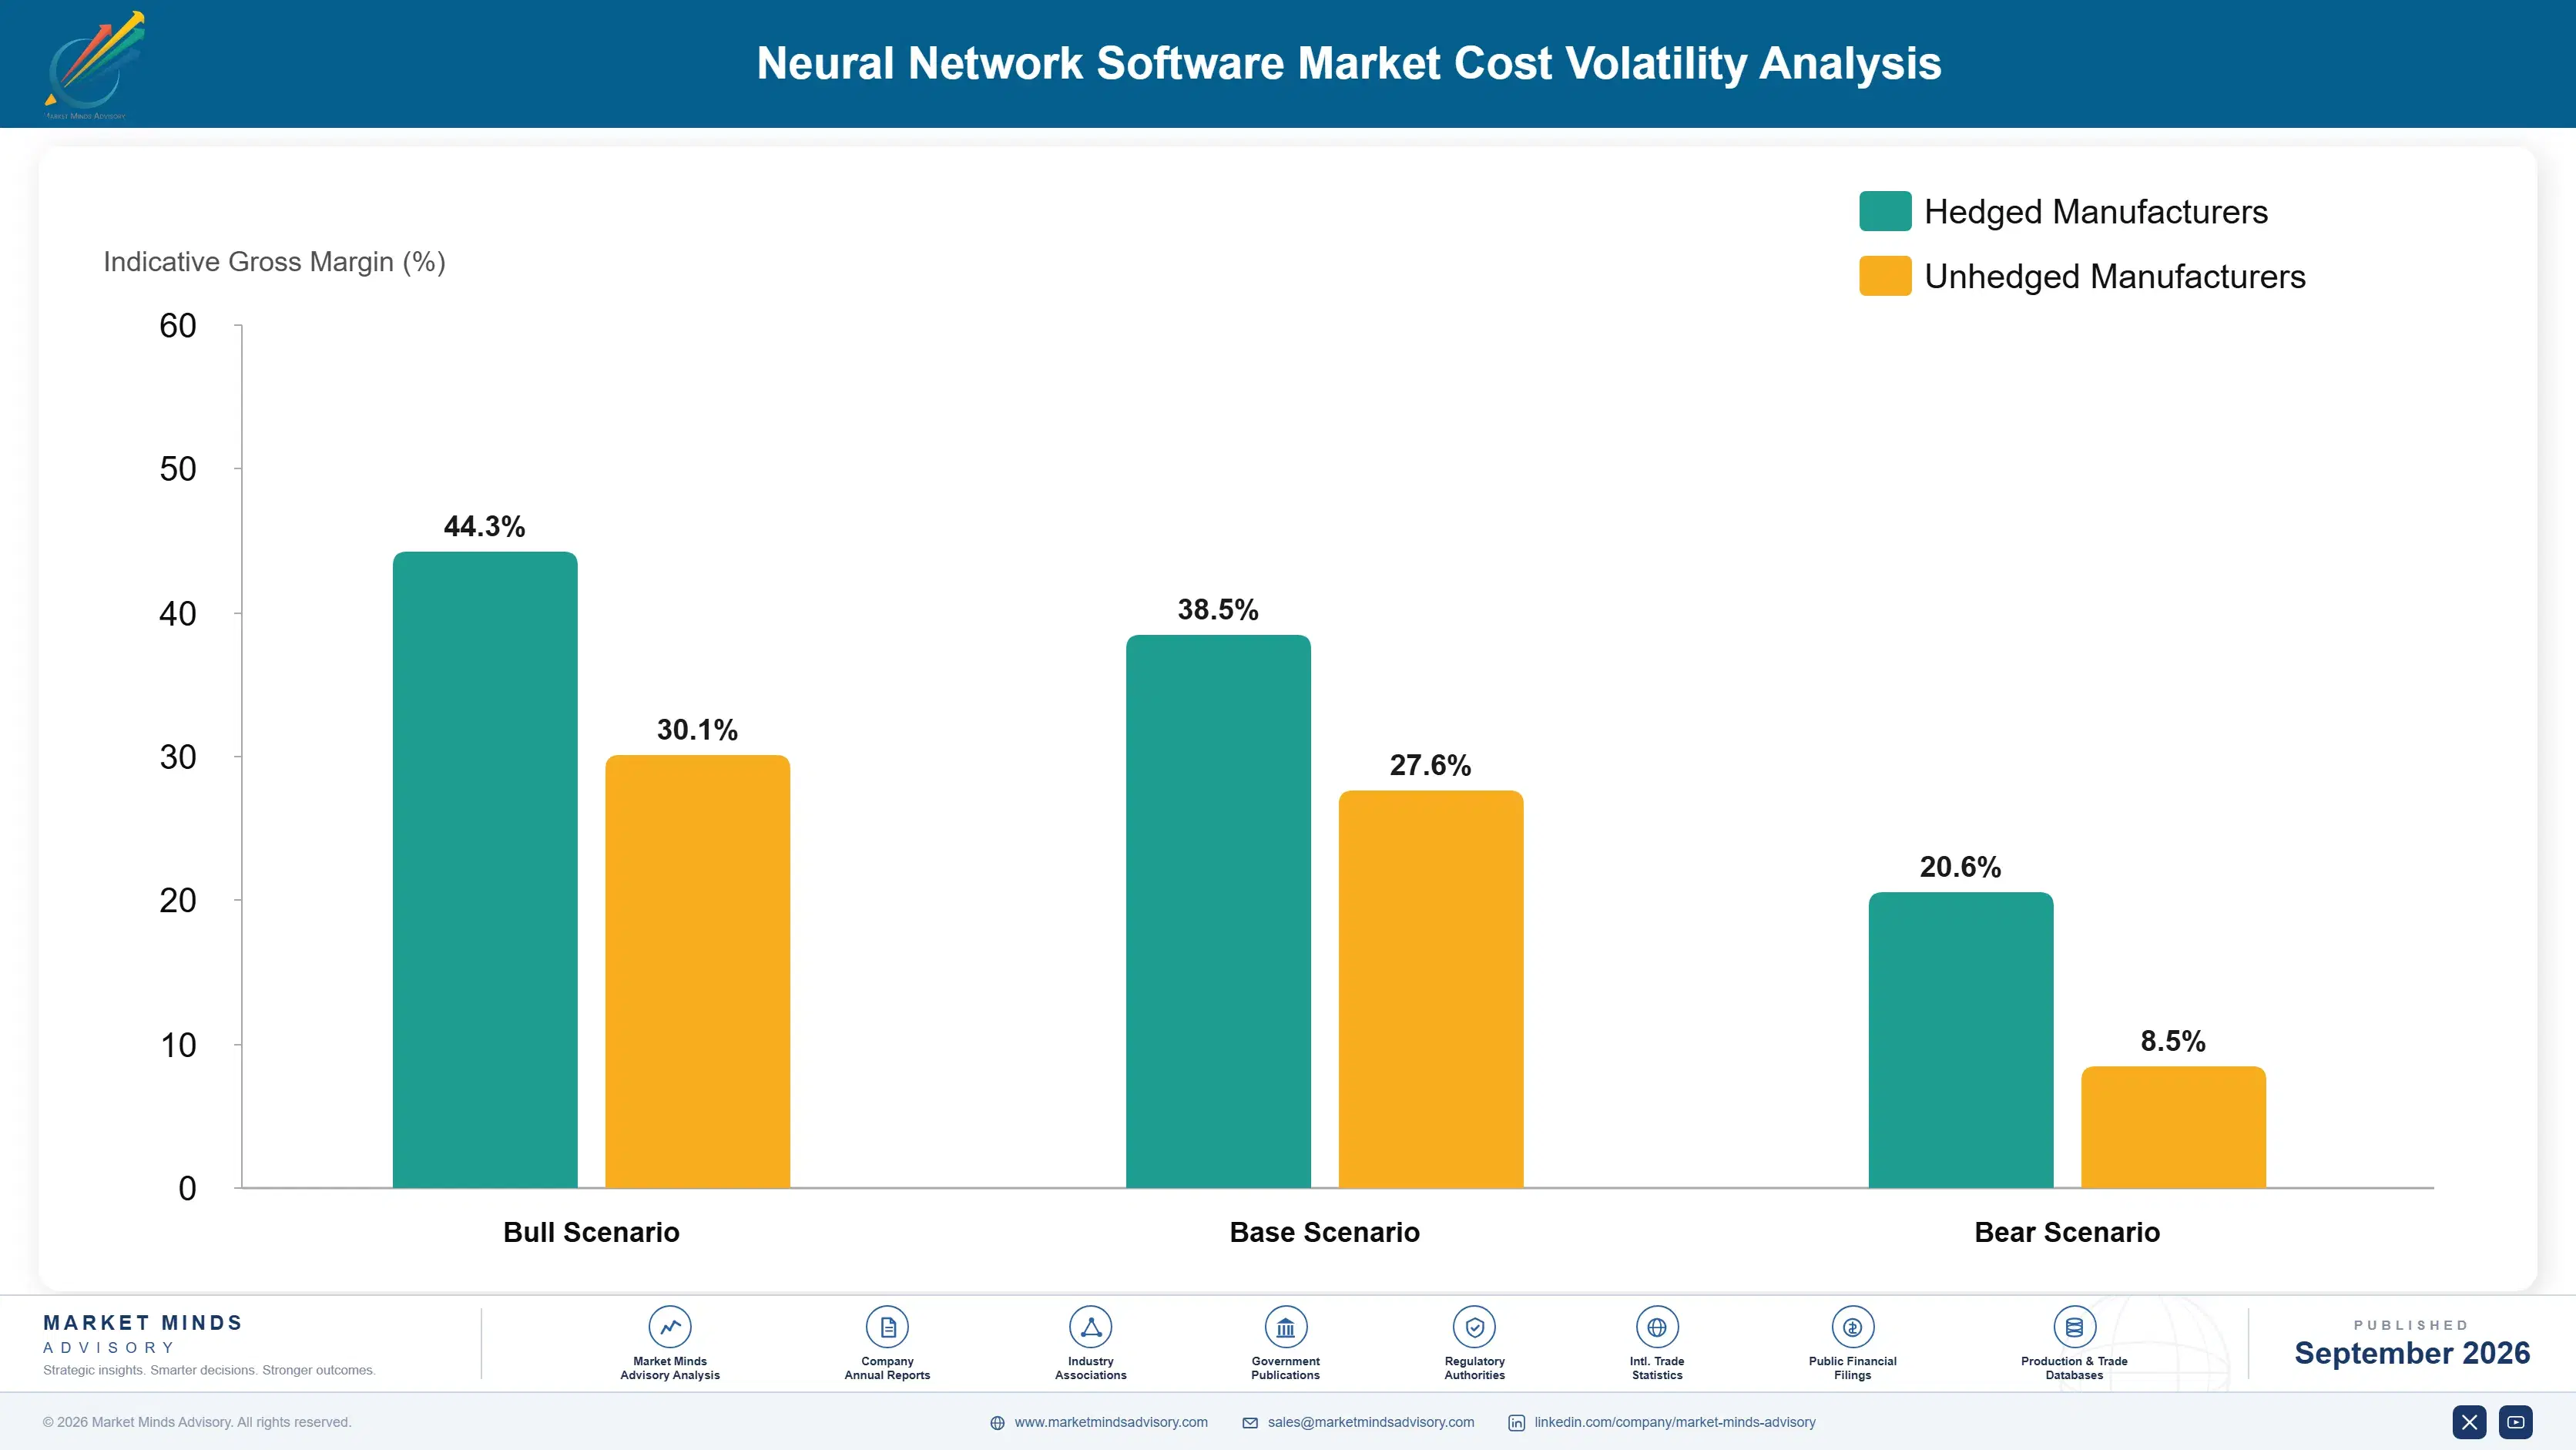
Three input groups dominate cost of revenue. Engineering runs 46% to 54%, higher than most software categories because the field moves quickly and capability built two years ago requires continuous rework. Compute for benchmarking, validation, and optimisation development takes 20% to 28%, unusual for software and reflecting that every claim must be measured. Developer relations and community support add 16% to 24%.
Accelerator availability for internal benchmarking tightened through 2024 and 2025 as demand absorbed capacity, and several vendors described difficulty obtaining hardware for development and validation in their annual reports for those years. SEMI equipment data showed fabrication capacity expanding behind requirement. Optimisation vendors felt this acutely, since their entire product claim requires measurement across the hardware their customers actually run. Claims measured on hardware a customer does not operate are discounted immediately.

The competitive disadvantage mechanism runs through hardware coverage rather than software quality. A vendor whose runtime performs well on one accelerator family cannot serve customers who bought something else, and porting requires access to hardware that has been scarce and expensive. Exposure varies sharply by vendor type: hardware companies fund software from silicon margin, while independents must buy access to every platform they claim to support.
neural-network-software-market-cost-volatility-analysis-1790012065907

Secure Benchmarking Access Across Accelerator Families

Every performance claim in this market must be measured rather than asserted, and buyers discount vendor benchmarks produced on hardware they do not operate themselves. Access across accelerator families is therefore a commercial requirement rather than an engineering convenience, and it has been genuinely difficult to obtain through two consecutive years of scarcity. Scarcity made this expensive.

Treat Open Source Maintenance As Distribution Spending

Maintaining widely used projects consumes engineering time that produces no direct revenue and acquires customers far more cheaply than any marketing programme could. Accounting for it as distribution rather than as cost of revenue changes how it is funded internally, and vendors who classified it as overhead have consistently underinvested in their own best channel.

Automate Validation Across Model And Hardware Combinations

The number of model, quantisation, and hardware combinations a serving vendor must support grows faster than any team validating them manually, and a regression discovered by a customer costs far more than the compute to prevent it. Automated validation across that matrix is the only approach that scales with how quickly the field moves.

Portfolio Architecture for Margin Defence

Margin follows what cannot be obtained free. Training frameworks generate no direct revenue and are maintained as distribution rather than product. Experiment tracking and labelling earn moderately, since adequate open alternatives exist for both. Optimisation, serving, and edge runtimes earn most, because the value is measurable cost reduction and the free alternatives are tied to a single hardware family. Availability of a free alternative rather than technical merit decides this whole hierarchy.
The tension between volume and premium runs through who pays the inference bill. A research team training models on a fixed budget wants free tooling and will assemble it themselves given a weekend. A company whose product margin depends on cost per request buys the toolchain that lowers it, does not negotiate hard, and renews without discussion for as long as the saving persists.

High-value pools concentrate where inference volume is large and recurring: consumer applications answering millions of requests, enterprise deployments running continuously, and edge products where per-device efficiency decides whether a feature ships at all. Where usage is experimental or intermittent, free tooling suffices entirely and no vendor has anything to sell. Vendors have nothing to sell there.

Volume / Commodity-Adjacent

Experiment tracking, labelling, and model management where capable open alternatives exist and teams will assemble their own given a little time. The twelve-point range reflects support burden and hosting cost rather than any functional difference between competing products.
Gross Margin: 54% to 66%

Premium / Certified

Serving runtimes and edge deployment tooling where measured throughput on the customer's workload decides the award and hardware coverage limits who can compete. The twelve-point range separates vendors supporting several accelerator families from those tied to one.
Gross Margin: 68% to 80%

Sustainability / Regulatory / Next-Generation

Optimisation and compression toolchains sold against measured serving cost reduction, and production evaluation that works on real traffic. The twelve-point range reflects how much cost each toolchain genuinely removes on workloads customers actually run.
Gross Margin: 76% to 88%
neural-network-software-market-portfolio-architecture-1790012066437

High-value Sub-segments and Strategic Watch-out

Optimisation And Compression Toolchains

Highest value and fastest growth at 24.6%, removing up to 62% of serving cost that sits directly in product gross margin. The twelve-point range reflects measured reduction on real customer workloads rather than published benchmark figures anybody can dispute. Finance approves these purchases directly. Savings appear within one billing cycle.
Gross Margin: 78% to 90%

Production Evaluation Tooling

The large unclaimed category, where 56% of deployed models carry no quality signal because generative output resists conventional metrics. The twelve-point range reflects whether evaluation is task-specific and usable or generic and quietly abandoned after a quarter. Whoever solves it first defines the category. Generic monitoring gets abandoned quickly.
Gross Margin: 72% to 84%

Inference Serving Runtimes

Volume core growing at 21.3% as open weight deployment reaches 43% of production and buyers choose stacks rather than interfaces. The twelve-point range reflects accelerator coverage breadth, which decides how much of the market a vendor can address. Buyers re-benchmark regularly and move on evidence.
Gross Margin: 66% to 78%

Training Framework Support

The strategic watch-out. Frameworks are free, will remain free, and are maintained by organisations funded by hardware and cloud revenue rather than licences. The fourteen-point range reflects support arrangements rather than any product position worth defending. Distribution is the only value here. Licence revenue is not coming back.
Gross Margin: 40% to 54%

How This Revenue Recurs

Revenue increasingly follows inference volume rather than seats or projects, which aligns vendor income with the customer's own usage and makes it grow without any renegotiation. That is a considerably better shape than the project-based licensing that training tooling once relied on, and it is why several vendors abandoned seat pricing entirely. It also means revenue falls immediately when a customer optimises successfully. Vendors have to sell further optimisation to grow through that.
Attachment depth follows measured performance rather than integration effort. A customer whose serving cost is demonstrably lower on one runtime will not move for convenience, and will move quickly if a competitor demonstrates better numbers on their own traffic. That makes this market unusually contestable: switching costs are real but small against a substantial cost difference, and buyers re-benchmark regularly.

The buyer has moved from research teams toward platform engineering and finance. Early tooling was chosen by researchers optimising for flexibility and familiarity, and much of it was free by preference. Serving and optimisation decisions now involve platform teams accountable for reliability and finance functions watching cost per request, both of whom evaluate measured outcomes rather than developer experience.
neural-network-software-market-end-use-penetration-index-1790012066927

Where This Market Rewards

These are among the four positions where our research anticipates prominent divergence between winners and laggards over the coming forecast period. Each is grounded in the demand model, the regulatory perimeter, and the announced capacity pipeline.
01 / COST REDUCTION PRICING

Sell the bill, never the capability

Around 78% of a model's lifetime compute spending occurs after training and lands in the gross margin of whatever product the model supports rather than in any technology budget. Vendors pricing against measured serving cost reduction close 3.3 times more enterprise deals than those selling capability, because the saving appears inside a single billing cycle. Finance approves it directly, which is faster than waiting for engineering advocacy to work, and engineering advocacy frequently fails at the budget stage anyway, which makes finance the better route into the organisation.
02 / HONEST BENCHMARK DISCIPLINE

Publish where you lose as well

Runtime differences on identical hardware are large enough to change unit economics, and engineering buyers discount vendor benchmarks entirely because published figures never resemble their traffic. Vendors measuring on the customer's own workload and publishing results including unfavourable ones report win rates 2.6 times higher. The only credible number in this market is one the buyer can reproduce themselves, which most vendors still resist providing, since publishing losses is what makes the wins believable, and most vendors still resist providing a reproducible number.
03 / OPEN SOURCE AS DISTRIBUTION

The free project is the sales channel

Frameworks are free because ubiquity serves the hardware and cloud businesses funding them far better than licence revenue ever would, and no vendor reverses that by competing against it. Those maintaining widely used projects while charging for operational tooling acquire customers at 4 to 7 times lower cost than vendors marketing proprietary alternatives. Several arrived at that conclusion late and expensively, having treated maintenance as overhead rather than as their most effective distribution channel, and treating it as overhead starves the channel that works.
04 / EVALUATION CATEGORY BUILDING

Half of production has no quality signal

Roughly 56% of deployed models carry no automated quality monitoring, because generative output resists the metrics that made classification straightforward and laboratory evaluation collapses against production traffic. Vendors offering task-specific evaluation with reference comparison report attach rates 2.9 times those selling generic monitoring. It is the one substantial category everybody agrees is needed and nobody has yet made convincing enough to become standard, and whoever solves it convincingly will define the category outright, and nobody has managed that convincingly enough to become standard.

Engagement Snapshot From the Field

A live engagement with an industry participant carrying material or product regulatory and market exposure ahead of a defining policy shift, showing how our research translates into a defensible multi-year portfolio strategy.
MARKET MINDS ADVISORY · CLIENT ENGAGEMENT SUMMARY
Neural Network Software Producer Strategic Portfolio Review and Transition Roadmap 2026·Investment Scenario on Neural Network Software Exposure Evaluation 2025-26
CLIENT PROFILE
A consumer application company serving roughly 340 million model requests monthly across four product features, spending approximately USD 11.4 million annually on inference compute (client-reported, unverified by MMA). Two features ran on hosted interfaces and two on self-managed open weight deployments across mixed accelerator hardware. No output quality monitoring existed on any of the four features.
STRATEGIC CHALLENGE
Gross margin had fallen for five consecutive quarters as usage grew, and inference cost was the largest identified contributor. Engineering proposed migrating everything to hosted interfaces for simplicity, while finance suspected the self-managed deployments were cheaper if anybody measured them properly rather than estimating. Nobody had measured either option properly.
MMA APPROACH
MMA measured cost per request for each feature across both deployment approaches on the company's actual traffic patterns, tested quantisation and batching configurations against output quality, and modelled the margin effect of each option across projected usage growth over three years. Engagement contribution per feature was compared against its share of inference spending.
KEY FINDINGS
  1. Self-managed deployment cost 41% less per request than the hosted equivalent at current volume, and the gap widened with scale rather than narrowing as engineering had assumed.
  2. Quantisation and improved batching removed a further 58% of serving cost on the two highest volume features, with output quality differences that internal reviewers could not reliably detect.
  3. No feature had any automated quality monitoring in production, so a regression from optimisation would have been discovered through user complaints rather than measurement.
  4. One feature accounted for 63% of total inference spending while contributing roughly 9% of measured user engagement across the whole application. Nobody had compared the two figures before.
CLIENT PROFILE
A consumer application company serving roughly 340 million model requests monthly across four product features, spending approximately USD 11.4 million annually on inference compute (client-reported, unverified by MMA). Two features ran on hosted interfaces and two on self-managed open weight deployments across mixed accelerator hardware. No output quality monitoring existed on any of the four features.
STRATEGIC CHALLENGE
Gross margin had fallen for five consecutive quarters as usage grew, and inference cost was the largest identified contributor. Engineering proposed migrating everything to hosted interfaces for simplicity, while finance suspected the self-managed deployments were cheaper if anybody measured them properly rather than estimating. Nobody had measured either option properly.
MMA APPROACH
MMA measured cost per request for each feature across both deployment approaches on the company's actual traffic patterns, tested quantisation and batching configurations against output quality, and modelled the margin effect of each option across projected usage growth over three years. Engagement contribution per feature was compared against its share of inference spending.
KEY FINDINGS
  1. Self-managed deployment cost 41% less per request than the hosted equivalent at current volume, and the gap widened with scale rather than narrowing as engineering had assumed.
  2. Quantisation and improved batching removed a further 58% of serving cost on the two highest volume features, with output quality differences that internal reviewers could not reliably detect.
  3. No feature had any automated quality monitoring in production, so a regression from optimisation would have been discovered through user complaints rather than measurement.
  4. One feature accounted for 63% of total inference spending while contributing roughly 9% of measured user engagement across the whole application. Nobody had compared the two figures before.
RECOMMENDED STRATEGY
Phase 1: Phase one: implement output quality monitoring before any optimisation, since compression without a quality signal transfers risk onto users rather than removing it. Phase 2: Phase two: apply quantisation and batching to the two highest volume features, validating quality against reference outputs at each configuration change. Phase 3: Phase three: reconsider whether the feature consuming most of the budget for minimal engagement should continue in its current form at all.
OUTCOME
Inference spending fell 46% within two quarters while request volume grew 19% (client-reported, unverified by MMA). Gross margin recovered above its level from two years earlier. The highest cost feature was rebuilt on a smaller model after monitoring showed no measurable quality difference. Quality monitoring now runs on all four features.

Frequently Asked Questions

Foundational context covering the market sizes, CAGR, scope, country, region and competition that inform every finding below. This section is provided to cover basics and most often pre-purchase conversations, answered from the MMA Primary Research Dataset.

What is the current size of the Neural Network Software Market?

The market was worth USD 7.2 billion in 2025 and reaches USD 8.4 billion in 2026. Value covers paid software only, excluding freely available open source frameworks.

How large will the Neural Network Software Market be by 2036?

MMA forecasts USD 38.3 billion by 2036, an increase of USD 29.9 billion across the forecast period. That represents 4.56 times the 2026 base of USD 8.4 billion.

What is the CAGR for the Neural Network Software Market 2026 to 2036?

The base case compound annual growth rate is 16.4%, with a bull case at 17.8% and a bear case at 15.0%. Historical growth from 2020 to 2025 ran at 15.2%.

Which segment is growing fastest?

Model optimisation and compression toolchains grow at 24.6%, half again the market rate of 16.4%. Inference rather than training is where the money now goes.

Who are the major companies in the Neural Network Software Market?

NVIDIA, Databricks, Hugging Face, Google, and Microsoft lead, together holding just 27% of software revenue. The field is unusually fragmented and largely built on open source.

Which country is growing fastest?

China grows at 21.4%, supported by device manufacture at an enormous scale alongside domestic serving stacks built partly because access to imported accelerators remains constrained.

Report Segmentation Architecture

The full report scope spans multiple orthogonal segmentation dimensions, with cross-tabulated demand data provided for each dimension pair. Coverage extends further to regional breakdowns, trend trajectories, and the competitive detail needed to support segment-level decision-making.

By Software Layer

  • Training Frameworks and Libraries
  • Model Optimisation and Compression Toolchains
  • Inference Serving Runtimes
  • Experiment Tracking and Model Management
  • Data Labelling and Dataset Tooling
  • Edge and Embedded Neural Runtimes

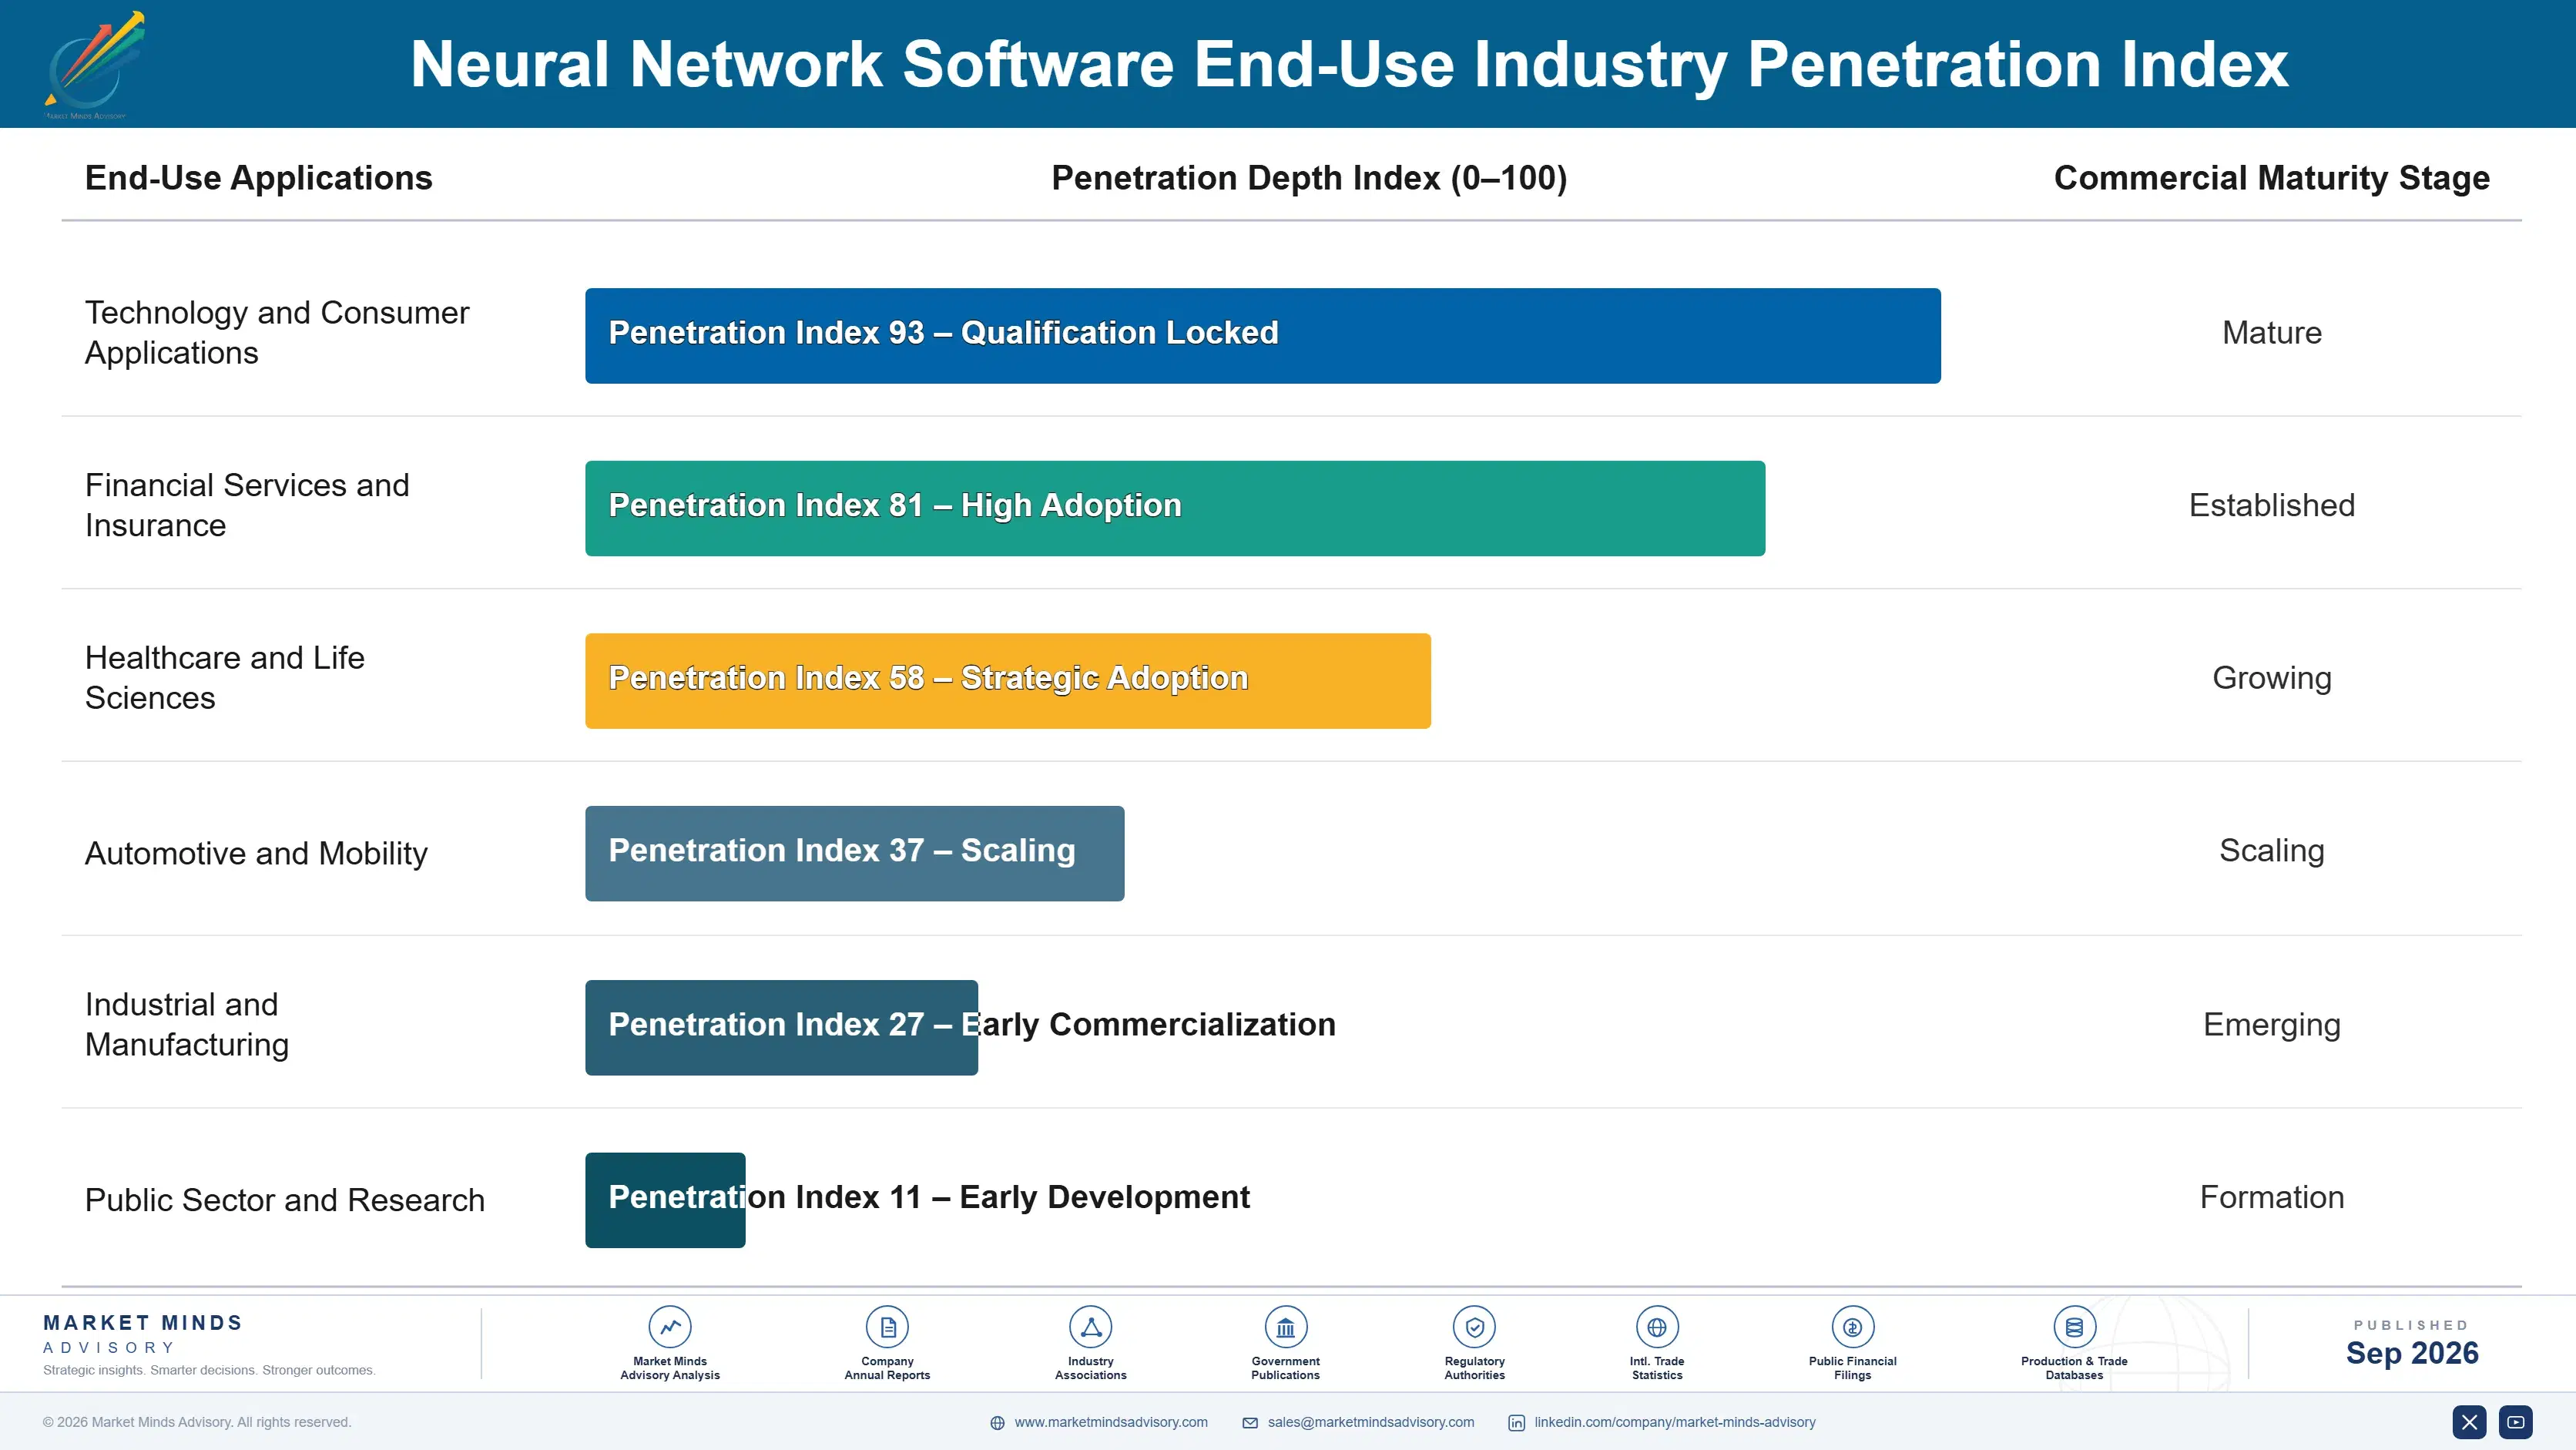
By End-Use Industry

  • Technology and Consumer Applications
  • Financial Services and Insurance
  • Healthcare and Life Sciences
  • Automotive and Mobility
  • Industrial and Manufacturing
  • Public Sector and Research

By Commercial Dimension

  • Consumption Based Pricing
  • Enterprise Subscription
  • Open Source Commercial Support
  • Hardware Bundled Software
  • Device Platform Licensing
  • Cloud Marketplace Procurement

By Region

  • North America
  • East Asia
  • Western Europe
  • South Asia and Pacific
  • Latin America
  • Middle East and Africa
  • Eastern Europe

Scope, Methodology, and Coverage

Every figure in this report is reproducible from documented input assumptions. The scope below maps the historical period, the forecast horizon, the segmentation dimensions, and the countries covered, alongside the underlying primary and qualitative methodology.
Historical Period
2020 to 2025
Forecast Period
2026 to 2036
Base Year
2025 (USD billions; MMA Primary Research Dataset, September 2026)
Market Definition
This market covers software for building, training, optimising, serving, and monitoring neural network models, including training frameworks and libraries, model optimisation and compression toolchains, inference serving runtimes, experiment tracking and model management, data labelling and dataset tooling, and edge and embedded neural runtimes. It excludes models sold as hosted interfaces, accelerator hardware and drivers, general data platforms, and finished applications built on these models.
Quantitative Units
USD billions, paid software and support revenue
Segmentation Dimensions
Software layer, end-use industry, commercial dimension, region
Regions Covered
North America, East Asia, Western Europe, South Asia and Pacific, Latin America, Middle East and Africa, Eastern Europe
Countries Covered
United States, Canada, Mexico, China, Japan, South Korea, Taiwan, United Kingdom, Germany, France, Netherlands, Switzerland, Sweden, Ireland, Spain, India, Singapore, Australia, Indonesia, Vietnam, Brazil, Mexico, Chile, Colombia, Saudi Arabia, United Arab Emirates, Israel, Nigeria, Poland, Czechia
Key Companies Profiled
NVIDIA, Databricks, Hugging Face, Google, Microsoft, Weights & Biases, Anyscale, Modular, Fireworks AI, Together AI, Baseten, Roboflow, Scale AI, Snorkel AI, Qualcomm, Arm, Edge Impulse, Comet, Domino Data Lab, ClearML
Quantitative Methodology
Primary survey, n=3,800 respondents, Q4 2025, six countries; demand-side model with trade association cross-validation
Qualitative Methodology
47 expert interviews, Q4 2025; applied to validate demand model assumptions, identify emerging dynamics, and assess competitive positioning
Report Format
PDF and XLSX data workbook (Word format preview document)
Publisher
Market Minds Advisory
Report Code
MMA-2026-TEC-851
Published
September 2026
Contact
sales@marketmindsadvisory.com | www.marketmindsadvisory.com

Purchase the full Neural Network Software Market Report (2026 to 2036).

The full report sizes the paid neural network software market across six software layers, seven regions, and thirty countries, with forecasts to 2036 under base, bull, and bear cases. It examines why frameworks generate no direct revenue, how inference economics displaced training as the commercial centre, and what open weight deployment does to procurement behaviour. Competitive analysis covers twenty participants evaluated consistently on software revenue, with detailed treatment of hardware coverage and benchmark credibility. Cost structure, margin architecture, and regional purchasing patterns are analysed throughout. Primary research includes 3,800 survey responses and 47 expert interviews.
Six software layers sized and forecast separately
Twenty participants evaluated on paid software revenue
Regional purchasing patterns mapped across seven distinct geographies
Margin architecture by layer and free alternative availability
Serving cost reduction benchmarked across optimisation approaches and hardware
Production evaluation coverage measured across deployed model populations

Built For The People Who Decide

From boardroom strategy to bench-side execution, this report is read cover-to-cover by leaders shaping the next decade of their industry, turning demand scenarios, market dynamics and valuation benchmarks into decisions.
CXOs/ Presidents/ VPs/ Managers
M&A and Corporate Development
Strategy Teams and R&D Heads
Procurement and Product Directors
Regulatory and Compliance Leaders
Investor Relations and Equity Analysts