Market Minds Advisory
Network Optimization Market

Network Optimization Market: Network Optimization Market. AI Automation Replaces Manual Network Tuning

Enterprise networks generate more telemetry than human engineers can parse in real time, pushing operators toward AI-driven automation that decides and remediates issues faster than any manual escalation process ever could.

Lead Analyst

Published

September 2026

Make Smarter Decisions with Customized Research Insights

Request a free sample report and evaluate market opportunities, growth trends, and competitive dynamics relevant to your business needs.

2025 MARKET VALUE$18.6BMarket Size 2025
2036 FORECAST VALUE$57.5BBase Case , 2026 to 2036
CAGR 2026 TO 203610.8 %Bull 12.1% / Bear 9.5%
INCREMENTAL OPPORTUNITY$36.9BNet 10- year value creation
EXPANSION MULTIPLE2.79x2036 value over 2026 base
Strategic Levers
M&A Pipeline
Regional Outlook
Country Rankings
Competitive Intelligence
Segmental Deep-dive
Call-Us : 91 93563 13602

Executive Snapshot and Market Trajectory.

Network telemetry volumes have outgrown what human engineers can manually triage, forcing enterprises toward AI-driven optimization platforms that detect and remediate issues before they escalate into customer-facing outages across increasingly distributed, multi-cloud network environments worldwide this year at a pace few security teams anticipated.
SD-WAN and SASE architectures are generating traffic patterns far more dynamic than legacy static routing could handle, pushing enterprises toward continuous, automated optimization rather than periodic manual tuning. Adoption is fastest among technology and telecommunications companies across North America and East Asia running large, distributed multi-cloud network architectures. Application performance guarantees tied to service-level agreements are pulling budget toward proactive optimization tools rather than reactive troubleshooting after service degradation has already reached end users.
Network equipment vendors and dedicated software specialists are converging on the same enterprise accounts, each embedding machine learning models that predict congestion before it occurs rather than reacting after service degradation begins. Rising bandwidth costs tied to video and AI workload traffic growth are accelerating adoption of tools that squeeze more throughput from existing infrastructure investment rather than funding costly capacity expansion across already strained data center budgets.
Market Definition
This report defines the Network Optimization Market as software platforms and services that monitor, analyze, and automatically improve network performance, including AI-driven traffic management, SD-WAN optimization, and network automation tools. It excludes network security products without dedicated performance optimization capability, physical networking hardware sold without bundled optimization software, and general IT service management platforms.
Base Year Value
$18.6B in 2025 (MMA Primary Research Dataset, September 2026)
Forecast Period
2026 to 2036, eleven discrete annual values
CAGR
10.8% base case. Bull 12.1%. Bear 9.5%.
Fastest Growth Segment
AI-Driven AIOps and Self-Healing Network Platforms: 16.9% CAGR
Fastest Growth Country
India: 14.8% CAGR
Fastest Growth Region
South Asia and Pacific: 12.9% CAGR
Largest Region
North America: 32% of 2025 global value
Market Leaders
Cisco, VMware, Juniper Networks, Riverbed, and Aruba Networks lead the competitive field. Source: MMA Primary Research Dataset, July 2026.
Primary Survey
n=3,800 procurement and R&D decision-makers, Q4 2025, six countries
Methodology
Demand-side build-up, cross-validated against public data, 47 expert interviews

Network Optimization Market Forecast Scenarios

network-optimization-market-size-forecast-scenario-1789998919349
Between 2020 and 2025, network optimization adoption grew steadily at a 9.8% historical CAGR as enterprises modernized wide-area network architecture around SD-WAN, generating demand for tools managing more dynamic traffic patterns. Growth was concentrated among large enterprises with distributed branch networks, while smaller organizations relied on managed service providers to handle optimization instead of buying platforms directly.
The base case assumes continued strong growth through 2036 as three mechanisms compound: network telemetry volumes keep expanding beyond what manual triage can handle, SASE and multi-cloud architectures keep generating traffic patterns requiring continuous automated tuning, and application performance guarantees keep pulling enterprise budget toward proactive optimization rather than reactive troubleshooting. Vendor consolidation around unified network observability platforms further supports sustained enterprise adoption across most verticals through the middle years of the forecast window.
The bull case centers on accelerated AI workload traffic growth forcing faster optimization tool adoption across data center operators, which could push growth toward 12.1%. The bear case assumes enterprise IT budget compression during a macroeconomic downturn delays network platform refreshes, pulling growth toward 9.5% as organizations extend existing contracts instead of upgrading their network optimization stacks.

From Manual Tuning to Predictive Network Automation

Network optimization has moved from a periodic manual tuning exercise into a continuous, automated discipline as telemetry volumes exceeded what human engineers could process in real time across increasingly complex network topologies spanning cloud, branch, and data center environments simultaneously across nearly every industry vertical tracked in this analysis, from finance to manufacturing to retail and logistics alike.
MARKET CONCENTRATIONCR5: 42%Top five vendors together hold under half of global share
AVERAGE CONTRACT VALUE$210K per enterprise deploymentAnnual platform contract for mid-size enterprise deployment typically
AI AUTOMATION SHARE41% of new deploymentsShare of new deployments including predictive automation capability today
RENEWAL RATE88% annual renewalShare of enterprise customers renewing existing optimization platform contracts
DEPLOYMENT CYCLE3 to 5 monthsTypical enterprise procurement through full production deployment timeline
BANDWIDTH EFFICIENCY GAIN18 to 24% reportedAverage throughput improvement enterprises report after platform deployment
Vendors are racing to embed predictive machine learning models that forecast congestion before it degrades application performance, a shift that favors software-native platforms over hardware-anchored appliances built for a less dynamic era of networking. SD-WAN and SASE architectures are gaining share fastest among enterprises operating distributed, multi-cloud infrastructure across several regions and cloud providers simultaneously across different geographic regions and regulatory jurisdictions worldwide.
Pricing is shifting from perpetual licenses toward consumption-based subscription models tied to managed bandwidth volume, which lowers entry cost for mid-market buyers but compresses vendor margins on the largest accounts significantly. Consolidation pressure is building as network performance specialists merge with broader observability platform vendors seeking unified telemetry coverage across application, network, and infrastructure layers within a single unified management console rather than several disconnected dashboards.
"Enterprises used to tune networks after something broke. Now the platforms that win are the ones that fix problems before anyone notices them. That shift changes who gets budget and who does not."
Senior Analyst, Network Infrastructure Practice · MMA Technology Practice · September 2026

Market Trends

AIOps Platforms Predict Congestion Before It Occurs

Machine learning models trained on historical traffic patterns are increasingly able to forecast network congestion hours before it materializes, letting operators reroute traffic proactively rather than reacting after application performance already degrades. This predictive capability represents a fundamental shift from the threshold-based alerting that defined network monitoring for the past two decades. Vendors are racing to prove prediction accuracy against real enterprise traffic rather than curated demonstration datasets, with several announcing dedicated AIOps modules within the past year targeting large enterprise accounts specifically that generate the highest volume of usable historical traffic data.
Market Impact: East-west traffic up 40% yearly

SASE Convergence Reshapes Optimization Product Requirements

Enterprises consolidating security and networking functions under secure access service edge architecture are demanding optimization tools that work natively within converged SASE platforms rather than as separate, bolt-on point solutions. This convergence is forcing standalone network optimization vendors to either integrate deeply with SASE platform providers or risk being displaced entirely as enterprises consolidate vendor relationships. Several established networking vendors have announced native optimization capability embedded directly within their SASE product lines this past year rather than sold as separate add-on modules requiring additional integration effort from customers already managing several disparate networking tools.
Market Impact: SLA-driven deals up 29% yearly

Market Opportunities and Growth Drivers

AI Workload Traffic Growth Strains Existing Bandwidth

Enterprise AI workload deployment is generating east-west traffic growth of roughly 40% year over year inside data centers, straining network capacity faster than most organizations can justify new infrastructure spending to match. Optimization platforms that squeeze additional throughput from existing bandwidth are becoming a cost-effective alternative to capacity expansion, particularly for enterprises facing budget constraints on new hardware procurement. Vendors report AI-driven workloads as the single fastest-growing driver of new customer inquiries this year across most account segments this quarter, a trend expected to continue accelerating well into the next several product cycles.
Market Impact: Legacy gaps add 8 weeks deployment

Application SLA Penalties Push Proactive Optimization

Enterprises facing contractual service-level agreement penalties for application downtime are increasingly willing to pay premium pricing for optimization platforms that prevent degradation before it triggers financial penalties, rather than tools that merely alert after problems begin. Financial services and e-commerce companies show the strongest willingness to pay given the direct revenue impact of even brief outages during peak transaction periods. This dynamic is pulling budget away from reactive monitoring tools toward proactive, predictive optimization platforms specifically built to prevent revenue-impacting outages before they occur and trigger costly contractual penalty clauses.
Market Impact: Skills gap delays ROI 6 months

Market Restraints and Challenges

Legacy Infrastructure Integration Slows Platform Rollout

Many enterprises still operate substantial legacy network infrastructure that lacks the telemetry export capability modern optimization platforms require, forcing costly hardware upgrades before software benefits can be realized fully. The root cause is a multi-decade gap between network hardware refresh cycles and the pace of software innovation in the optimization space. The commercial impact is extended deployment timelines and delayed return on investment. Vendors are mitigating the gap through lightweight telemetry collectors that bridge legacy hardware without requiring full infrastructure replacement across every branch office, campus, and data center site enterprises operate.
Market Impact: Prediction accuracy exceeds 85% claimed

Skilled Network Engineering Talent Remains Scarce

Organizations lack sufficient trained network engineers capable of configuring and interpreting output from advanced AI-driven optimization platforms, limiting how effectively enterprises can extract value from their platform investment. The root cause is a persistent gap between network engineering education programs and the specialized skills required for AI-augmented network operations. The commercial impact includes underutilized platform capability and slower realized return on investment. Vendors are responding by simplifying user interfaces and offering managed optimization services that reduce the internal expertise burden on already stretched IT operations teams facing competing modernization priorities.
Market Impact: SASE-native deals up 27% yearly
4 additional market trends, 3 additional growth drivers, and 4 additional restraints and challenges are covered in the full report. Contact sales@marketmindsadvisory.com to access the complete intelligence.

Segment CAGR and Growth Architecture

The market splits across six categories spanning automation architecture, deployment model, and service delivery across the full enterprise networking stack. AI-driven AIOps platforms and SD-WAN optimization solutions are growing fastest as enterprises replace manual network tuning with predictive, software-defined optimization built for distributed multi-cloud environments that legacy static routing was never designed to serve.
Section default visual

AI-Driven AIOps and Self-Healing Network Platforms

AI-driven AIOps and self-healing network platforms use machine learning models trained on historical traffic patterns to predict congestion and automatically remediate issues before they affect application performance. Growth is concentrated among technology and financial services enterprises operating complex, distributed multi-cloud infrastructure that manual monitoring cannot adequately cover. Vendors in this category compete primarily on prediction accuracy against real production traffic and on the breadth of automated remediation actions available without requiring human approval for every routine network change, a capability few competitors have proven at enterprise scale across a broad enough range of network topologies, traffic types, enterprise scale profiles, and underlying cloud provider architectures spanning public, private, and hybrid deployment models.
CAGR 16.9%

SD-WAN Optimization Solutions

SD-WAN optimization solutions manage traffic routing across wide-area network connections spanning branch offices, data centers, and cloud environments, replacing static routing policies with dynamic, application-aware path selection. Adoption is accelerating fastest inside retail and distributed enterprise verticals operating hundreds of branch locations requiring consistent application performance regardless of underlying connection quality. Vendors differentiate on integration breadth with existing SASE platforms, deployment simplicity, and their track record maintaining performance during last-mile connectivity disruptions that would otherwise degrade customer-facing application performance across geographically dispersed store networks spanning hundreds or thousands of individual retail locations across multiple countries, time zones, and last-mile connectivity providers with widely varying service quality levels and reliability guarantees.
CAGR 13.4%
Full segment breakdown across 7 segments available in the complete report.

Regional Architecture and Country Demand Map

Regional adoption tracks enterprise network complexity and cloud infrastructure maturity closely across the seven markets covered in this report. North America and East Asia lead on absolute spend, while South Asia and Pacific posts the fastest growth as digital infrastructure investment expands rapidly across the region's largest technology hubs.

North America

Enterprise IT organizations across the United States and Canada carry the deepest existing network optimization deployments globally, driven by early SD-WAN adoption and the concentration of large technology and financial services headquarters in the region. Hyperscale data center operators continue to push optimization vendors toward AI-driven capability given the scale of east-west traffic they manage daily. Cloud provider partnerships headquartered in the region are accelerating native optimization integration into broader infrastructure platforms, cementing North America's position as the primary proving ground for new product capability across most vendor roadmaps, a lead that shows no sign of narrowing over the near term across most enterprise segments and industry verticals tracked in this analysis.
Share: 32% | CAGR: 12.0% (2026 to 2036)

East Asia

China, Japan, and South Korea together host a dense concentration of technology and manufacturing enterprises rebuilding network infrastructure around domestic cloud platforms and 5G backhaul requirements. Government-backed digital infrastructure programs across the region are compelling telecommunications operators to deploy optimization capability as a baseline requirement rather than an optional upgrade. Local vendors are gaining share against global providers by offering tighter integration with domestic cloud platforms and by meeting data residency requirements that international vendors sometimes struggle to satisfy across this fast-evolving regulatory landscape shaped by increasingly strict cross-border data rules affecting most multinational operators headquartered outside the region itself but operating major manufacturing and logistics hubs here that depend heavily on optimized regional connectivity.
Share: 24% | CAGR: 11.8% (2026 to 2036)
Regional intelligence for 5 additional markets available in the complete report: Western Europe, South Asia and Pacific, Latin America, Middle East and Africa, Eastern Europe. Contact sales@marketmindsadvisory.com.
network-optimization-market-market-share-analysis-1789998919888

Capturing More Value Beyond Base Licensing

Vendors are expanding revenue beyond core platform licensing through managed optimization services, predictive analytics add-ons, and professional services engagements across the enterprise customer base. These adjacent revenue streams carry materially higher margins than appliance-anchored sales and deepen account stickiness across multi-year renewal cycles, giving vendors more durable relationships than transactional license sales alone provide.

Expand Managed Optimization Service Delivery Tiers

Vendors bundling fully managed optimization services alongside core platform licensing capture materially higher account revenue than software-only contracts, since managed tiers typically add 35 to 50% on top of the base license fee. Mid-market enterprises lacking dedicated network engineering staff are the fastest-growing buyer segment for these bundled offerings, since they eliminate the need to hire scarce specialized talent. Vendors that built managed service capability early are now winning competitive displacement deals against software-only incumbents lacking equivalent staffing, widening competitive separation over time as bundled contracts renew and expand across the installed customer base.
Market Impact: Managed optimization tiers add 35 to 50% revenue

Bundle Predictive Analytics Modules Into Core Platforms

Premium predictive analytics subscriptions layered onto core optimization platforms improve prediction accuracy while generating high-margin recurring revenue independent of underlying traffic volume. Enterprises increasingly expect proactive congestion forecasting rather than reactive alerting alone, pushing vendors to invest in proprietary model development. Vendors with established analytics operations can charge premium pricing of roughly 18 to 22% above standard platform fees, while smaller competitors lacking this capability struggle to justify comparable price points against better-resourced rivals that invested earlier in dedicated research capability rather than licensing third-party predictive models outright at scale.
Market Impact: Analytics add-ons carry an 18 to 22% premium

Monetize Automated SLA Compliance Reporting Modules

Automated compliance reporting modules that generate audit-ready SLA performance documentation directly from optimization platform data save enterprises substantial internal reporting labor, justifying premium module pricing averaging 10 to 15% above base platform cost. Financial services and telecommunications buyers show the strongest willingness to pay for this capability given the recurring cost of manual SLA audit preparation. Vendors are increasingly pre-building templates mapped to specific contractual frameworks, reducing implementation time and improving renewal economics across enterprise accounts specifically that face recurring quarterly audit cycles under strict contractual SLA terms with financial penalty clauses.
Market Impact: Compliance reporting modules add 10 to 15% margin

Extend Professional Services Into Ongoing Tuning Contracts

Initial deployment services are increasingly being converted into ongoing quarterly tuning and optimization contracts that keep predictive models calibrated against evolving traffic patterns and reduce false alert rates by roughly 22% over time. This shift converts a one-time services fee into a recurring revenue stream with gross margins comparable to core software licensing. Enterprises with complex, frequently changing network architectures show the highest willingness to pay for ongoing tuning, since static configurations degrade prediction accuracy within months of initial deployment as traffic patterns drift steadily further from their original calibration baseline.
Market Impact: Ongoing tuning contracts cut false alerts by 22%

Who Controls the Margin Pool

The market remains moderately fragmented with a CR5 of 42%, reflecting the diversity of vendors spanning network hardware, SD-WAN specialists, and dedicated AIOps providers. Cisco and VMware lead through broad platform bundling, while smaller challengers like Riverbed compete on optimization depth rather than portfolio breadth. The gap between the top two vendors and the next tier remains wide on enterprise account count.
Current competitive activity centers on machine learning model differentiation and SASE-native architecture rollout, as vendors race to prove predictive accuracy against real production traffic without relying on threshold-based alerting alone. Several vendors have announced dedicated AIOps modules within the past year, while others pursue acquisition to acquire specialized capability rather than building internally, compressing product development timelines considerably across the field.

Emerging pressure is coming from cloud infrastructure providers expanding into network telemetry, threatening to commoditize standalone optimization as a bundled feature within broader platforms. Rankings could shift meaningfully if a major cloud hyperscaler bundles native optimization directly into its infrastructure offering at no additional cost, pressuring independent specialists to prove differentiated value beyond basic optimization capability alone at no additional integration cost.
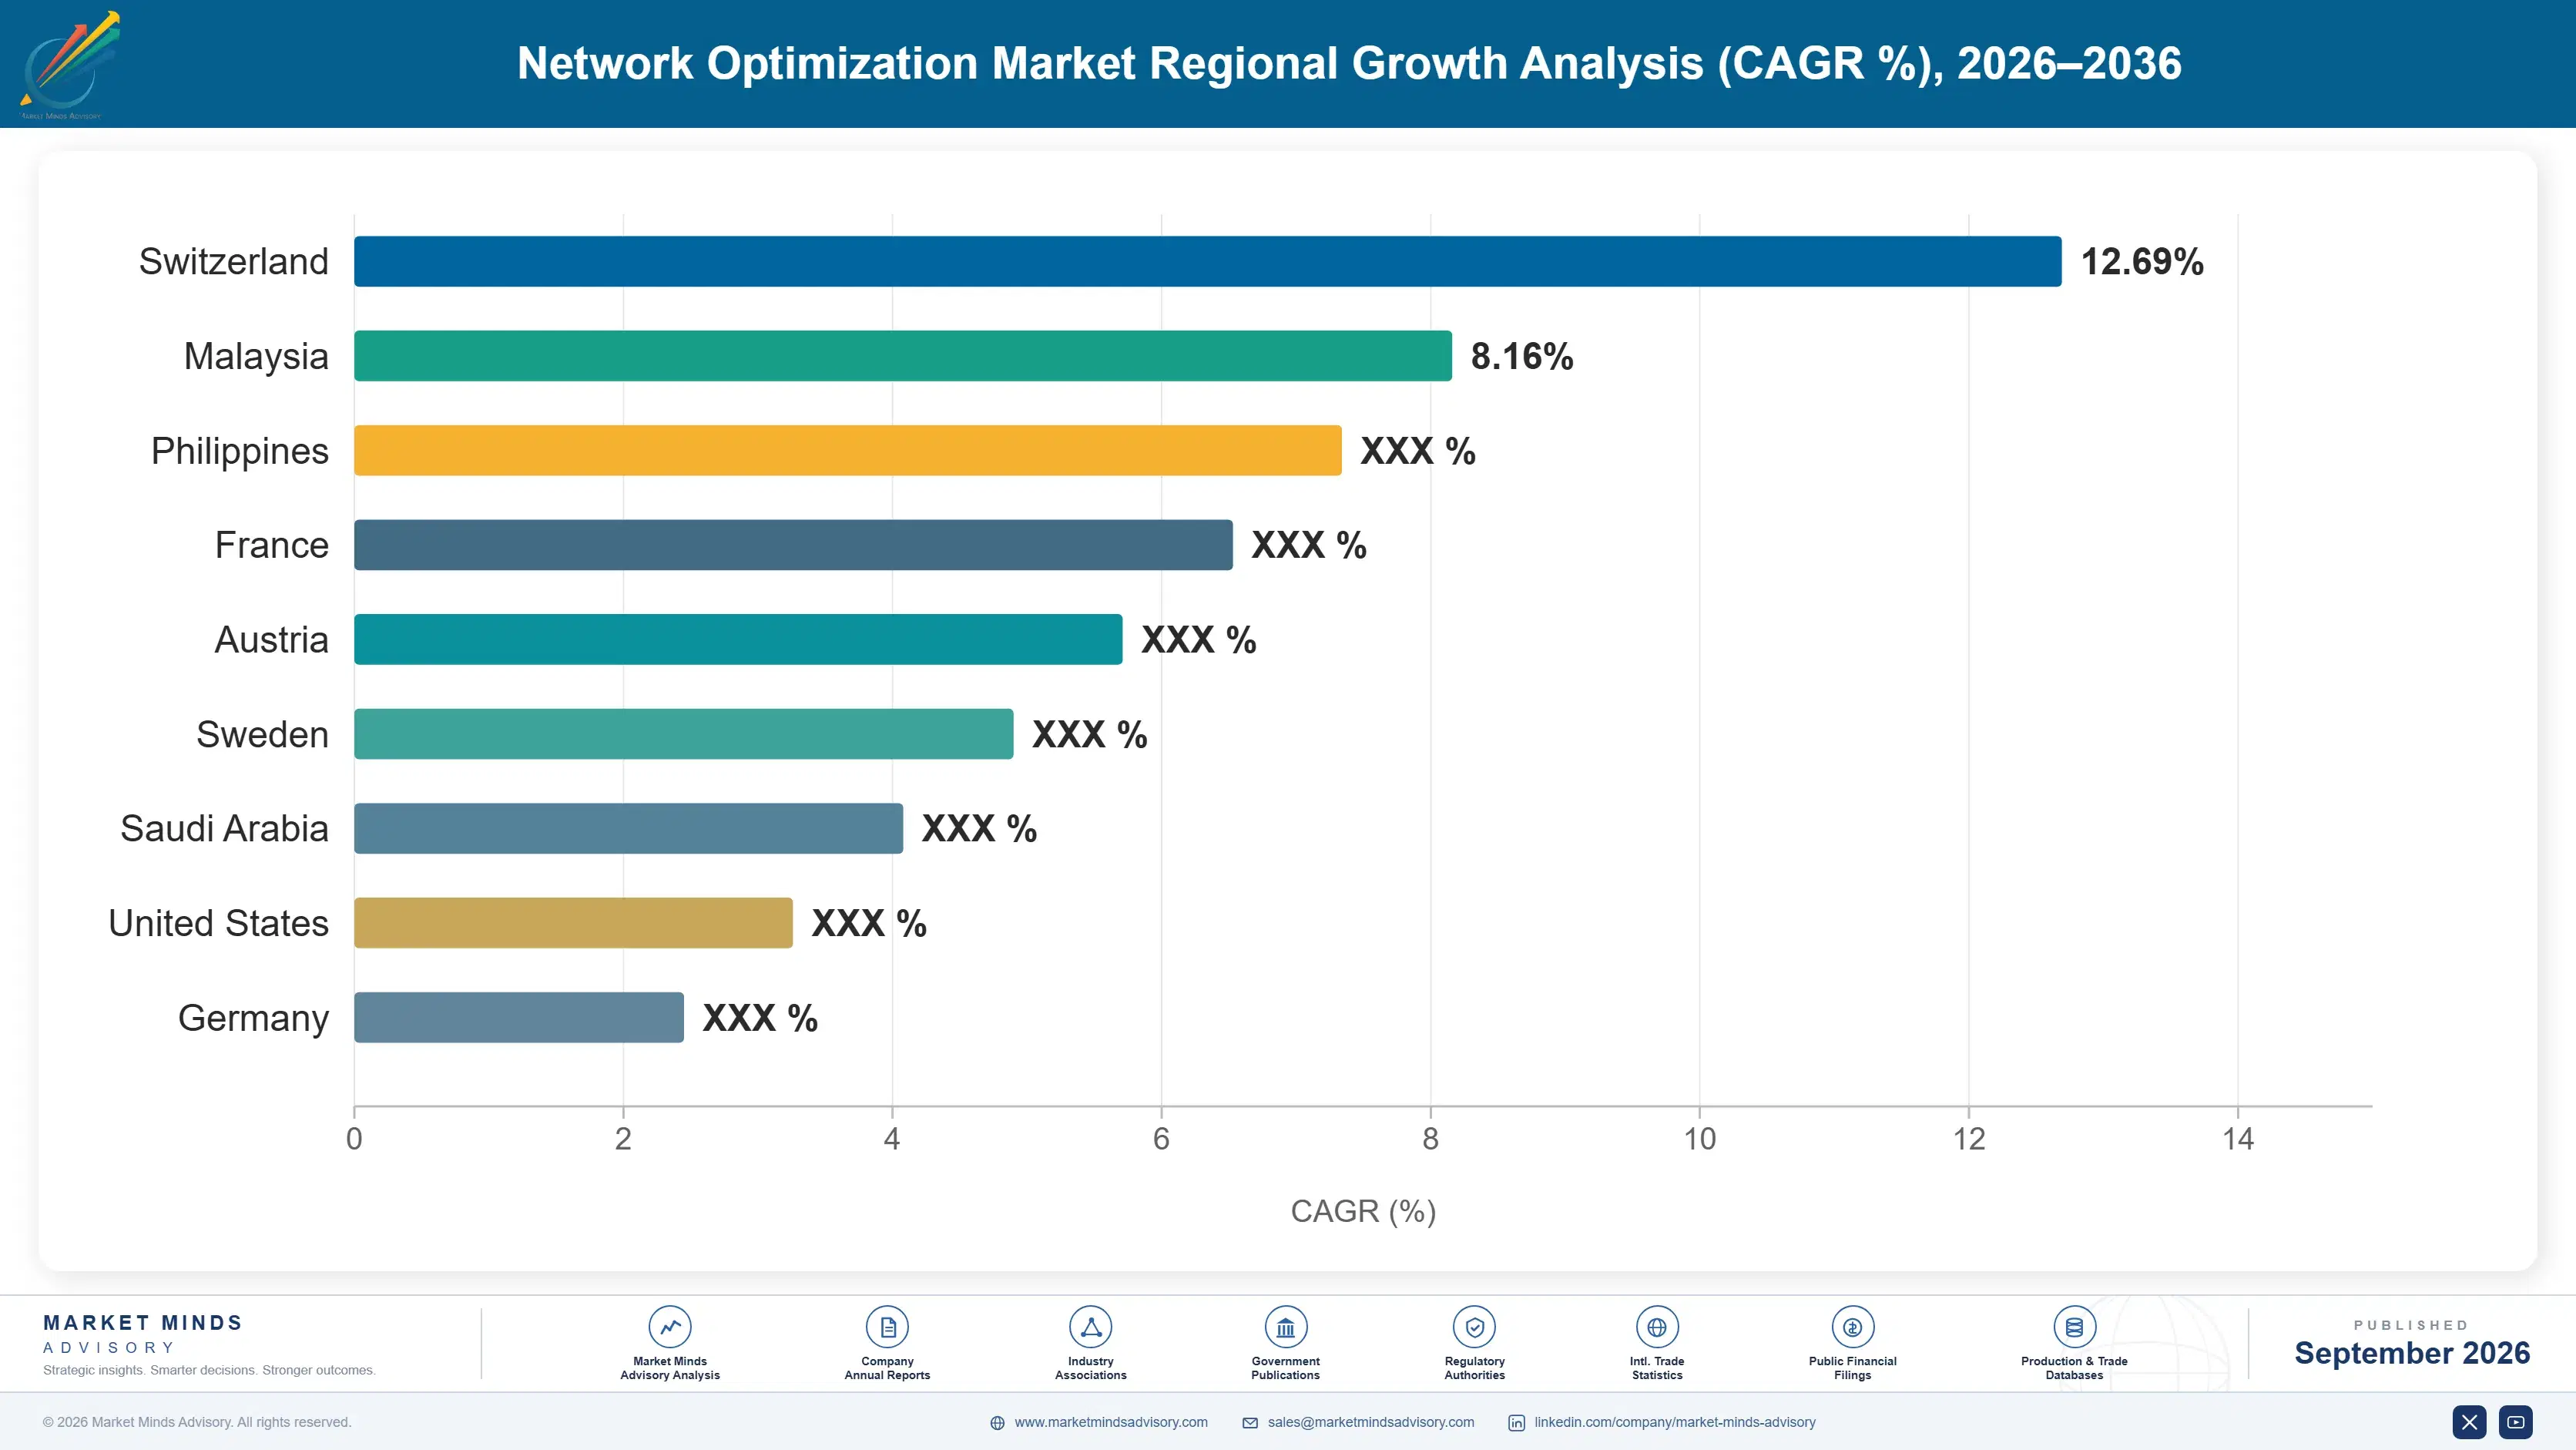
network-optimization-market-country-cagr-analysis-1789998920417

Competitive Moat and Risk Dimensions

CISCO

Moat: Network Infrastructure Install Base

Cisco's dominant position in enterprise switching and routing hardware gives it default access to network telemetry across environments where its equipment already sits, letting it bundle optimization capability without a separate deployment step. This installed base advantage is difficult for pure-play software competitors to replicate without displacing existing hardware relationships.
CISCO

Risk: Slower Software-Native Product Pace

Cisco's hardware-anchored heritage has historically slowed its transition toward software-native optimization architecture relative to newer, cloud-first entrants unencumbered by legacy product lines. Enterprises migrating away from Cisco-anchored infrastructure may evaluate alternatives with less architectural loyalty to legacy hardware relationships built over many years of hardware-centric enterprise sales relationships.
VMWARE

Moat: Virtualization Platform Integration Depth

VMware's deep integration with enterprise virtualization and software-defined data center infrastructure gives it privileged access to network telemetry across environments already running its hypervisor platform, an advantage rivals without comparable virtualization footprint cannot easily replicate at similar scale without years of comparable platform deployment history.
VMWARE

Risk: Ownership Transition Creates Customer Uncertainty

VMware's recent ownership transition has introduced pricing and licensing uncertainty among enterprise customers, prompting some to evaluate alternative optimization vendors as a hedge against future contract changes. Competitors are actively targeting VMware accounts during this transition window to capture switching customers during this period of heightened account vulnerability.

Players Tracked

Prominent Players

Cisco
VMware
Juniper Networks
Riverbed
Aruba Networks

Other Key Players

Nokia
Ciena
Extreme Networks
Fortinet
Palo Alto Networks
Cato Networks
Versa Networks
Aryaka
NetScout Systems
Kentik
ThousandEyes
Forward Networks
Ekinops
Netskope
128 Technology

Recent Developments

JANUARY 2026

Cisco acquired a specialized AIOps startup to accelerate development of predictive congestion forecasting models trained on real enterprise network traffic. The acquisition adds machine learning engineering talent with deep expertise in time-series forecasting specifically tuned for large-scale network telemetry datasets across large-scale, distributed cloud environments today.
Signal: Signals that major vendors are racing to close predictive optimization capability gaps quickly and decisively across the industry.
SEPTEMBER 2025

Juniper Networks entered a multi-year supply agreement with a major telecommunications operator to embed its optimization engine directly within the operator's managed network service offering. The agreement expands Juniper's addressable reach into customers who had not previously purchased dedicated third-party optimization tooling on their own initiative previously.
Signal: Shows telecommunications operators increasingly becoming key distribution channels for specialized third-party optimization vendors across the industry.
MAY 2025

Riverbed expanded engineering and support capacity for its network performance platform following sustained demand growth across regulated financial services and healthcare accounts in North America. The expansion includes new regional support centers designed to reduce deployment timelines for enterprise customers substantially across mid-size regional accounts specifically.
Signal: Reflects sustained enterprise demand growth pulling new capacity investment directly into optimization platform specialists across regions.

Cloud Compute and Talent Cost Exposure

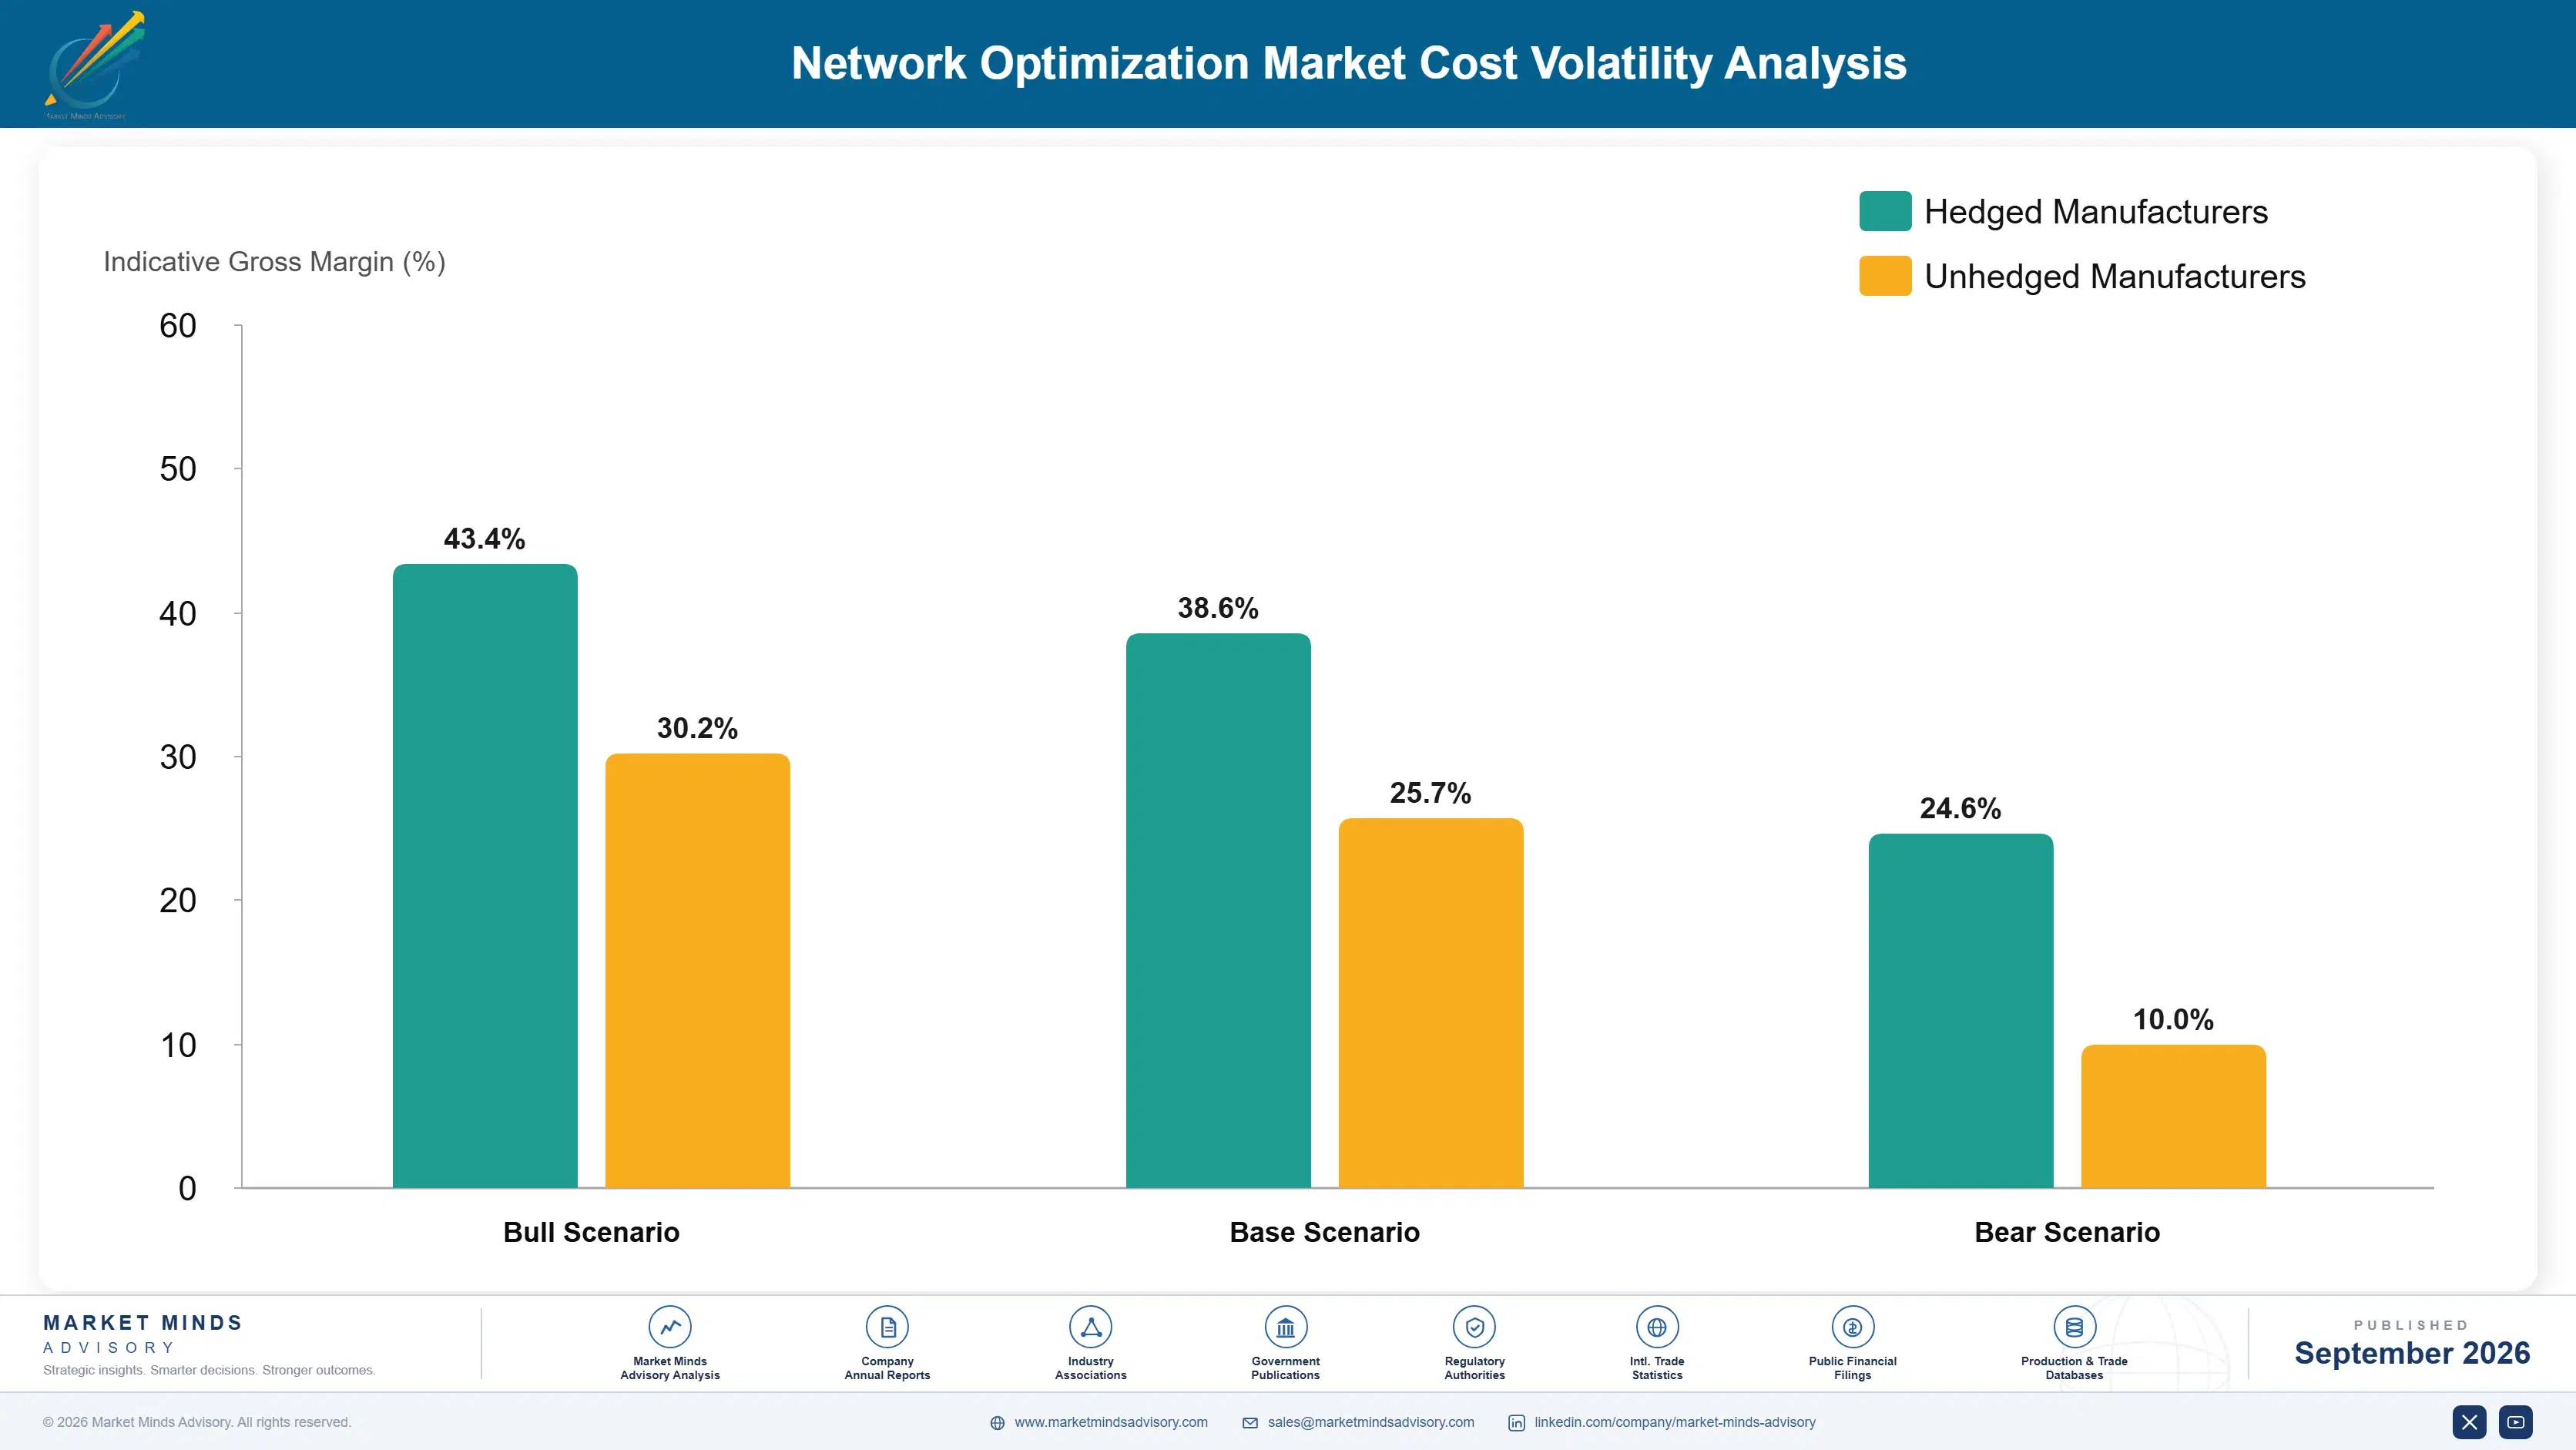
Cloud compute and storage capacity for processing network telemetry at scale represents roughly 26% of vendor cost of goods sold, sourced primarily from the same hyperscale providers that vendors also compete against for enterprise optimization budget. Specialized machine learning engineering talent represents a further 21% of operating cost, sourced from a globally scarce labor pool concentrated in a handful of technology hubs.
A 2025 cloud compute pricing adjustment from a major hyperscale provider raised processing costs for network telemetry pipelines by an estimated 11% for vendors running at scale, compressing gross margins for providers without long-term committed-use pricing agreements in place. Smaller vendors lacking negotiating leverage with hyperscale providers absorbed the increase directly, according to company annual report disclosures covering the affected period, with several noting the increase directly in quarterly earnings commentary.

Vendors dependent on a single cloud provider for compute capacity face greater cost exposure than those maintaining multi-cloud processing architecture, since single-provider dependency removes negotiating leverage during pricing renegotiation cycles. Larger vendors with committed-use discounts and in-house infrastructure engineering teams can absorb these cost shifts more easily than smaller competitors operating on standard public pricing tiers without volume commitments.
network-optimization-market-company-positioning-matrix-1789998920614

Negotiate Committed-Use Cloud Pricing Agreements Early

Vendors are locking in multi-year committed-use pricing agreements with hyperscale cloud providers before processing volume scales further, securing discounted rates that shield margins from future list-price increases across the contract term. Early movers report meaningfully lower effective compute costs than competitors negotiating later in the cycle, a gap that compounds meaningfully across a multi-year contract horizon.

Diversify Processing Across Multiple Cloud Providers

Multi-cloud processing architecture reduces single-vendor pricing leverage risk and improves negotiating position during renewal cycles, though it adds engineering complexity that smaller vendors sometimes struggle to justify given limited internal infrastructure engineering headcount available for managing several parallel environments across different geographic regions and billing structures simultaneously, an operational burden that grows with each additional relationship.

Build In-House Infrastructure for High-Volume Workloads

Larger vendors are shifting the highest-volume processing workloads onto owned infrastructure rather than public cloud capacity, trading upfront capital expenditure for long-term cost predictability that public cloud pricing cycles cannot reliably guarantee over time, particularly during periods of sustained industry-wide compute demand growth that public cloud vendors periodically pass through as list-price increases across the broader industry.

Portfolio Architecture for Margin Defence

Portfolio economics split across three tiers running from commodity threshold-based monitoring to premium AI-driven predictive optimization and forward-looking autonomous self-healing platforms. Gross margins widen considerably moving up the tier structure, reflecting the specialized machine learning engineering effort required to build reliable prediction models against complex network traffic at enterprise scale across diverse infrastructure environments.
Volume-tier monitoring tools face persistently lower long-term returns as commoditization pressure intensifies from open-source alternatives and bundled features inside broader observability suites. Premium predictive platforms retain pricing power because customers cannot easily replicate proprietary models trained on years of accumulated traffic data across large, diverse customer bases spanning multiple industries and geographic regions accumulated over many years of continuous refinement.

High-value revenue pools concentrate in enterprise accounts requiring compliance-grade reporting and managed optimization services layered atop core platforms, where switching costs run highest and renewal rates stay strongest. Vendors positioning purely on price compete for shrinking margin in the volume tier, while those investing in prediction accuracy and proprietary model development capture disproportionate value as the market matures further over the coming decade as buyer sophistication and performance expectations both continue rising steadily.

Threshold-based monitoring and basic flow analytics tools competing primarily on price against open-source alternatives, with gross margins concentrated in the 30 to 40% range across most vendors in this segment of the market.
Gross Margin

Predictive optimization platforms with proprietary machine learning models and formal performance certifications, carrying gross margins typically between 55 and 65% across the premium vendor base overall, well above commodity-tier appliance pricing.
Gross Margin

Autonomous self-healing platforms purpose-built for AI-driven remediation and automated compliance reporting, commanding gross margins above 65% given specialized engineering investment required to build and continuously maintain them against a constantly shifting threat landscape.
Gross Margin
network-optimization-market-cost-volatility-analysis-1789998921120

High-value Sub-segments and Strategic Watch-out

AI-Driven AIOps and Self-Healing Network Platforms

The highest-value, fastest-growing segment as enterprises replace threshold-based alerting with predictive congestion forecasting, with margins and growth rates both leading the broader market by a wide margin across nearly every region tracked in this report, a lead vendors expect to persist through most of the forecast window.

SD-WAN Optimization Solutions

A high-value segment growing steadily as enterprises replace static routing with dynamic, application-aware path selection across distributed branch and cloud environments, particularly among retail and multi-site operations requiring consistent application performance across every connected location regardless of underlying last-mile connectivity quality or geographic distance from data centers.

Threshold-Based Monitoring Tools

The volume core of the market, generating steady revenue from installed base renewals even as growth decelerates relative to newer predictive and AI-driven categories entering the field and capturing an increasing share of new enterprise budget allocation away from legacy threshold-based product lines toward newer predictive platform categories.

Network Observability for OT Environments

A strategic watch-out segment as industrial operators face rising pressure to monitor operational technology networks for both performance and security, a category still underserved by most mainstream enterprise-focused vendors today despite growing regulatory attention toward critical infrastructure resilience requirements across utilities and manufacturing operators alike.

Optimization as an Annuity

Network optimization platforms generate durable, multi-year revenue because deployment integrates deeply with existing network architecture and accumulated traffic history, making replacement costly and operationally disruptive once a platform is fully embedded across an enterprise's infrastructure. Renewal rates near 88% reflect this deep integration, since ripping out an optimization layer risks blind spots during any transition period.
Adoption stickiness varies by end-use vertical: financial services and telecommunications enterprises show the deepest platform dependence given strict SLA obligations tied to continuous performance monitoring, while technology companies show comparatively higher willingness to switch vendors as newer predictive capability becomes available in the broader market. Manufacturing and retail buyers adopt more cautiously but retain platforms longer once deployed, given the operational complexity and downtime risk associated with network reconfiguration projects.

Buyer profiles are shifting generationally as network operations teams increasingly favor cloud-native, API-driven platforms over traditional appliance procurement processes managed by infrastructure teams of an earlier era. Younger network leaders entering decision-making roles show stronger preference for consumption-based pricing and self-service deployment models over the multi-year procurement cycles that defined prior generations of enterprise network purchasing decisions across most large organizations.
Section default visual

Where MMA Sees the Advantage

These are among the four positions where our research anticipates prominent divergence between winners and laggards over the coming forecast period. Each is grounded in the demand model, the regulatory perimeter, and the announced capacity pipeline.
01 / AIOPS PLATFORM INVESTMENT

Prioritize predictive AIOps platforms over threshold-based monitoring

Enterprises should direct new network budget toward AI-driven AIOps and self-healing platforms rather than incremental threshold-based monitoring upgrades, since predictive congestion forecasting is becoming the primary differentiator across most large organizations today. The fastest-growing segment expands at 16.9% CAGR, roughly 1.56 times the overall market rate, concentrated heavily among technology and financial services buyers. Vendors and buyers slow to make this shift risk falling behind competitors already capturing this growth across every major geography tracked in this analysis, particularly across regulated and technology-heavy industry verticals.
02 / MANAGED OPTIMIZATION BUNDLING

Bundle managed optimization services to capture higher account value

Vendors should expand managed optimization service tiers rather than competing purely on software licensing, since bundled services add 35 to 50% incremental account revenue while addressing the persistent network engineering talent shortage constraining many buyers. Mid-market enterprises lacking dedicated network engineering staff represent the fastest-growing buyer segment for these bundled offerings. Vendors without managed capability already are losing competitive displacement opportunities to better-resourced rivals offering fully bundled managed service packages ahead of the broader competitive field this cycle and the next.
03 / NORTH AMERICAN ACCOUNT CONCENTRATION

Concentrate enterprise sales investment across North America first

North America holds 32% of global market share and remains the primary proving ground for new optimization capability given its concentration of financial services and technology headquarters. Vendors should prioritize account expansion and product launch sequencing there before other regions. Renewal rates and average deal size both run higher across the region than the broader global sector nationwide and across most comparable international markets tracked across this entire report's regional coverage across all seven geographies this report evaluates in depth.
04 / LEGACY INTEGRATION RISK

Address legacy infrastructure gaps before scaling deployment further

Legacy network infrastructure lacking telemetry export capability threatens to extend deployment timelines and delay return on investment if left unaddressed by vendors racing to ship new capability. The root cause is a multi-decade gap between hardware refresh cycles and the pace of optimization software innovation. Vendors that invest in lightweight telemetry collectors bridging legacy hardware will outcompete rivals requiring full infrastructure replacement across every branch and data center site before general commercial capability rollout across their full customer base and product line.

Engagement Snapshot From the Field

A live engagement with an industry participant carrying material or product regulatory and market exposure ahead of a defining policy shift, showing how our research translates into a defensible multi-year portfolio strategy.
MARKET MINDS ADVISORY · CLIENT ENGAGEMENT SUMMARY
Network Optimization Producer Strategic Portfolio Review and Transition Roadmap 2026·Investment Scenario on Network Optimization Exposure Evaluation 2025-26
CLIENT PROFILE
The client is a top-ten global telecommunications operator running an extensive fiber and wireless backbone serving enterprise and consumer customers across a dozen countries, operating a legacy network monitoring infrastructure built primarily around threshold-based alerting installed nearly a decade earlier. Facing rising customer complaints tied to application performance and mounting AI workload traffic from enterprise customers, leadership sought an independent assessment of which optimization architecture could resolve both issues simultaneously.
STRATEGIC CHALLENGE
The operator's existing monitoring tools could no longer reliably predict congestion before it degraded customer-facing service quality, creating a pattern of reactive firefighting that internal teams had flagged as unsustainable during the most recent network operations review. Competing regional teams favored different vendors, creating fragmented coverage and duplicated licensing costs across the operator's backbone network.
MMA APPROACH
MMA evaluated five leading network optimization vendors against a standardized scoring framework covering predictive accuracy, multi-region deployment support, and total cost of ownership across the operator's actual traffic patterns. The engagement combined vendor proof-of-concept testing against live backbone traffic, reference customer interviews within telecommunications, and total cost of ownership modeling across a five-year deployment horizon.
KEY FINDINGS
  1. Two of five evaluated vendors demonstrated meaningfully higher prediction accuracy against the operator's actual backbone traffic during proof-of-concept testing, reversing the operator's prior vendor shortlist.
  2. Consolidating around a single global vendor rather than region-specific tools reduced projected five-year total cost of ownership by an estimated 24% overall.
  3. Predictive congestion forecasting could reduce customer-facing service degradation incidents by roughly 55% based on pilot testing results across three separate regional markets during the trial period.
  4. Regional deployment support coverage varied considerably across vendors, with only two offering adequate service presence across all twelve countries the operator serves.
CLIENT PROFILE
The client is a top-ten global telecommunications operator running an extensive fiber and wireless backbone serving enterprise and consumer customers across a dozen countries, operating a legacy network monitoring infrastructure built primarily around threshold-based alerting installed nearly a decade earlier. Facing rising customer complaints tied to application performance and mounting AI workload traffic from enterprise customers, leadership sought an independent assessment of which optimization architecture could resolve both issues simultaneously.
STRATEGIC CHALLENGE
The operator's existing monitoring tools could no longer reliably predict congestion before it degraded customer-facing service quality, creating a pattern of reactive firefighting that internal teams had flagged as unsustainable during the most recent network operations review. Competing regional teams favored different vendors, creating fragmented coverage and duplicated licensing costs across the operator's backbone network.
MMA APPROACH
MMA evaluated five leading network optimization vendors against a standardized scoring framework covering predictive accuracy, multi-region deployment support, and total cost of ownership across the operator's actual traffic patterns. The engagement combined vendor proof-of-concept testing against live backbone traffic, reference customer interviews within telecommunications, and total cost of ownership modeling across a five-year deployment horizon.
KEY FINDINGS
  1. Two of five evaluated vendors demonstrated meaningfully higher prediction accuracy against the operator's actual backbone traffic during proof-of-concept testing, reversing the operator's prior vendor shortlist.
  2. Consolidating around a single global vendor rather than region-specific tools reduced projected five-year total cost of ownership by an estimated 24% overall.
  3. Predictive congestion forecasting could reduce customer-facing service degradation incidents by roughly 55% based on pilot testing results across three separate regional markets during the trial period.
  4. Regional deployment support coverage varied considerably across vendors, with only two offering adequate service presence across all twelve countries the operator serves.
RECOMMENDED STRATEGY
Phase 1: Phase one consolidates network optimization procurement under a single global vendor agreement, replacing the operator's fragmented regional tooling entirely within two quarters. Phase 2: Phase two sequences regional deployment starting with the highest-traffic markets facing the most severe congestion incidents, then extends to remaining markets on a rolling basis. Phase 3: Phase three activates predictive congestion forecasting network-wide, reducing service degradation incidents across all twelve countries the operator serves globally across its full customer base.
OUTCOME
The operator approved a global vendor consolidation agreement covering all twelve countries with a projected five-year technology spend of approximately $210 million (client-reported, unverified by MMA). Internal network operations reporting credited the new architecture with cutting customer-facing service incidents meaningfully within the first two quarters of deployment.

Frequently Asked Questions

Foundational context covering the market sizes, CAGR, scope, country, region and competition that inform every finding below. This section is provided to cover basics and most often pre-purchase conversations, answered from the MMA Primary Research Dataset.

What is the current size of the Network Optimization Market?

The global Network Optimization market reached $18.6 billion in 2025. Growth is driven primarily by rising telemetry volumes and AI workload traffic straining existing network infrastructure.

How large will the Network Optimization Market be by 2036?

The market is projected to reach $57.47 billion by 2036. This reflects sustained enterprise demand for predictive optimization across distributed, multi-cloud network environments across the entire world.

What is the CAGR for the Network Optimization Market 2026 to 2036?

The market is forecast to grow at a 10.8% CAGR between 2026 and 2036. This accelerates from the 9.8% historical CAGR recorded over 2020 to 2025.

Which segment is growing fastest?

AI-Driven AIOps and Self-Healing Network Platforms is the fastest-growing segment, expanding at 16.9% CAGR, roughly 1.56 times the overall market rate. Predictive automation concentrates demand in this category.

Who are the major companies in the Network Optimization Market?

Cisco, VMware, Juniper Networks, Riverbed, and Aruba Networks lead the competitive landscape, together holding an estimated 42% combined share. Each competes on prediction accuracy and platform breadth.

Which country is growing fastest?

India is the fastest-growing country market, expanding at 14.8% CAGR. Rapid technology sector expansion is driving accelerated network optimization platform procurement across the broader region overall.

Report Segmentation Architecture

The full report scope spans multiple orthogonal segmentation dimensions, with cross-tabulated demand data provided for each dimension pair. Coverage extends further to regional breakdowns, trend trajectories, and the competitive detail needed to support segment-level decision-making.

By Technology Type (AIOps, SD-WAN, WAN Optimization, Automation)

    By End-Use Industry (Financial Services, Technology, Retail, Telecommunications)

      By Commercial Dimension (Enterprise Direct, Managed Service, Channel Partner)

        By Region

        • North America
        • East Asia
        • Western Europe
        • South Asia and Pacific
        • Latin America
        • Middle East and Africa
        • Eastern Europe

        Scope, Methodology, and Coverage

        Every figure in this report is reproducible from documented input assumptions. The scope below maps the historical period, the forecast horizon, the segmentation dimensions, and the countries covered, alongside the underlying primary and qualitative methodology.
        Historical Period
        2020 to 2025
        Forecast Period
        2026 to 2036
        Base Year
        2025 (USD billions; MMA Primary Research Dataset, September 2026)
        Market Definition
        This report defines the Network Optimization Market as software platforms and services that monitor, analyze, and automatically improve network performance, including AI-driven traffic management, SD-WAN optimization, and network automation tools. It excludes network security products without dedicated performance optimization capability, physical networking hardware sold without bundled optimization software, and general IT service management platforms.
        Quantitative Units
        USD billions, market share percentages, CAGR percentages
        Segmentation Dimensions
        Technology type, end-use industry, commercial dimension, region
        Regions Covered
        North America, East Asia, Western Europe, South Asia and Pacific, Latin America, Middle East and Africa, Eastern Europe
        Countries Covered
        United States, United Kingdom, Germany, China, Japan, India, Brazil, United Arab Emirates, and 22 additional markets
        Key Companies Profiled
        Cisco, VMware, Juniper Networks, Riverbed, Aruba Networks, and 15 additional participants
        Quantitative Methodology
        Primary survey, n=3,800 respondents, Q4 2025, six countries; demand-side model with trade association cross-validation
        Qualitative Methodology
        47 expert interviews, Q4 2025; applied to validate demand model assumptions, identify emerging dynamics, and assess competitive positioning
        Report Format
        PDF and XLSX data workbook (Word format preview document)
        Publisher
        Market Minds Advisory
        Report Code
        MMA-2026-TEC-158
        Published
        September 2026
        Contact
        sales@marketmindsadvisory.com | www.marketmindsadvisory.com

        Purchase the full Network Optimization Market Report (2026 to 2036).

        This report examines the global network optimization market across AIOps, SD-WAN, and automation categories through the year 2036, covering both established enterprise buyers and emerging mid-market segments. It quantifies demand shifts driven by telemetry growth and AI workload traffic. Profiles of five leading vendors sit alongside fifteen additional participants, assessed on a common concentration and capability basis across the competitive landscape. Regional adoption patterns are detailed across all seven geographies in the underlying dataset. Coverage also includes forecast scenarios, cost exposure, and portfolio margin economics across three equipment tiers.
        Ten-year demand forecast by technology category
        Vendor prediction accuracy and coverage benchmarking
        Regional adoption pattern analysis across seven geographies
        Cloud compute cost exposure and mitigation assessment
        Portfolio margin economics across three product tiers
        Competitive positioning and moat durability assessment

        Built For The People Who Decide

        From boardroom strategy to bench-side execution, this report is read cover-to-cover by leaders shaping the next decade of their industry, turning demand scenarios, market dynamics and valuation benchmarks into decisions.
        CXOs/ Presidents/ VPs/ Managers
        M&A and Corporate Development
        Strategy Teams and R&D Heads
        Procurement and Product Directors
        Regulatory and Compliance Leaders
        Investor Relations and Equity Analysts