

Market Minds Advisory
Network Fault Monitoring Tools Market

Network Fault Monitoring Tools Market: Network Fault Monitoring Tools Market. Root Cause Analysis Moves to Real Time

Telecom operators and enterprises are drowning in fault alerts that flood operations centers faster than engineers can triage, pushing vendors toward AI correlation engines that pinpoint root cause in seconds rather than hours.

Lead Analyst

Published

September 2026

Make Smarter Decisions with Customized Research Insights

Request a free sample report and evaluate market opportunities, growth trends, and competitive dynamics relevant to your business needs.

2025 MARKET VALUE$5.9BMarket Size 2025
2036 FORECAST VALUE$16.2BBase Case , 2026 to 2036
CAGR 2026 TO 20369.6 %Bull 10.9% / Bear 8.3%
INCREMENTAL OPPORTUNITY$9.7BNet 10- year value creation
EXPANSION MULTIPLE2.50x2036 value over 2026 base
Strategic Levers
M&A Pipeline
Regional Outlook
Country Rankings
Competitive Intelligence
Segmental Deep-dive
Call-Us : 91 93563 13602

Executive Snapshot and Market Trajectory.

Fault alert volumes have outgrown manual triage capacity across large network operations centers, forcing operators toward AI-driven root cause correlation that isolates the originating failure rather than surfacing hundreds of downstream symptom alerts across every affected network layer in increasingly complex, distributed environments spanning cloud, edge, and core network domains.
Telecom operators and hyperscale data center operators are generating fault event volumes far beyond what threshold-based alerting was ever designed to manage, pushing budget toward correlation engines rather than additional monitoring dashboards. Adoption is fastest among telecom carriers and large enterprises across East Asia and North America running dense, multi-vendor network infrastructure. Service-level agreement penalties tied to mean time to repair are pulling investment toward faster root cause isolation rather than incremental dashboard improvements.
Network equipment vendors and dedicated fault management software specialists are converging on the same carrier accounts, each embedding machine learning models trained on historical fault patterns to predict failures before they trigger customer-facing outages. Rising network complexity from 5G and fiber densification is accelerating adoption of tools that can correlate faults across increasingly heterogeneous infrastructure layers spanning multiple vendor domains and technology generations simultaneously.
Market Definition
This report defines the Network Fault Monitoring Tools Market as software platforms that detect, correlate, and diagnose network failures and performance degradation, including root cause analysis, event correlation, and fault prediction tools. It excludes general network performance optimization software without dedicated fault diagnosis capability, physical test equipment, and IT service management ticketing systems.
Base Year Value
$5.9B in 2025 (MMA Primary Research Dataset, September 2026)
Forecast Period
2026 to 2036, eleven discrete annual values
CAGR
9.6% base case. Bull 10.9%. Bear 8.3%.
Fastest Growth Segment
AI-Driven Root Cause Analysis Platforms: 15.4% CAGR
Fastest Growth Country
China: 13.2% CAGR
Fastest Growth Region
South Asia and Pacific: 11.6% CAGR
Largest Region
North America: 29% of 2025 global value
Market Leaders
Cisco, IBM, Broadcom, ServiceNow, and NETSCOUT lead the competitive field. Source: MMA Primary Research Dataset, July 2026.
Primary Survey
n=3,800 procurement and R&D decision-makers, Q4 2025, six countries
Methodology
Demand-side build-up, cross-validated against public data, 47 expert interviews

Network Fault Monitoring Tools Market Forecast Scenarios

network-fault-monitoring-tools-market-size-forecast-scenario-1789998905115
Between 2020 and 2025, network fault monitoring adoption grew steadily at an 8.7% historical CAGR as telecom carriers and large enterprises modernized network operations centers around correlation-based rather than threshold-based alerting. Growth was concentrated among large telecom operators, while smaller enterprises relied on managed service providers for fault diagnosis instead of purchasing platforms directly themselves.
The base case assumes continued steady growth through 2036 as three mechanisms compound: network fault event volumes keep expanding beyond what manual triage can process, 5G and fiber densification keep generating more heterogeneous infrastructure requiring cross-domain correlation, and SLA penalty exposure keeps pulling investment toward faster root cause isolation rather than reactive troubleshooting. Vendor consolidation around unified observability platforms further supports sustained enterprise adoption across most verticals through the middle years of the forecast window.
The bull case centers on accelerated 5G network buildout forcing faster fault correlation tool adoption across telecom carriers, which could push growth toward 10.9%. The bear case assumes telecom capital expenditure compression during a macroeconomic downturn delays network operations platform refreshes, pulling growth toward 8.3% as carriers extend existing contracts instead of upgrading their fault monitoring stacks.

From Alert Floods to Automated Root Cause Isolation

Network fault monitoring has moved from threshold-based alerting toward automated root cause correlation as fault event volumes exceeded what human engineers could triage manually across increasingly complex, multi-vendor network environments spanning core, edge, and cloud infrastructure simultaneously across nearly every major telecom operator and large enterprise account tracked in this analysis.
MARKET CONCENTRATIONCR5: 48%Top five vendors together hold under half of global share
AVERAGE CONTRACT VALUE$165K per carrier deploymentAnnual platform contract for mid-size carrier network deployment
AI CORRELATION SHARE36% of new deploymentsShare of new deployments including automated root cause correlation
RENEWAL RATE90% annual renewalShare of enterprise customers renewing existing fault monitoring contracts
DEPLOYMENT CYCLE4 to 6 monthsTypical enterprise procurement through full production deployment timeline
MTTR REDUCTION40 to 55% reportedAverage repair time improvement enterprises report after platform adoption
Vendors are racing to embed machine learning models that trace symptom alerts back to a single originating failure rather than surfacing every downstream effect separately, a shift that dramatically reduces mean time to repair across most operations centers. Telecom carriers are gaining the fastest returns given the scale and complexity of their multi-vendor 5G and fiber infrastructure deployments spread across dozens of vendor equipment types and generations of legacy hardware.
Pricing is shifting from per-device licensing toward platform-wide subscription models tied to network scale, which simplifies budgeting but compresses vendor margins on the largest carrier accounts significantly. Consolidation pressure is building as fault management specialists merge with broader network observability platform vendors seeking unified telemetry coverage across performance, fault, and security monitoring domains within a single unified operations console rather than several disconnected dashboards.
"Operations centers used to drown in alerts and call it monitoring. The platforms that win now are the ones that tell you which single alert actually matters. Everything else is noise that costs engineers time they do not have."
Senior Analyst, Network Operations Practice · MMA Technology Practice · September 2026

Market Trends

AI Correlation Engines Collapse Alert Storms Automatically

Machine learning correlation engines are increasingly able to collapse thousands of downstream symptom alerts into a single actionable root cause notification within seconds of a fault occurring, replacing the alert storms that historically overwhelmed network operations centers during major outages. This capability represents a fundamental shift from static topology-based correlation rules toward dynamic models that learn from historical fault patterns across the specific network they monitor. Several major vendors have announced dedicated AI correlation modules within the past year targeting large telecom carrier accounts specifically that generate the highest volume of usable historical fault data.
Market Impact: SLA-driven deals up 24% yearly

5G Network Complexity Demands Cross-Domain Correlation

5G network architecture spanning radio access, transport, and core domains simultaneously is generating fault correlation challenges that single-domain monitoring tools were never designed to handle across increasingly virtualized, software-defined infrastructure layers. This complexity is forcing telecom operators to adopt cross-domain correlation platforms that can trace a single fault through radio, transport, and core network layers simultaneously. Several telecom equipment vendors have announced dedicated 5G fault correlation products this past year targeting operators deploying standalone 5G core networks rather than legacy non-standalone architecture requiring far less cross-domain coordination overall across the entire operator's national footprint.
Market Impact: Network elements up 8x per site

Market Opportunities and Growth Drivers

SLA Penalty Exposure Pushes Faster Fault Isolation

Telecom carriers and large enterprises facing contractual service-level agreement penalties tied to mean time to repair are increasingly willing to pay premium pricing for platforms that isolate root cause in seconds rather than hours, since even brief outages can trigger substantial financial penalty clauses. Financial services and healthcare customers show the strongest willingness to pay given the direct revenue and compliance impact of extended network downtime during critical business hours. This dynamic is pulling budget away from reactive threshold alerting toward proactive, AI-driven correlation platforms specifically built to prevent penalty-triggering outages before they occur.
Market Impact: Legacy gaps add 10 weeks deployment

5G Densification Multiplies Fault Correlation Complexity

Rapid 5G small cell deployment is multiplying the number of network elements telecom operators must monitor by an order of magnitude compared to prior generation networks, straining fault management capacity faster than most operators can hire additional network operations staff to match. Correlation platforms that automatically group related fault events across thousands of small cells are becoming essential infrastructure rather than optional tooling for dense urban 5G deployments specifically. Vendors report 5G densification as the single fastest-growing driver of new customer inquiries this year across most carrier accounts surveyed for this analysis this year.
Market Impact: False correlations occur 9% of cases

Market Restraints and Challenges

Legacy Equipment Lacks Modern Telemetry Standards

Many telecom networks still operate substantial legacy equipment predating modern telemetry export standards, forcing costly protocol translation layers before AI correlation platforms can ingest fault data from older infrastructure. The root cause is a multi-decade gap between network hardware refresh cycles and the pace of software-defined monitoring innovation. The commercial impact is extended deployment timelines and incomplete fault visibility across mixed-generation networks. Vendors are mitigating the gap through lightweight protocol adapters that bridge legacy equipment without requiring full hardware replacement across every legacy network segment still operating in production today.
Market Impact: Alert volume cut 70% claimed

False Correlation Errors Erode Operator Trust

Early-generation AI correlation models sometimes group unrelated fault events incorrectly, generating false root cause conclusions that send operations teams chasing the wrong problem during critical outage windows. The root cause is insufficient training data diversity across the varied fault scenarios any given network can experience over its operational lifetime. The commercial impact includes operator hesitancy to fully trust automated recommendations during high-severity incidents. Vendors are mitigating the issue through confidence scoring and human-in-the-loop validation workflows for high-severity fault classifications before any automated remediation action is actually taken by the system.
Market Impact: Cross-domain deals up 26% yearly
3 additional market trends, 4 additional growth drivers, and 3 additional restraints and challenges are covered in the full report. Contact sales@marketmindsadvisory.com to access the complete intelligence.

Segment CAGR and Growth Architecture

The market splits across six categories spanning correlation architecture, deployment model, and service delivery. AI-driven root cause analysis platforms and 5G cross-domain correlation tools are growing fastest as telecom operators and enterprises replace threshold-based alerting with predictive, machine learning correlation built for increasingly heterogeneous networks spanning multiple vendor equipment generations at once across the network.
Section default visual

AI-Driven Root Cause Analysis Platforms

AI-driven root cause analysis platforms use machine learning models trained on historical fault patterns to trace symptom alerts back to a single originating failure automatically, collapsing what once required hours of manual correlation into seconds. Growth is concentrated among telecom carriers and hyperscale data center operators managing dense, multi-vendor network infrastructure that generates fault event volumes far beyond manual triage capacity. Vendors in this category compete primarily on correlation accuracy against real production fault data and on the breadth of automated diagnostic actions available without requiring human validation for every incident, a capability few competitors have proven at national carrier scale across a broad enough range of fault scenarios and network topologies encountered in production.
CAGR 15.4%

5G Cross-Domain Correlation Tools

5G cross-domain correlation tools trace faults across radio access, transport, and core network domains simultaneously, addressing the complexity that single-domain monitoring tools were never designed to handle in virtualized, software-defined 5G architecture. Adoption is accelerating fastest inside telecom operators deploying standalone 5G core networks facing fault correlation challenges spanning entirely new network layers. Vendors differentiate on integration breadth with existing telecom equipment vendors, correlation speed across network domains, and their track record maintaining accuracy during large-scale outage events spanning multiple network domains simultaneously across their national footprint and dense urban deployment zones spanning thousands of small cell sites across metropolitan and suburban coverage areas alike across their entire licensed spectrum footprint.
CAGR 12.7%
Full segment breakdown across 7 segments available in the complete report.

Regional Architecture and Country Demand Map

Regional adoption tracks telecom network density and enterprise IT sophistication closely across the seven markets covered here. North America and East Asia lead on absolute spend, while South Asia and Pacific posts the fastest growth as 5G buildout accelerates across the region's largest telecom markets.

North America

Large telecom carriers and hyperscale data center operators across the United States and Canada carry the deepest existing fault monitoring deployments globally, driven by early adoption of AI correlation platforms and the concentration of major carrier headquarters in the region. Federal Communications Commission network resilience requirements are pushing carriers toward documented fault detection and recovery capability ahead of mandated reporting deadlines. Hyperscale cloud providers headquartered in the region continue to push correlation vendors toward faster processing given the scale of fault events their networks generate daily, a scale unmatched anywhere else in the developed world across comparable cloud and carrier infrastructure anywhere else in the developed economy across most industry verticals tracked here.
Share: 29% | CAGR: 10.9% (2026 to 2036)

East Asia

China's massive telecom carrier networks, operated by state-backed operators serving over a billion subscribers, generate fault event volumes at a scale few other markets approach, driving substantial correlation platform investment. Japan's aging network infrastructure is accelerating adoption of predictive fault detection tools that identify failing equipment before it triggers customer-facing outages. South Korea's dense 5G small cell deployment is pushing carriers toward cross-domain correlation capability earlier than most other markets given the country's early 5G standalone core rollout timeline relative to most global peers still operating on non-standalone 5G architecture without full core network virtualization across their national footprints and the widest range of population densities anywhere in the region's telecom coverage.
Share: 26% | CAGR: 10.6% (2026 to 2036)
Regional intelligence for 5 additional markets available in the complete report: Western Europe, South Asia and Pacific, Latin America, Middle East and Africa, Eastern Europe. Contact sales@marketmindsadvisory.com.
network-fault-monitoring-tools-market-market-share-analysis-1789998905652

Capturing More Value Beyond Base Licensing

Vendors are expanding revenue beyond core platform licensing through managed correlation services, predictive maintenance add-ons, and professional services engagements across the carrier and enterprise customer base. These adjacent revenue streams carry materially higher margins than appliance-anchored sales and deepen account stickiness across multi-year renewal cycles, giving vendors more durable relationships than transactional license sales alone provide.

Expand Managed Correlation Service Delivery Tiers

Vendors bundling fully managed correlation services alongside core platform licensing capture materially higher account revenue than software-only contracts, since managed tiers typically add 30 to 45% on top of the base license fee. Mid-size carriers lacking dedicated network operations staff are the fastest-growing buyer segment for these bundled offerings, since they eliminate the need to hire scarce specialized talent. Vendors that built managed service capability early are now winning competitive displacement deals against software-only incumbents lacking equivalent staffing, widening competitive separation over time as bundled contracts renew and expand across the installed base.
Market Impact: Managed correlation tiers add 30 to 45% revenue

Bundle Predictive Maintenance Modules Into Core Platforms

Premium predictive maintenance subscriptions layered onto core correlation platforms improve failure prediction accuracy while generating high-margin recurring revenue independent of underlying fault volume. Carriers increasingly expect proactive equipment failure forecasting rather than reactive fault correlation alone, pushing vendors to invest in proprietary model development. Vendors with established predictive maintenance operations can charge premium pricing of roughly 16 to 20% above standard platform fees, while smaller competitors lacking this capability struggle to justify comparable price points against better-resourced rivals with deeper research investment made earlier in the overall product development and research cycle.
Market Impact: Predictive maintenance carries a 16 to 20% premium

Monetize Automated SLA Compliance Reporting Modules

Automated compliance reporting modules that generate audit-ready SLA performance documentation directly from fault correlation data save carriers substantial internal reporting labor, justifying premium module pricing averaging 10 to 14% above base platform cost. Telecom carriers facing regulatory reporting requirements show the strongest willingness to pay for this capability given the recurring cost of manual compliance documentation. Vendors are increasingly pre-building templates mapped to specific regulatory frameworks, reducing implementation time and improving renewal economics across carrier accounts specifically that face recurring quarterly audit cycles under strict contractual reporting terms with financial penalty clauses attached.
Market Impact: Compliance reporting modules add 10 to 14% margin

Extend Professional Services Into Ongoing Model Tuning

Initial deployment services are increasingly being converted into ongoing quarterly model tuning contracts that keep correlation models calibrated against evolving network topology and reduce false correlation rates by roughly 20% over time. This shift converts a one-time services fee into a recurring revenue stream with gross margins comparable to core software licensing. Carriers with frequently changing network architectures show the highest willingness to pay for ongoing tuning, since static models degrade correlation accuracy within months of initial deployment as network topology drifts steadily further from its original calibration baseline over successive network changes.
Market Impact: Ongoing tuning contracts cut false correlations by 20%

Who Controls the Margin Pool

The market remains moderately fragmented with a CR5 of 48%, reflecting the diversity of vendors spanning network equipment manufacturers, IT operations software providers, and dedicated fault correlation specialists. Cisco and IBM lead through broad platform bundling, while smaller challengers like NETSCOUT compete on correlation depth rather than portfolio breadth. The gap between the top two vendors and the next tier remains wide on carrier account count.
Current competitive activity centers on machine learning correlation model differentiation and 5G cross-domain capability rollout, as vendors race to prove accuracy against real carrier network fault data rather than curated demonstration datasets. Several vendors have announced dedicated 5G correlation modules within the past year, while others pursue acquisition to acquire specialized capability rather than building internally, compressing product development timelines considerably across the field.

Emerging pressure is coming from broader observability platform vendors expanding into fault correlation, threatening to commoditize standalone fault monitoring as a bundled feature within unified telemetry platforms. Rankings could shift meaningfully if a major cloud hyperscaler bundles native correlation directly into its infrastructure offering at no additional cost, pressuring independent specialists to prove differentiated value beyond basic fault detection capability.
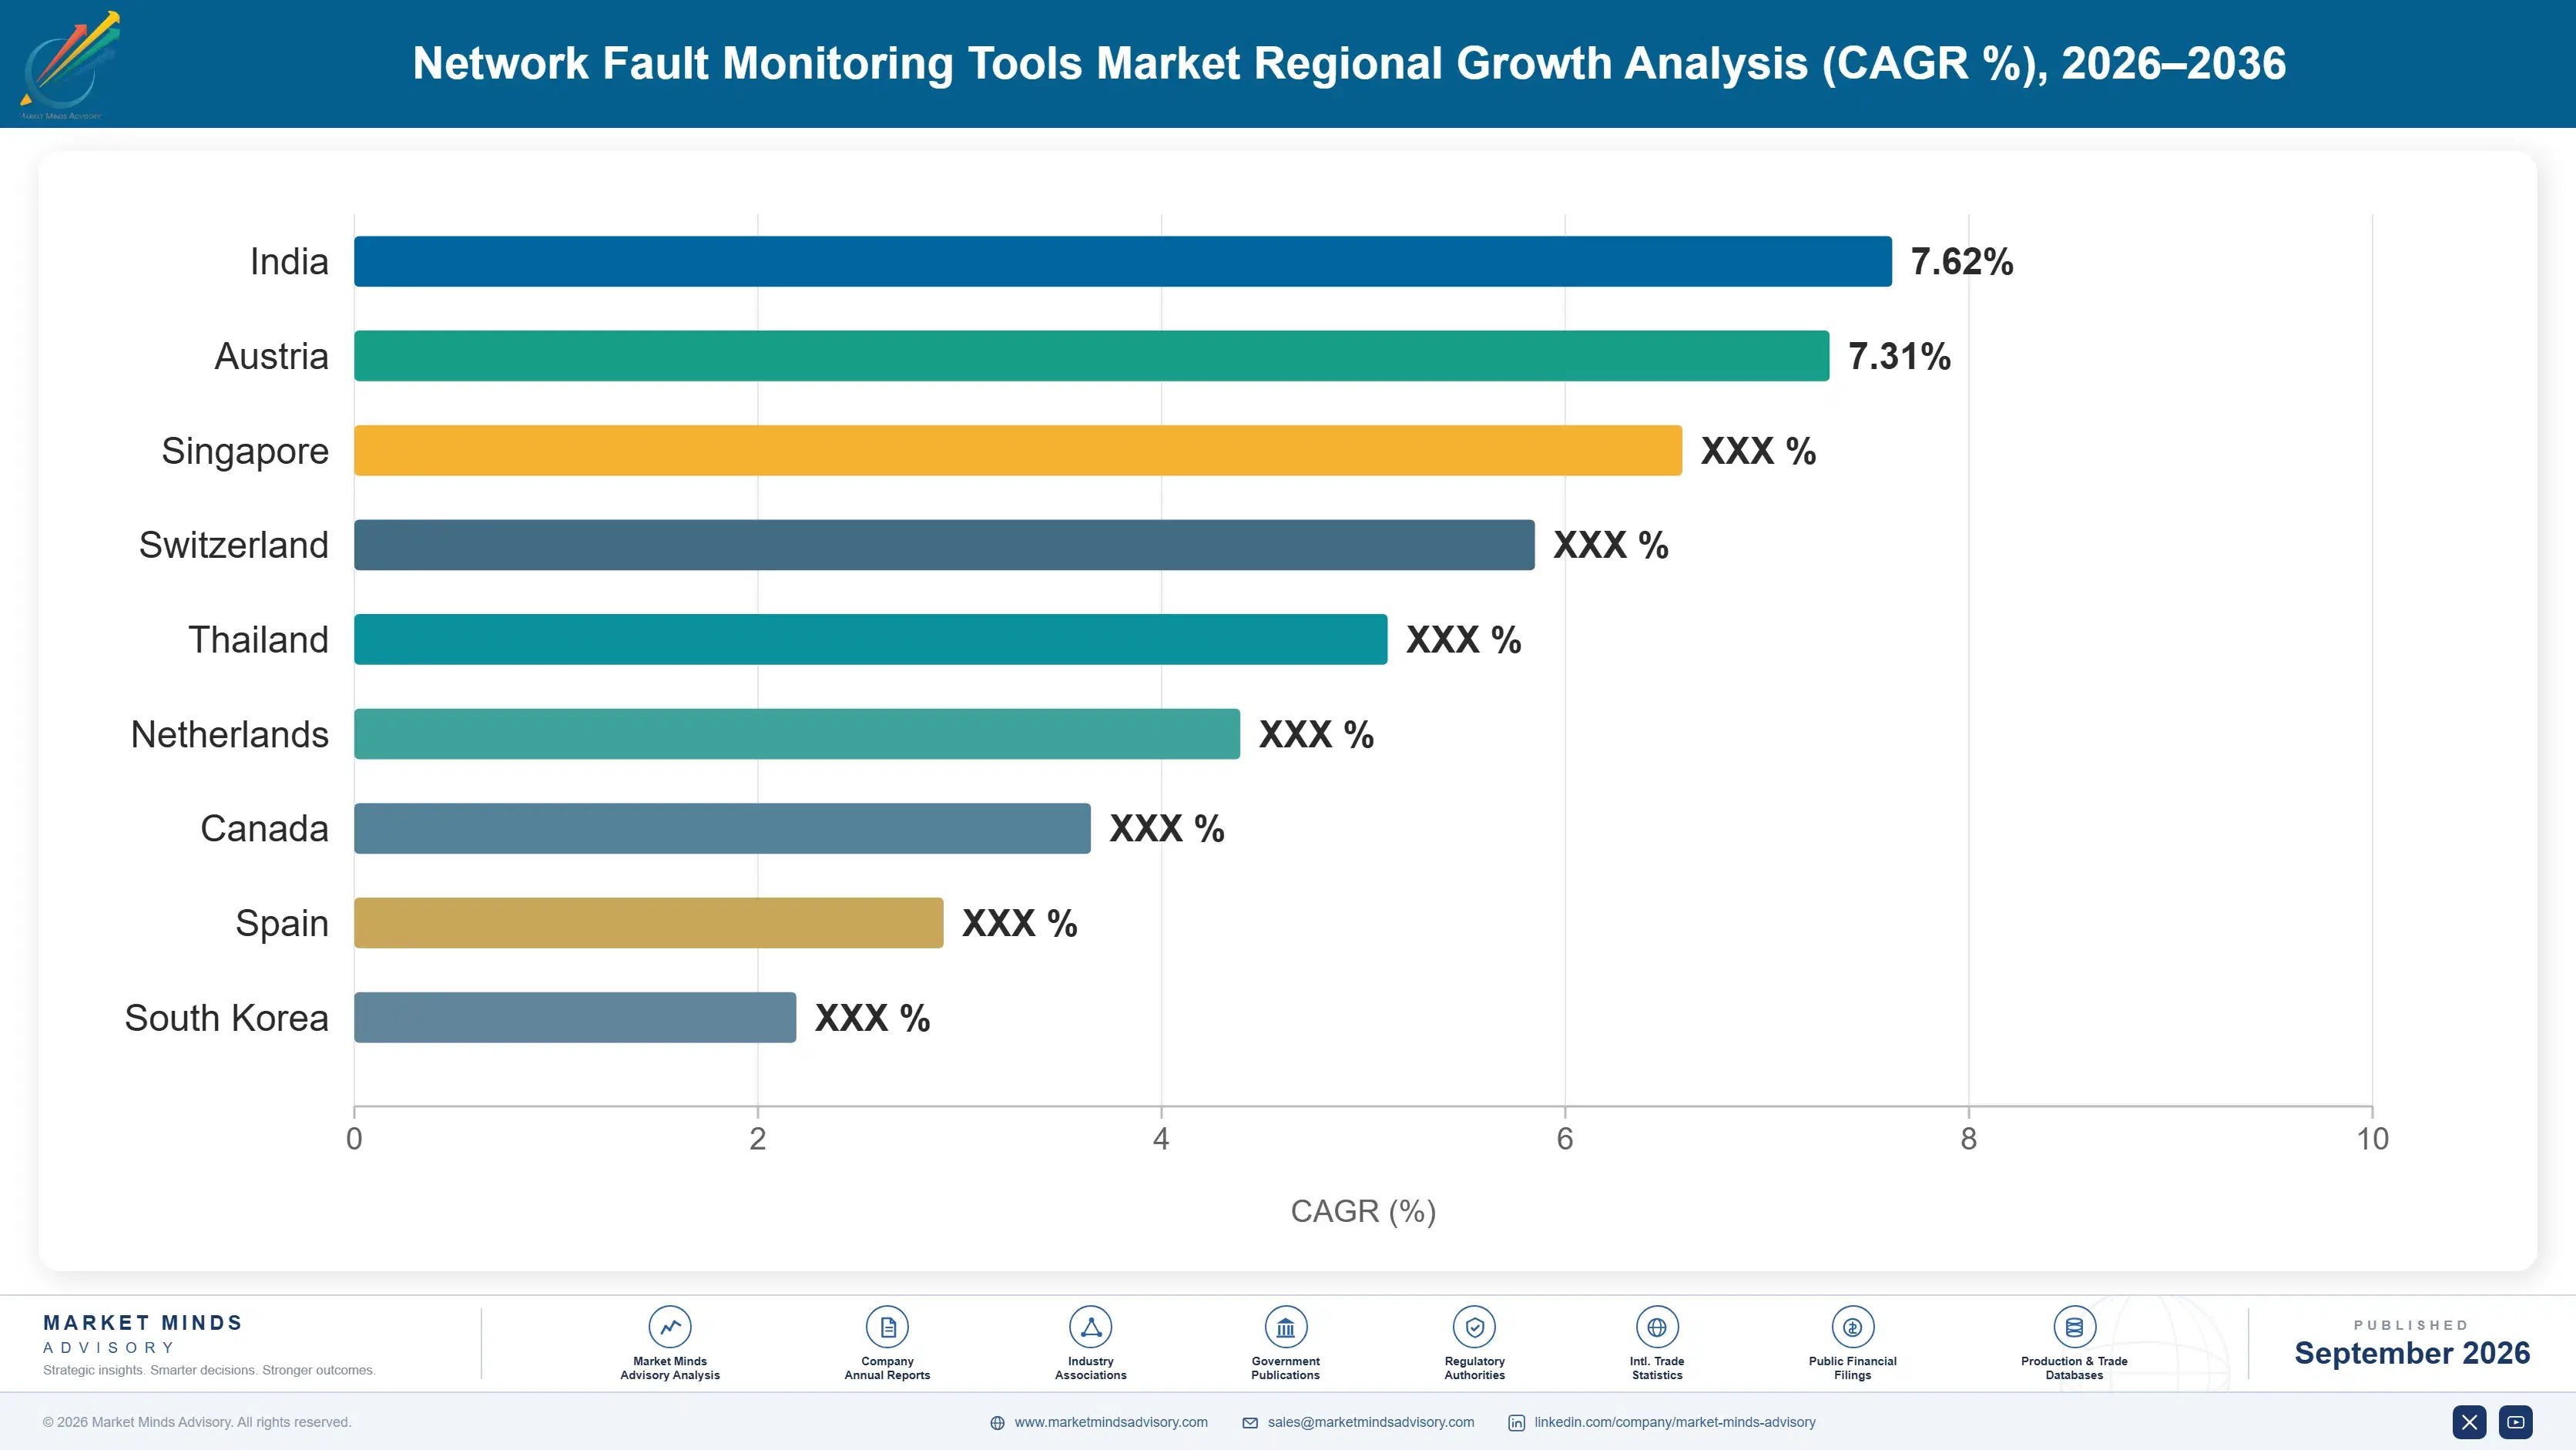
network-fault-monitoring-tools-market-country-cagr-analysis-1789998906180

Competitive Moat and Risk Dimensions

CISCO

Moat: Network Equipment Install Base

Cisco's dominant position in carrier and enterprise network hardware gives it default access to fault telemetry across infrastructure where its equipment already sits, letting it bundle correlation capability without requiring separate sensor deployment. This installed base advantage is difficult for pure-play software competitors to replicate without displacing existing hardware relationships.
CISCO

Risk: Multi-Vendor Correlation Credibility Gap

Cisco's hardware heritage can create credibility concerns among carriers running substantial multi-vendor infrastructure, since customers may question whether Cisco's correlation models treat competing equipment brands with the same accuracy as its own hardware. Independent vendors without equipment manufacturing ties may be perceived as more neutral arbiters of cross-vendor fault correlation.
IBM

Moat: Enterprise AIOps Platform Integration

IBM's broader AIOps and enterprise IT operations platform gives it privileged access to cross-domain telemetry spanning application, infrastructure, and network layers, an integration depth that standalone fault correlation vendors cannot easily replicate without building comparable adjacent capability across each of those layers independently over time.
IBM

Risk: Complex Deployment Slows Value

IBM's broader platform complexity can extend deployment timelines relative to more focused point solutions, since customers must often configure adjacent platform modules before realizing fault correlation value. Carriers seeking rapid deployment may evaluate lighter-weight, purpose-built alternatives instead of committing to IBM's broader platform investment and its associated configuration overhead.

Players Tracked

Prominent Players

Cisco
IBM
Broadcom
ServiceNow
NETSCOUT

Other Key Players

Nokia
Ericsson
Huawei Technologies
Ciena
VIAVI Solutions
Netcracker Technology
Moogsoft
BigPanda
Zabbix
SolarWinds
ManageEngine
Progress Kemp
Nagios Enterprises
Datadog
LogicMonitor

Recent Developments

MARCH 2026

Cisco acquired a specialized AI correlation startup to accelerate development of cross-domain fault isolation models trained on real carrier network data. The acquisition adds machine learning engineering talent with deep expertise in graph-based correlation techniques specifically tuned for large-scale, multi-vendor network topologies spanning core, transport, and radio access domains.
Signal: Signals that major vendors are racing to close cross-domain correlation capability gaps quickly and decisively across the industry.
NOVEMBER 2025

IBM entered a multi-year supply agreement with a major telecom carrier to embed its correlation engine directly within the carrier's network operations center platform. The agreement expands IBM's addressable reach into carrier accounts that had not previously purchased dedicated third-party correlation tooling on their own initiative previously.
Signal: Shows telecom carriers increasingly becoming key distribution partners for specialized correlation vendors across the broader market.
JULY 2025

NETSCOUT expanded engineering and support capacity for its fault correlation platform following sustained demand growth across telecom carrier accounts in North America and East Asia deploying standalone 5G. The expansion includes new regional support centers designed to reduce deployment timelines substantially across mid-size regional carrier accounts.
Signal: Reflects sustained carrier demand growth pulling new capacity investment directly into correlation platform specialists nationwide and abroad.

Cloud Compute and Talent Cost Exposure

Cloud compute and storage capacity for processing fault telemetry at scale represents roughly 27% of vendor cost of goods sold, sourced primarily from the same hyperscale providers that vendors also compete against for enterprise correlation budget. Specialized machine learning engineering talent represents a further 22% of operating cost, sourced from a globally scarce labor pool concentrated in a handful of technology hubs.
A 2025 cloud compute pricing adjustment from a major hyperscale provider raised processing costs for fault correlation pipelines by an estimated 12% for vendors running at scale, compressing gross margins for providers without long-term committed-use pricing agreements in place. Smaller vendors lacking negotiating leverage with hyperscale providers absorbed the increase directly, according to company annual report disclosures covering the affected period, with several noting the increase directly in quarterly earnings commentary.

Vendors dependent on a single cloud provider for compute capacity face greater cost exposure than those maintaining multi-cloud processing architecture, since single-provider dependency removes negotiating leverage during pricing renegotiation cycles. Larger vendors with committed-use discounts and in-house infrastructure engineering teams can absorb these cost shifts more easily than smaller competitors operating on standard public pricing tiers without volume commitments.
network-fault-monitoring-tools-market-company-positioning-matrix-1789998906381

Negotiate Committed-Use Cloud Pricing Agreements Early

Vendors are locking in multi-year committed-use pricing agreements with hyperscale cloud providers before processing volume scales further, securing discounted rates that shield margins from future list-price increases across the contract term. Early movers report meaningfully lower effective compute costs than competitors negotiating later in the cycle, a gap that compounds meaningfully across a multi-year contract horizon.

Diversify Processing Across Multiple Cloud Providers

Multi-cloud processing architecture reduces single-vendor pricing leverage risk and improves negotiating position during renewal cycles, though it adds engineering complexity that smaller vendors sometimes struggle to justify given limited internal infrastructure engineering headcount available for managing several parallel environments across different geographic regions and billing structures simultaneously, an operational burden that grows with each additional relationship.

Build In-House Infrastructure for High-Volume Workloads

Larger vendors are shifting the highest-volume processing workloads onto owned infrastructure rather than public cloud capacity, trading upfront capital expenditure for long-term cost predictability that public cloud pricing cycles cannot reliably guarantee over time, particularly during periods of sustained industry-wide compute demand growth that public cloud vendors periodically pass through as list-price increases across the broader industry.

Portfolio Architecture for Margin Defence

Portfolio economics split across three tiers running from commodity threshold-based alerting to premium AI-driven root cause correlation and forward-looking predictive maintenance platforms. Gross margins widen considerably moving up the tier structure, reflecting the specialized machine learning engineering effort required to build reliable correlation models against complex network fault patterns at carrier scale across diverse infrastructure environments.
Volume-tier alerting tools face persistently lower long-term returns as commoditization pressure intensifies from open-source alternatives and bundled features inside broader observability suites. Premium correlation platforms retain pricing power because customers cannot easily replicate proprietary models trained on years of accumulated fault data across large, diverse carrier networks spanning multiple technology generations and geographic regions accumulated over many years of refinement.

High-value revenue pools concentrate in carrier accounts requiring compliance-grade reporting and managed correlation services layered atop core platforms, where switching costs run highest and renewal rates stay strongest. Vendors positioning purely on price compete for shrinking margin in the volume tier, while those investing in correlation accuracy and proprietary model development capture disproportionate value as the market matures further over the coming decade as buyer sophistication and performance expectations both continue rising steadily.

Threshold-based alerting and basic event log tools competing primarily on price against open-source alternatives, with gross margins in the 30 to 40% range across most vendors in this segment of the market.
Gross Margin

AI-driven correlation platforms with proprietary machine learning models and formal accuracy certifications, carrying gross margins typically between 55 and 65% across the premium vendor base overall, well above commodity-tier alerting tool pricing.
Gross Margin

Predictive maintenance platforms purpose-built for failure forecasting and automated compliance reporting, commanding gross margins above 65% given specialized engineering investment required to build and continuously maintain them against a constantly shifting network landscape.
Gross Margin
network-fault-monitoring-tools-market-cost-volatility-analysis-1789998906893

High-value Sub-segments and Strategic Watch-out

AI-Driven Root Cause Analysis Platforms

The highest-value, fastest-growing segment as carriers replace threshold-based alerting with predictive correlation forecasting, with margins and growth rates both leading the broader market across nearly every region tracked in this report, a lead vendors expect to persist through most of the forecast window ahead across every carrier account tier.

5G Cross-Domain Correlation Tools

A high-value segment growing steadily as carriers deploy standalone 5G core networks requiring correlation across radio, transport, and core domains simultaneously, particularly among dense urban markets deploying the highest small cell densities per square mile anywhere in the world today, straining legacy monitoring tools considerably.

Legacy Threshold-Based Alerting Tools

The volume core of the market, generating steady revenue from installed base renewals even as growth decelerates relative to newer AI-driven and cross-domain categories entering the field and capturing an increasing share of new carrier budget allocation away from legacy threshold-based product lines toward newer predictive platform categories.

OT and Industrial Network Fault Monitoring

A strategic watch-out segment as industrial operators face rising pressure to monitor operational technology networks for fault conditions, a category still underserved by most mainstream enterprise-focused vendors today despite growing regulatory attention toward critical infrastructure resilience requirements across utilities, manufacturing, and energy operators alike across most regions.

Correlation as an Annuity

Network fault monitoring platforms generate durable, multi-year revenue because correlation models trained on accumulated fault history compound in value over time, making replacement costly and operationally disruptive once a model is fully calibrated against a carrier's specific network topology. Renewal rates near 90% reflect this deep integration, since ripping out a correlation layer risks blind spots during any transition period.
Adoption stickiness varies by end-use vertical: telecom carriers show the deepest platform dependence given the years of accumulated fault history that inform correlation accuracy, while technology company data centers show comparatively higher willingness to switch vendors as newer AI capability becomes available in the broader market. Enterprise buyers adopt more cautiously but retain platforms longer once deployed, given the operational complexity and downtime risk associated with network reconfiguration projects.

Buyer profiles are shifting generationally as network operations teams increasingly favor cloud-native, API-driven correlation platforms over traditional appliance procurement processes managed by infrastructure teams of an earlier era. Younger network operations leaders entering decision-making roles show stronger preference for consumption-based pricing and self-service deployment models over the multi-year procurement cycles that defined prior generations of carrier network purchasing decisions across most large organizations.
Section default visual

Where MMA Sees the Advantage

These are among the four positions where our research anticipates prominent divergence between winners and laggards over the coming forecast period. Each is grounded in the demand model, the regulatory perimeter, and the announced capacity pipeline.
01 / AI CORRELATION PLATFORM INVESTMENT

Prioritize AI correlation platforms over threshold-based alerting

Carriers and enterprises should direct new network operations budget toward AI-driven root cause analysis platforms rather than incremental threshold-based alerting upgrades, since automated correlation is becoming the primary differentiator across most large network operators today. The fastest-growing segment expands at 15.4% CAGR, roughly 1.60 times the overall market rate, concentrated heavily among telecom carriers and hyperscale data center operators. Vendors and buyers slow to make this shift risk falling behind competitors already capturing this growth across every major geography tracked in this analysis.
02 / MANAGED CORRELATION BUNDLING

Bundle managed correlation services to capture higher account value

Vendors should expand managed correlation service tiers rather than competing purely on software licensing, since bundled services add 30 to 45% incremental account revenue while addressing the persistent network operations talent shortage constraining many buyers. Mid-size carriers lacking dedicated operations staff represent the fastest-growing buyer segment for these bundled offerings. Vendors without managed capability already are losing competitive displacement opportunities to better-resourced rivals offering fully bundled managed service packages ahead of the broader competitive field this cycle and the next.
03 / NORTH AMERICAN ACCOUNT CONCENTRATION

Concentrate enterprise sales investment across North America first

North America holds 29% of global market share and remains the primary proving ground for new correlation capability given its concentration of major carrier and hyperscale headquarters. Vendors should prioritize account expansion and product launch sequencing there before other regions. Renewal rates and average deal size both run higher across the region than the broader global sector nationwide and across most comparable international markets tracked across this entire report's regional coverage across all seven geographies this report evaluates in depth.
04 / LEGACY INTEGRATION RISK

Address legacy equipment gaps before scaling deployment further

Legacy telecom equipment lacking modern telemetry export capability threatens to extend deployment timelines and leave fault visibility gaps if left unaddressed by vendors racing to ship new capability. The root cause is a multi-decade gap between hardware refresh cycles and the pace of correlation software innovation. Vendors that invest in lightweight protocol adapters bridging legacy equipment will outcompete rivals requiring full infrastructure replacement across every legacy network segment still operating in production networks today, particularly across mid-size regional carriers with limited capital budgets available.

Engagement Snapshot From the Field

A live engagement with an industry participant carrying material or product regulatory and market exposure ahead of a defining policy shift, showing how our research translates into a defensible multi-year portfolio strategy.
MARKET MINDS ADVISORY · CLIENT ENGAGEMENT SUMMARY
Network Fault Monitoring Tools Producer Strategic Portfolio Review and Transition Roadmap 2026·Investment Scenario on Network Fault Monitoring Tools Exposure Evaluation 2025-26
CLIENT PROFILE
The client is a regional telecom carrier serving several million subscribers across a dense metropolitan and suburban coverage area, operating a legacy network operations center built primarily around threshold-based alerting from multiple prior equipment generations. Facing rising customer complaints tied to extended outage resolution times during 5G small cell rollout, leadership sought an independent assessment of which correlation architecture could resolve both legacy and new network fault visibility simultaneously.
STRATEGIC CHALLENGE
The carrier's existing alerting tools could no longer isolate root cause quickly enough during major outages, creating a pattern of extended troubleshooting that internal teams had flagged as unsustainable during the most recent network operations review. Competing regional teams favored different vendors, creating fragmented coverage and duplicated licensing costs across the carrier's network.
MMA APPROACH
MMA evaluated five leading fault correlation vendors against a standardized scoring framework covering correlation accuracy, legacy equipment compatibility, and total cost of ownership across the carrier's actual fault event history. The engagement combined vendor proof-of-concept testing against live network fault data, reference customer interviews within telecommunications, and total cost of ownership modeling across a five-year deployment horizon.
KEY FINDINGS
  1. Two of five evaluated vendors demonstrated meaningfully higher correlation accuracy against the carrier's actual fault data during proof-of-concept testing, reversing the carrier's prior vendor shortlist.
  2. Consolidating around a single vendor rather than region-specific tools reduced projected five-year total cost of ownership by an estimated 27% across the network.
  3. Automated root cause correlation could reduce mean time to repair by roughly 48% based on pilot testing results across three network zones.
  4. Legacy equipment compatibility varied considerably across vendors, with only two offering adequate protocol translation support for the carrier's oldest legacy network segments still active.
CLIENT PROFILE
The client is a regional telecom carrier serving several million subscribers across a dense metropolitan and suburban coverage area, operating a legacy network operations center built primarily around threshold-based alerting from multiple prior equipment generations. Facing rising customer complaints tied to extended outage resolution times during 5G small cell rollout, leadership sought an independent assessment of which correlation architecture could resolve both legacy and new network fault visibility simultaneously.
STRATEGIC CHALLENGE
The carrier's existing alerting tools could no longer isolate root cause quickly enough during major outages, creating a pattern of extended troubleshooting that internal teams had flagged as unsustainable during the most recent network operations review. Competing regional teams favored different vendors, creating fragmented coverage and duplicated licensing costs across the carrier's network.
MMA APPROACH
MMA evaluated five leading fault correlation vendors against a standardized scoring framework covering correlation accuracy, legacy equipment compatibility, and total cost of ownership across the carrier's actual fault event history. The engagement combined vendor proof-of-concept testing against live network fault data, reference customer interviews within telecommunications, and total cost of ownership modeling across a five-year deployment horizon.
KEY FINDINGS
  1. Two of five evaluated vendors demonstrated meaningfully higher correlation accuracy against the carrier's actual fault data during proof-of-concept testing, reversing the carrier's prior vendor shortlist.
  2. Consolidating around a single vendor rather than region-specific tools reduced projected five-year total cost of ownership by an estimated 27% across the network.
  3. Automated root cause correlation could reduce mean time to repair by roughly 48% based on pilot testing results across three network zones.
  4. Legacy equipment compatibility varied considerably across vendors, with only two offering adequate protocol translation support for the carrier's oldest legacy network segments still active.
RECOMMENDED STRATEGY
Phase 1: Phase one consolidates fault correlation procurement under a single vendor agreement, replacing the carrier's fragmented regional tooling entirely within two quarters. Phase 2: Phase two sequences deployment starting with the network zones facing the most frequent outage incidents, then extends to remaining zones on a rolling basis. Phase 3: Phase three activates automated root cause correlation network-wide, reducing repair times across the carrier's full coverage area over the following two years.
OUTCOME
The carrier approved a vendor consolidation agreement covering its full network with a projected five-year technology spend of approximately $48 million (client-reported, unverified by MMA). Internal network operations reporting credited the new architecture with cutting customer-facing outage resolution times meaningfully within the first two quarters of deployment.

Frequently Asked Questions

Foundational context covering the market sizes, CAGR, scope, country, region and competition that inform every finding below. This section is provided to cover basics and most often pre-purchase conversations, answered from the MMA Primary Research Dataset.

What is the current size of the Network Fault Monitoring Tools Market?

The global Network Fault Monitoring Tools market reached $5.9 billion in 2025. Growth is driven primarily by rising fault event volumes and 5G network complexity across telecom infrastructure.

How large will the Network Fault Monitoring Tools Market be by 2036?

The market is projected to reach $16.18 billion by 2036. This reflects sustained carrier demand for automated correlation across increasingly heterogeneous network infrastructure across the world.

What is the CAGR for the Network Fault Monitoring Tools Market 2026 to 2036?

The market is forecast to grow at a 9.6% CAGR between 2026 and 2036. This accelerates from the 8.7% historical CAGR recorded over 2020 to 2025.

Which segment is growing fastest?

AI-Driven Root Cause Analysis Platforms is the fastest-growing segment, expanding at 15.4% CAGR, roughly 1.6 times the overall market rate. Automated correlation concentrates demand in this category.

Who are the major companies in the Network Fault Monitoring Tools Market?

Cisco, IBM, Broadcom, ServiceNow, and NETSCOUT lead the competitive landscape, together holding an estimated 48% combined share. Each competes on correlation accuracy and platform breadth.

Which country is growing fastest?

China is the fastest-growing country market, expanding at 13.2% CAGR. Massive telecom subscriber scale is driving accelerated correlation platform procurement across the entire national market.

Report Segmentation Architecture

The full report scope spans multiple orthogonal segmentation dimensions, with cross-tabulated demand data provided for each dimension pair. Coverage extends further to regional breakdowns, trend trajectories, and the competitive detail needed to support segment-level decision-making.

By Technology Type (AI Correlation, Threshold Alerting, Predictive Maintenance)

    By End-Use Industry (Telecom Carriers, Data Centers, Enterprise IT)

      By Commercial Dimension (Enterprise Direct, Managed Service, Channel Partner)

        By Region

        • East Asia
        • North America
        • Western Europe
        • South Asia and Pacific
        • Latin America
        • Middle East and Africa
        • Eastern Europe

        Scope, Methodology, and Coverage

        Every figure in this report is reproducible from documented input assumptions. The scope below maps the historical period, the forecast horizon, the segmentation dimensions, and the countries covered, alongside the underlying primary and qualitative methodology.
        Historical Period
        2020 to 2025
        Forecast Period
        2026 to 2036
        Base Year
        2025 (USD billions; MMA Primary Research Dataset, September 2026)
        Market Definition
        This report defines the Network Fault Monitoring Tools Market as software platforms that detect, correlate, and diagnose network failures and performance degradation, including root cause analysis, event correlation, and fault prediction tools. It excludes general network performance optimization software without dedicated fault diagnosis capability, physical test equipment, and IT service management ticketing systems.
        Quantitative Units
        USD billions, market share percentages, CAGR percentages
        Segmentation Dimensions
        Technology type, end-use industry, commercial dimension, region
        Regions Covered
        East Asia, North America, Western Europe, South Asia and Pacific, Latin America, Middle East and Africa, Eastern Europe
        Countries Covered
        United States, China, Japan, Germany, India, United Kingdom, Brazil, United Arab Emirates, and 22 additional markets
        Key Companies Profiled
        Cisco, IBM, Broadcom, ServiceNow, NETSCOUT, and 15 additional participants
        Quantitative Methodology
        Primary survey, n=3,800 respondents, Q4 2025, six countries; demand-side model with trade association cross-validation
        Qualitative Methodology
        47 expert interviews, Q4 2025; applied to validate demand model assumptions, identify emerging dynamics, and assess competitive positioning
        Report Format
        PDF and XLSX data workbook (Word format preview document)
        Publisher
        Market Minds Advisory
        Report Code
        MMA-2026-TEC-167
        Published
        September 2026
        Contact
        sales@marketmindsadvisory.com | www.marketmindsadvisory.com

        Purchase the full Network Fault Monitoring Tools Market Report (2026 to 2036).

        This report examines the global network fault monitoring tools market across AI correlation, threshold alerting, and predictive maintenance categories through the year 2036, covering both established carrier buyers and emerging mid-market segments. It quantifies demand shifts driven by 5G complexity and rising fault volumes. Profiles of five leading vendors sit alongside fifteen additional participants, assessed on a common concentration and capability basis. Regional adoption patterns are detailed across all seven geographies in the underlying dataset. Coverage also includes forecast scenarios, cost exposure, and portfolio margin economics across three equipment tiers.
        Ten-year demand forecast by technology category
        Vendor correlation accuracy and coverage benchmarking
        Regional adoption pattern analysis across seven geographies
        Cloud compute cost exposure and mitigation assessment
        Portfolio margin economics across three product tiers
        Competitive positioning and moat durability assessment

        Built For The People Who Decide

        From boardroom strategy to bench-side execution, this report is read cover-to-cover by leaders shaping the next decade of their industry, turning demand scenarios, market dynamics and valuation benchmarks into decisions.
        CXOs/ Presidents/ VPs/ Managers
        M&A and Corporate Development
        Strategy Teams and R&D Heads
        Procurement and Product Directors
        Regulatory and Compliance Leaders
        Investor Relations and Equity Analysts