Market Minds Advisory
Network Centric Warfare Market

Network Centric Warfare Market: Interface Ownership, Coalition Interoperability and What Ukraine Demonstrated

Twenty-five years of selling integration as the answer, in a domain where the actual obstacle is that no nation and no vendor will ever accept somebody else's data model as the standard.

Lead Analyst

Published

September 2026

Make Smarter Decisions with Customized Research Insights

Request a free sample report and evaluate market opportunities, growth trends, and competitive dynamics relevant to your business needs.

2025 MARKET VALUE$58.0BMarket Size 2025
2036 FORECAST VALUE$146.7BBase Case , 2026 to 2036
CAGR 2026 TO 20368.8 %Bull 10.0% / Bear 7.6%
INCREMENTAL OPPORTUNITY$83.6BNet 10- year value creation
EXPANSION MULTIPLE2.32x2036 value over 2026 base
Strategic Levers
M&A Pipeline
Regional Outlook
Country Rankings
Competitive Intelligence
Segmental Deep-dive
Call-Us : 91 93563 13602

Executive Snapshot and Market Trajectory

Roughly 34% of contract value in this market is spent connecting systems that already exist to other systems that already exist. That is not a technology problem. It is a consequence of every nation and every vendor refusing to adopt somebody else's data model.
Ukraine changed the argument rather than settling it. A loosely coupled network assembled from commercial connectivity, open interfaces and rapidly written software outperformed tightly integrated doctrinal architectures that had taken twenty years and considerably more money to build. Commercial components now account for 27% of programme value. Every prime whose proposition rested on being the integrator has had to explain why that proposition still holds. Not all of them have managed to do so.
Where money moves next is toward the edge. Tactical edge computing and autonomy grows at 13.2% because decisions taken at the sensor rather than at a headquarters remove the transport dependency that jamming and distance both attack. Software is already 58% of programme value. North America leads spending decisively, though European growth is front-loaded into the next five years rather than spread evenly. That distinction matters commercially here.
Market Definition
Revenue from systems, software and services connecting military sensors, decision nodes and effectors into an operational network, spanning tactical data links and waveforms, battle management and command systems, sensor fusion and processing, secure transport and satellite connectivity, tactical edge computing and autonomy, and cyber defence with spectrum operations. Excludes the sensors, weapons and platforms themselves, general purpose defence enterprise information technology, and commercial telecommunications infrastructure not procured for military networking.
Base Year Value
$58.0B in 2025 (MMA Primary Research Dataset, August 2026)
Forecast Period
2026 to 2036, eleven discrete annual values
CAGR
8.8% base case. Bull 10.0%. Bear 7.6%.
Fastest Growth Segment
Tactical Edge Computing and Autonomy: 13.2% CAGR
Fastest Growth Country
India: 10.8% CAGR
Fastest Growth Region
South Asia and Pacific: 10.8% CAGR
Largest Region
North America: 32% of 2025 global value
Market Leaders
RTX, Lockheed Martin, L3Harris Technologies, Northrop Grumman and Thales lead on defence networking and command programme revenue. Source: company annual reports and MMA Primary Research Dataset, July 2026.
Primary Survey
n=3,800 procurement and R&D decision-makers, Q4 2025, six countries
Methodology
Demand-side build-up, cross-validated against public data, 47 expert interviews

Network Centric Warfare Market Forecast Scenarios

network-centric-warfare-market-size-forecast-scenario-1787982893731
The 2020 to 2025 period reset assumptions that had held since the concept was first articulated. Programmes conceived around exquisite integration ran slowly and expensively while a conflict demonstrated that commercial connectivity plus open interfaces could deliver useful capability in weeks. Alliance spending commitments then rose sharply from 2022 onward. Revenue compounded near 7.4% across the period, with the composition changing far faster than the total did.
Three mechanisms support the base case. Alliance spending commitments agreed during 2025 raise sustained procurement across European members for a decade rather than for a budget cycle. Coalition interoperability requirements multiply the connective work, because each additional participating nation adds interfaces rather than simply adding users. And software content keeps rising as a share of programme value, which shifts revenue toward participants able to deliver and then sustain it properly.
The bull catalyst is a major alliance adopting a common data standard with genuine enforcement behind it, which would convert integration spending into capability spending and expand the market rather than merely redistributing it. The bear risk is procurement reform: if buyers move decisively toward commercial software subscription models, programme values fall sharply even as delivered capability improves.

Paying To Connect What Was Bought Separately

The founding argument was that connecting sensors to shooters produces more capability than improving either separately. That argument was correct and it has been unusually expensive to act on, because nations bought their sensors, command systems and effectors from different vendors across four decades under different security classifications. Roughly 34% of contract value now goes into connecting things rather than into anything that senses, decides or acts.
MARKET CONCENTRATION CR539%Share of programme revenue held by the largest integrators
PROGRAMME INTEGRATION SHARE34%Contract value absorbed by connecting existing systems together
FIELDING CYCLE LENGTH41 monthsElapsed time from award to operational capability release
INTEROPERABLE NODE COUNT1,240Distinct systems requiring connection on a coalition network
SOFTWARE CONTENT SHARE58%Programme value delivered as software rather than hardware
COMMERCIAL COMPONENT SHARE27%Programme value sourced from non defence commercial suppliers
Coalition operations multiply the difficulty rather than adding to it. A network supporting one nation connects perhaps a few hundred distinct systems. A coalition network approaches 1,240, because each additional participant brings its own equipment, its own classification rules and its own release authorities. The interfaces grow faster than the participants do, and no alliance has yet imposed a data standard with enough authority behind it to stop that arithmetic.
Ukraine produced the most uncomfortable evidence this field has seen. Commercial satellite connectivity, open interfaces and software written in weeks delivered targeting and situational awareness that compared favourably with architectures built over two decades. Commercial components now represent 27% of programme value. That figure understates the influence, because the more important change is what buyers now believe is possible on what timescale.
"Every nation wants interoperability and every nation wants its own data model to be the one everybody else adopts. That single sentence explains roughly a third of the spending in this market and most of the schedule overruns."
Director, Defence Systems and Command Practice · MMA Aerospace and Defence Systems Practice · August 2026

Market Trends

Commercial Software Vendors Win Command System Contracts

Buyers who once specified a defence prime for anything touching operational data have started awarding command and intelligence software contracts to commercial technology companies, on the reasoning that delivery cadence matters more than defence heritage. An alliance procurement of a commercial decision support system during 2025 marked the point where this stopped being an American experiment. The primes retain platform integration and classified work. What they have lost is the assumption that operational software must come from them, and that assumption underpinned considerable pricing. That assumption is not coming back either.
Market Impact: Commits 5% output by 2035

Processing Moves To The Sensor Rather Than The Headquarters

Networks that route raw data to a central node for processing depend entirely on transport, and transport is precisely what jamming, distance and contested spectrum attack first. Moving processing to the sensor produces decisions that survive a degraded link, at the cost of hardware, power and cooling on a platform with little of any. This is the fastest growing layer in the market at 13.2%, and it changes procurement too, since edge capability is bought as software refresh cycles rather than as a system replaced every fifteen years. Power and cooling are the real constraints.
Market Impact: Connects 1,240 distinct systems

Market Opportunities and Growth Drivers

Alliance Spending Commitments Extend Beyond Budget Cycles

Members of the principal Western alliance agreed during 2025 to raise defence-related spending toward 5% of national output by 2035, split between core defence and broader resilience. That converts procurement from an annual argument into a decade-long trajectory, which changes what suppliers will invest against. Networking and command programmes benefit disproportionately, because they are the capability that makes existing platforms more effective without buying new ones. Ministries under pressure to show capability rather than inventory reach for exactly this spending. A decade-long trajectory changes what suppliers will invest against, which is the point.
Market Impact: Blocks 34% of integration value

Coalition Interoperability Multiplies The Connective Requirements Involved

Each nation joining a coalition network adds its own equipment, classification rules and release authorities, so interfaces grow faster than participants. A coalition architecture now connects approaching 1,240 distinct systems, against a few hundred for any single nation operating alone. Federated network standards help and do not solve it, because standards govern transport rather than meaning, and two systems can exchange messages neither can properly interpret. That gap is where a large share of integration spending permanently sits. No alliance has yet imposed a standard with enough authority behind it to stop this.
Market Impact: Runs 41 months to fielding

Market Restraints and Challenges

Classification Rules Prevent The Integration Being Bought

Networks are procured to share information and then constrained by release authorities that prevent most of it moving between nations or between security domains. The root cause is that classification policy is set nationally by intelligence authorities while interoperability requirements are set multinationally by military staffs, and the two are not reconciled anywhere. Programmes deliver capability that policy forbids using. Mitigation runs through cross-domain solutions, data-centric labelling that travels with the information itself, and releasability designed into the architecture rather than applied afterwards. Policy and requirements are set by different people entirely.
Market Impact: Awards reach 27% commercial share

Fielding Cycles Outlast The Threat They Addressed

Forty-one months from award to operational release means a capability specified against one threat picture arrives against another, and electronic warfare and autonomy both move considerably faster than that. The root cause is a requirements and test regime built for platforms with thirty year lives applied to software with three year relevance. Buyers mitigate through iterative delivery contracts, minimum viable capability releases followed by refresh, and separating the software procurement from the platform it eventually runs on entirely. A capability arriving three years late against a fast-moving threat is not a capability at all.
Market Impact: Grows edge processing 13.2% annually
3 additional market trends, 4 additional growth drivers, and 2 additional restraints and challenges are covered in the full report. Contact sales@marketmindsadvisory.com to access the complete intelligence.

Segment CAGR and Growth Architecture

Segmentation follows the capability layer, since that determines who competes, what the procurement looks like and how quickly the technology turns over. Six layers describe the market completely, from the tactical data links that carry the traffic through to the cyber and spectrum operations that decide whether any of that traffic actually arrives at all.
network-centric-warfare-market-market-share-analysis-1787982894299

Tactical Edge Computing and Autonomy

The fastest layer grows at 13.2%, half again the market rate of 8.8%, and the reasoning is defensive rather than enthusiastic. A network that routes raw sensor data to a headquarters for processing depends entirely on transport, and transport is the first thing an adversary attacks through jamming, spoofing or simple distance. Processing at the sensor produces a decision that survives a degraded link. The costs are hardware, power and cooling on platforms that have very little of any. Procurement changes too: edge capability is bought as recurring software refresh rather than as a system replaced once every fifteen years, which suits commercial suppliers considerably better than it suits traditional primes.
CAGR 13.2%

Cyber Defence and Spectrum Operations

Cyber and spectrum work grows at 11.4% because a network is only worth what remains of it under attack, and both electronic and cyber attack have proved far more effective in recent conflicts than pre-war doctrine assumed. The layer covers protection of the network itself, spectrum management under contested conditions, and offensive capability that most buyers decline to discuss publicly. Technology turnover here is faster than anywhere else in the market, measured in months rather than years, which makes traditional procurement structures actively unsuitable. Buyers increasingly contract for a sustained capability service rather than for a delivered system, and very few primes are configured to sell anything that way at all.
CAGR 11.4%
Full segment breakdown across 6 segments available in the complete report.

Regional Architecture and Country Demand Map

Spending follows defence budgets and alliance commitments, so the market is distributed but heavily weighted. North America leads decisively on the scale of American command and control programmes, with Western Europe and East Asia holding substantial and rapidly growing positions driven by rearmament and by regional competition respectively.

North America

The largest share sits here at 32%, and the reason is simply the scale of American joint command and control ambition, which declared an initial operating capability during 2024 and continues to fund connective work across every service. Commercial technology companies have taken operational software contracts that defence primes once regarded as protected, and the reasoning offered by buyers is delivery cadence rather than cost. Canadian participation runs through alliance programmes. Classification policy remains the binding constraint here as everywhere, and it is set by authorities who do not answer to the programmes it obstructs. Nothing about that constraint is likely to change, and every programme here is priced as though it might.
Share: 32% | CAGR: 8.6% (2026 to 2036)

Western Europe

Rearmament following 2022 has pushed this region into sustained procurement growth, and alliance spending commitments agreed during 2025 extend that trajectory across a decade rather than a budget cycle. The ten-year growth rate understates the near term considerably, because European expansion is front-loaded into the next five years. Thales, Leonardo, BAE Systems, Airbus, Saab and Hensoldt all hold substantial positions, and European programmes are deliberately distributed across national industrial bases. That distribution is precisely what makes coalition interoperability expensive to achieve afterwards. European suppliers therefore compete for work allocated by industrial policy while carrying engineering costs that a single-nation competitor never sees, which is a position that funds capability and rewards efficiency very poorly indeed.
Share: 23% | CAGR: 7.6% (2026 to 2036)
Regional intelligence for 5 additional markets available in the complete report: East Asia, South Asia and Pacific, Latin America, Middle East and Africa, Eastern Europe. Contact sales@marketmindsadvisory.com.
network-centric-warfare-market-country-cagr-analysis-1787982894826

Where Network Programme Margin Sits

Four levers work on delivery model, interface ownership and sustainment rather than on technical capability, which most credible competitors in this field already hold. Iterative contracting, data standard positioning, edge software subscription and coalition release engineering each address something a supplier controls before any requirement is finalised at all. Technical capability decides very little here.

Contract For Iterative Release Not Final Delivery

Forty-one months from award to operational release means a capability specified against one threat picture arrives against a different one, which buyers now understand and increasingly write into contracts. Suppliers structuring for minimum viable capability followed by scheduled refresh reach revenue 18 to 22 months earlier and hold the relationship through subsequent cycles rather than recompeting. The trade is lower initial contract value against considerably longer duration. Suppliers organised around milestone delivery and formal acceptance find this genuinely difficult, which is precisely why it remains available. The window is open precisely because it is uncomfortable.
Market Impact: Reaches programme revenue some 20 months earlier typically

Own The Data Model Rather Than The Boxes

Roughly 34% of contract value goes into connecting systems, and whoever defines the data model that others translate into holds a position no hardware contract produces. Suppliers whose schema becomes the reference for a coalition programme capture translation work across every subsequent connection, typically worth 15% to 25% of each downstream integration. The position is won during requirements definition rather than during competition, which means it is won by engineers seconded to a customer rather than by anybody in a sales function. Requirements definition is where the position is won or lost entirely.
Market Impact: Captures around 20% of every downstream integration contract

Sell Edge Capability As Refresh Not As Equipment

Edge computing and autonomy grow at 13.2% and turn over in months rather than in the fifteen year cycles platform procurement assumes. Selling recurring software refresh against a fielded hardware base produces revenue roughly 2.4 times the equivalent one-time system sale across a decade, and it keeps the supplier inside the capability rather than outside it. Buyers accept the model where they have seen delivery cadence demonstrated. Traditional primes struggle to price it because their cost structures assume revenue recognised at delivery rather than continuously. That is an accounting obstacle rather than a commercial one.
Market Impact: Earns around 2.4 times a one-time system sale

Engineer Releasability Into The Architecture Early

Coalition programmes routinely deliver capability that classification policy then forbids using, because releasability is applied after design rather than built into it. Suppliers designing data-centric labelling that travels with the information, and cross-domain paths agreed with release authorities during requirements work, avoid rework that typically consumes 12% to 18% of programme value on multinational efforts. The engineering is not difficult. Obtaining agreement from national release authorities before design freeze is difficult, and almost nobody attempts it early enough. Release authorities do not attend supplier design reviews unless somebody invites them properly.
Market Impact: Avoids around 15% of the programme rework cost

Who Controls the Margin Pool

Concentration is low for a defence market at around 39% across the five largest participants, because national procurement preferences fragment the field deliberately. American primes dominate their home market, European suppliers hold positions protected by industrial policy, and Israeli and Indian suppliers compete effectively on cost and delivery speed. No participant holds a global position, and the barriers are political rather than technical.
Competition runs on three dimensions. Delivery cadence is the first and has become decisive since buyers watched software written in weeks outperform programmes written over years. Interface position is the second, because the supplier whose data model becomes the reference captures downstream work indefinitely. National industrial standing is third, determining who may bid at all on sovereign programmes regardless of merit.

Pressure arrives from commercial technology, not from other defence suppliers. Software companies with no defence heritage now win operational command and intelligence contracts, pricing against subscription economics rather than cost-plus structures. Alliance procurement of such a system during 2025 confirmed the shift. Rankings move against primes holding neither delivery cadence nor an interface position, since platform integration alone no longer commands what it did.
network-centric-warfare-market-company-positioning-matrix-1787982895354

Competitive Moat and Risk Dimensions

L3HARRIS TECHNOLOGIES

Moat: Tactical radio and waveform base

L3Harris holds an installed base of tactical radios and waveforms across American and allied forces that makes it the default path for any new capability needing to reach the tactical edge. Waveform certification and interoperability testing take years, so the position renews itself through every refresh cycle. Displacing an installed waveform means requalifying an entire fleet.
L3HARRIS TECHNOLOGIES

Risk: Hardware weighted revenue mix

Revenue remains weighted toward hardware in a market where software already represents 58% of programme value and is rising, and hardware refresh cycles run considerably longer than software ones. Commercial suppliers competing on delivery cadence are taking exactly the software content that grows fastest. Building comparable software delivery cadence means changing engineering culture rather than acquiring another product line.
THALES

Moat: European sovereign programme positions

Thales holds command, communications and cyber positions across French and wider European sovereign programmes that are allocated on industrial policy grounds rather than won purely competitively, producing revenue visibility across decades. Alliance spending commitments extend that trajectory considerably. Building comparable national standing from outside Europe is effectively impossible, because the qualifying criteria are political rather than commercial.
THALES

Risk: Fragmented national requirement sets

Serving many European nations with distinct requirements, classification rules and release authorities produces engineering costs that a single-nation supplier never carries, and those costs cannot be recovered through volume because each variant is small. Consolidation of European requirements would help enormously and has been discussed for thirty years. Meanwhile every additional national customer adds cost faster than it adds revenue.

Players Tracked

Prominent Players

RTX
Lockheed Martin
L3Harris Technologies
Northrop Grumman
Thales

Other Key Players

BAE Systems
Leonardo
General Dynamics Mission Systems
Elbit Systems
Israel Aerospace Industries
Rafael Advanced Defense Systems
Anduril Industries
Palantir Technologies
Airbus Defence and Space
Saab
Hensoldt
Rheinmetall
Booz Allen Hamilton
Peraton
Bharat Electronics

Recent Developments

FEBRUARY 2024

American joint command capability declared initial operating status

The United States Department of Defense declared an initial operating capability for its combined joint all-domain command and control effort, marking the point at which connective capability moved from concept development into fielded programme delivery. This was a departmental capability declaration rather than any commercial transaction between suppliers.
Signal: The connective layer became a funded programme of record rather than a concept everybody agreed with abstractly.
FEBRUARY 2025

Commercial technology supplier took over soldier command programme

A commercial technology company assumed leadership of a major soldier-borne mission command and augmented reality programme previously led by a large software corporation, following performance and fielding difficulties. This was a programme transfer arranged by the customer rather than any merger, acquisition or joint venture between the companies involved.
Signal: Defence buyers will move a programme between suppliers on delivery cadence far faster than they once would.
APRIL 2025

Alliance procured commercial decision support software directly

A Western military alliance contracted directly for a commercial artificial intelligence decision support system for operational planning and targeting, bypassing the traditional prime integration route entirely. This was a procurement decision by an alliance acquisition agency rather than any commercial arrangement between defence suppliers themselves.
Signal: Operational software no longer has to come from a defence prime, and that assumption underpinned considerable pricing.

What Connecting Systems Actually Costs

Programme cost divides into four components that behave differently under schedule pressure. Software engineering and integration labour absorb roughly 41% of programme cost and scale with the number of interfaces rather than with capability delivered. Test, accreditation and security certification run near 26%, hardware and installation near 21%, and programme management with documentation accounts for the remaining 12% on a typical multinational effort.
Coalition programmes demonstrate how quickly the largest component moves. Adding a nation to a network multiplies interfaces rather than adding them, and each interface requires engineering, testing and separate accreditation under that nation's rules. RTX and Thales both discussed programme complexity and schedule pressure on multinational efforts across recent reporting periods. Integration labour on those programmes routinely exceeds the original estimate by a wide margin, and the overrun is almost never in the capability itself.

Exposure varies by programme structure and by whose data model was adopted. Suppliers whose schema became the reference translate outward once and charge others to translate inward. Suppliers translating into somebody else's model carry that cost on every connection permanently. Nations with fragmented national requirements carry engineering costs that single-customer suppliers never see, and cannot recover them through volume.
network-centric-warfare-market-cost-volatility-analysis-1787982895550

Data-centric labelling replacing perimeter classification

Attaching releasability and classification to the data itself, rather than to the network segment carrying it, allows information to cross domains without rebuilding the architecture for each national release rule. The engineering is well understood and the agreement with release authorities is not. Programmes securing that agreement before design freeze avoid rework consuming a meaningful share of total programme value.

Reference schema ownership during requirements definition

The supplier whose data model becomes the coalition reference translates outward once while every other participant translates inward repeatedly. That position is established during requirements work rather than during competitive tender, which means it is won by engineers seconded to a customer team. Suppliers treating requirements definition as unpaid pre-sales activity consistently surrender it to somebody else.

Commercial component qualification against operational need

Qualifying commercial processing, connectivity and storage against actual operational requirements, rather than specifying defence-grade equivalents by default, has already moved 27% of programme value outside the traditional supply base. The saving is substantial and the appropriate boundary is genuinely contested. Applying the approach to safety-critical or highly classified functions has produced expensive reversals for several programmes.

Portfolio Architecture for Margin Defence

The portfolio separates by how quickly the technology turns over, because that determines the procurement model and therefore the margin. Tactical data links and waveforms form the slowest layer: enormous installed bases, refresh cycles measured in a decade or more, and pricing constrained by the fact that everybody already knows what a radio costs. Suppliers hold this work because the installed base makes them the default route to the tactical edge.
Battle management and sensor fusion carry the volume of programme spending and moderate margins. These are the systems ministries buy when they want visible capability, they attract competitive tender, and they are where national industrial policy intervenes most directly. The tension is that commercial software suppliers are now winning exactly this work on delivery cadence, and the primes cannot match that cadence without changing how their engineering organisations are structured.

The strongest margins sit at the edge and in spectrum work, where turnover is fast enough that procurement moves to recurring service. Buyers contract for sustained capability rather than delivered systems, which suits suppliers organised around continuous release and disadvantages everybody organised around formal acceptance milestones.

Volume / Commodity-Adjacent

Tactical radios, data link terminals and waveform hardware with long refresh cycles. Range spans six points because installed base position and waveform certification ownership decide pricing power far more than any product difference does.
Gross Margin: 12-18%

Premium / Certified

Battle management, command systems and sensor fusion delivered on competitive programmes. Range spans eight points because cost-plus development and fixed price delivery produce entirely different outcomes on comparable technical scope.
Gross Margin: 16-24%

Sustainability / Regulatory / Next-Generation

Tactical edge computing, autonomy, cyber defence and spectrum operations. Range spans twelve points because recurring service contracts earn very differently from one-time deliveries on capability that is technically almost identical.
Gross Margin: 22-34%
network-centric-warfare-market-portfolio-architecture-1787982896074

High-value Sub-segments and Strategic Watch-out

Tactical Edge Computing and Autonomy

High value and high growth at 13.2%, procured as recurring software refresh rather than as systems replaced every fifteen years. The ten point range separates suppliers selling sustained capability from those still recognising revenue at formal delivery. Accounting practice decides the margin more than capability does.
Gross Margin: 24-34%

Cyber Defence and Spectrum Operations

High value with moderate growth at 11.4%, turning over in months rather than years and increasingly contracted as a service. The eight point range reflects whether a supplier holds cleared personnel at scale or subcontracts the sensitive portion entirely. Cleared personnel are the real constraint here.
Gross Margin: 20-28%

Battle Management and Command Systems

The volume core of programme spending and the layer ministries buy when they want visible capability. Competitive tender applies, national industrial policy intervenes directly, and commercial software suppliers are now winning exactly this work. Delivery cadence rather than defence heritage now decides these competitions outright.
Gross Margin: 16-24%

Legacy Data Link Sustainment

The strategic watch-out rather than a growth pool. Installed waveforms cannot be displaced without requalifying entire fleets, so the revenue is secure and slowly declining, and it funds engineering organisations that newer layers are outgrowing. Secure revenue funding an outgrown organisation is still a problem.
Gross Margin: Variable

Why Networks Outlive Their Programmes

A fielded network generates sustainment, refresh and extension revenue for as long as it operates, which is usually far longer than anybody planned. Displacing an installed waveform or data model means requalifying across an entire fleet and renegotiating interfaces with every connected system, which ministries undertake rarely and essentially never for pricing reasons alone. That inertia is worth more to an incumbent supplier than any competitive advantage it could otherwise construct.
Stickiness varies sharply by layer. Tactical data links are effectively permanent, since the installed base and certification burden make change prohibitive. Battle management systems change hands at generational refresh, which arrives every decade or so and is genuinely competitive. Edge and cyber capability turns over in months, which means the relationship depends on continuous delivery performance rather than on any contractual position at all.

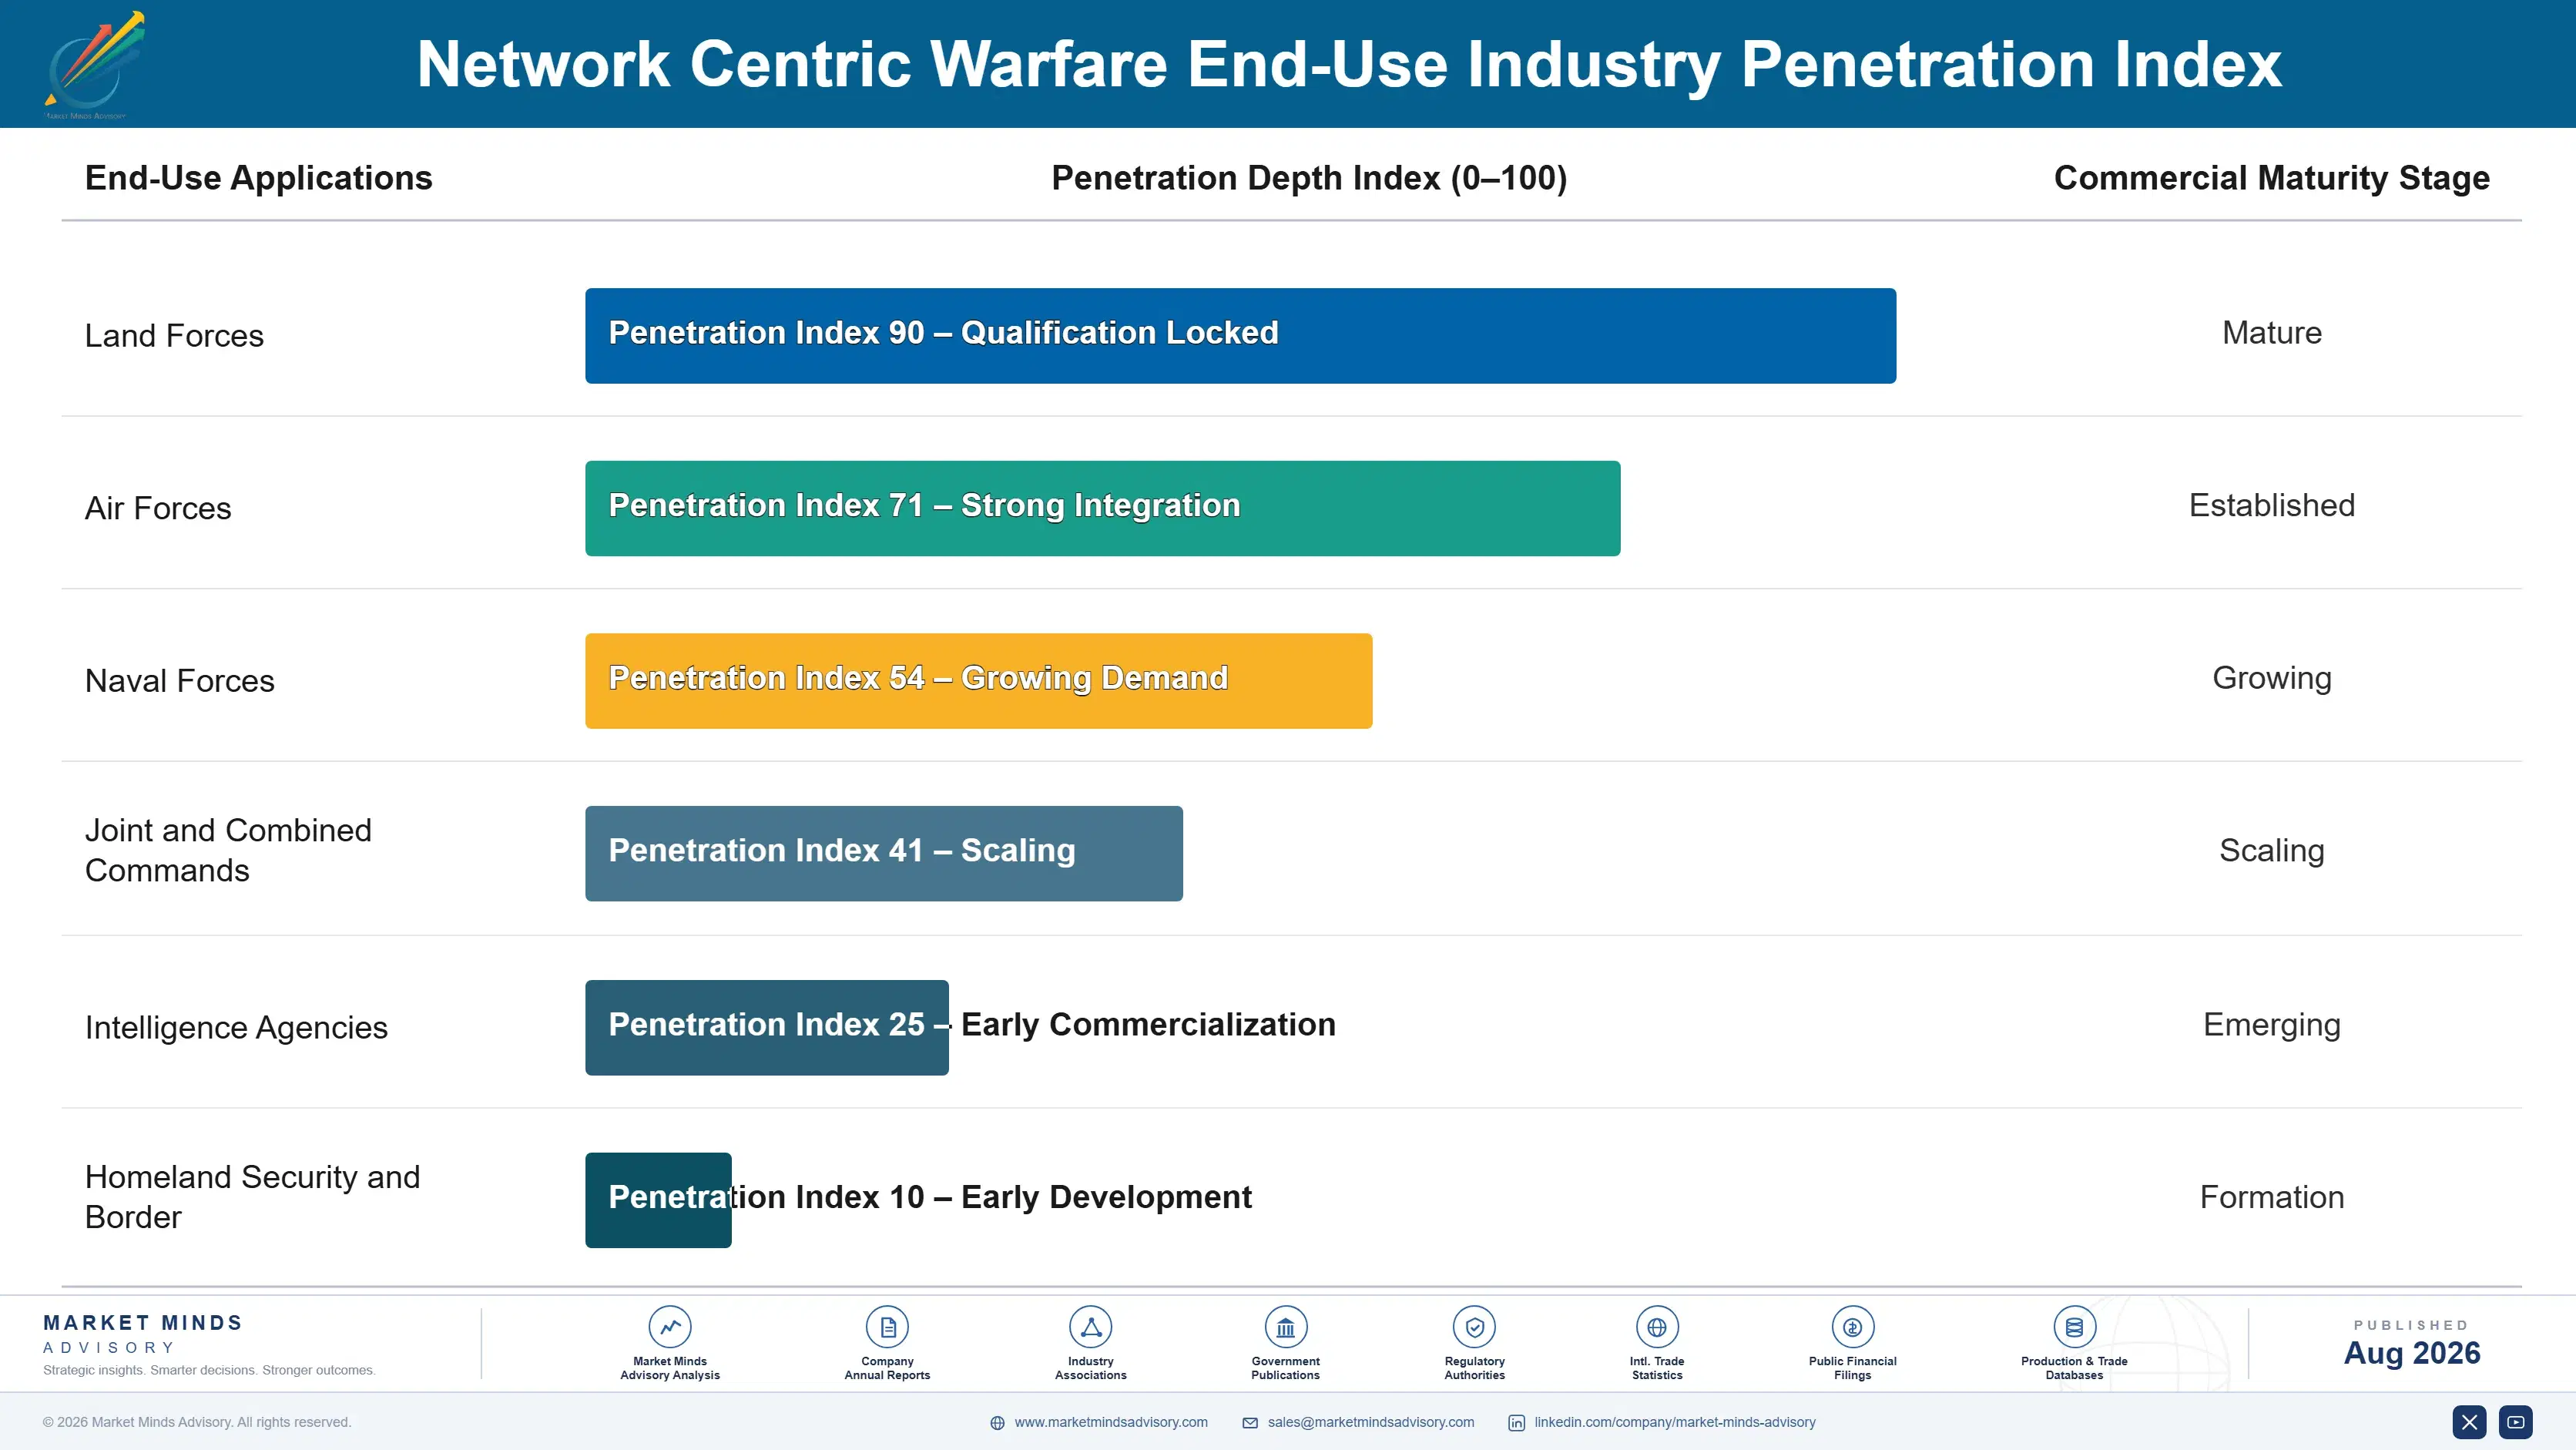
Buyer profiles are changing in ways that unsettle established suppliers. Ministries increasingly buy capability as a service with a delivery cadence expectation borrowed from commercial software, and they compare defence suppliers against commercial ones directly. Programme offices staffed by officers who watched software delivered in weeks during a live conflict evaluate a forty-one month schedule quite differently from their predecessors.
network-centric-warfare-market-end-use-penetration-index-1787982896562

Where Defence Integrators Should Commit

These are among the four positions where our research anticipates prominent divergence between winners and laggards over the coming forecast period. Each is grounded in the demand model, the regulatory perimeter, and the announced capacity pipeline.
01 / ITERATIVE DELIVERY CONTRACTING

Field something in a year or lose the relationship

Forty-one months from award to operational release delivers capability specified against a threat picture that has since changed, and buyers who watched useful software written in weeks during a live conflict now understand that clearly. Suppliers structuring around minimum viable capability followed by scheduled refresh reach revenue 18 to 22 months earlier and hold the relationship through later cycles rather than recompeting for it. Organisations built around milestone acceptance find this genuinely difficult, which is exactly why the opportunity remains open.
02 / DATA MODEL OWNERSHIP

The schema is worth more than the hardware contract

Roughly 34% of contract value in this market goes into connecting systems, and the supplier whose data model becomes the coalition reference translates outward once while everybody else translates inward more or less permanently. That position captures 15% to 25% of every downstream integration on the programme thereafter. It is won during requirements definition rather than during competitive tender, which means it is won by engineers seconded into a customer team rather than by anybody working inside a sales organisation at all.
03 / EDGE REFRESH ECONOMICS

Sell continuous capability, not delivered equipment

Tactical edge computing and autonomy grow at 13.2%, half again the market rate of 8.8%, and the technology turns over in months against platform procurement cycles assuming fifteen years. Selling recurring software refresh against a fielded hardware base produces roughly 2.4 times the revenue of an equivalent one-time system sale across a full decade. Traditional primes struggle to price it because their cost structures assume revenue recognised at delivery, which is an accounting problem masquerading as a commercial one entirely.
04 / RELEASABILITY ENGINEERING DISCIPLINE

Agree release rules before the design freezes

Coalition programmes routinely deliver capability that national classification policy then forbids anybody from using, because releasability gets applied after design rather than engineered into it from the start. Data-centric labelling and cross-domain paths agreed with release authorities during requirements work avoid rework consuming 12% to 18% of total programme value on multinational efforts. The engineering work itself is entirely straightforward, and obtaining agreement from national release authorities before design freeze is not, which is exactly why almost nobody ever attempts it.

Engagement Snapshot From the Field

A live engagement with an industry participant carrying material or product regulatory and market exposure ahead of a defining policy shift, showing how our research translates into a defensible multi-year portfolio strategy.
MARKET MINDS ADVISORY · CLIENT ENGAGEMENT SUMMARY
Network Centric Warfare Producer Strategic Portfolio Review and Transition Roadmap 2026·Investment Scenario on Network Centric Warfare Exposure Evaluation 2025-26
CLIENT PROFILE
A European defence systems supplier delivering command, communications and sensor fusion capability across several national and multinational programmes, holding established positions on sovereign work allocated through industrial policy. The business had won three coalition programmes in four years and delivered all three late and over budget, and management could not identify a common cause beyond the observation that multinational work was inherently difficult.
STRATEGIC CHALLENGE
The board needed to understand why coalition programmes consistently overran when comparable national programmes did not, and whether the pattern reflected estimating error or something in how the company positioned itself during requirements definition. It also faced commercial software suppliers winning operational contracts it had assumed were protected by classification requirements and defence heritage.
MMA APPROACH
MMA decomposed cost and schedule variance on the three coalition programmes, separating capability development from interface engineering and from accreditation rework, and traced which supplier's data model had been adopted as the reference on each. Expert interviews with national release authorities, coalition programme offices and commercial software competitors established what buyers now expect on delivery cadence and releasability.
KEY FINDINGS
  1. Interface engineering and accreditation rework accounted for 63% of total cost overrun across the three programmes, while capability development came in close to the original estimates.
  2. The client had translated into another supplier's data model on all three programmes, having treated requirements definition participation as unpaid pre-sales work it declined to fund.
  3. Releasability was addressed after design freeze on every programme, generating rework averaging 16% of programme value once national release authorities reviewed the delivered architecture.
  4. Two competing commercial software suppliers had fielded comparable operational capability in under nine months, against the client's average of 38 months from award to release.
CLIENT PROFILE
A European defence systems supplier delivering command, communications and sensor fusion capability across several national and multinational programmes, holding established positions on sovereign work allocated through industrial policy. The business had won three coalition programmes in four years and delivered all three late and over budget, and management could not identify a common cause beyond the observation that multinational work was inherently difficult.
STRATEGIC CHALLENGE
The board needed to understand why coalition programmes consistently overran when comparable national programmes did not, and whether the pattern reflected estimating error or something in how the company positioned itself during requirements definition. It also faced commercial software suppliers winning operational contracts it had assumed were protected by classification requirements and defence heritage.
MMA APPROACH
MMA decomposed cost and schedule variance on the three coalition programmes, separating capability development from interface engineering and from accreditation rework, and traced which supplier's data model had been adopted as the reference on each. Expert interviews with national release authorities, coalition programme offices and commercial software competitors established what buyers now expect on delivery cadence and releasability.
KEY FINDINGS
  1. Interface engineering and accreditation rework accounted for 63% of total cost overrun across the three programmes, while capability development came in close to the original estimates.
  2. The client had translated into another supplier's data model on all three programmes, having treated requirements definition participation as unpaid pre-sales work it declined to fund.
  3. Releasability was addressed after design freeze on every programme, generating rework averaging 16% of programme value once national release authorities reviewed the delivered architecture.
  4. Two competing commercial software suppliers had fielded comparable operational capability in under nine months, against the client's average of 38 months from award to release.
RECOMMENDED STRATEGY
Phase 1: Phase one: fund seconded engineering participation in requirements definition on every coalition pursuit, treating reference schema adoption as the primary objective. Phase 2: Phase two: engage national release authorities during requirements work rather than after design freeze, and design data-centric labelling into the architecture from the outset. Phase 3: Phase three: restructure two programme teams for iterative release against a minimum viable capability, separating the software delivery from platform integration entirely.
OUTCOME
The client reported interface rework falling 44% on the first programme run under the new approach (client-reported, unverified by MMA), with its schema adopted as the reference on one of two subsequent coalition pursuits. First operational release on the restructured programme arrived in 14 months against a 36 month baseline. Release authority objections at delivery fell to none.

Frequently Asked Questions

Foundational context covering the market sizes, CAGR, scope, country, region and competition that inform every finding below. This section is provided to cover basics and most often pre-purchase conversations, answered from the MMA Primary Research Dataset.

What is the current size of the Network Centric Warfare Market?

The market is valued at USD 58.0 billion in 2025, measured as revenue from systems, software and services connecting military sensors, decision nodes and effectors into an operational network.

How large will the Network Centric Warfare Market be by 2036?

MMA forecasts USD 146.66 billion by 2036, up from USD 63.10 billion in 2026. That represents incremental revenue of USD 83.56 billion and an expansion multiple of 2.32 times.

What is the CAGR for the Network Centric Warfare Market 2026 to 2036?

The base case CAGR is 8.8%, with a bull case of 10.0% and a bear case of 7.6%. Alliance spending commitments and coalition interoperability requirements supply most of that growth.

Which segment is growing fastest?

Tactical edge computing and autonomy grows at 13.2%, half again the market rate of 8.8%. Processing at the sensor survives the degraded links that jamming and distance both produce.

Who are the major companies in the Network Centric Warfare Market?

RTX, Lockheed Martin, L3Harris Technologies, Northrop Grumman and Thales lead on programme revenue, holding around 39% between them across a market that remains deliberately fragmented.

Which country is growing fastest?

India grows fastest at 10.8%, driven by modernisation across integrated air defence and battlefield management with domestic suppliers taking a rising share under indigenisation policy.

Report Segmentation Architecture

The full report scope spans multiple orthogonal segmentation dimensions, with cross-tabulated demand data provided for each dimension pair. Coverage extends further to regional breakdowns, trend trajectories, and the competitive detail needed to support segment-level decision-making.

By Capability Layer

  • Tactical Data Links and Waveforms
  • Battle Management and Command Systems
  • Sensor Fusion and Processing
  • Secure Transport and Satellite Connectivity
  • Tactical Edge Computing and Autonomy
  • Cyber Defence and Spectrum Operations

By End-Use Industry

  • Land Forces
  • Air Forces
  • Naval Forces
  • Joint and Combined Commands
  • Intelligence Agencies
  • Homeland Security and Border

By Commercial Dimension

  • Prime System Integration
  • Subsystem and Component Supply
  • Software Licensing and Subscription
  • Government Furnished Integration
  • Coalition Programme Participation
  • Sustainment and Managed Service

By Region

  • North America
  • Western Europe
  • East Asia
  • South Asia and Pacific
  • Latin America
  • Middle East and Africa
  • Eastern Europe

Scope, Methodology, and Coverage

Every figure in this report is reproducible from documented input assumptions. The scope below maps the historical period, the forecast horizon, the segmentation dimensions, and the countries covered, alongside the underlying primary and qualitative methodology.
Historical Period
2020 to 2025
Forecast Period
2026 to 2036
Base Year
2025 (USD billions; MMA Primary Research Dataset, August 2026)
Market Definition
Revenue from systems, software and services connecting military sensors, decision nodes and effectors into an operational network, spanning tactical data links and waveforms, battle management and command systems, sensor fusion and processing, secure transport and satellite connectivity, tactical edge computing and autonomy, and cyber defence with spectrum operations. Prime integration, subsystem supply, software licensing, coalition participation and sustainment are included. Sensors, weapons and platforms themselves, general purpose defence enterprise information technology, and commercial telecommunications infrastructure not procured for military networking are excluded.
Quantitative Units
USD billions, programme revenue
Segmentation Dimensions
Capability layer, end-use force domain, commercial provision dimension, region
Regions Covered
North America, Western Europe, East Asia, South Asia and Pacific, Latin America, Middle East and Africa, Eastern Europe
Countries Covered
United States, United Kingdom, France, Germany, Italy, Sweden, Poland, Israel, India, Australia, Japan, South Korea, Brazil, United Arab Emirates
Key Companies Profiled
RTX, Lockheed Martin, L3Harris Technologies, Northrop Grumman, Thales, BAE Systems, Leonardo, Elbit Systems, Anduril Industries, Palantir Technologies
Quantitative Methodology
Primary survey, n=3,800 respondents, Q4 2025, six countries; demand-side model with trade association cross-validation
Qualitative Methodology
47 expert interviews, Q4 2025; applied to validate demand model assumptions, identify emerging dynamics, and assess competitive positioning
Report Format
PDF and XLSX data workbook (Word format preview document)
Publisher
Market Minds Advisory
Report Code
MMA-2026-CON-201
Published
August 2026
Contact
sales@marketmindsadvisory.com | www.marketmindsadvisory.com

Purchase the full Network Centric Warfare Market Report (2026 to 2036).

The full report treats network centric warfare as an interface ownership problem rather than an integration one, and shows where the money actually goes. It quantifies the share of contract value consumed by connecting systems, decomposes coalition programme overruns between capability development and interface engineering, and models what reference data model ownership is worth across downstream integrations. Segment analysis covers all six capability layers, with particular attention to edge computing procured as recurring refresh rather than as delivered equipment. Competitive assessment ranks twenty participants on defence networking and command programme revenue across every spending region.
Six capability layer segmentation with growth rates
Coalition overrun decomposed by cost driver
Twenty participant assessment on programme revenue
Reference data model ownership value quantified
Edge refresh economics against one-time system sales
Releasability rework cost across multinational programmes

Built For The People Who Decide

From boardroom strategy to bench-side execution, this report is read cover-to-cover by leaders shaping the next decade of their industry, turning demand scenarios, market dynamics and valuation benchmarks into decisions.
CXOs/ Presidents/ VPs/ Managers
M&A and Corporate Development
Strategy Teams and R&D Heads
Procurement and Product Directors
Regulatory and Compliance Leaders
Investor Relations and Equity Analysts