Market Minds Advisory
Network Automation Market

Network Automation Market: Network Automation Market: Change Approval Culture, Blast Radius Fear and Scripts That Never Ran 2026 to 2036

Network teams buy automation and then keep approving every change by hand, because one bad push takes the company offline. The product works; the change board is what nobody automated.

Lead Analyst

Published

September 2026

Make Smarter Decisions with Customized Research Insights

Request a free sample report and evaluate market opportunities, growth trends, and competitive dynamics relevant to your business needs.

2025 MARKET VALUE$5.4BMarket Size 2025
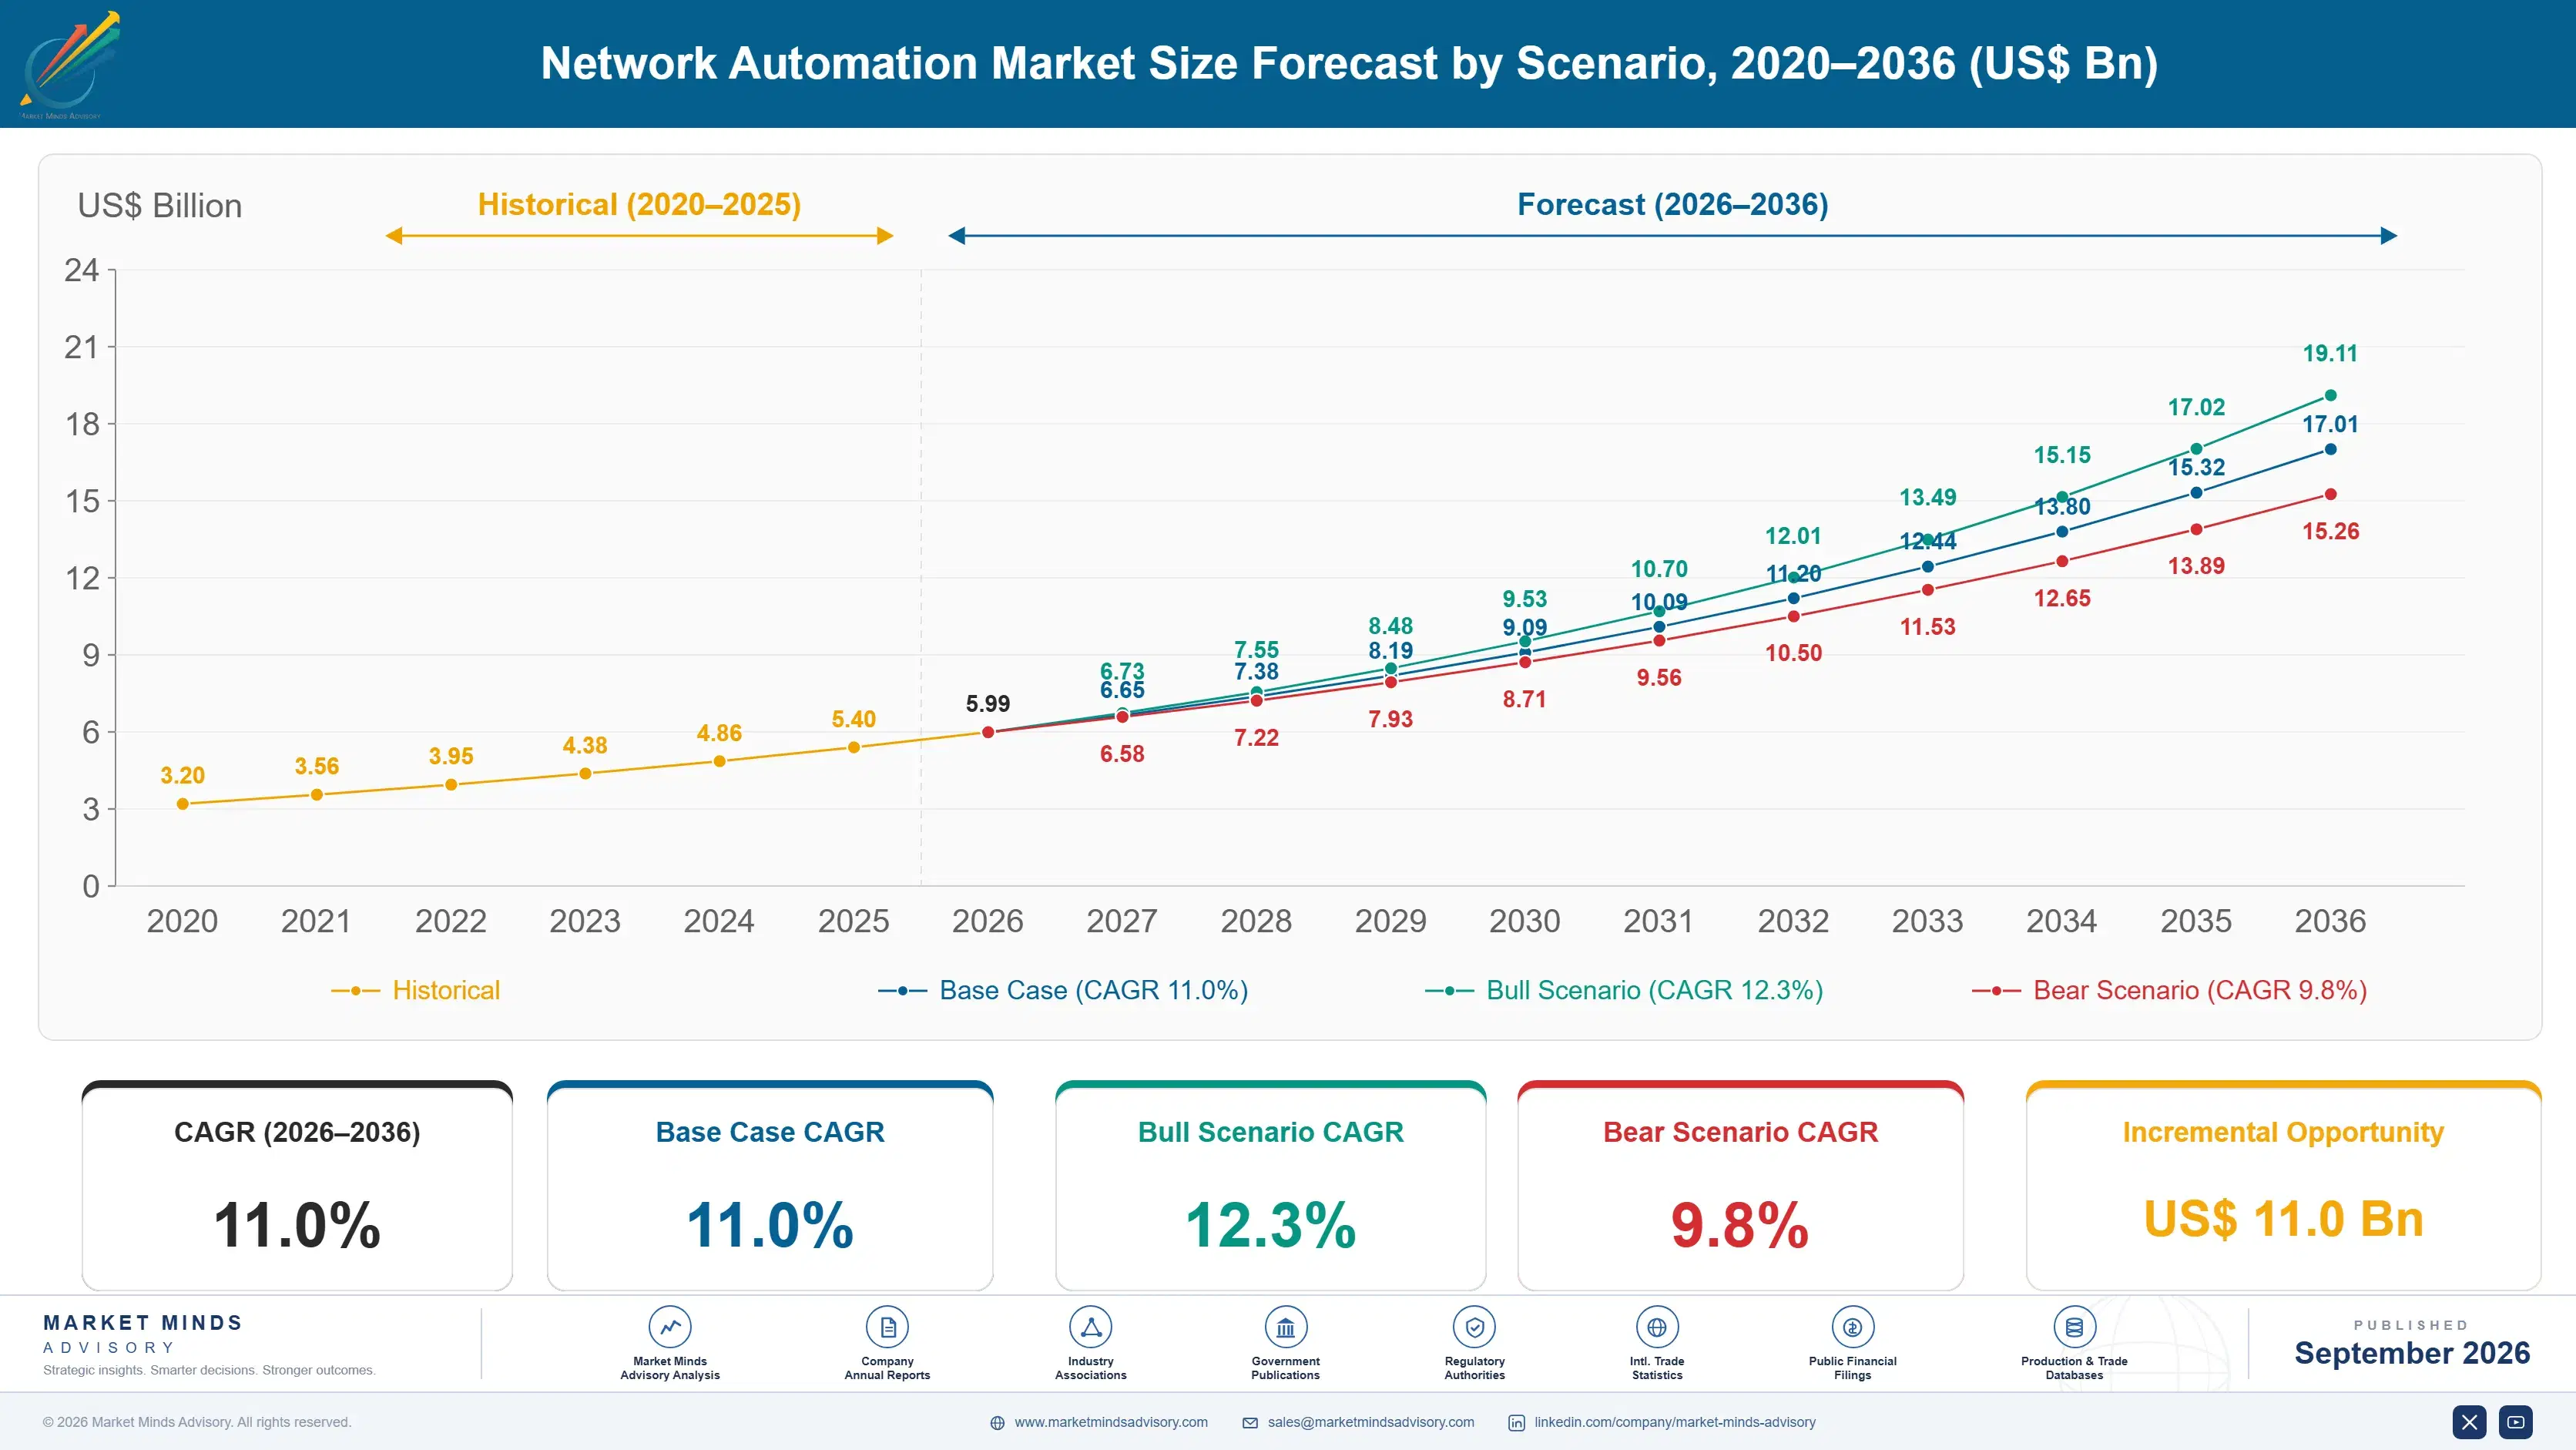
2036 FORECAST VALUE$17.0BBase Case , 2026 to 2036
CAGR 2026 TO 203611.0 %Bull 12.3% / Bear 9.8%
INCREMENTAL OPPORTUNITY$11.0BNet 10- year value creation
EXPANSION MULTIPLE2.83x2036 value over 2026 base
Strategic Levers
M&A Pipeline
Regional Outlook
Country Rankings
Competitive Intelligence
Segmental Deep-dive
Call-Us : 91 93563 13602

Executive Snapshot and Market Trajectory.

Network teams buy automation and then keep approving every change by hand, because one bad push takes the whole company offline. The product works exactly as sold. The change approval board is the thing nobody automated and nobody will. Only around 23% of automated changes run unattended.
The market reaches USD 6.0 billion in 2026 and USD 17.0 billion by 2036, a 2.83 times expansion at 11.0% annually. Closed loop remediation and auto-rollback grows at 16.5%, half again the market rate of 11.0%, because the ability to undo a change safely is what actually opens the approval gate. East Asia holds 30% of spending on network construction volume. Approval culture caps adoption.
Five vendors hold 41% of spending, low for infrastructure software, because equipment vendors, independent platforms and open source distributions all reach network teams on entirely different terms. Cisco Systems, Juniper Networks, Red Hat, Itential and BackBox lead. Rollback confidence rather than feature depth decides adoption. Around 44% of deployments run in advisory mode where the platform recommends and a person still executes, which delivers a fraction of the promised saving at full licence cost.
Market Definition
This report covers network automation software: platforms and tooling that configure, validate and remediate network infrastructure without manual device interaction. It spans closed loop remediation and auto-rollback, intent-based configuration and policy management, network configuration and change management platforms, network testing and pre-change validation, automated compliance and audit reporting, and the professional services delivered around automation adoption. It excludes network monitoring and observability tools, security policy management platforms, network hardware and controllers, service provider orchestration for customer services, and general infrastructure configuration management.
Base Year Value
$5.4B in 2025 (MMA Primary Research Dataset, September 2026)
Forecast Period
2026 to 2036, eleven discrete annual values
CAGR
11.0% base case. Bull 12.3%. Bear 9.8%.
Fastest Growth Segment
Closed Loop Remediation And Auto-Rollback: 16.5% CAGR
Fastest Growth Country
India: 18.1% CAGR
Fastest Growth Region
South Asia and Pacific: 13.1% CAGR
Largest Region
East Asia: 30% of 2025 global value
Market Leaders
Cisco Systems, Juniper Networks, Red Hat, Itential and BackBox lead on network automation software revenue. Source: MMA Analysis.
Primary Survey
n=3,800 procurement and R&D decision-makers, Q4 2025, six countries
Methodology
Demand-side build-up, cross-validated against public data, 47 expert interviews

Network Automation Market Forecast Scenarios

network-automation-market-size-forecast-scenario-1788731827915
Between 2020 and 2025 the category compounded at 9.7%, and licence purchases ran considerably ahead of automated change volume. Organisations bought platforms, wrote playbooks and then ran most of them in report-only mode because nobody would authorise unattended execution on production networks. Vendors counted deployments while networks kept being changed by hand, which is a gap the category has still not closed anywhere.
The base case holds 11.0% on three mechanisms. Rollback capability keeps improving, which is the only thing that moves a change board rather than persuading it. Compliance reporting keeps becoming mandatory in regulated networks, and that work automates without needing anybody's approval to touch a device. And network scale keeps outrunning headcount in regions building infrastructure rather than maintaining it. Those three mechanisms run largely independently of one another. Each runs on its own logic.
The bull case at 12.3% assumes closed loop remediation earns enough operational trust that unattended execution becomes normal, which would change adoption fundamentally. The bear case at 9.8% is a high profile automated outage, where one organisation takes itself offline through a scripted change and every change board in the industry tightens for several years afterwards.

The Change Board Never Automated

The gap between purchased and used is the whole story. Only around 23% of automated changes run without a human approving each one, and roughly 44% of deployments operate in advisory mode where the platform recommends and a person executes. Change approval still takes about six days. Vendors report deployments and organisations report control, and both are describing the same installation entirely differently.
TOP FIVE CONCENTRATION41%Low, reflecting equipment vendors competing against independent platforms
UNATTENDED EXECUTION SHARE23%Automated changes running without a human approving each one
CHANGE APPROVAL DURATION6 daysTypical elapsed time from change request to authorised execution window
REPORT ONLY DEPLOYMENT SHARE44%Deployments running automation in advisory mode rather than making changes
ROLLBACK SUCCESS REQUIREMENT99%Reliability change boards demand before permitting unattended production execution
COMPLIANCE AUTOMATION SHARE37%Automated activity covering audit and compliance reporting rather than configuration
Rollback is what actually moves a change board. Boards want around 99% rollback reliability before permitting unattended execution, because the fear is not that a change fails but that it fails and cannot be undone before customers notice. Closed loop remediation and auto-rollback grows at 16.5% against 11.0% for the market. Vendors selling configuration speed are answering a question no approval board has ever asked them.
Compliance automation is the part that ships without argument. Around 37% of automated activity covers audit and compliance reporting rather than configuration change, because reading a device and producing evidence requires no authorisation to modify anything. That work is genuinely automated, genuinely useful and rarely counted in the adoption narrative, which is why platform value looks lower than deployment counts suggest.
"Every network team I speak to has automation and approves changes by hand anyway. Ask why and they describe an outage from six years ago. The vendors keep selling speed to people whose entire professional instinct is to slow things down, and then wonder about adoption."
Director, Network Operations and Infrastructure Automation Practice · MMA Technology Practice · September 2026

Market Trends

Approval Culture Rather Than Software Limits Adoption

Only around 23% of automated changes run without a human approving each one, and roughly 44% of deployments operate in advisory mode where the platform recommends while a person executes. Change approval still takes about six days regardless of what automation is installed. Vendors count deployments while networks keep being changed by hand, which is a gap the category has not closed and which no additional feature development addresses at all. Most network teams can name the specific outage that shaped their current approval policy, which is a cultural position rather than a technical one.
Market Impact: Compliance covers 37% of activity
Rollback Reliability Is What Opens The Gate

Change boards want around 99% rollback reliability before permitting unattended execution, because the fear is not that a change fails but that it fails and cannot be reversed before customers notice anything. Closed loop remediation and auto-rollback grows at 16.5% against 11.0% for the market as a direct result. Vendors selling configuration speed to network teams are answering a question that no approval board anywhere has ever actually asked them. Blast radius on a network is total rather than partial, which is why this fear behaves differently from ordinary software risk.
Market Impact: India compounds at 18.1% yearly

Market Opportunities and Growth Drivers

Compliance Reporting Automates Without Any Approval

Around 37% of automated activity covers audit and compliance reporting rather than configuration change, because reading device state and producing evidence requires no authorisation to modify anything at all. That work genuinely automates and delivers value immediately, which makes it the reliable entry point into an organisation whose change board will not yet permit execution. Vendors leading with compliance reach deployment where those leading with change velocity stall in advisory mode. It also produces reference deployments that genuinely run rather than licences sitting unused in advisory mode indefinitely. Deployment reaches production.
Market Impact: Only 23% execute unattended

Network Scale Outruns Headcount In Building Regions

India compounds at 18.1%, ahead of every other market, because network infrastructure is being built faster than teams can be hired and automation becomes necessary rather than optional. Organisations building rather than maintaining also have less accumulated outage history shaping approval culture, which is why unattended execution rates run higher there than in mature markets. East Asia holds 30% of spending on the same mechanism at larger scale. Necessity moves approval culture considerably faster than any productivity argument has ever managed to anywhere. Necessity beats argument every time. Hiring cannot catch up.
Market Impact: Some 44% stay advisory only

Market Restraints and Challenges

One Outage Sets Approval Policy For Years

A single automated change that takes a network offline hardens change approval across an organisation for years afterwards, and most network teams can name the incident shaping their current policy. The root cause is that blast radius on a network is total rather than partial, unlike most software failures. Commercially this caps unattended execution near 23%. Mitigation runs through staged rollout scopes, through rollback proving in pre-production, and through automation of read-only work first. Boards accept validated read-only work long before they accept anything that modifies a device. Trust rebuilds slowly.
Market Impact: Only 23% run unattended

Advisory Mode Deployments Never Deliver Their Business Case

Around 44% of deployments run in advisory mode where the platform recommends and a person executes, which delivers a fraction of the promised saving while carrying the full licence cost. The root cause is that the business case assumed unattended execution the change board never approved. Commercially this undermines renewals. Mitigation runs through business cases built on compliance and validation value, through phased execution scopes, and through rollback evidence gathered during advisory operation. Honest costing loses a smaller initial deal and protects a renewal that an unmet business case reliably destroys.
Market Impact: Boards demand 99% rollback reliability
3 additional market trends, 4 additional growth drivers, and 2 additional restraints and challenges are covered in the full report. Contact sales@marketmindsadvisory.com to access the complete intelligence.

Segment CAGR and Growth Architecture

Segmentation follows automation function and approval exposure, since each carries quite different adoption friction, buyer and value realisation. Six classes cover the market: closed loop remediation and auto-rollback, automated compliance and audit reporting, intent-based configuration and policy management, network testing and pre-change validation, configuration and change management platforms, and automation adoption services. Industry and licensing sit elsewhere.
network-automation-market-market-share-analysis-1788731828212

Closed Loop Remediation And Auto-Rollback

Closed loop remediation and auto-rollback grows at 16.5%, half again the market rate of 11.0%, because change boards want around 99% rollback reliability before permitting unattended execution and the fear driving them is irreversibility rather than failure. This is the only capability that moves an approval culture rather than arguing with it. Vendors selling configuration speed are answering a question no board has asked, while those demonstrating reliable reversal reach the gate that keeps unattended execution near 23% across the whole category. Boards accept validated changes considerably faster than unvalidated ones regardless of the tooling behind them. Reversal evidence gathered during advisory operation is the cheapest route to that demonstration.
CAGR 16.5%

Automated Compliance And Audit Reporting

Automated compliance and audit reporting compounds at 13.8% because reading device state and producing evidence requires no authorisation to change anything, which removes the approval obstacle entirely. Around 37% of automated activity already sits here. It is also the reliable entry point into organisations whose change boards will not yet permit execution, and it delivers value immediately rather than waiting for cultural change. Vendors leading with compliance reach production deployment where those leading with change velocity stall in advisory mode indefinitely. Evidence formats that satisfy auditors rather than engineers are what separate vendors here. Vendors leading here reach production deployment rather than stalling indefinitely. Value arrives while the board is still deciding about everything else.
CAGR 13.8%
Full segment breakdown across 6 segments available in the complete report.

Regional Architecture and Country Demand Map

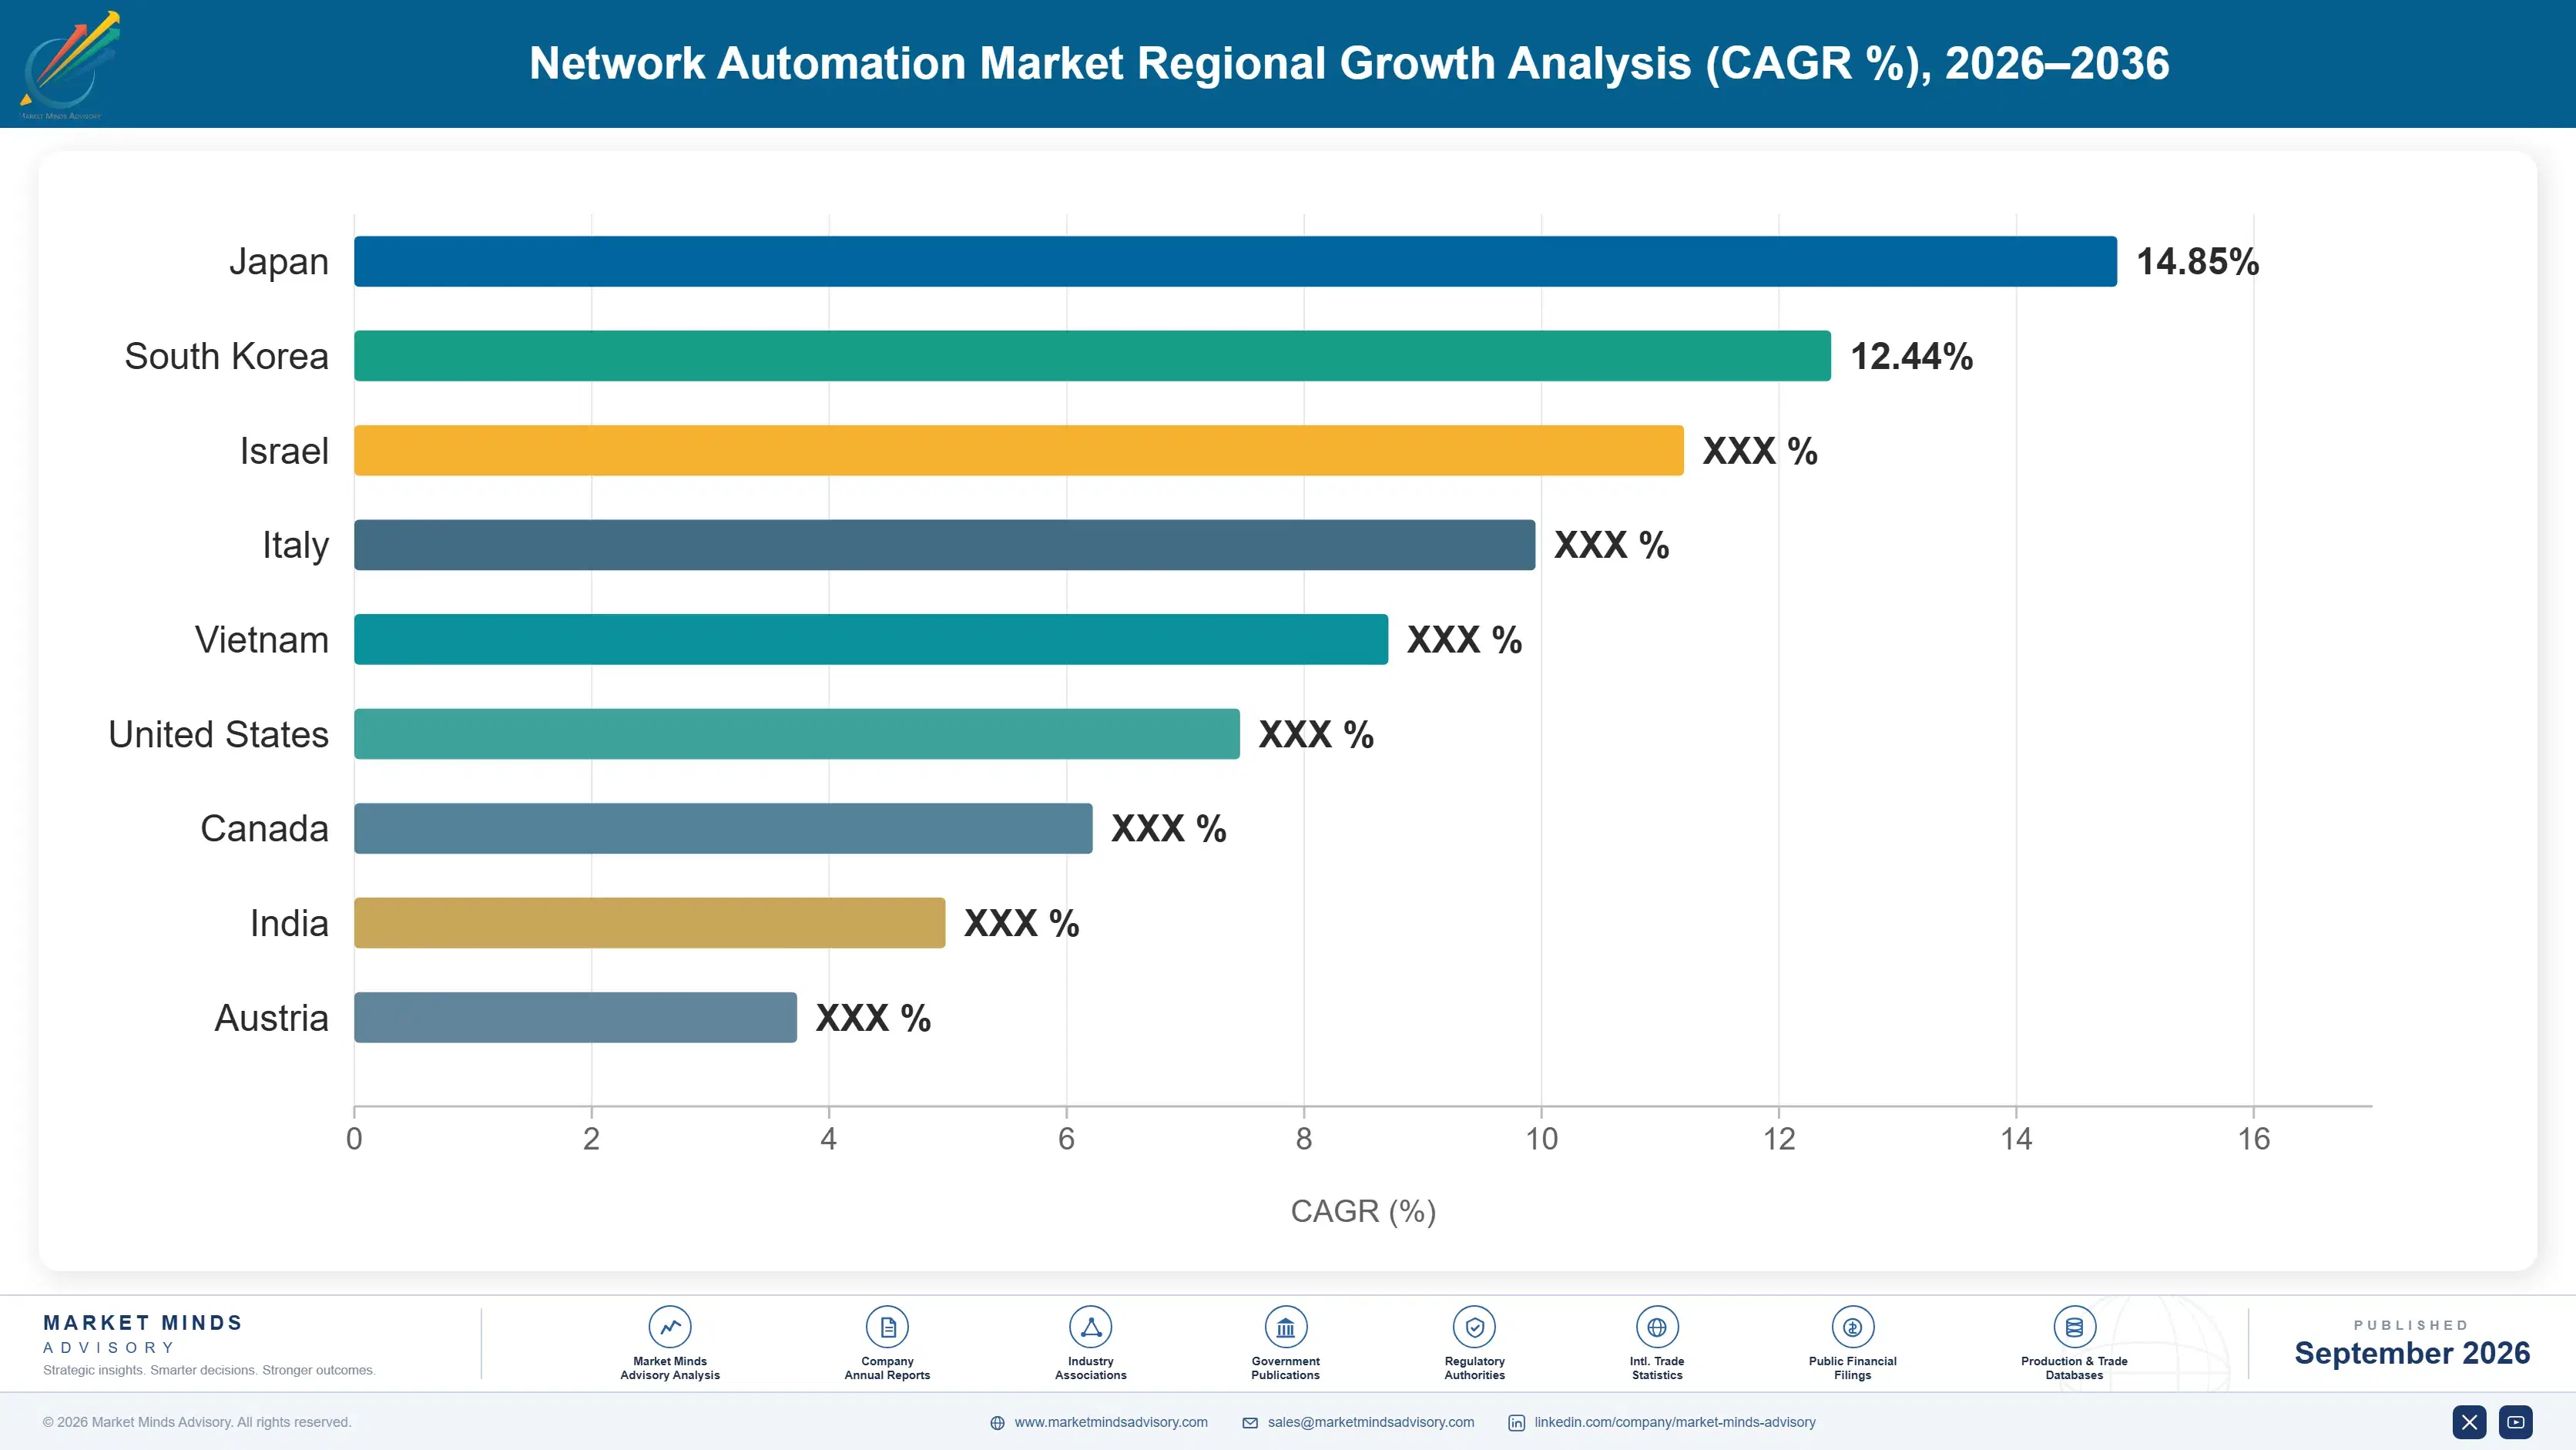
East Asia holds 30% of spending, the largest regional share, because network infrastructure is being built at scale and automation becomes necessary rather than optional. North America follows at 26% on the largest installed enterprise network estate. India compounds fastest at 18.1% on rapid network construction.

East Asia

East Asia takes 30% of spending, at the band ceiling, because network infrastructure across Chinese and Southeast Asian operators and enterprises is being built at a scale that outruns hiring, which makes automation necessary rather than optional. Unattended execution rates run above the global 23% figure because organisations building fresh networks carry less accumulated outage history shaping their approval culture. Regional equipment vendors bundle automation with hardware aggressively. Growth at 11.9% runs above the global rate on construction volume. Equipment vendors bundling automation with hardware compete hard against independent platforms across the region. Construction rather than maintenance drives regional demand, which changes the whole adoption conversation. Outage history weighs less here.
Share: 30% | CAGR: 11.9% (2026 to 2036)

North America

North America accounts for 26% of spending, where the largest installed enterprise network estate sits and where approval culture is most entrenched, since most teams can name the outage that shaped current policy. Cisco Systems, Juniper Networks and Itential all built positions here. Compliance automation adoption is highest in this region given regulatory reporting requirements across financial services and healthcare networks. Growth at 11.4% sits above the global rate on compliance rather than on any increase in unattended execution. Business cases built on execution savings rather than compliance value are where renewals here run into difficulty. Compliance value delivered from the first month is what most business cases here failed to count.
Share: 26% | CAGR: 11.4% (2026 to 2036)
Regional intelligence for 5 additional markets available in the complete report: Western Europe, South Asia and Pacific, Latin America, Middle East and Africa, Eastern Europe. Contact sales@marketmindsadvisory.com.
network-automation-market-country-cagr-analysis-1788731828490

Where Automation Deals Actually Land

Approval culture rather than software capability limits adoption, rollback reliability is the only argument that moves a change board, and compliance work automates without needing anybody's permission. The four levers below follow those conditions rather than any argument about configuration speed. Each addresses a governance condition rather than a technical one. Speed persuades nobody.

Sell Reversal Rather Than Configuration Speed

Change boards want around 99% rollback reliability before permitting unattended execution, because the fear is irreversibility rather than failure itself. Only around 23% of changes currently run unattended anywhere. Vendors demonstrating reliable reversal reach the gate that limits this whole category, while those selling configuration speed are answering a question no approval board has ever asked and cannot understand why deployments stall in advisory mode. Boards want evidence rather than assurances. Advisory operation is where that evidence can be gathered at no risk at all. Nobody gathers it deliberately. Evidence beats assurance.
Market Impact: Boards now demand a full 99% rollback reliability

Enter Through Compliance Where Nobody Objects

Around 37% of automated activity covers audit and compliance reporting, because reading device state and producing evidence needs no authorisation to modify anything at all. That work automates immediately and delivers value while the change board is still deciding. Vendors leading with compliance reach production deployment, while those leading with change velocity stall at around 44% of deployments running in advisory mode indefinitely. Reference deployments that genuinely run are worth more than licences that do not. Change velocity arguments stall at the board. Compliance runs from week one. Permission is never needed.
Market Impact: Compliance now covers a full 37% of activity

Build Business Cases That Survive Advisory Mode

Around 44% of deployments run in advisory mode delivering a fraction of the promised saving while carrying the full licence cost, because the business case assumed unattended execution the board never approved. Vendors constructing cases from compliance and validation value survive renewal where velocity-based cases do not. That honesty costs a smaller initial deal and protects the renewal that an unmet business case reliably loses. Renewal examines what ran. Vendors discover which case they sold at the first renewal review. Unmet cases lose renewals reliably, whatever the platform actually did.
Market Impact: Some 44% of deployments now stay advisory only

Target Regions Building Rather Than Maintaining Networks

India compounds at 18.1% because infrastructure is being built faster than teams can be hired, and organisations building fresh networks carry less accumulated outage history shaping their approval culture. Unattended execution runs above the global 23% figure in those markets. Vendors concentrating on mature enterprise estates are selling into the most conservative approval cultures anywhere, where a named outage from years ago still governs current policy. Necessity moves culture faster. Mature estates carry the most conservative boards anywhere. A named outage still governs their current policy entirely. Building markets differ.
Market Impact: India now compounds at fully 18.1% each year

Who Controls the Margin Pool

Five vendors hold 41% of network automation spending, low for infrastructure software, because equipment vendors bundling automation, independent platforms and open source distributions all reach network teams on entirely different commercial terms. Cisco Systems, Juniper Networks, Red Hat, Itential and BackBox lead. All participants are assessed on network automation software revenue rather than on broader networking hardware, platform or open source subscription businesses. Concentration has stayed low because engineers adopt tooling without procurement involvement, which no enterprise sales motion competes against easily.
Competition runs on rollback credibility and multi-vendor device coverage far more than on configuration capability, which converged years ago. The second dimension is compliance reporting depth, because that work automates without approval friction and is where deployments actually reach production rather than stalling in advisory operation. Configuration capability competes a distant third behind both of those.

Pressure is emerging from open source distributions that network engineers adopt without procurement involvement at all. Rankings shift where networks are built rather than maintained and where compliance obligations tighten, particularly across India, East Asia and Western Europe at present. Commercial platforms competing on breadth carry the most exposure to that adoption route.
network-automation-market-company-positioning-matrix-1788731828798

Competitive Moat and Risk Dimensions

CISCO SYSTEMS

Moat: Installed Device Coverage

Cisco automates its own equipment more completely than any third party can, and most enterprise networks contain enough of that equipment to make native automation the path of least resistance. Change boards also accept vendor-supplied automation on vendor hardware more readily than third party tooling. Competitors must prove multi-vendor coverage and reliability before a board will even consider them.
CISCO SYSTEMS

Risk: Multi-Vendor Estate Gap

Real networks contain equipment from several vendors and automation that covers one estate well and others poorly forces teams back to manual processes for the remainder. That undermines the whole case for automating anything. Independent platforms competing on breadth reach the operational reality rather than the equipment relationship, which matters increasingly as estates diversify.
RED HAT

Moat: Engineer Level Adoption

Red Hat reaches network engineers directly through tooling they adopt without procurement involvement, which builds usage before any commercial conversation begins. That bottom-up adoption is difficult for enterprise sales motions to compete against, because the platform is already running by the time anybody evaluates alternatives. Familiarity across adjacent infrastructure domains reinforces the position further.
RED HAT

Risk: Rollback Assurance Depth

General automation frameworks carry less network-specific rollback and validation capability than purpose-built platforms, and boards demand around 99% rollback reliability before permitting unattended execution. Engineer adoption gets a platform installed and does not get changes approved. The gate limiting this category is one that general tooling addresses less directly than specialist products do.

Players Tracked

Prominent Players

Cisco Systems
Juniper Networks
Red Hat
Itential
BackBox

Other Key Players

Nokia
Arista Networks
VMware
IBM
NetBrain Technologies
Forward Networks
Batfish
Gluware
Anuta Networks
SolarWinds
ManageEngine
Infoblox
BlueCat Networks
Nautobot
Selector AI

Recent Developments

MARCH 2025

Change Boards Set Rollback Thresholds For Unattended Execution

Enterprise change advisory boards began setting explicit rollback reliability thresholds before permitting unattended automated execution, a governance development rather than any corporate transaction. Boards want around 99% reversal reliability, because the fear driving approval culture is irreversibility rather than failure itself in any individual change.
Signal: Reversal capability rather than configuration speed is what actually opens the approval gate almost everywhere now.
SEPTEMBER 2024

Compliance Reporting Becomes The Automation Entry Point

Organisations increasingly began automation programmes with compliance and audit reporting rather than configuration change, a sequencing development rather than any acquisition. Reading device state and producing evidence requires no authorisation to modify anything at all, which entirely removes the approval obstacle that stalls change automation.
Signal: Read-only work automates immediately while change automation still waits indefinitely for the cultural permission to arrive.
JUNE 2025

Indian Network Construction Outpaces Operations Hiring

Indian network construction outpaced operations team hiring across regional operators and enterprises, a capacity development rather than any corporate event. India compounds at 18.1%, and organisations building fresh networks carry considerably less accumulated outage history shaping their approval culture than mature enterprise estates elsewhere do.
Signal: Necessity moves approval culture faster than any productivity argument has ever once managed to do anywhere.

What Automation Platforms Cost

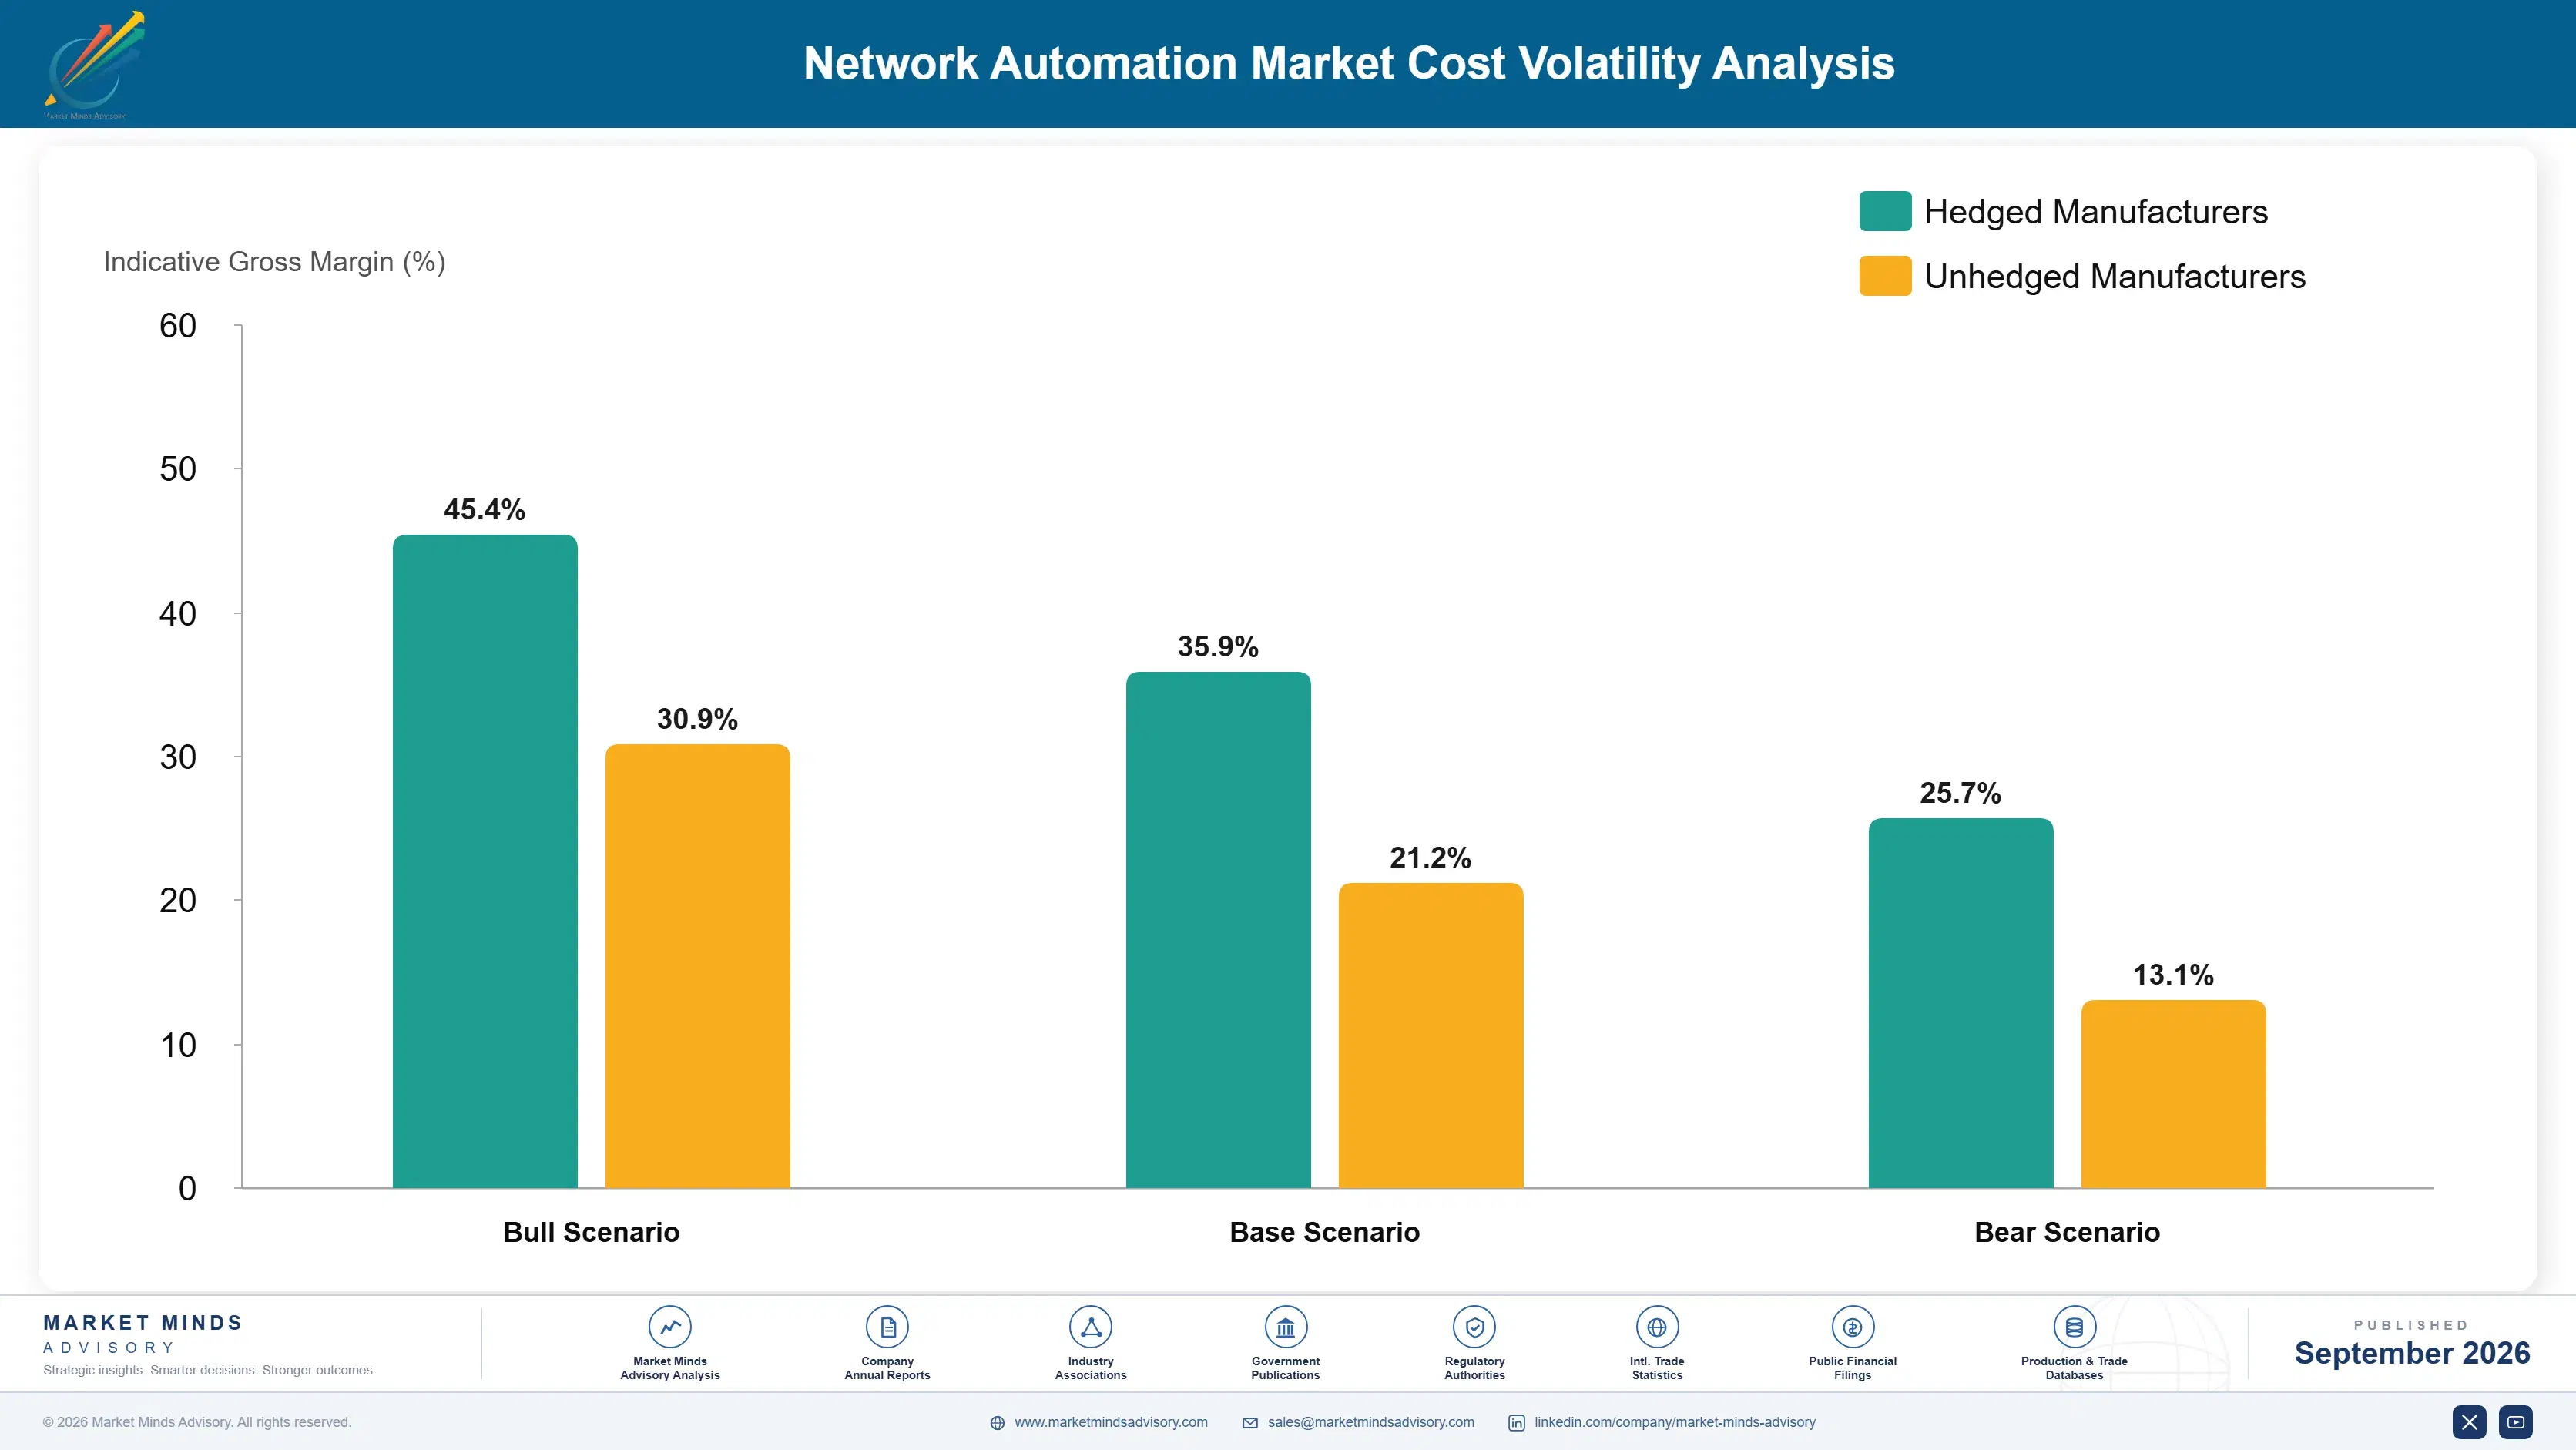
Product engineering absorbs roughly 31% of vendor cost, weighted heavily toward device driver and integration work that must be maintained across every equipment vendor, model and software release a customer runs. Customer success and adoption services take around 24%, which is high because deployments stall without hands-on engagement. Sales absorbs about 26%, with hosting and support taking the remaining balance.
Device integration maintenance costs rose through 2023 and 2024 as equipment vendors shipped software releases faster and each one required validation across automation platforms. Cisco Systems Annual Report 2024 and Red Hat contribution disclosures within IBM Annual Report 2024 both record integration maintenance and adoption services among principal operating variables. Vendors covering fewer equipment platforms carried materially lower maintenance load than those claiming broad coverage.

The competitive disadvantage mechanism is coverage maintenance rather than development cost. A vendor claiming broad multi-vendor support carries validation work scaling with equipment models and releases rather than with revenue, and that burden never stops. Exposure concentrates among independent platforms, since their whole proposition is breadth that equipment vendors do not need and open source distributions maintain through community effort instead.
network-automation-market-cost-volatility-analysis-1788731829136

Automate Device Integration Validation Against Releases

Device driver and integration maintenance absorbs a large share of engineering effort and scales with equipment models and software releases rather than with revenue. Automated validation against new releases converts recurring engineering into monitored operations. The work is unglamorous and it protects the multi-vendor coverage that independent platforms depend on entirely for their competitive position.

Package Adoption Services Rather Than Absorbing Them

Customer success and adoption services absorb around 24% of cost because deployments stall without hands-on engagement, and vendors frequently absorb that expense to protect a deal. Charging for adoption work aligns the cost with the value delivered. It also filters customers who will not commit the internal effort that moving past advisory mode genuinely requires.

Lead With Compliance To Shorten Sales Cycles

Sales absorbs about 26% of cost across long cycles where change boards rather than buyers determine the outcome. Compliance automation needs no approval to modify anything, which shortens the cycle considerably and reaches production faster. Shorter cycles reduce the cost per deal and produce reference deployments that actually run, rather than licences sitting in advisory mode.

Portfolio Architecture for Margin Defence

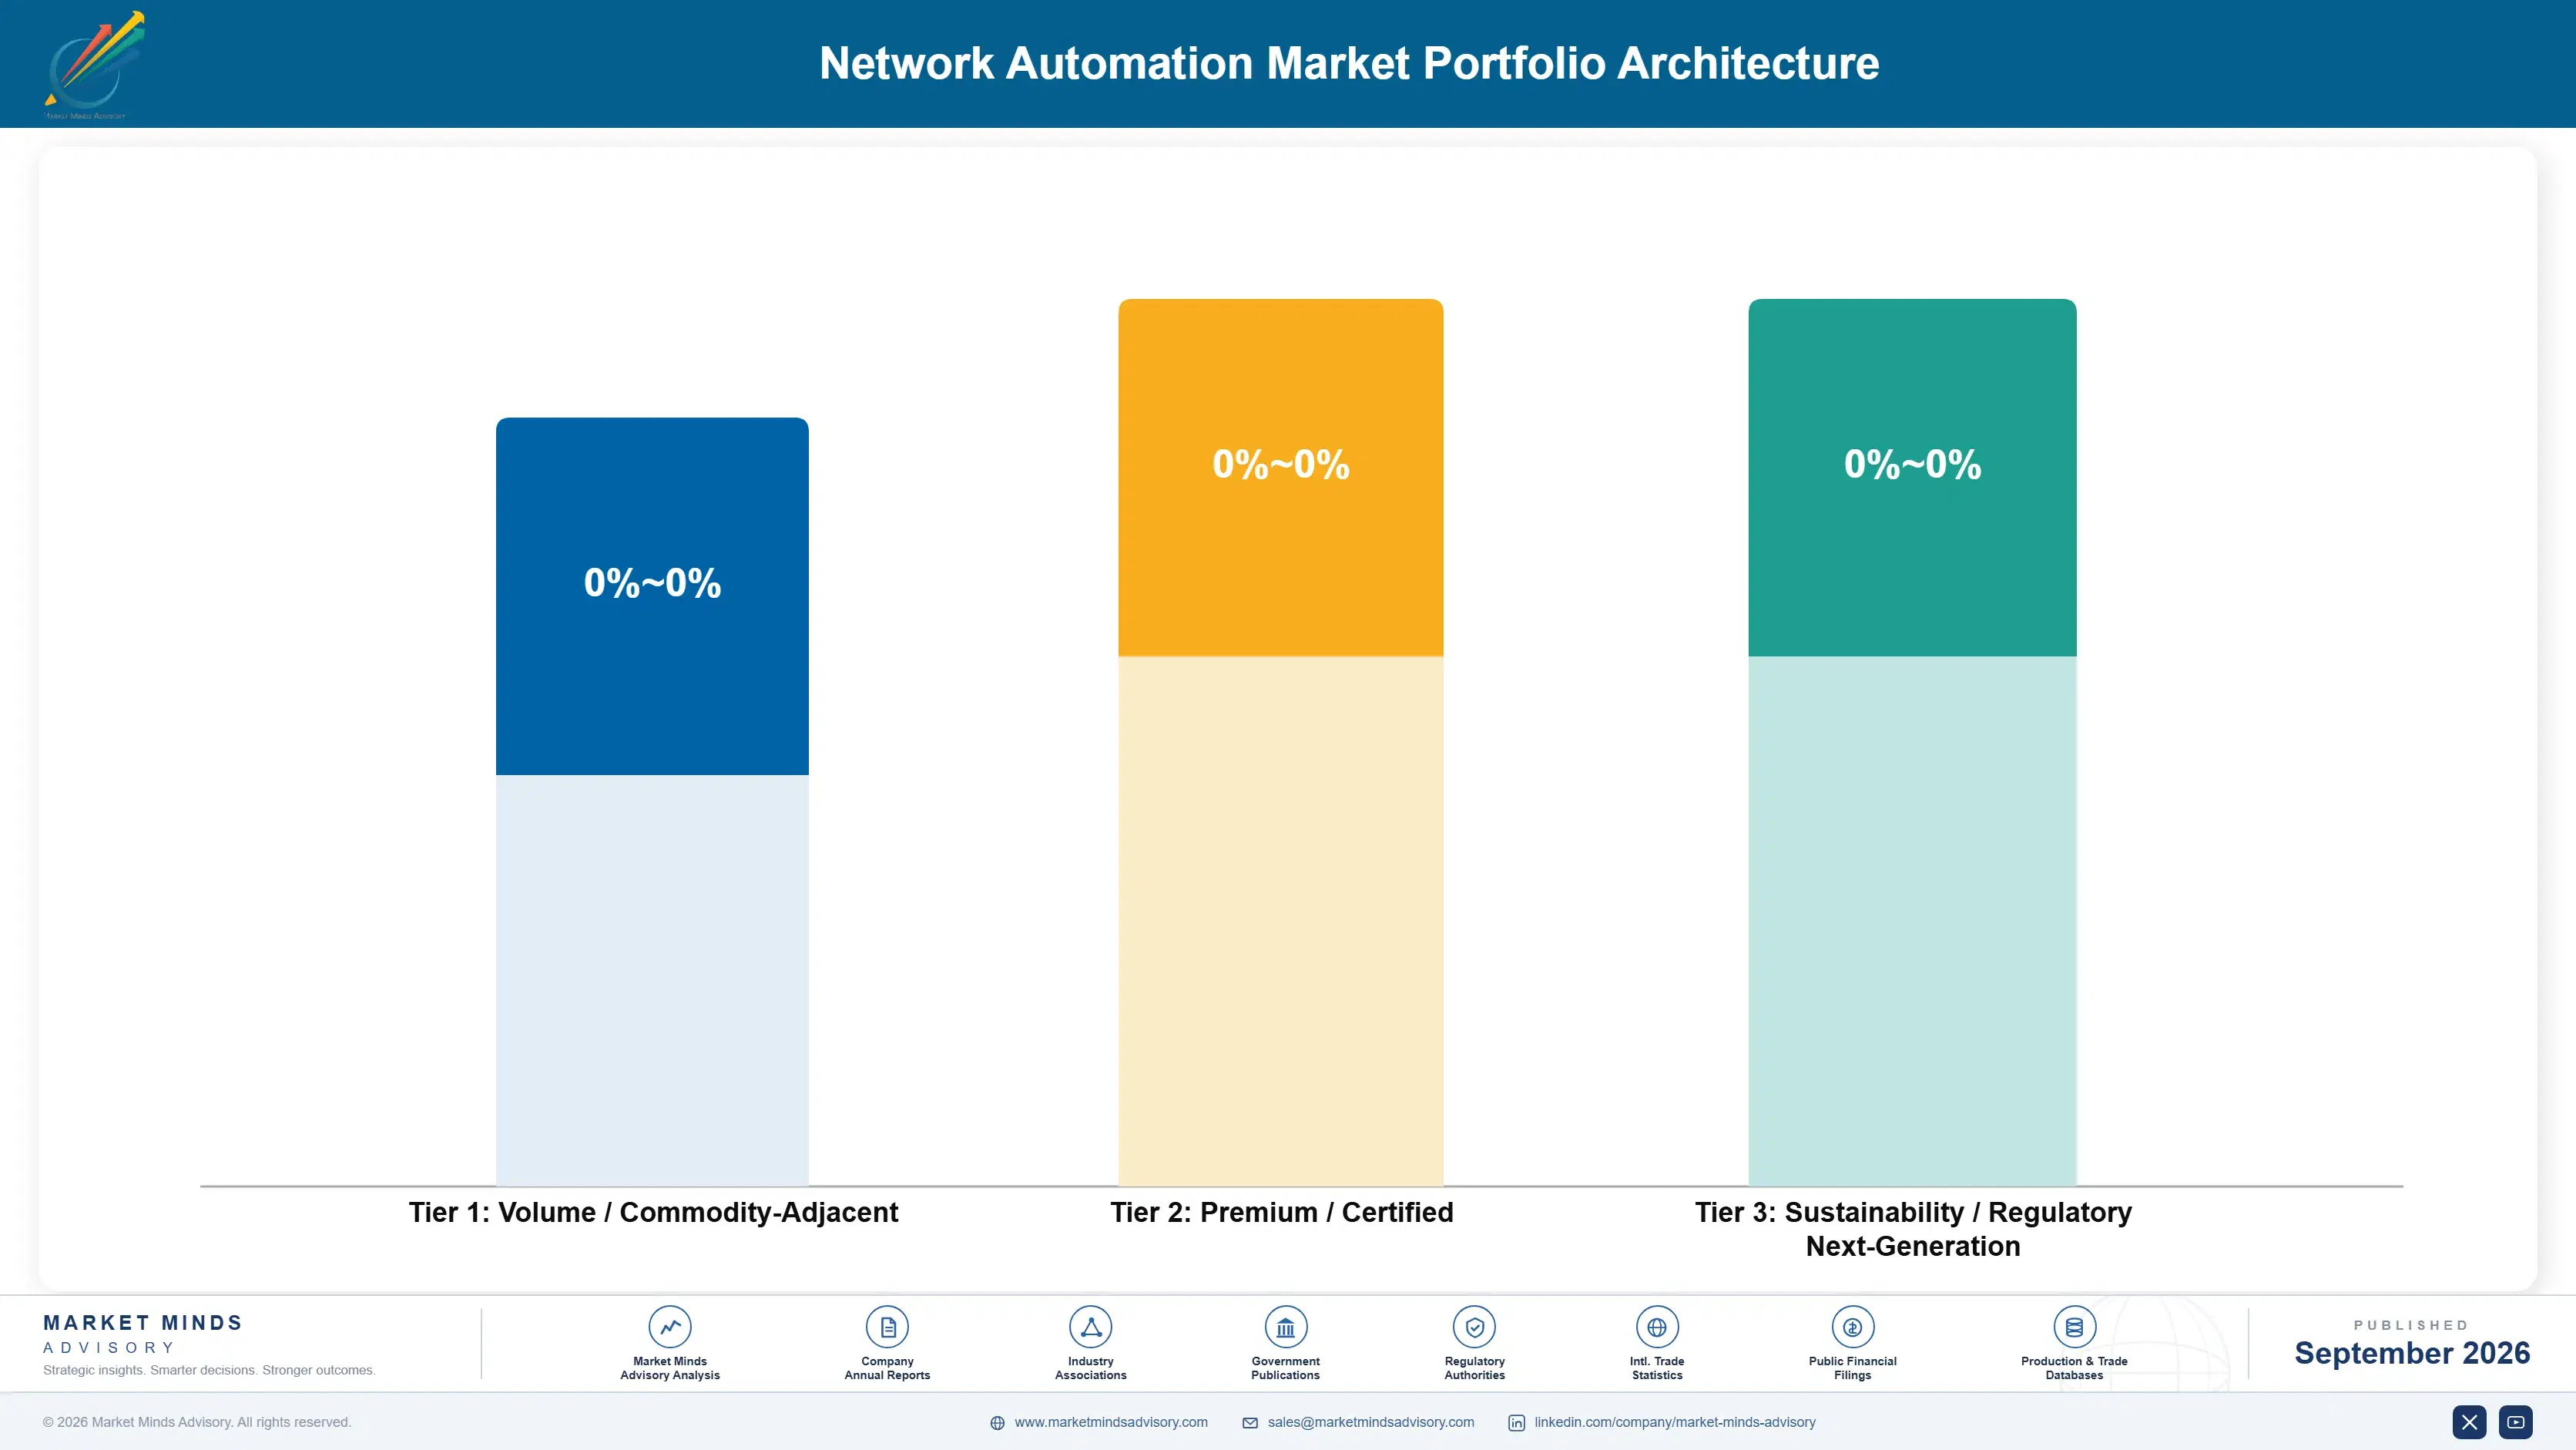
Margin architecture separates on approval friction rather than on technical difficulty. Automation adoption services earn least, since they are labour that scales with customer count and frequently get absorbed to protect deals. Configuration and change management platforms sit above on licence economics. Closed loop remediation, compliance reporting and pre-change validation earn most, because each either opens the approval gate or bypasses it entirely.
The volume versus premium tension runs between platform breadth and rollback depth, which reward opposite engineering investment. Breadth requires device integration maintenance scaling with every equipment model and release across the industry. Rollback depth requires network-specific validation and reversal engineering on far fewer platforms. Vendors pursuing both carry a maintenance burden that funds coverage the change board never asked about.

High-value pools concentrate in closed loop remediation and in compliance reporting, and neither is reached through configuration capability. Remediation requires reversal reliability approaching what boards demand before they permit anything. Compliance requires evidence formats that satisfy auditors rather than engineers. Both explain why concentration sits at only 41% while the vendors reaching production deployment are considerably fewer than the participant count suggests.

Volume / Commodity-Adjacent

Automation adoption and professional services, labour scaling directly with customer count and frequently absorbed into licence deals to protect them from stalling. The thirteen point spread separates vendors charging for adoption work from those giving it away to close initial contracts.
Gross Margin: 33% to 46%

Premium / Certified

Network configuration and change management platforms and intent-based configuration and policy management, where device coverage breadth determines selection more than any capability comparison does. The thirteen point spread tracks how much integration validation each vendor has automated against manual maintenance per release.
Gross Margin: 58% to 71%

Sustainability / Regulatory / Next-Generation

Closed loop remediation and auto-rollback, automated compliance and audit reporting and network testing and pre-change validation, each opening the approval gate or bypassing it. The thirteen point spread reflects rollback reliability depth and whether evidence formats satisfy auditors directly.
Gross Margin: 76% to 89%
network-automation-market-portfolio-architecture-1788731829449

High-value Sub-segments and Strategic Watch-out

Closed Loop Remediation And Auto-Rollback

Grows at 16.5% because change boards want around 99% rollback reliability before permitting unattended execution anywhere. The thirteen point spread reflects reversal engineering depth. This is the only capability that moves approval culture rather than arguing against it. Evidence rather than assurance convinces. Culture rather than software.
Gross Margin: 76% to 89%

Automated Compliance And Audit Reporting

Grows at 13.8% because reading device state and producing evidence needs no authorisation to modify anything at all. The thirteen point spread reflects evidence format depth. Around 37% of automated activity already sits here rather than in configuration change. Value arrives in the first week.
Gross Margin: 76% to 89%

Network Testing And Pre-Change Validation

Grows at 14.6% because proving a change before execution is what shortens six day approval cycles most directly. The thirteen point spread reflects modelling accuracy. Boards accept validated changes considerably faster than unvalidated ones regardless of tooling. Approval cycles shorten measurably. Validation shortens six day cycles.
Gross Margin: 76% to 89%

Automation Adoption And Professional Services

Grows at 8.4%, slowest of the six classes, as labour scaling with customer count and frequently absorbed to protect licence deals. The thirteen point spread reflects charging discipline. Deployments stall without this work, which is why vendors keep giving it away. Charging filters uncommitted customers.
Gross Margin: 33% to 46%

Why Boards Decide Adoption

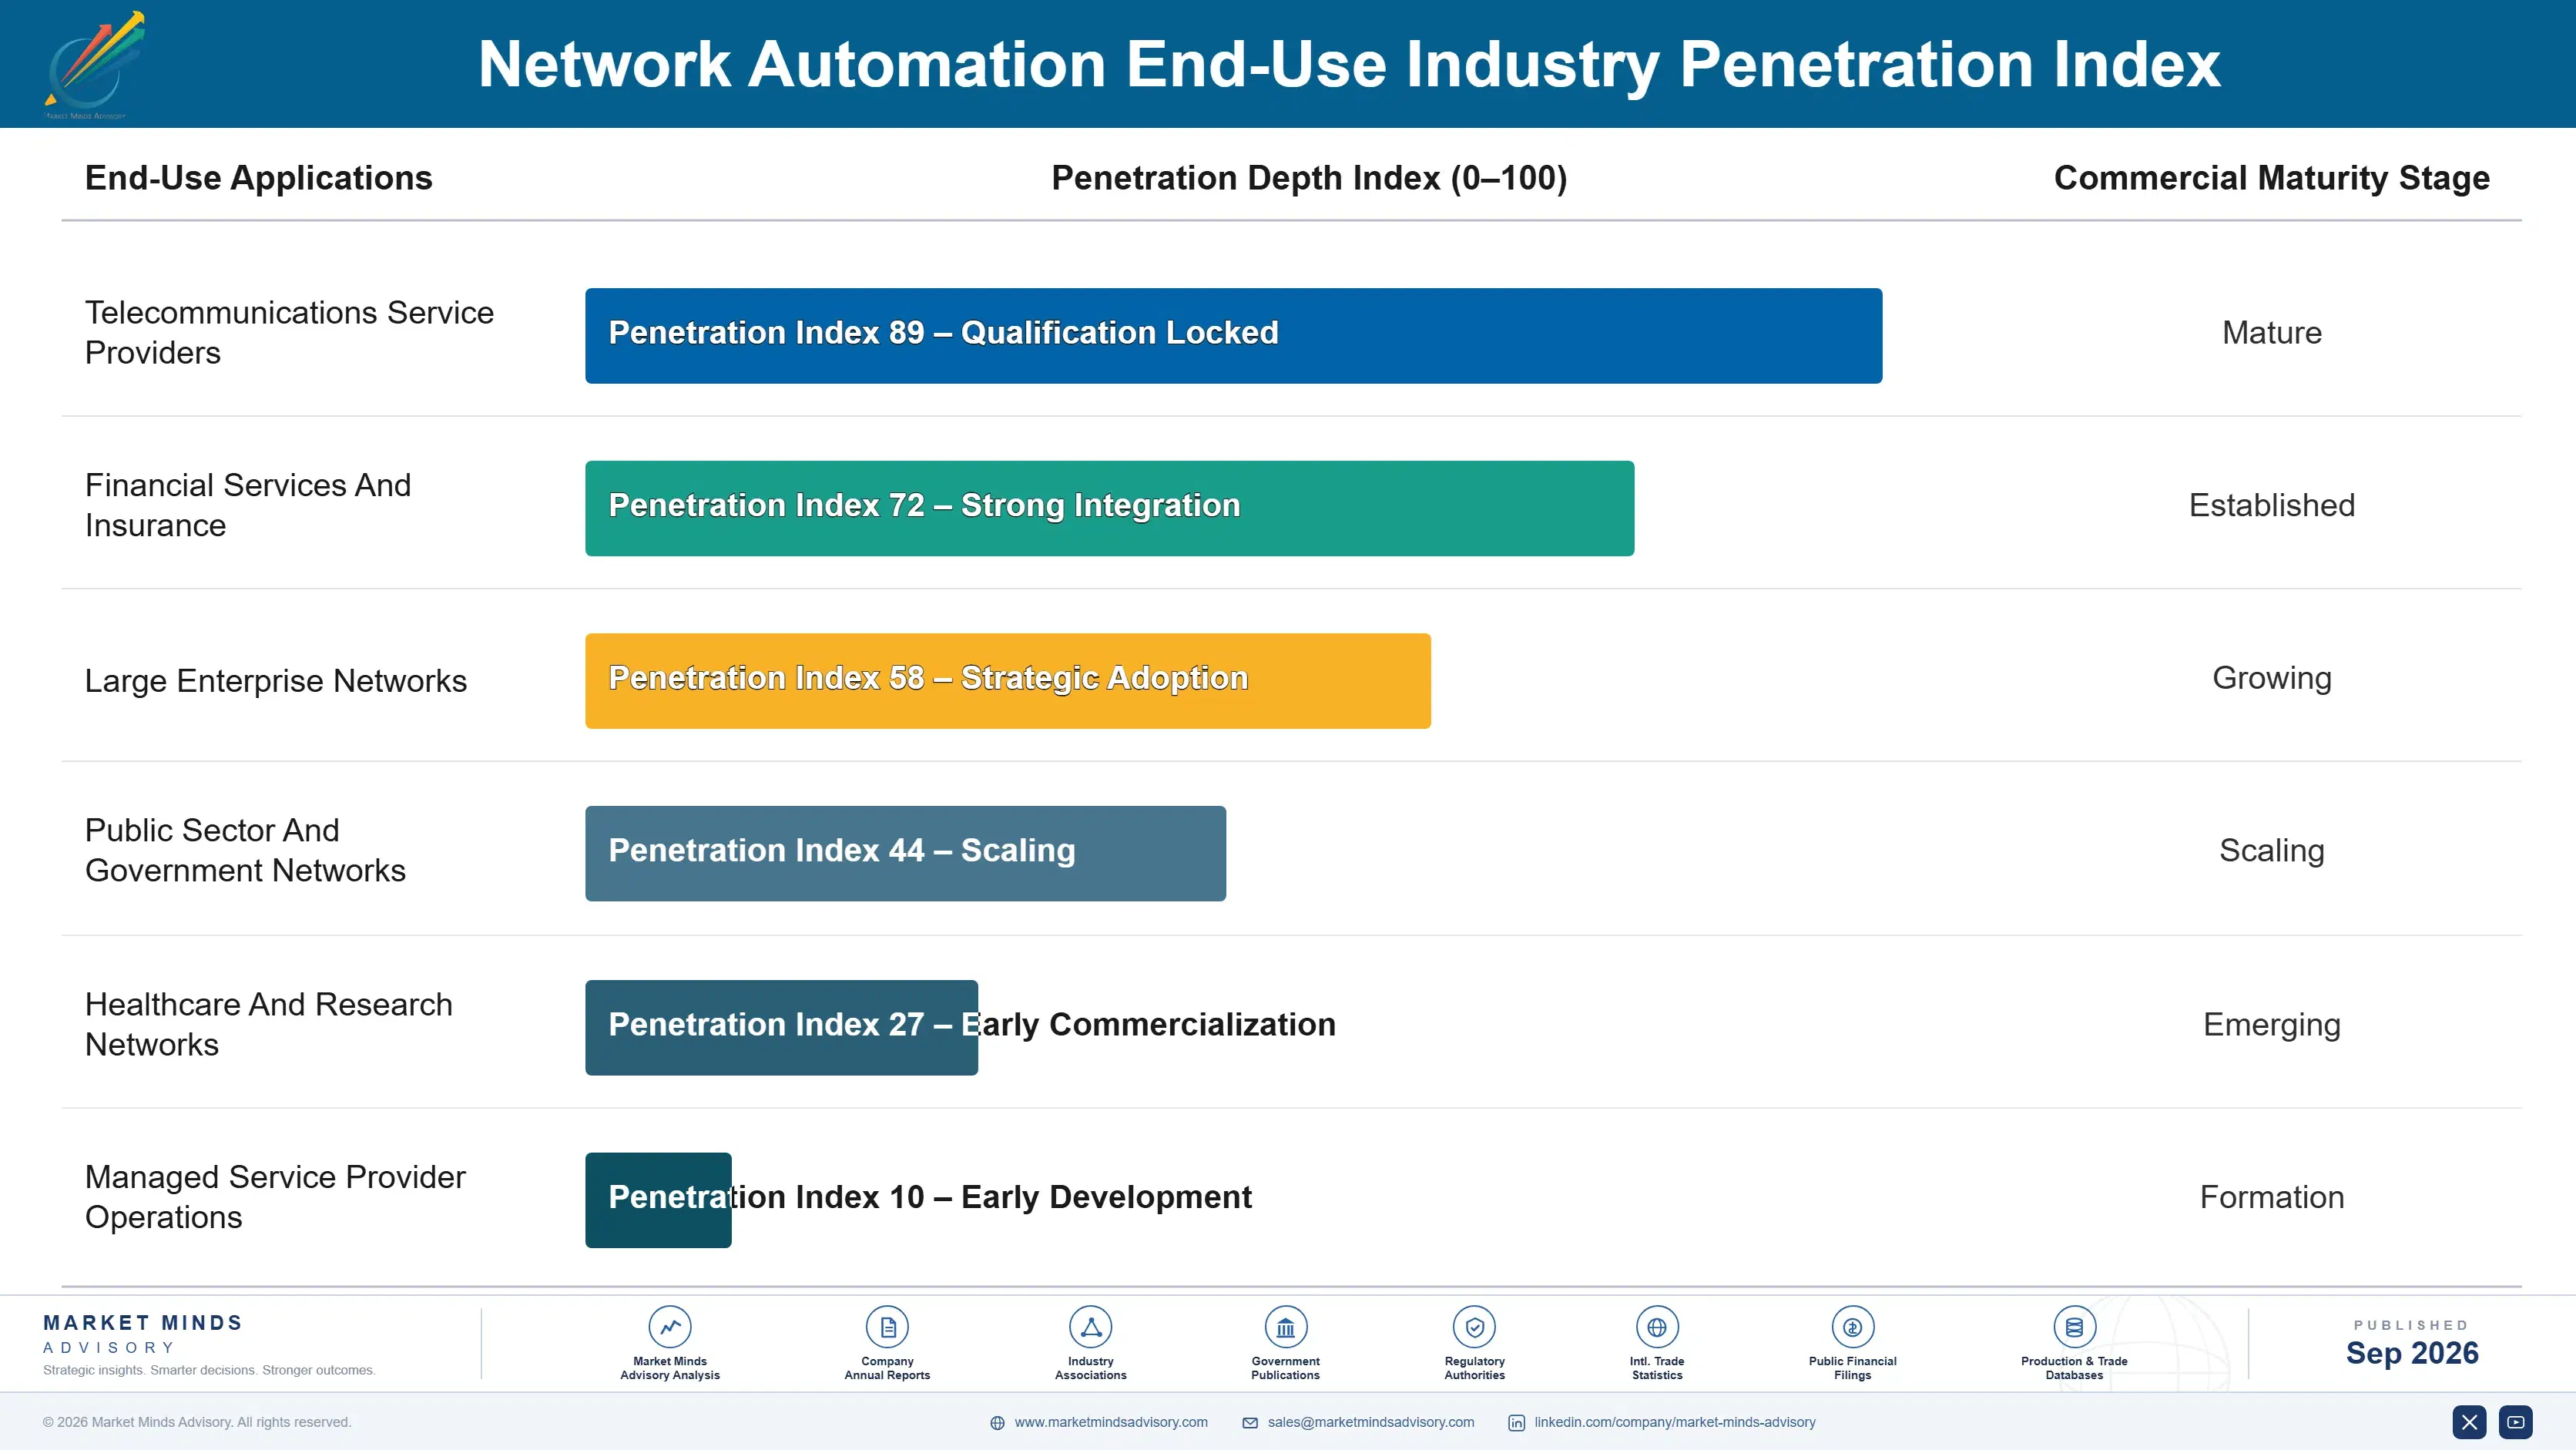
The annuity here depends entirely on whether changes actually run. A deployment executing unattended demonstrates value continuously and renews without argument. A deployment in advisory mode carries full licence cost against a fraction of the promised saving, and around 44% of them sit there. Renewal separates those two cleanly, and vendors discover which one they sold when the business case gets examined against what the platform actually did.
Depth varies by what the automation touches. Compliance and reporting work runs from the first week because it modifies nothing and needs nobody's approval. Configuration change waits for a board that wants around 99% rollback reliability and can name the outage that made it cautious. The same platform therefore delivers value on completely different timescales depending which half of its capability the customer switched on.

The buyer and the approver are different people who rarely agree. A network architect evaluated platform capability, device coverage and integration effort against an automation roadmap. A change advisory board evaluates blast radius and reversal reliability against an outage it remembers. An audit function evaluates whether compliance evidence arrives without manual collection. The board is not the buyer and it decides more than the buyer does.
network-automation-market-end-use-penetration-index-1788731829733

What Wins Automation Deployments

These are among the four positions where our research anticipates prominent divergence between winners and laggards over the coming forecast period. Each is grounded in the demand model, the regulatory perimeter, and the announced capacity pipeline.
01 / REVERSAL CAPABILITY PRIORITY

Prove The Undo, Not The Speed

Change boards want around 99% rollback reliability before permitting unattended execution, because the fear driving approval culture is irreversibility rather than failure in any individual change itself. Only around 23% of automated changes currently run without a person approving each one anywhere. Vendors demonstrating reliable reversal reach the gate that limits this whole category, while those selling configuration speed answer a question no board has ever asked and cannot understand the stalled deployments that follow from it or the renewals lost.
02 / APPROVAL FREE ENTRY

Start Where Nobody Needs Permission

Around 37% of automated activity covers audit and compliance reporting, because reading device state and producing evidence requires no authorisation to modify anything on the network at all. That work automates in the first week and delivers value while a change board is still deciding about everything else. Vendors leading with compliance reach production deployment where those leading with change velocity stall indefinitely in advisory mode waiting for permission that never arrives from a cautious board that never quite arrives.
03 / BUSINESS CASE HONESTY

Cost It For What Will Actually Run

Around 44% of deployments run in advisory mode delivering a fraction of the promised saving while carrying the full licence cost, because the original business case assumed unattended execution that the change board never approved. Vendors building cases from compliance and validation value survive renewal where velocity-based cases predictably do not. That honesty costs a smaller initial deal and protects a renewal that an unmet case reliably loses once finance examines it properly against what actually ran rather than what was promised.
04 / CULTURE AWARE TARGETING

Sell Where Nobody Remembers The Outage

India compounds at 18.1% because network infrastructure is being built faster than teams can be hired and automation becomes necessary rather than a productivity preference anybody has to argue for. Organisations building fresh networks also carry less accumulated outage history shaping approval culture. Vendors concentrating on mature enterprise estates sell into the most conservative boards anywhere, where an incident from years ago still governs current policy entirely across the whole organisation for years afterwards and shows no sign of loosening.

Engagement Snapshot From the Field

A live engagement with an industry participant carrying material or product regulatory and market exposure ahead of a defining policy shift, showing how our research translates into a defensible multi-year portfolio strategy.
MARKET MINDS ADVISORY · CLIENT ENGAGEMENT SUMMARY
Network Automation Producer Strategic Portfolio Review and Transition Roadmap 2026·Investment Scenario on Network Automation Exposure Evaluation 2025-26
CLIENT PROFILE
A telecommunications operator three years into an automation programme that had reached full licence deployment while most changes were still executed manually through the existing approval process. Management had approved further platform expansion, without establishing why the existing deployment had never moved beyond advisory operation on production networks. Nobody had asked why it stalled in advisory mode across three full years.
STRATEGIC CHALLENGE
Network engineering wanted more platform capability to widen automation coverage. Operations wanted the approval process left alone after an outage four years earlier. Finance had begun questioning a business case that assumed savings nobody could evidence, and the renewal fell within two quarters alongside the expansion request. Neither position addressed the board's actual objection.
MMA APPROACH
MMA measured what proportion of changes actually ran unattended against what the business case had assumed, and traced why the change board had declined to permit broader execution. We assessed rollback reliability evidence available from advisory operation. Work drew on 47 expert interviews conducted in Q4 2025 with operators, enterprises and automation vendors.
KEY FINDINGS
  1. Around 17% of changes ran unattended against a business case that had assumed roughly 70%, which accounted for the entire savings shortfall.
  2. The change board had never been shown rollback evidence, because nobody had thought to gather it during three years of advisory operation.
  3. Compliance reporting automation delivered measurable value from the very first month and nobody had ever counted it anywhere (client-reported, unverified by MMA).
  4. Additional platform capability would not have changed the approval position at all, since the board's stated objection concerned reversal rather than automation coverage.
CLIENT PROFILE
A telecommunications operator three years into an automation programme that had reached full licence deployment while most changes were still executed manually through the existing approval process. Management had approved further platform expansion, without establishing why the existing deployment had never moved beyond advisory operation on production networks. Nobody had asked why it stalled in advisory mode across three full years.
STRATEGIC CHALLENGE
Network engineering wanted more platform capability to widen automation coverage. Operations wanted the approval process left alone after an outage four years earlier. Finance had begun questioning a business case that assumed savings nobody could evidence, and the renewal fell within two quarters alongside the expansion request. Neither position addressed the board's actual objection.
MMA APPROACH
MMA measured what proportion of changes actually ran unattended against what the business case had assumed, and traced why the change board had declined to permit broader execution. We assessed rollback reliability evidence available from advisory operation. Work drew on 47 expert interviews conducted in Q4 2025 with operators, enterprises and automation vendors.
KEY FINDINGS
  1. Around 17% of changes ran unattended against a business case that had assumed roughly 70%, which accounted for the entire savings shortfall.
  2. The change board had never been shown rollback evidence, because nobody had thought to gather it during three years of advisory operation.
  3. Compliance reporting automation delivered measurable value from the very first month and nobody had ever counted it anywhere (client-reported, unverified by MMA).
  4. Additional platform capability would not have changed the approval position at all, since the board's stated objection concerned reversal rather than automation coverage.
RECOMMENDED STRATEGY
Phase 1: Phase one: cancel the platform expansion, since the board's objection concerned reversal reliability rather than any gap in automation coverage. Phase 2: Phase two: gather rollback evidence from advisory operation deliberately and present it to the change board as the basis for staged execution. Phase 3: Phase three: recost the business case on compliance and validation value already delivered rather than on execution savings never achieved.
OUTCOME
The operator cancelled its expansion and gathered rollback evidence from advisory operation instead (client-reported, unverified by MMA). The change board permitted staged unattended execution on lower risk change classes once evidence existed. Rollback evidence is now collected from the first day of any deployment, which is the change that outlasted the engagement.

Frequently Asked Questions

Foundational context covering the market sizes, CAGR, scope, country, region and competition that inform every finding below. This section is provided to cover basics and most often pre-purchase conversations, answered from the MMA Primary Research Dataset.

What is the current size of the Network Automation Market?

Global value reaches USD 6.0 billion in 2026, measured as network automation software revenue across six functions. The 2025 base was USD 5.4 billion on the same basis.

How large will the Network Automation Market be by 2036?

The market reaches USD 17.0 billion by 2036, an increase of USD 11.0 billion across the forecast period. That represents 2.83 times expansion from the 2026 base.

What is the CAGR for the Network Automation Market 2026 to 2036?

The base case runs at 11.0% annually, with a bull case at 12.3% if unattended execution becomes normal and a bear case at 9.8% if a high profile automated outage hardens approval culture.

Which segment is growing fastest?

Closed loop remediation and auto-rollback grows at 16.5%, half again the market rate of 11.0%. Reliable reversal is what actually opens the change approval gate.

Who are the major companies in the Network Automation Market?

Cisco Systems, Juniper Networks, Red Hat, Itential and BackBox lead on automation software revenue, holding 41% between them. NetBrain and Forward Networks hold smaller positions.

Which country is growing fastest?

India leads at 18.1%, because network infrastructure is being built faster than teams can be hired and automation becomes necessary rather than optional. Indonesia and Vietnam follow.

Report Segmentation Architecture

The full report scope spans multiple orthogonal segmentation dimensions, with cross-tabulated demand data provided for each dimension pair. Coverage extends further to regional breakdowns, trend trajectories, and the competitive detail needed to support segment-level decision-making.

By Automation Function

  • Closed Loop Remediation And Auto-Rollback
  • Automated Compliance And Audit Reporting
  • Network Testing And Pre-Change Validation
  • Intent-Based Configuration And Policy Management
  • Network Configuration And Change Management Platforms
  • Automation Adoption And Professional Services

By End-Use Industry

  • Telecommunications Service Providers
  • Financial Services And Insurance
  • Large Enterprise Networks
  • Public Sector And Government Networks
  • Healthcare And Research Networks
  • Managed Service Provider Operations

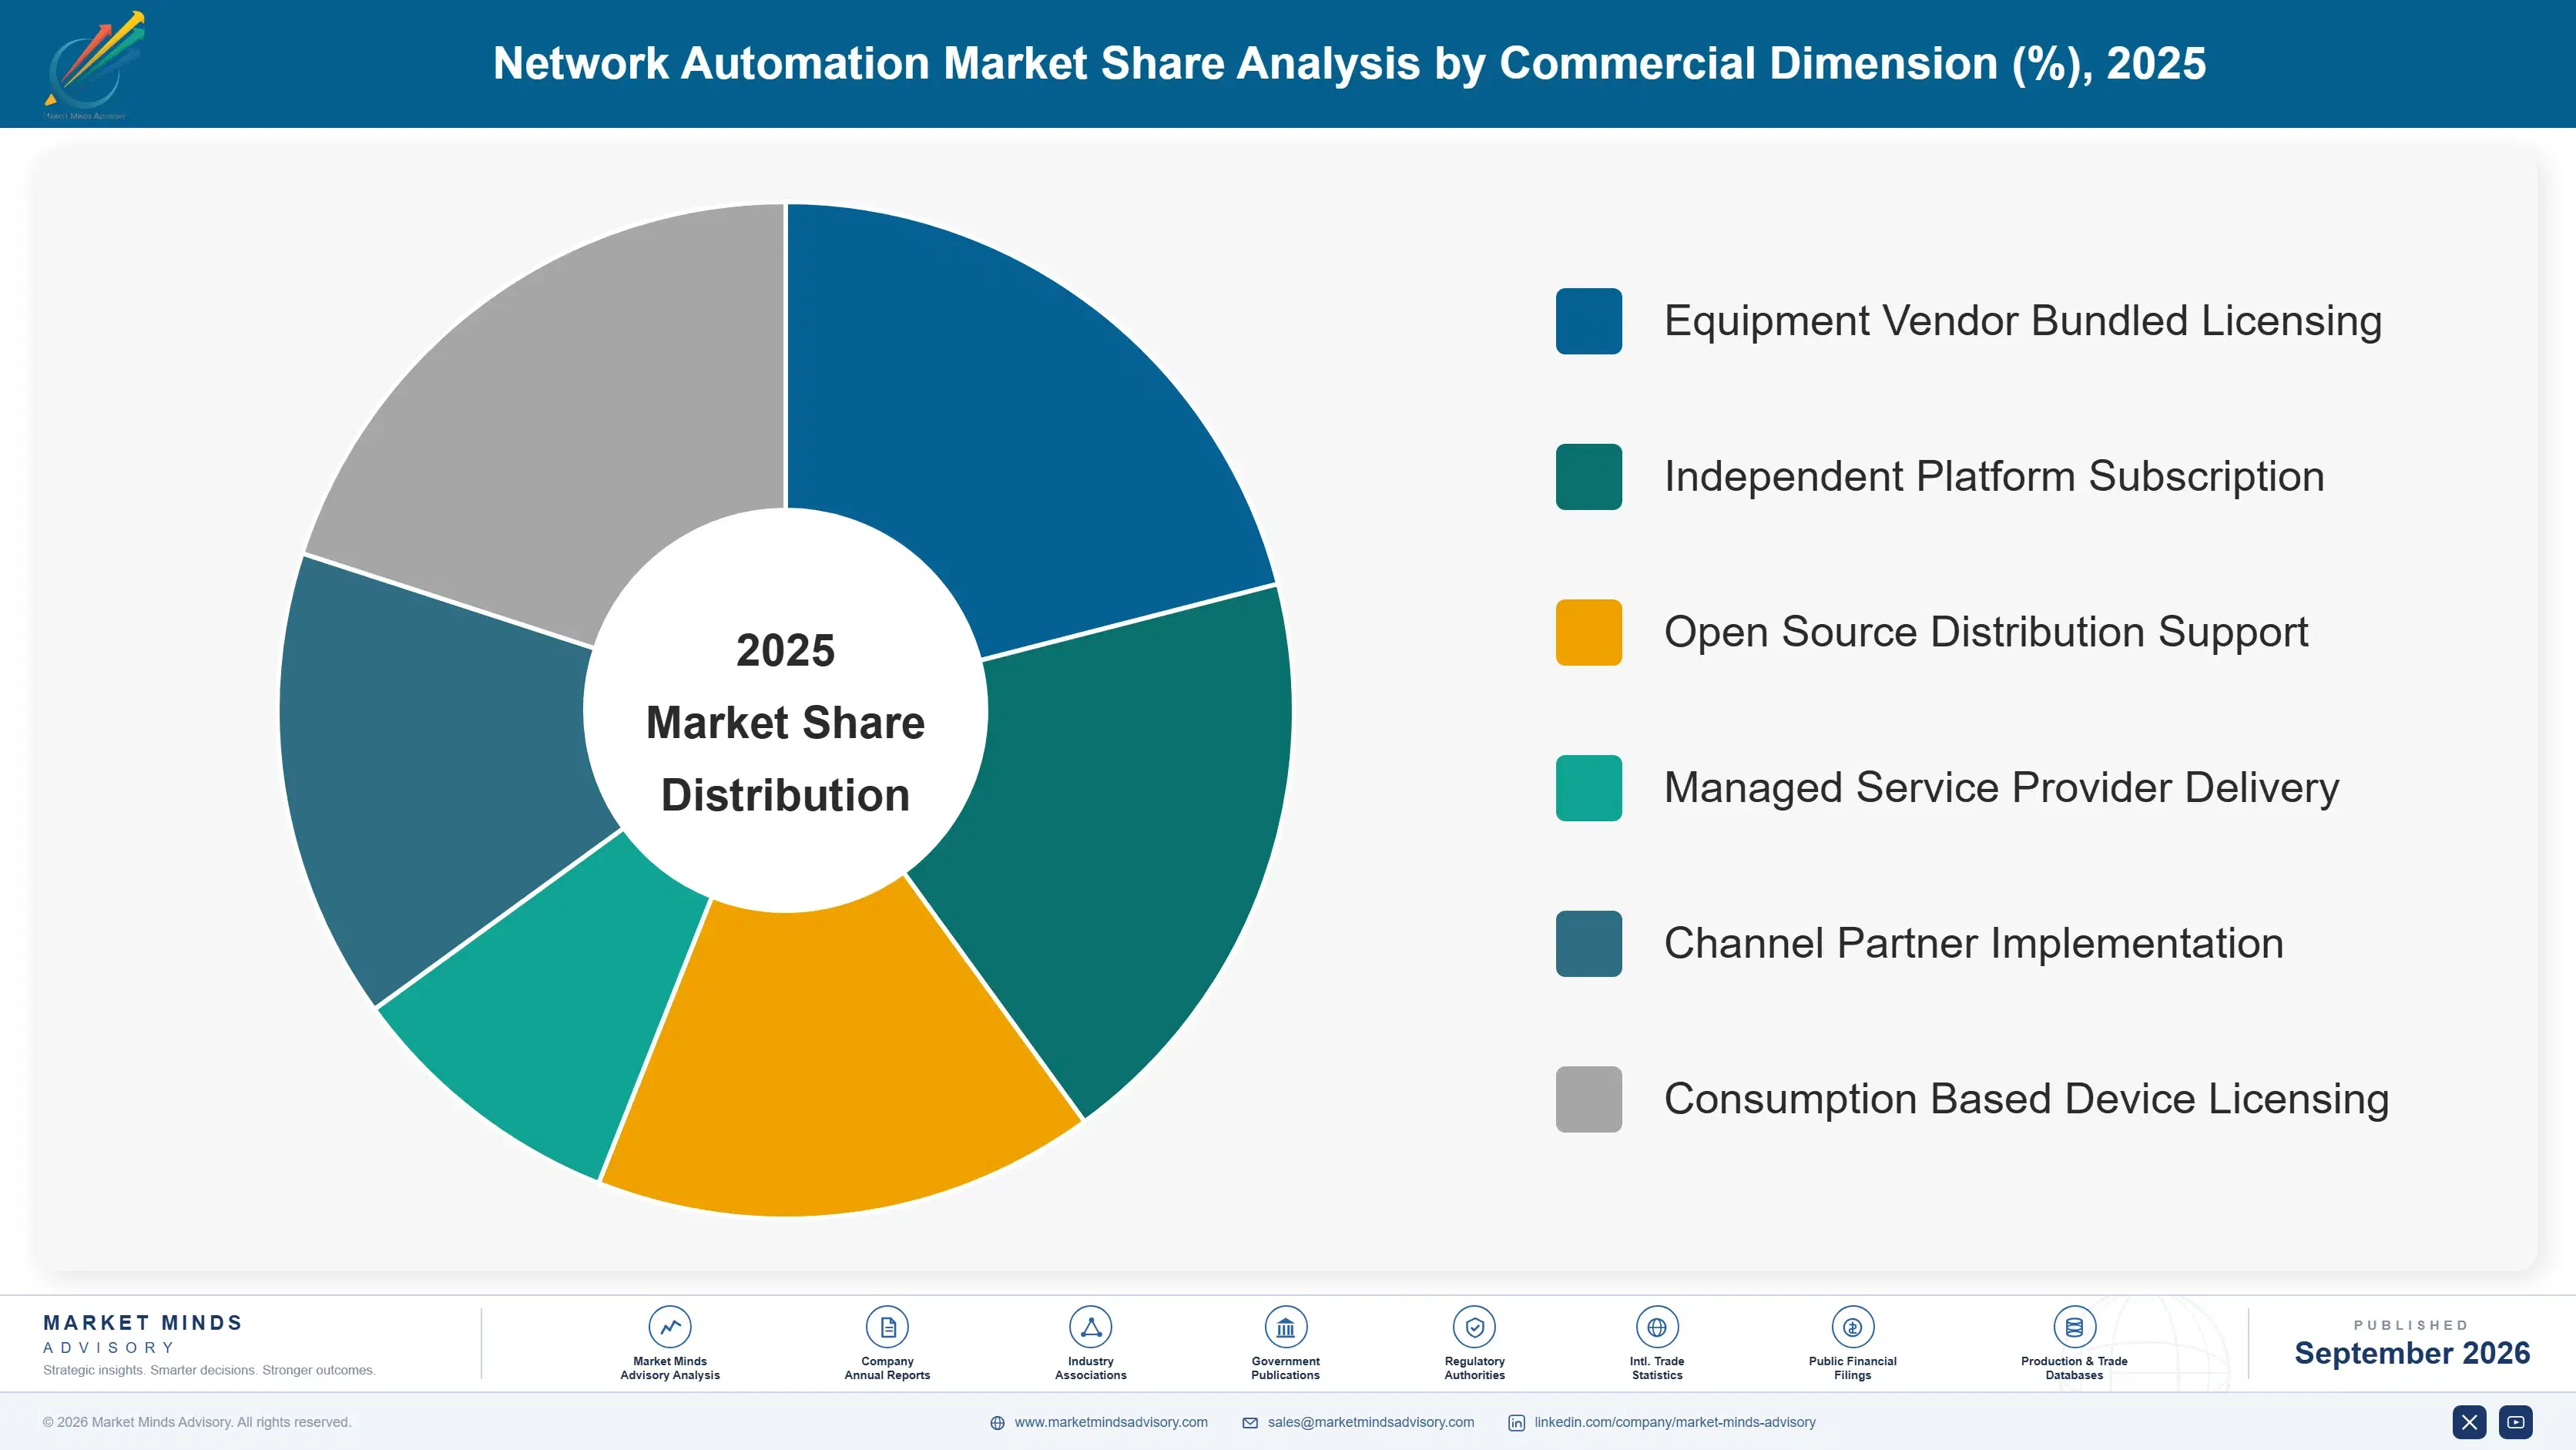
By Commercial Dimension

  • Equipment Vendor Bundled Licensing
  • Independent Platform Subscription
  • Open Source Distribution Support
  • Managed Service Provider Delivery
  • Channel Partner Implementation
  • Consumption Based Device Licensing

By Region

  • North America
  • Western Europe
  • East Asia
  • South Asia and Pacific
  • Latin America
  • Middle East and Africa
  • Eastern Europe

Scope, Methodology, and Coverage

Every figure in this report is reproducible from documented input assumptions. The scope below maps the historical period, the forecast horizon, the segmentation dimensions, and the countries covered, alongside the underlying primary and qualitative methodology.
Historical Period
2020 to 2025
Forecast Period
2026 to 2036
Base Year
2025 (USD billions; MMA Primary Research Dataset, September 2026)
Market Definition
This report covers network automation software: platforms and tooling that configure, validate and remediate network infrastructure without manual device interaction, spanning closed loop remediation and auto-rollback, intent-based configuration and policy management, configuration and change management platforms, network testing and pre-change validation, automated compliance and audit reporting, and automation adoption services. It excludes network monitoring and observability tools, security policy platforms, network hardware and controllers, service provider service orchestration, and general infrastructure configuration management.
Quantitative Units
USD millions, network automation software revenue basis; devices under automation management; unattended execution share as a percentage; change approval duration in days; advisory mode deployment share; rollback reliability thresholds; compliance share of automated activity.
Segmentation Dimensions
Automation function and approval exposure; end-use industry; commercial licensing route; geography across seven regions.
Regions Covered
North America, Western Europe, East Asia, South Asia and Pacific, Latin America, Middle East and Africa, Eastern Europe
Countries Covered
United States, Canada, United Kingdom, Germany, France, Netherlands, Switzerland, Spain, Poland, Czechia, China, Japan, South Korea, India, Australia, Singapore, Indonesia, Brazil, Mexico, Saudi Arabia.
Key Companies Profiled
Cisco Systems, Juniper Networks, Red Hat, Itential, BackBox, Nokia, Arista Networks, VMware, IBM, NetBrain Technologies, Forward Networks, Gluware, Anuta Networks, SolarWinds, Infoblox.
Quantitative Methodology
Primary survey, n=3,800 respondents, Q4 2025, six countries; demand-side model with trade association cross-validation
Qualitative Methodology
47 expert interviews, Q4 2025; applied to validate demand model assumptions, identify emerging dynamics, and assess competitive positioning
Report Format
PDF and XLSX data workbook (Word format preview document)
Publisher
Market Minds Advisory
Report Code
MMA-2026-TEC-261
Published
September 2026
Contact
sales@marketmindsadvisory.com | www.marketmindsadvisory.com

Purchase the full Network Automation Market Report (2026 to 2036).

This report sizes the global network automation market from 2026 to 2036 across six automation functions, six industries and seven regions. It explains why only around 23% of automated changes run unattended and roughly 44% of deployments sit in advisory mode, which is an approval culture problem rather than a software one. Rollback reliability near 99% demanded by change boards is analysed as the only capability that opens that gate. Compliance automation at around 37% of activity is examined as the entry point requiring nobody's permission. Regional analysis explains why East Asia holds 30% of spending.
Six automation functions sized through to 2036
Unattended execution rates quantified against purchased deployments
Rollback reliability thresholds analysed as an approval gate
Twenty named vendors assessed on automation software revenue
Four revenue levers with quantified commercial impact
Anonymised operator automation programme engagement documented in full

Built For The People Who Decide

From boardroom strategy to bench-side execution, this report is read cover-to-cover by leaders shaping the next decade of their industry, turning demand scenarios, market dynamics and valuation benchmarks into decisions.
CXOs/ Presidents/ VPs/ Managers
M&A and Corporate Development
Strategy Teams and R&D Heads
Procurement and Product Directors
Regulatory and Compliance Leaders
Investor Relations and Equity Analysts