Market Minds Advisory
Network Analytics Market

Network Analytics Market: Network Analytics Market: Autonomous Intelligence Redefines Network Operations.

Accelerating 5G and cloud network complexity, tightening security compliance mandates, and AI-driven autonomous network intelligence platforms are steadily reshaping which software vendors win enterprise design contracts across markets worldwide today.

Lead Analyst

Published

September 2026

Make Smarter Decisions with Customized Research Insights

Request a free sample report and evaluate market opportunities, growth trends, and competitive dynamics relevant to your business needs.

2025 MARKET VALUE$5.8BMarket Size 2025
2036 FORECAST VALUE$18.3BBase Case , 2026 to 2036
CAGR 2026 TO 203611.0 %Bull 12.3% / Bear 9.7%
INCREMENTAL OPPORTUNITY$11.8BNet 10- year value creation
EXPANSION MULTIPLE2.84x2036 value over 2026 base
Strategic Levers
M&A Pipeline
Regional Outlook
Country Rankings
Competitive Intelligence
Segmental Deep-dive
Call-Us : 91 93563 13602

Executive Snapshot and Market Trajectory.

The network analytics market is shifting decisively toward AI-driven autonomous network intelligence platforms, as enterprise operators increasingly demand adaptive monitoring systems that legacy rule-based designs can no longer support amid rapidly expanding 5G and cloud network complexity worldwide across most channels and countries and enterprise segments.
Demand splits between established performance monitoring and traffic analysis lines serving mandatory network compliance and everyday operational volume across most enterprise and telecom channels worldwide, and security analytics and autonomous intelligence work sold through direct design-win and specialty distributor channels where analytical sophistication increasingly drives adoption across telecom, cloud, and enterprise data center platforms specifically today. Autonomous intelligence demand is gaining share fastest, reinforcing vendor investment across most next-generation analytics programs overall and consistently.
Competitive character splits between large integrated software brands controlling enterprise design-win pipelines and long-term license contracts across most analytics categories worldwide, and smaller specialty providers selling narrower capacity planning and professional services lines through regional distributor networks across fewer accounts overall. Persistent engineering talent supply friction and thin legacy-tier margins increasingly separate well-capitalized vendors from smaller providers unable to absorb rising certification costs across most segments.
Market Definition
The market covers network performance monitoring software, network traffic analysis software, network security analytics platforms, network analytics professional services, network capacity planning and optimization software, and AI-driven autonomous network intelligence platforms sold to enterprise and telecom operators worldwide. It excludes general-purpose IT service management and application performance monitoring tools sold under separate commercial contracts.
Base Year Value
$5.8B in 2025 (MMA Primary Research Dataset, September 2026)
Forecast Period
2026 to 2036, eleven discrete annual values
CAGR
11.0% base case. Bull 12.3%. Bear 9.7%.
Fastest Growth Segment
AI-Driven Autonomous Network Intelligence Platforms: 20.0% CAGR
Fastest Growth Country
China: 15.5% CAGR
Fastest Growth Region
South Asia and Pacific: 13.0% CAGR
Largest Region
North America: 32% of 2025 global value
Market Leaders
Cisco Systems, Broadcom (VMware), Splunk, SolarWinds, Datadog. Source: MMA Analysis based on company annual reports and disclosed network analytics segment revenue.
Primary Survey
n=3,800 procurement and R&D decision-makers, Q4 2025, six countries
Methodology
Demand-side build-up, cross-validated against public data, 47 expert interviews

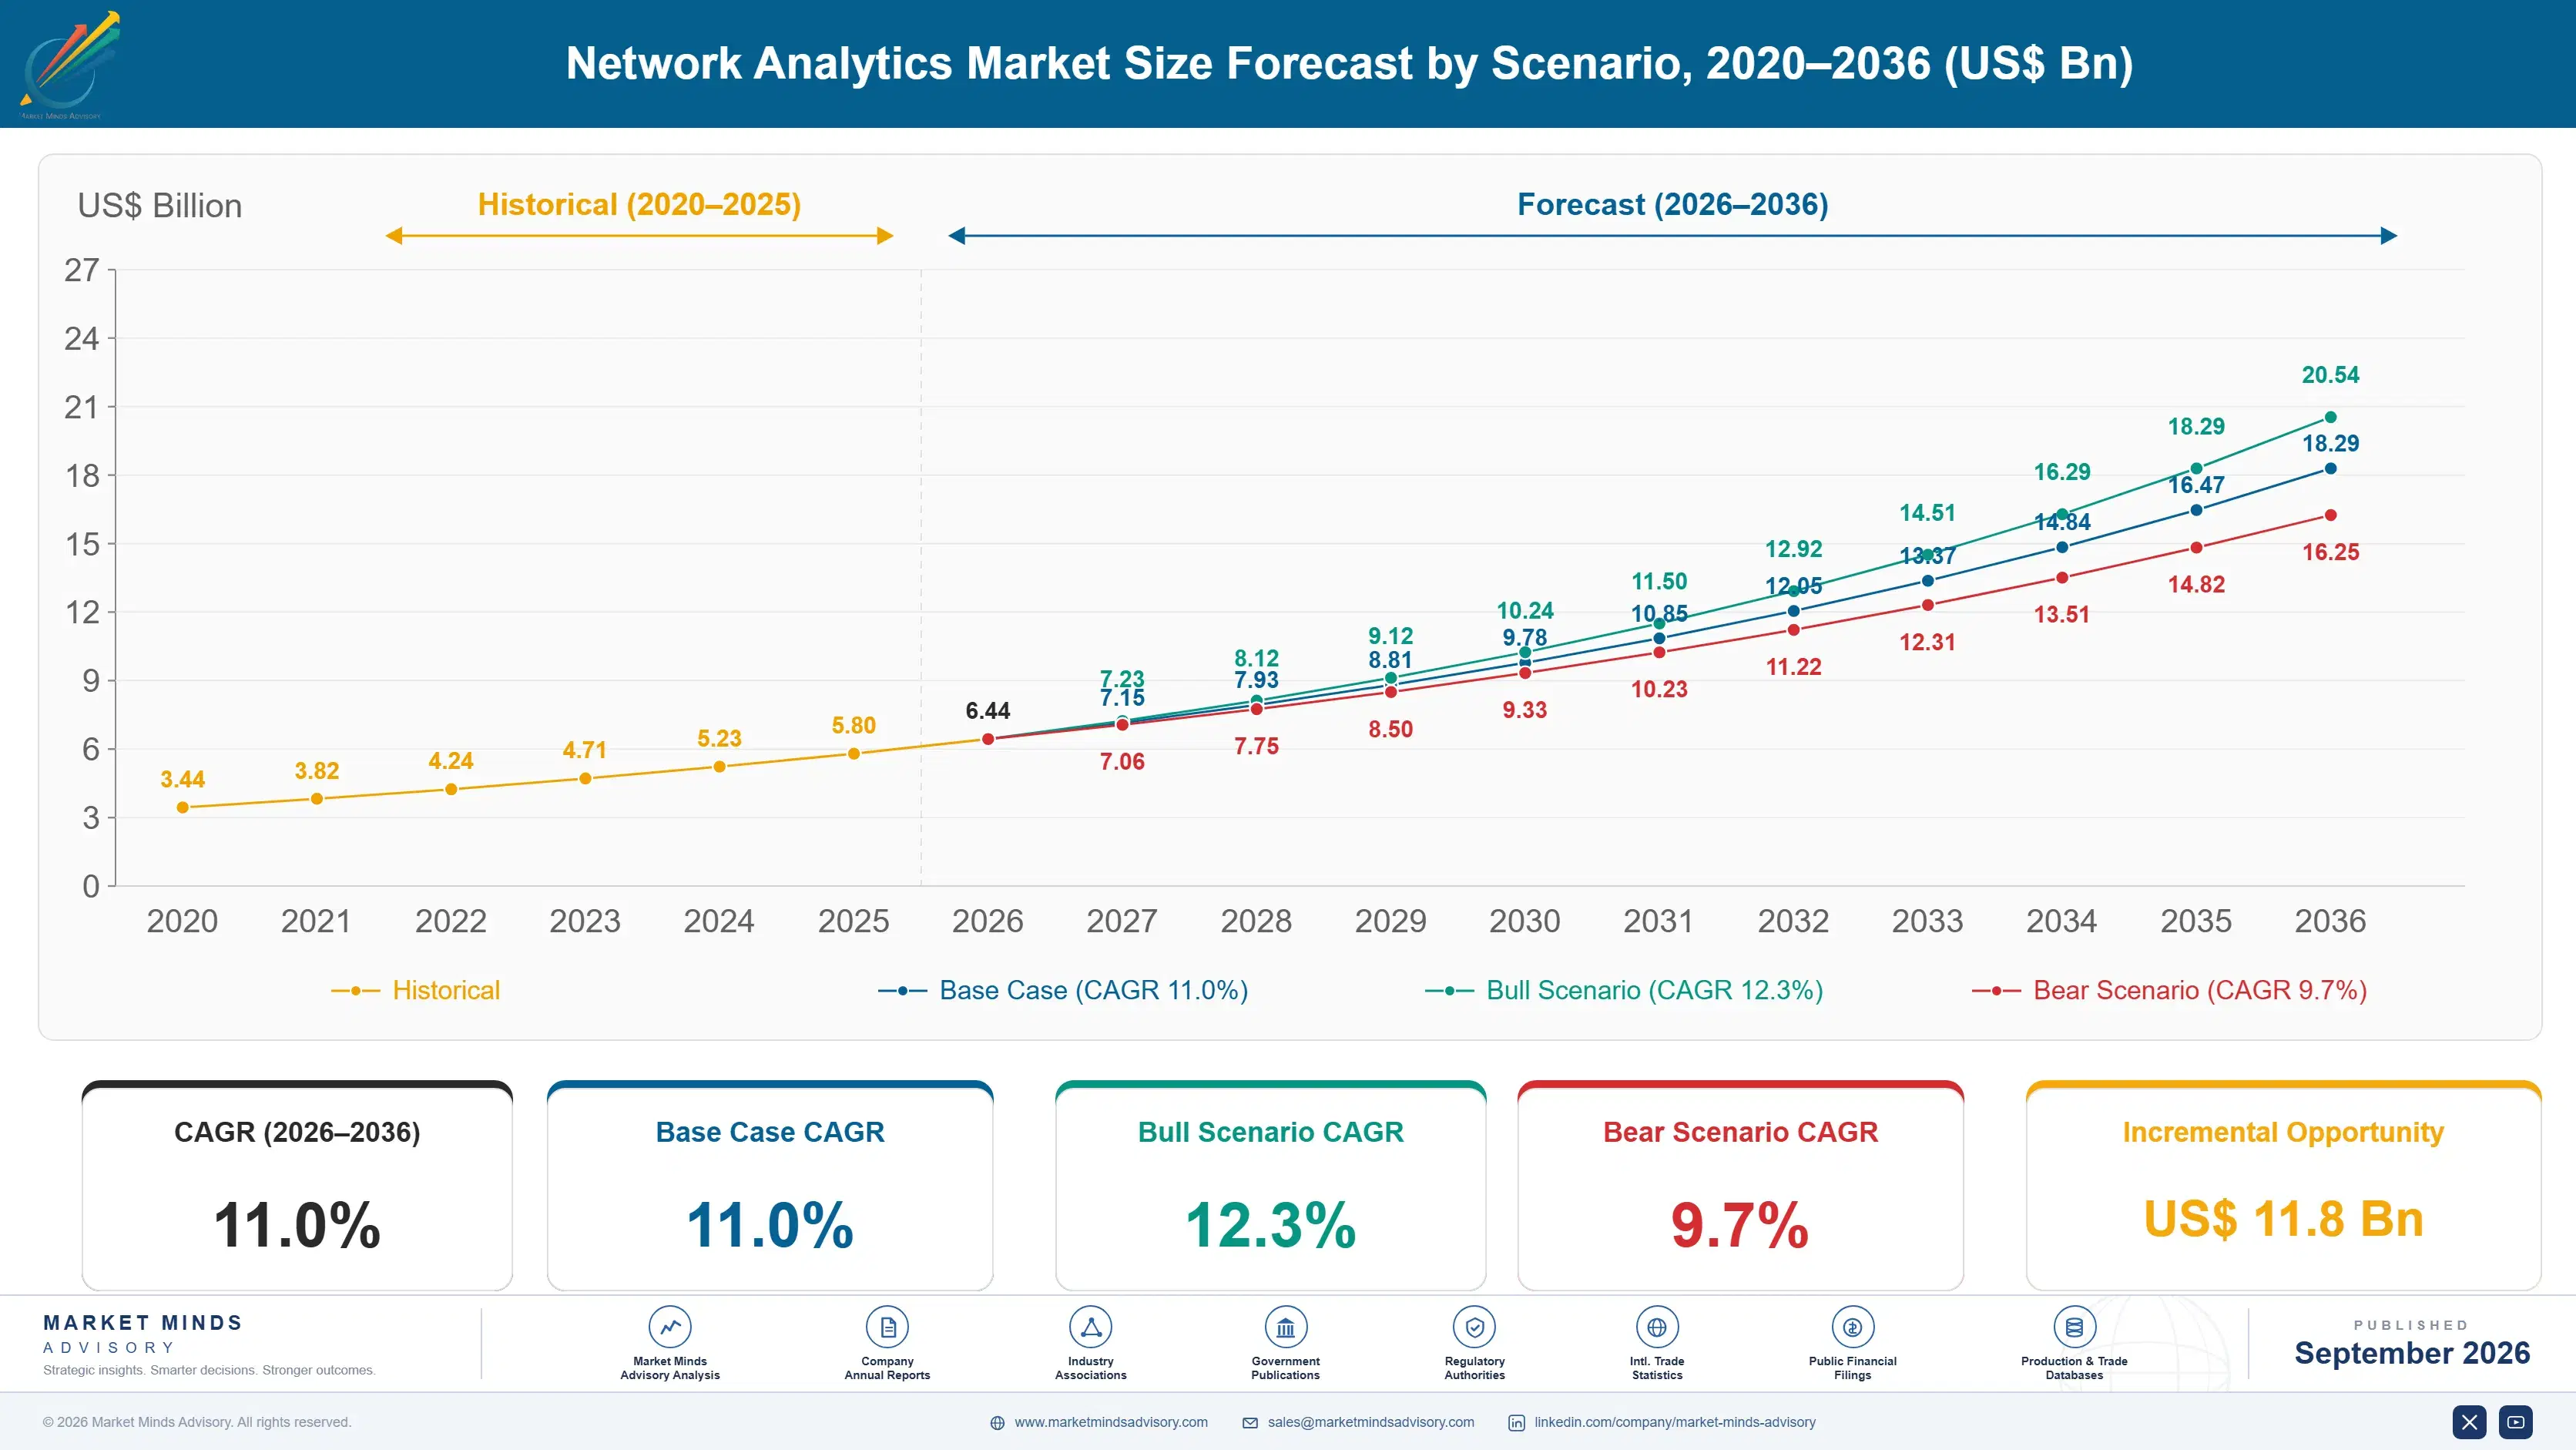
Network Analytics Market Forecast Scenarios

network-analytics-market-size-forecast-scenario-1789990149151
Between 2020 and 2025, the network analytics market grew steadily as 5G and cloud network complexity and security compliance mandates broadened across most enterprise applications, operator accounts, and reporting periods worldwide overall and consistently. Growth delivered a historical CAGR near 10.0 percent across the period, with autonomous intelligence platforms expanding fastest as operators embraced adaptive analytics investment.
MMA base case projects 11.0 percent CAGR through 2036, anchored in three commercial mechanisms: continued 5G network retrofit requiring dedicated security analytics and intelligence infrastructure at increasing volume each deployment cycle, expanding security compliance mandates sustaining baseline demand growth worldwide as visibility requirements keep rising steadily each passing year, and rising data volume per network pulling commercial volume upward across most analytics platforms each production cycle overall, consistently, and quite reliably indeed.
The bull case rests on accelerated global 5G rollout and faster autonomous intelligence conversion pulling demand well ahead of current projections across the broader network analytics economy. The bear case centers on enterprise IT capex contraction or extended qualification cycles, where deferred procurement decisions compress vendor contract volume faster than premium demand can offset it across most affected operators.

Network Complexity Reshapes Vendor Priorities

Network analytics vendors sell through two increasingly distinct commercial channels: performance monitoring and traffic analysis lines feeding established mandatory network compliance and everyday operational volume across most enterprise and telecom accounts, and security analytics and autonomous intelligence work sold through direct design-win and specialty distributor channels where analytical sophistication drives adoption directly today and consistently. That split now defines vendor economics and engineering investment across the entire network analytics trade.
MARKET CONCENTRATION (CR5)46%Top five vendors hold a moderately concentrated enterprise base
AVERAGE LICENSE VALUE BANDWide enterprise tier bandAverage enterprise license contract commands a wide tier band
CHINA DEPLOYMENT SHARE24%China accounts for nearly a quarter of global deployment
AUTONOMOUS INTELLIGENCE PENETRATION8%Autonomous intelligence adoption approaches nearly a twelfth of networks
TELECOM APPLICATION SHARE45%A substantial share of demand serves telecom operator platforms
ENGINEERING TALENT COST SHARE37%Engineering talent and development sourcing consumes a substantial cost share
Operator buyers qualify autonomous intelligence lines through extensive accuracy and reliability testing before committing to purchase decisions, since a mismatched analytics configuration can drive migration to a competing vendor's platform permanently today and consistently. Legacy performance monitoring buyers care more about unit cost than analytical sophistication, a split that keeps next-generation and legacy platform adoption largely separate despite sharing similar underlying monitoring architecture.
Vendor capacity concentrates among integrated software brands who control enterprise relationships and long-term license commitments across most analytics platforms, since large operators rarely switch vendors without extensive reliability history. Operators increasingly specify certified security-accuracy compliance directly in their procurement criteria as more IT teams standardize on autonomous intelligence mandates, reshaping which vendors can compete for the fastest-growing segment.
"A telecom operator's network operations team in Shenzhen doesn't switch analytics vendors over a modest price gap once a competitor's platform has survived a full decade of continuous operation without a single security-accuracy failure, because a misdiagnosis on an active 5G core network sends most operators straight to a replacement order in a way no discount ever offsets. That reliability record is the entire retention story."
Director, Network Intelligence Software Practice · MMA Network Performance Monitoring and Intelligence Software Systems Practice · September 2026

Market Trends

Autonomous Intelligence Trend Accelerates Network Precision

Operators across China, the United States, and select allied markets increasingly deploy AI-driven autonomous network intelligence platforms, since documented adaptive analytics architecture keeps security-accuracy and root-cause-detection targets intact in a way legacy rule-based designs could never fully replicate across most enterprise channels worldwide today. This modernization trend, pioneered by leading software brands, has spread into smaller regional telecom operators faster than most vendors initially anticipated when planning engineering testing capacity and staffing levels. Vendors without established autonomous intelligence capability increasingly lose design-win contracts unavailable to better-equipped competitors across most analytics categories worldwide.
Market Impact: Adds 5 percent to demand

5G Growth Trend Lifts Security Analytics Demand

Operators facing rising security-accuracy and threat-detection mandates increasingly deploy expanded security analytics adoption, since documented behavioral-analysis architecture lets operators meet security-accuracy and threat-detection targets across most telecom and cloud platforms worldwide today and quite consistently overall indeed and reliably across most enterprise deployments and analytics categories nationwide and internationally as well. This adoption trend, pioneered by large telecom operators, has spread into smaller regional enterprise buyers faster than most vendors initially anticipated when planning engineering testing capacity. Operators without established security analytics infrastructure increasingly lose threat-detection certification unavailable to better-equipped competitors nationwide.
Market Impact: Adds 4 percent to certified adoption

Market Opportunities and Growth Drivers

5G Network Complexity Sustains Baseline Analytics Demand

Telecom operators in China continue expanding annual network infrastructure budgets that scale directly with 5G core network complexity additions regardless of vendor size or underlying analytics methodology depth across the category as a whole today and each single deployment cycle. This expansion has been uneven across regions, with East Asia and North America outpacing most other markets on 5G rollout growth and pulling network analytics demand alongside it specifically and consistently. Vendors with established enterprise distribution have captured a disproportionate share of this rollout-driven volume relative to competitors lacking comparable relationships across most analytics categories.
Market Impact: Cuts vendor margin by 4 percent

Security Compliance Standards Drive Certified Analytics Adoption

Regulators facing tightening security-accuracy and threat-detection labeling mandates increasingly stock certified security analytics and autonomous intelligence systems rather than legacy rule-based-only configurations across most telecom and enterprise channels worldwide today and quite consistently as well across most product segments, price tiers, distribution channels, and markets overall indeed. This shift has broadened from large telecom operators into smaller regional enterprise buyers faster than most vendors initially anticipated when planning compliance infrastructure. Vendors who can deliver both legacy and certified formats from the same product line increasingly win broader design contracts across multiple categories simultaneously today.
Market Impact: Cuts smaller vendor margin 3 percent

Market Restraints and Challenges

Engineering Talent Supply Friction Constrains Vendor Delivery Speed

Network analytics vendors across most product categories face persistent engineering talent supply friction, since rigorous accuracy and reliability testing requirements increasingly create schedule delay exposure across most security analytics and autonomous intelligence product cycles worldwide and across most reporting periods. The root cause is that qualified data science and network engineering talent has lagged operator volume growth faster than vendors could adapt hiring investment, leaving vendors exposed to schedule slippage that erodes contract margin sharply during periods of heightened operator procurement demand. Vendors are responding by expanding talent development agreements and pursuing shared training consortium arrangements to reduce exposure.
Market Impact: Adds 6 percent to unit demand

Thin Legacy Performance Monitoring Segment Margins Constrain Smaller Vendor Growth

Network analytics vendors across most smaller performance monitoring and traffic analysis categories face persistent thin margins, since competitive operator pricing and rising certification costs increasingly create profitability pressure across most legacy replacement programs worldwide and across most operating cycles and reporting periods. The root cause is that development capacity has lagged operator volume growth faster than smaller vendors could achieve scale efficiencies, leaving providers exposed to margin erosion during periods of rising testing backlog. Vendors are responding by consolidating engineering functions and pursuing shared testing consortium agreements to reduce this exposure somewhat consistently overall today.
Market Impact: Lifts security analytics demand 5 percent
3 additional market trends, 4 additional growth drivers, and 2 additional restraints and challenges are covered in the full report. Contact sales@marketmindsadvisory.com to access the complete intelligence.

Segment CAGR and Growth Architecture

MMA segments the market by analytics product and technology type rather than by deployment format, licensing model, or distribution basis used alone, since performance monitoring, security analytics, and autonomous intelligence buyers each purchase against distinct accuracy, detection, and reliability specifications that genuinely shape which vendors can even bid for that design contract at all today and consistently.
network-analytics-market-market-share-analysis-1789990149936

AI-Driven Autonomous Network Intelligence Platforms

AI-driven autonomous network intelligence platforms form the fastest-growing segment, expanding at 20.0 percent annually as operators in China and elsewhere increasingly deploy this category by name for its superior security-accuracy and root-cause-detection benefit over legacy rule-based designs across most direct design-win and specialty distributor channels worldwide today and quite consistently across the board and vendor base and entire analytics category today. Vendors entering this segment must add dedicated machine learning and reliability testing infrastructure capacity, a capital bar that has kept the category concentrated among larger software brands rather than small specialty providers across most segments. Pricing carries a durable premium over legacy rule-based volume, reflecting the design investment required to enter this category.
CAGR 20.0%

Network Security Analytics Platforms

Network security analytics platforms rank second at 13.0 percent CAGR, as operators increasingly specify this category by name to meet tightening security-accuracy and threat-detection mandates while maintaining design consistency across most telecom and cloud programs worldwide today and quite consistently across most product segments, price tiers, platform structures, distribution channels, production cycles, and reporting periods overall. This segment demands extensive behavioral-analysis integration depth that smaller traditional providers often cannot economically absorb, keeping the segment concentrated among larger vendors with established design integration capability and compliance testing infrastructure. Growth here tracks telecom and cloud spending closely, and vendors increasingly treat detection depth as a genuine prerequisite for retaining design contracts worldwide today.
CAGR 13.0%
Full segment breakdown across 6 segments available in the complete report.

Regional Architecture and Country Demand Map

North America leads global network analytics demand, anchored firmly in the United States' dense enterprise software vendor base, while South Asia and Pacific gains share fastest as regional network investment steadily accelerates each single passing year across allied markets nationwide and worldwide overall today indeed.

North America

North America holds the largest regional share within its band, reflecting a dense concentration of enterprise software vendors and steady 5G investment culture across the United States and Canada consistently and today. Operator relationships with Cisco's and Splunk's multi-decade platform delivery schedule anchor sustained security analytics and autonomous intelligence procurement volume that few other national markets can match in scale or vendor continuity. Canadian operators add a smaller but steady contribution tied to shared continental compliance programs. This concentration of design scale and operator relationships gives North America a durable position that regional competitors are unlikely to close within the coming decade overall, absent a major shift in operator loyalty and renewal behavior.
Share: 32% | CAGR: 11.8% (2026 to 2036)

Western Europe

Western Europe holds a moderate share among mature markets within its band, since the region carries a dense concentration of domestic telecom research, with Germany and France retaining sizable design and export capability across their national programs and industrial clusters today. Germany's and France's domestic vendor base serves both national operator demand and independent export contracts across the broader region and adjacent partner markets, reinforcing the region's strong domestic research base overall. Coordinated European security compliance initiatives increasingly favor certified security analytics systems over nationally isolated legacy rule-based-only systems, pulling incremental export volume toward vendors who can demonstrate compliance credentials convincingly across the region and surrounding partner economies overall today.
Share: 21% | CAGR: 9.5% (2026 to 2036)
Regional intelligence for 5 additional markets available in the complete report: East Asia, South Asia and Pacific, Latin America, Middle East and Africa, Eastern Europe. Contact sales@marketmindsadvisory.com.
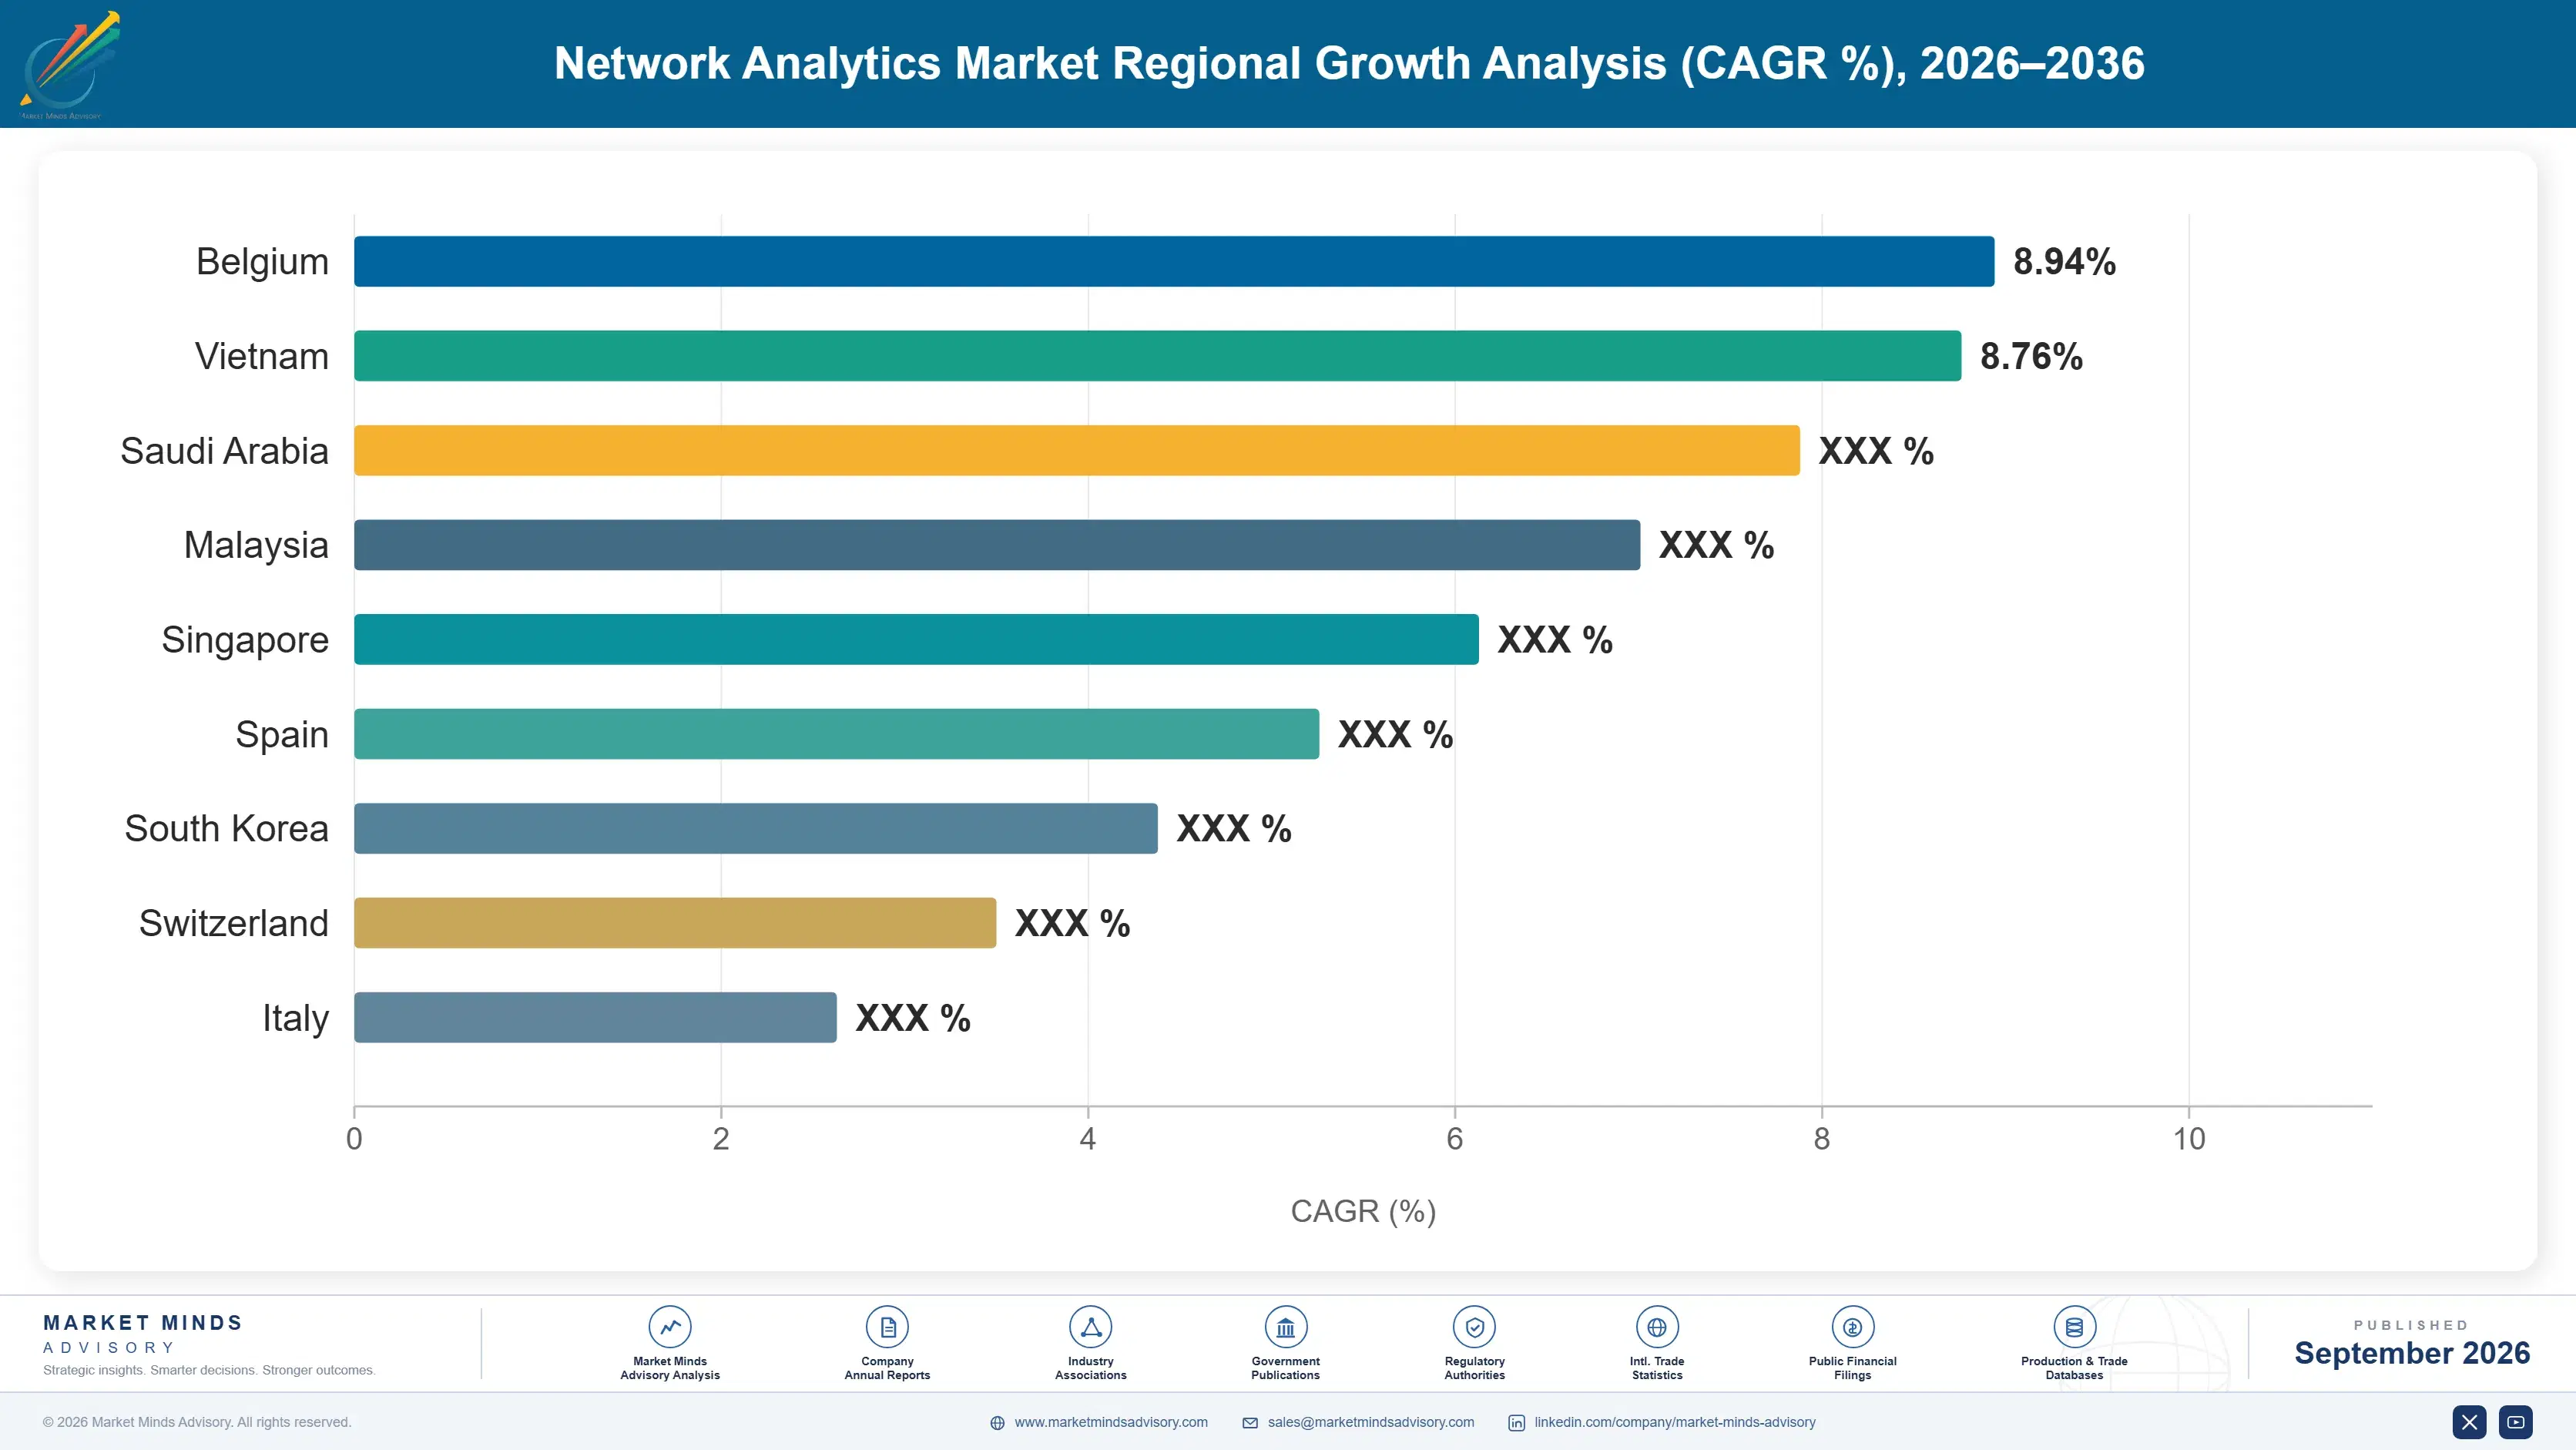
network-analytics-market-country-cagr-analysis-1789990150783

Where Analytics Vendor Value Concentrates

Vendors capture the widest operator volume by building autonomous intelligence and certification capability rather than competing on unit price alone, since analytical depth, certification breadth, operator relationships, and engineering infrastructure each defend margin economics far more durably than pure price competition ever could across the entire network analytics industry worldwide today, consistently, and reliably.

Autonomous Intelligence Platform Capability Investment Program

Vendors that invest in autonomous network intelligence platform infrastructure can capture premium operator volume commanding rates often exceeding 33 percent above standard rule-based pricing per contract across major analytics segments worldwide today and quite consistently. This capability requires significant machine learning engineering and reliability testing investment that standard configuration-focused vendors cannot quickly replicate without a multi-year buildout and dedicated engineering staff. Vendors who complete this investment win premium autonomous intelligence contracts that standard competitors cannot even bid for, since operators increasingly specify verified security-accuracy certification as a baseline requirement rather than merely an optional upgrade at all today.
Market Impact: Commands 33 percent premium rate per contract sold

Advanced Security Accuracy Certification Infrastructure Buildout Program

Vendors that complete security-accuracy and reliability certification infrastructure win broader operator mandates spanning multiple platform tiers rather than losing that fast-growing business entirely to already-qualified certification-focused competitors across most worldwide distribution channels today and quite consistently overall indeed and reliably. This capability requires sustained testing and engineering investment that smaller providers cannot quickly replicate at scale. Roughly 16 percent of new operator mandates now specify enhanced security-accuracy certification capacity as a hard qualification requirement rather than accepting standard legacy-only terms for any meaningful share of the segment at all today.
Market Impact: Secures 16 percent of new operator contract volume

Long Term Operator Design Win Pricing Agreements

Vendors that negotiate long-term operator design-win agreements with pricing tied to a benchmark formula rather than pure spot negotiation each deployment cycle insulate roughly 26 percent of their entire distribution volume from the price compression that periodically squeezes industry-wide margin economics across the entire network analytics sector each single deployment cycle. This approach costs more during periods of abundant vendor negotiating position, since fixed-formula pricing misses out on higher spot rates, but it dramatically smooths cycle-to-cycle demand volatility that vendors expect their finance teams to absorb without renegotiating terms mid-contract at any point.
Market Impact: Stabilizes operator contract revenue within a 4 point band

Cross Border Operator Distribution Expansion Program

Vendors that build direct relationships with allied regional operators capture a disproportionate share of the market's fastest-growing autonomous intelligence demand, since operators increasingly prefer vendors who can guarantee consistent security accuracy and lifecycle support across multiple product platforms simultaneously for cost and reliability reasons specifically. This relationship building requires meaningful cross-border distribution investment and dedicated multi-market design capability, but vendors who complete it early gain preferred-partner status on multi-year allied relationships later entrants find difficult to displace. Roughly 8 percent of new worldwide operator procurement now targets this cross-border relationship specifically.
Market Impact: Captures 8 percent of new cross-border operator volume

Who Controls the Margin Pool

Ranked by annual network analytics revenue, the top five vendors together hold a CR5 near 46 percent, a moderately concentrated field reflecting the industry's smaller number of vertically integrated software brands with sufficient scale to compete for operator contracts across most analytics categories worldwide. The gap between the largest vendors and smaller specialty providers is meaningful, since building comparable platform capacity and operator relationships requires years of sustained investment.
Competitive activity currently plays out along three dimensions: autonomous intelligence platform breadth, since vendors with dedicated machine learning engineering capture premium operator contracts unavailable to standard configuration-focused competitors; security-accuracy certification depth, as vendors holding broader compliance infrastructure win wider operator mandates; and operator relationship footprint, particularly access to major 5G and cloud programs worldwide.

Emerging pressure comes from specialized Chinese analytics vendors expanding cross-border and export distribution capacity to compete directly with established brands on performance monitoring and legacy rule-based-only segments previously reserved for longer-established vendors. Rankings could shift within a decade if these entrants close the autonomous intelligence and operator relationship gap fast enough to win contracts currently reserved for brands with deeper systems integrator partnerships and distribution networks.
network-analytics-market-company-positioning-matrix-1789990151651

Competitive Moat and Risk Dimensions

CISCO SYSTEMS

Moat: Operator Relationship Breadth

Cisco has built one of the industry's broadest proprietary analytics testing and certification relationship portfolios across decades of investment spanning performance monitoring, security analytics, and autonomous intelligence lines, giving it relationships across more operator segments than narrower competitors typically maintain. That depth lets it win premium contracts smaller competitors confined to a single category cannot match.
CISCO SYSTEMS

Risk: Discretionary IT Capex Exposure

Heavy reliance on discretionary enterprise IT infrastructure capital expenditure budgets leaves the company more exposed than diversified competitors to program deferral and budget contraction, where a shift in operator capex priorities could compress a meaningful share of contracted distribution revenue across future planning cycles and reporting periods industry wide.
BROADCOM (VMWARE)

Moat: Design Certification Integration Depth

Broadcom has built one of the industry's deepest vertically integrated analytics design and virtualization platform operations across decades of investment spanning upstream engineering sourcing relationships and downstream operator distribution formulation, giving it customer relationships across more operator types than narrower competitors typically maintain. That depth lets it win premium cross-category contracts smaller competitors cannot match.
BROADCOM (VMWARE)

Risk: Legacy Contract Renewal Dependency Exposure

Heavy reliance on legacy contract renewal cycles leaves the company more exposed than pure intelligence-focused competitors to slower operator capital cycles, where a shift in operator upgrade timing could compress a meaningful share of contracted revenue across future planning cycles, reporting periods, and platform generations industry wide.

Players Tracked

Prominent Players

Cisco Systems
Broadcom (VMware)
Splunk
SolarWinds
Datadog

Other Key Players

NETSCOUT Systems
Riverbed Technology
ExtraHop Networks
Kentik
Nokia
Ericsson
Juniper Networks
Huawei Technologies
IBM
Micro Focus (OpenText)
Zabbix
ManageEngine (Zoho)
Paessler (PRTG)
Auvik Networks
Statseeker

Recent Developments

FEBRUARY 2026

Cisco Systems Expands Autonomous Intelligence Production Line

Cisco Systems expanded its autonomous network intelligence platform production line with several additional testing facilities, adding new analytics tools and faster deployment capability for operator distribution programs, aiming to strengthen retention among premium 5G programs facing intensifying competition from specialized regional vendors today and going forward.
Signal: Signals continued vendor investment in autonomous intelligence as operator competition intensifies across programs and markets today.
OCTOBER 2025

Broadcom Expands Operator Integration Agreement

Broadcom signed an expanded operator integration agreement with several US and European telecom providers, extending security-accuracy certification capacity and testing support benefits to enterprise and cloud programs across a broader range of product categories, aiming to capture rising analytics demand ahead of continued regulatory reform across major markets.
Signal: Reflects accelerating vendor investment in security-accuracy certification as demand and competition intensify across major global markets.
MAY 2025

Splunk Launches Digital Compliance Diagnostics Platform

Splunk launched a new digital compliance diagnostics platform within its analytics division, allowing eligible operators to obtain instant certification status and full warranty documentation directly through its online portal, targeting operator distribution programs across the entire analytics network directly, consistently, effectively, and reliably overall today.
Signal: Indicates continued vendor expansion into digital diagnostics as operator competition deepens further across the entire sector.

Engineering Talent And Development Costs

Specialized data science talent, network engineering expertise, and testing infrastructure, sourced primarily from a small number of qualified talent pools across North America and East Asia, account for roughly 37 percent of vendor operating cost today across most security analytics and autonomous intelligence programs worldwide and across most reporting cycles. Most vendors source this talent through established multi-year employment and contractor agreements rather than open market hiring.
The US Bureau of Labor Statistics' 2024 technology talent cost survey noted that data science and network engineering salaries rose meaningfully across several quarters as talent pool capacity tightened and hiring extended lead times, pushing vendor costs up more than 10 percent within a year across network analytics operations. Vendors without diversified talent pipelines absorbed most of that increase, while vendors holding multi-year agreements passed only a portion through to operators.

Vendors without diversified talent sourcing pipelines or long-term agreements face a persistent cost disadvantage against larger integrated competitors, since reliance on annual open market hiring alone exposes them fully to talent allocation swings that contracted competitors largely avoid. This falls hardest on smaller specialty providers, while larger brands with multi-year agreements maintain comparatively stable operating costs.
network-analytics-market-cost-volatility-analysis-1789990152020

Diversified Talent Pipeline Sourcing Strategy

Vendors are increasingly diversifying data science and engineering talent relationships across multiple qualified sourcing channels rather than relying entirely on a single dominant talent pool for critical development capacity today. This approach typically incorporates layered hiring agreements alongside allocation reservation arrangements, improving talent cost predictability, giving vendors a defensible basis for offering more competitive pricing terms overall.

Long Term Talent Agreements With Fixed Allocation

Maintaining long-term talent supply agreements with sourcing partners across North America and East Asia protects vendors against localized talent disruption or salary spikes tied to a single pool's capacity constraints and hiring delays. While diversification adds modest administrative overhead, it meaningfully reduces the odds of a talent shortfall tied to a single source's limitations.

Talent Cost Hedging Through Development Standardization

Some larger vendors are hedging talent cost exposure through development standardization and allocation reservation timing strategies, locking in a defined talent cost band well ahead of production planning rather than exposing operations to spot talent pricing volatility across most reporting periods and development cycles. This requires sophisticated workforce forecasting capability that smaller vendors often lack.

Portfolio Architecture for Margin Defence

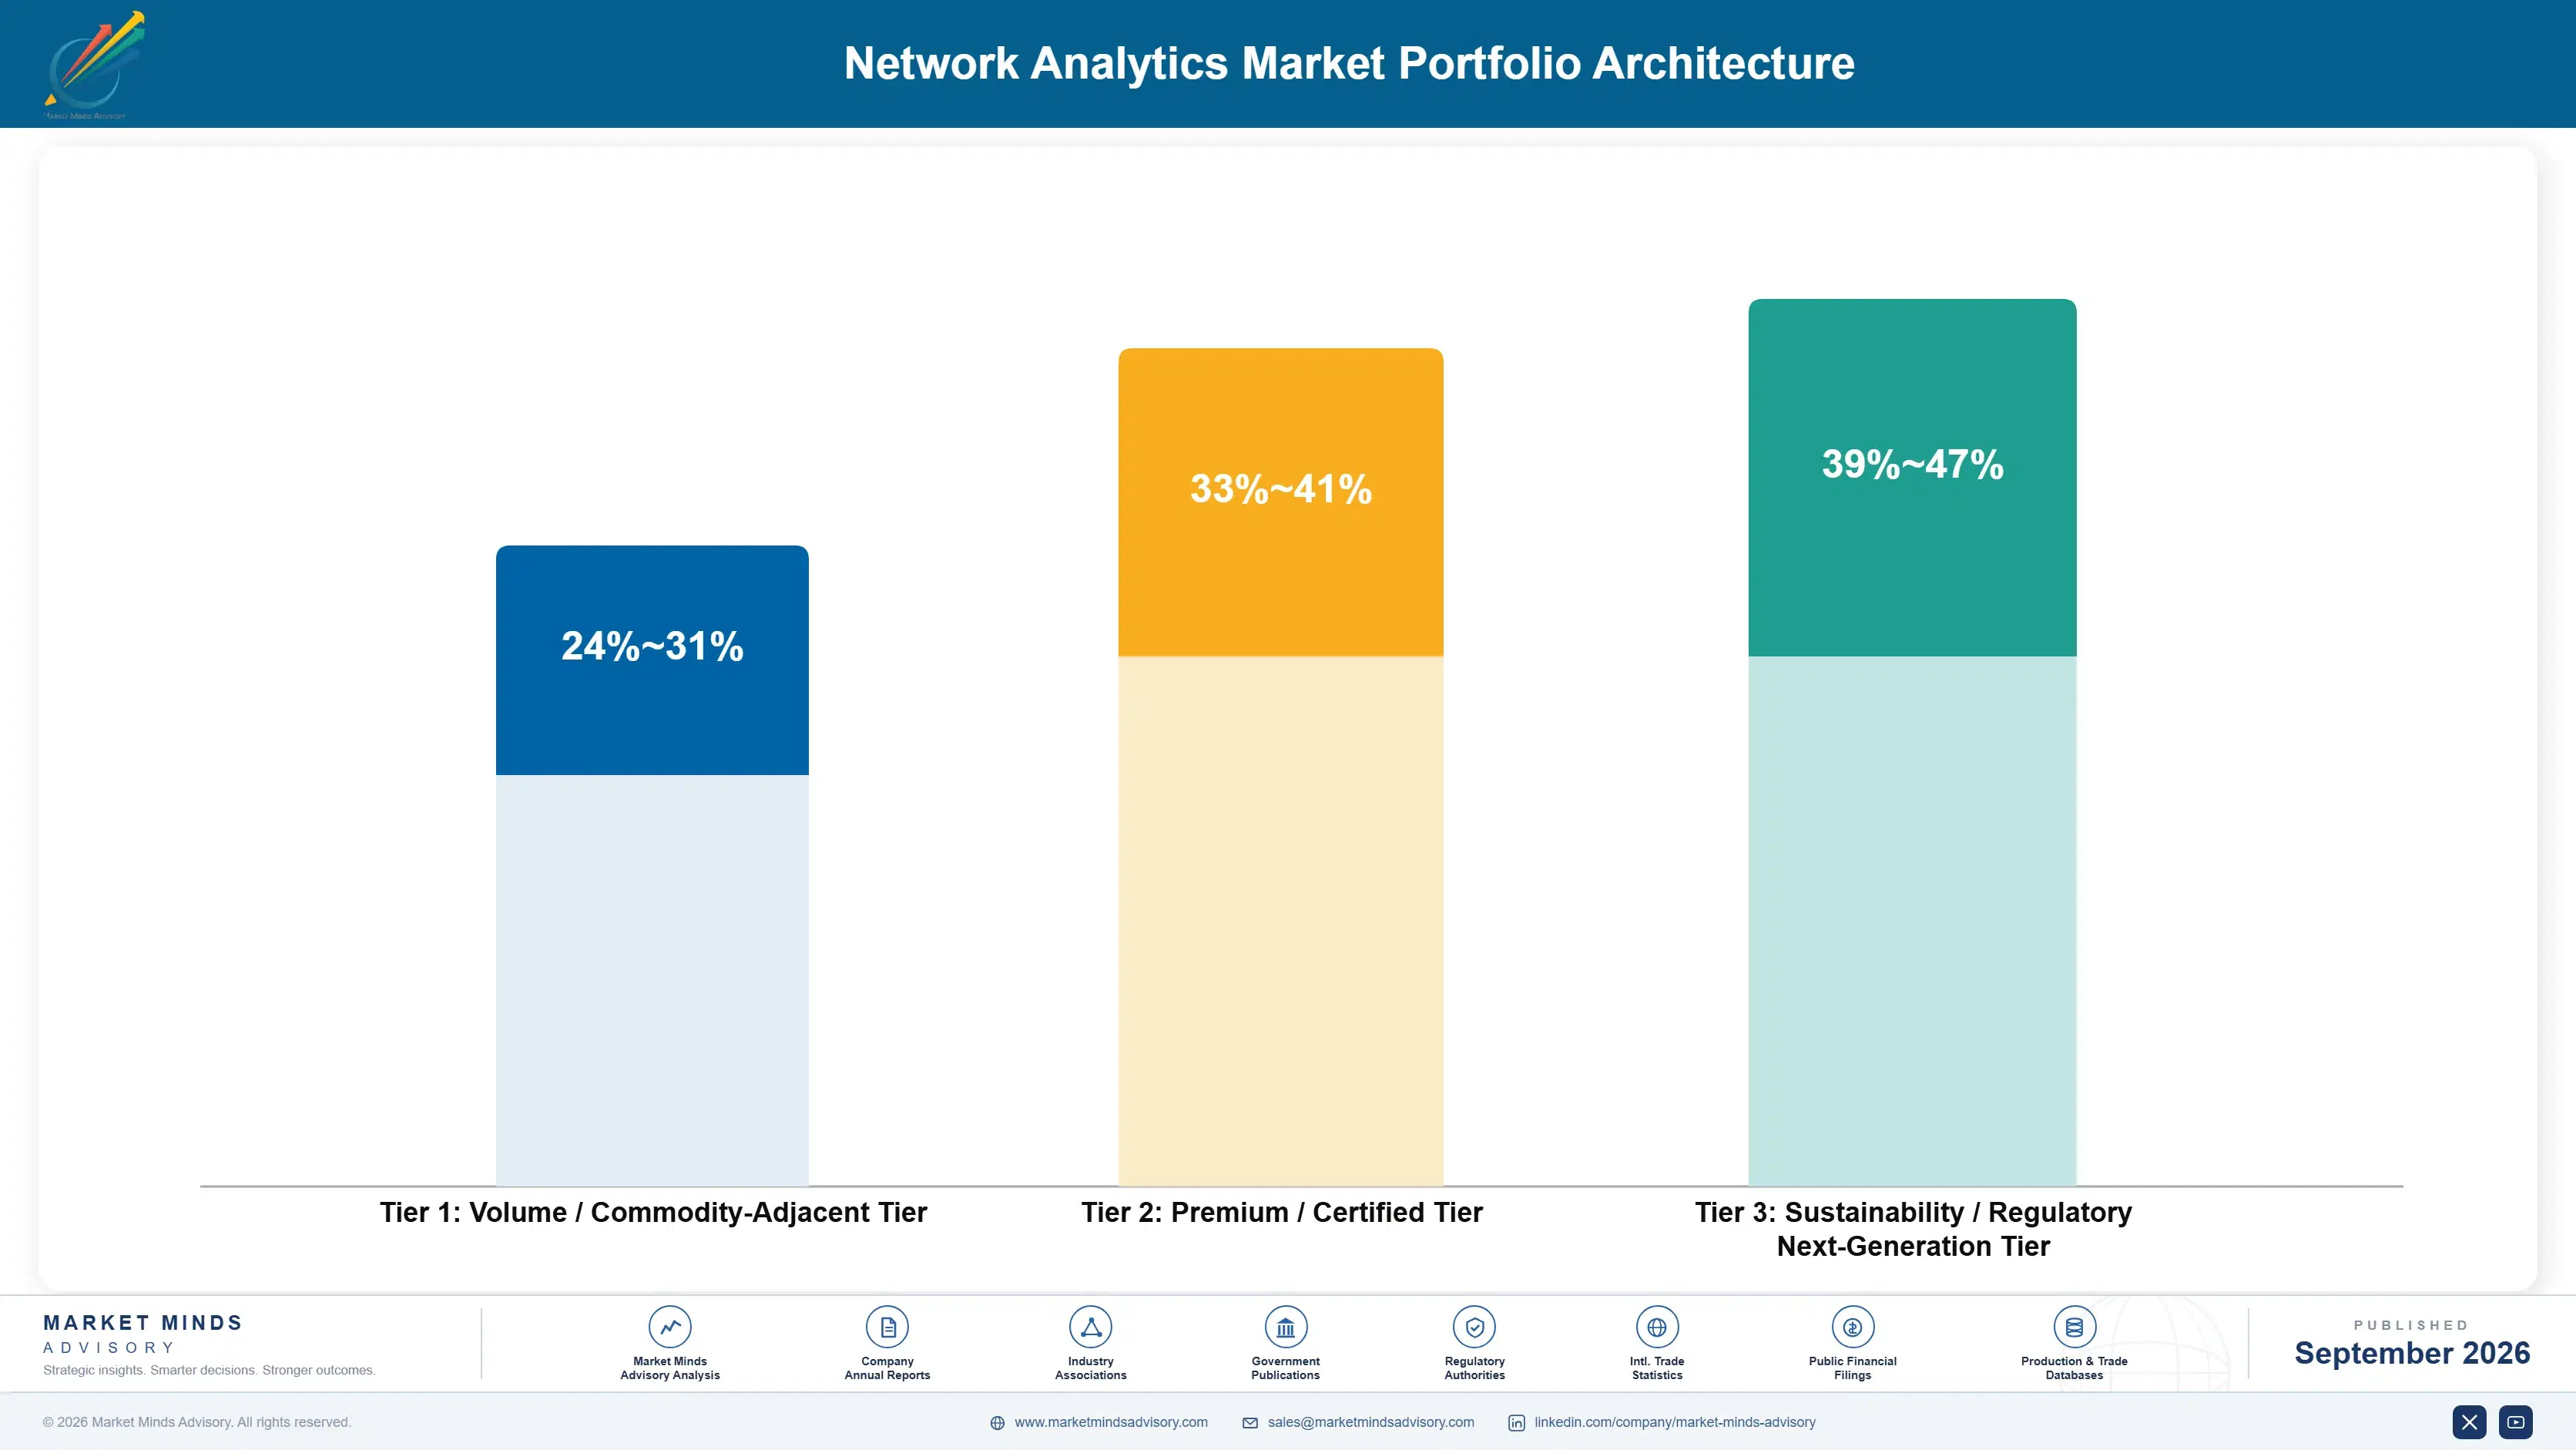
Network analytics portfolio splits into three margin tiers that track analytical and detection sophistication rather than unit volume alone. Standard performance monitoring and traffic analysis lines serving mass-market operator demand compete largely on unit price, while certified security analytics grade earns a durable premium, and next-generation autonomous intelligence grade with advanced analytics infrastructure commands the highest margins within the entire category overall today.
The tension between volume and premium tiers plays out in autonomous intelligence investment decisions, since building certification capability sacrifices some near-term legacy-tier throughput focus for a considerably higher, more durable margin later across the entire network analytics operation and product line. Vendors that hesitate to build that capability risk ceding the fastest-growing, highest-margin autonomous intelligence and security analytics segments to competitors willing to invest in design depth first.

High-value margin pools concentrate almost entirely in autonomous intelligence grade, where analytics integration and detection technology barriers keep casual entrants out far longer than in any other tier of the entire category structure overall today. Security analytics grade sits in between, commanding a moderate premium tied to certification depth rather than processing difficulty, while standard performance monitoring volume remains price-competitive regardless of vendor scale or delivery footprint.

Volume / Commodity-Adjacent Tier

Standard performance monitoring and traffic analysis products sold into mainstream operator demand across most distribution tiers, priced largely on license formulas against competing vendors with minimal quality differentiation between products or vendors overall.
Gross Margin: 24%-31%

Premium / Certified Tier

Certified security analytics grade carrying security-accuracy and audit compliance documentation that commands a durable premium over standard grade across moderate-tier operator channels specifically and consistently overall today, indeed, and quite reliably.
Gross Margin: 33%-41%

Sustainability / Regulatory / Next-Generation Tier

Next-generation autonomous intelligence grade meeting the highest analytics and certification requirements for premium 5G segments, priced at a significant premium reflecting the specialized engineering investment required to produce it at scale.
Gross Margin: 39%-47%
network-analytics-market-portfolio-architecture-1789990152945

High-value Sub-segments and Strategic Watch-out

AI-Driven Autonomous Network Intelligence Platforms

AI-driven autonomous network intelligence platforms combine the fastest segment CAGR at 20.0 percent with strong achievable margins across the entire worldwide category, protected by the analytics and detection investment barrier held by vendors who invested early in dedicated integration infrastructure, certification capability, and validation engineering expertise overall.
Gross Margin: 36%-44%

Network Security Analytics Platforms

Network security analytics platforms grow at 13.0 percent and command a solid margin premium tied to certification positioning across the entire broader category, though competitive intensity is rising steadily as more vendors pursue this fast-growing certification-driven category directly across most worldwide segments and distribution structures today.
Gross Margin: 29%-36%

Performance Monitoring, Traffic Analysis, and Services

Network performance monitoring, traffic analysis, and professional services remain the volume anchor of the entire portfolio structure, growing near the overall market average each single year with thinner margins tied closely to competing vendor pricing rates across most contracts, distribution channels, and enterprise programs sold worldwide today.
Gross Margin: 20%-26%

Legacy Rule Based And Static Configuration Systems

Legacy rule-based and static configuration systems warrant a strategic watch, since persistently thin margins and rising commercial commoditization leave this legacy segment quite vulnerable to further contraction if autonomous intelligence vendors ever fully capture remaining design budget across most remaining programs worldwide going forward overall.

Why Operator Ties Outlast Cycles

Once a vendor qualifies for an operator distribution program through accuracy and reliability testing, that relationship behaves more like an annuity than a transactional sale, since switching to an alternate vendor means re-running design and quality assessment while risking a security-accuracy miscalculation that jeopardizes an entire operator relationship. Legacy performance monitoring buyers tolerate modest price adjustments from an incumbent vendor rather than restart that qualification process for marginal gains.
Stickiness varies sharply by end-use vertical. Telecom operators rarely switch vendors once security-accuracy and reliability track record accumulates, since any change risks reopening a costly re-evaluation process mid-deployment. Enterprise cloud buyers face somewhat more competition, since price sensitivity evolves faster and multiple vendors can compete for the same contract placement. Managed service providers show moderate stickiness, tied closely to design depth.

A generational shift is also underway among buyer purchasing habits. Younger network operations engineers increasingly demand digital compliance transparency and rapid deployment flexibility alongside traditional cost and reliability targets, favoring vendors who can demonstrate genuine design depth. This shift is gradual rather than abrupt, but it is steering incremental purchase volume toward vendors investing early in autonomous intelligence and certification capability across most segments worldwide.
network-analytics-market-end-use-penetration-index-1789990153801

Where MMA Sees the Advantage

These are among the four positions where our research anticipates prominent divergence between winners and laggards over the coming forecast period. Each is grounded in the demand model, the regulatory perimeter, and the announced capacity pipeline.
01 / AUTONOMOUS INTELLIGENCE STRATEGY

Build dedicated autonomous intelligence capability before rivals lock it up

Operators increasingly specify verified autonomous network intelligence platforms over standard rule-based-only configurations, and few legacy-focused vendors can quickly build the machine learning engineering and reliability testing capability this genuinely requires across the entire development chain today and consistently. Vendors who invest in autonomous intelligence manufacturing now command premium rates often exceeding 33 percent above standard grade and win operator contracts before competitors catch up on machine learning engineering depth. Waiting risks losing next-generation 5G segments entirely to vendors already deploying that capital investment, design expertise, and engineering discipline today.
02 / SECURITY ACCURACY CERTIFICATION STRATEGY

Complete security accuracy certification before it becomes a hard requirement

Operators increasingly specify enhanced security-accuracy compliance directly in their purchase mandate criteria, and roughly 16 percent of new operator mandates now treat this as a hard qualification requirement rather than an optional differentiator across most worldwide distribution channels today. Vendors who complete design investment now win broader operator mandates spanning multiple platform tiers rather than losing premium-tier business entirely to already-equipped design-focused competitors with established compliance infrastructure. Competitors without this capability risk losing entire premium categories to vendors who can prove design depth today.
03 / COMPONENT HEDGING STRATEGY

Lock in diversified talent supply pipelines before the next pricing cycle

Specialized data science and network engineering talent accounts for 37 percent of operating cost and tracks development cycles that have swung talent costs more than 10 percent within a year during periods of unexpected hiring disruption and talent allocation tightening today. Vendors still sourcing entirely through open market hiring absorb that volatility directly, while those with multi-year talent agreements lock in predictable cost well ahead of disruption events. Securing forward allocation now, before the next pricing cycle, would meaningfully reduce operating cost variability across future reporting periods.
04 / OPERATOR CHANNEL STRATEGY

Build cross border operator relationships before rivals capture the wave

Cross-border operator and allied autonomous intelligence demand continues growing faster than most other segments worldwide today, and operators increasingly prefer vendors who can guarantee consistent security accuracy and lifecycle support across multiple product platforms simultaneously for cost and reliability reasons. Vendors who build direct operator relationships now capture roughly 8 percent of new worldwide operator procurement and secure preferred-partner status before later entrants can displace them. Competitors who delay risk finding operator relationships already locked in by faster-moving rivals with established design capability and support depth.

Engagement Snapshot From the Field

A live engagement with an industry participant carrying material or product regulatory and market exposure ahead of a defining policy shift, showing how our research translates into a defensible multi-year portfolio strategy.
MARKET MINDS ADVISORY · CLIENT ENGAGEMENT SUMMARY
Network Analytics Producer Strategic Portfolio Review and Transition Roadmap 2026·Investment Scenario on Network Analytics Exposure Evaluation 2025-26
CLIENT PROFILE
The client, a mid-size regional Chinese telecom operator running legacy rule-based network analytics designs across several longstanding vendor relationships across three network operations centers, generated approximately 20 million US dollars in annual network analytics procurement spend (client-reported, unverified by MMA) and had relied exclusively on rule-based designs for well over six years without any dedicated autonomous intelligence capability developed internally at all.
STRATEGIC CHALLENGE
Facing a major 5G equipment partner's decisive shift toward certified autonomous intelligence systems as a baseline expectation among premium network compliance programs, the client risked losing its entire distribution pipeline within nine months, threatening a significant share of its future growth base, contract renewals, compliance readiness, engineering talent retention, and long-term distribution revenue overall.
MMA APPROACH
MMA benchmarked autonomous intelligence technology options across three vendors, assessing integration cost, security-accuracy certification depth, and deployment timeline for each option available today. The team modeled distribution pipeline value at risk against investment cost, and facilitated technical discussions between the client's network engineering team and two shortlisted technology vendors offering faster deployment.
KEY FINDINGS
  1. The client's legacy rule-based model put approximately 27 percent of its target distribution pipeline at direct, immediate, and irreversible risk of complete loss.
  2. One shortlisted technology vendor offered autonomous intelligence certification integration deployment roughly 18 percent faster than building similar infrastructure entirely in-house internally today and consistently.
  3. Building full autonomous intelligence capability internally would require substantial capital investment recoverable within roughly nine months given projected distribution volume forecasts provided today.
  4. Losing the distribution pipeline without autonomous intelligence capability would have eliminated the client's fastest-growing platform segment entirely, quite abruptly, and virtually overnight across every affected network operations center.
CLIENT PROFILE
The client, a mid-size regional Chinese telecom operator running legacy rule-based network analytics designs across several longstanding vendor relationships across three network operations centers, generated approximately 20 million US dollars in annual network analytics procurement spend (client-reported, unverified by MMA) and had relied exclusively on rule-based designs for well over six years without any dedicated autonomous intelligence capability developed internally at all.
STRATEGIC CHALLENGE
Facing a major 5G equipment partner's decisive shift toward certified autonomous intelligence systems as a baseline expectation among premium network compliance programs, the client risked losing its entire distribution pipeline within nine months, threatening a significant share of its future growth base, contract renewals, compliance readiness, engineering talent retention, and long-term distribution revenue overall.
MMA APPROACH
MMA benchmarked autonomous intelligence technology options across three vendors, assessing integration cost, security-accuracy certification depth, and deployment timeline for each option available today. The team modeled distribution pipeline value at risk against investment cost, and facilitated technical discussions between the client's network engineering team and two shortlisted technology vendors offering faster deployment.
KEY FINDINGS
  1. The client's legacy rule-based model put approximately 27 percent of its target distribution pipeline at direct, immediate, and irreversible risk of complete loss.
  2. One shortlisted technology vendor offered autonomous intelligence certification integration deployment roughly 18 percent faster than building similar infrastructure entirely in-house internally today and consistently.
  3. Building full autonomous intelligence capability internally would require substantial capital investment recoverable within roughly nine months given projected distribution volume forecasts provided today.
  4. Losing the distribution pipeline without autonomous intelligence capability would have eliminated the client's fastest-growing platform segment entirely, quite abruptly, and virtually overnight across every affected network operations center.
RECOMMENDED STRATEGY
Phase 1: Phase 1 (Months 1 to 2): Complete thorough technology vendor benchmarking and finalize the chosen design agreement selected in full. Phase 2: Phase 2 (Months 3 to 6): Complete full autonomous intelligence integration and security-accuracy validation work for the entire network operations center pipeline today. Phase 3: Phase 3 (Months 7 to 8): Finalize platform certification fully and begin full operator delivery immediately for all new deployments.
OUTCOME
The client completed autonomous intelligence certification within seven months, retaining its full distribution pipeline and expanding distribution revenue throughout the entire transition period. Reported new operator contract volume grew by approximately 17 percent (client-reported, unverified by MMA) within the first full year following capability completion overall.

Frequently Asked Questions

Foundational context covering the market sizes, CAGR, scope, country, region and competition that inform every finding below. This section is provided to cover basics and most often pre-purchase conversations, answered from the MMA Primary Research Dataset.

What is the current size of the Network Analytics Market?

MMA estimates this market at 5.8 billion US dollars in 2025, spanning performance monitoring, traffic analysis, security analytics, and AI-driven autonomous intelligence platforms sold to enterprise and telecom operators worldwide.

How large will the Network Analytics Market be by 2036?

MMA projects the market to reach approximately 18.28 billion US dollars by 2036, up from 6.44 billion in 2026, as autonomous intelligence adoption continues outpacing legacy rule-based demand.

What is the CAGR for the Network Analytics Market 2026 to 2036?

The base case CAGR is 11.0 percent for 2026 to 2036. Bull and bear scenarios range between 12.3 percent and 9.7 percent depending on enterprise IT capex and qualification cycle outcomes.

Which segment is growing fastest?

AI-driven autonomous network intelligence platforms form the fastest-growing segment at 20.0 percent CAGR, roughly 1.82 times the overall market rate, driven by security-accuracy and root-cause-detection demand worldwide.

Who are the major companies in the Network Analytics Market?

Leading vendors in this moderately concentrated market include Cisco Systems, Broadcom (VMware), Splunk, SolarWinds, and Datadog, together holding an estimated CR5 near 46 percent of global network analytics revenue.

Which country is growing fastest?

Within the broader region, China is the fastest-growing national market at approximately 15.5 percent CAGR, supported by its dense government-backed 5G infrastructure investment base nationwide.

Report Segmentation Architecture

The full report scope spans multiple orthogonal segmentation dimensions, with cross-tabulated demand data provided for each dimension pair. Coverage extends further to regional breakdowns, trend trajectories, and the competitive detail needed to support segment-level decision-making.

By Primary Market Dimension

  • Network Performance Monitoring Software
  • Network Traffic Analysis Software
  • Network Security Analytics Platforms
  • Network Analytics Professional Services
  • Network Capacity Planning and Optimization Software
  • AI-Driven Autonomous Network Intelligence Platforms

By End-Use Industry

  • Telecommunications and 5G Infrastructure
  • Enterprise IT and Cloud
  • Financial Services
  • Government and Public Sector

By Commercial Dimension

  • Direct Operator Design-Win Contracts
  • Specialty Distributor Channel Sales
  • Regional Distributor Channels
  • Cross-Border Export Agreements

By Region

  • North America
  • Western Europe
  • East Asia
  • South Asia and Pacific
  • Latin America
  • Middle East and Africa
  • Eastern Europe

Scope, Methodology, and Coverage

Every figure in this report is reproducible from documented input assumptions. The scope below maps the historical period, the forecast horizon, the segmentation dimensions, and the countries covered, alongside the underlying primary and qualitative methodology.
Historical Period
2020 to 2025
Forecast Period
2026 to 2036
Base Year
2025 (USD billions; MMA Primary Research Dataset, September 2026)
Market Definition
The market covers network performance monitoring software, network traffic analysis software, network security analytics platforms, network analytics professional services, network capacity planning and optimization software, and AI-driven autonomous network intelligence platforms sold to enterprise and telecom operators worldwide. It excludes general-purpose IT service management and application performance monitoring tools sold under separate commercial contracts.
Quantitative Units
USD billions (current prices); network node count for segment-level analysis
Segmentation Dimensions
By Analytics Product and Technology Type; By End-Use Industry; By Commercial Dimension; By Region
Regions Covered
North America, Western Europe, East Asia, South Asia and Pacific, Latin America, Middle East and Africa, Eastern Europe
Countries Covered
USA, China, Germany, France, UK, Japan, South Korea, India, Australia, Canada, Brazil, Mexico, Indonesia, Vietnam, Thailand, Malaysia, UAE, Saudi Arabia, South Africa, Nigeria, Turkey, Poland, Netherlands, Italy, Spain, Sweden, Switzerland, Argentina, Colombia, Singapore, and additional markets relevant to this sector
Key Companies Profiled
Cisco Systems, Broadcom (VMware), Splunk, SolarWinds, Datadog, NETSCOUT Systems, Riverbed Technology, ExtraHop Networks, Kentik, Nokia, Ericsson, Juniper Networks, Huawei Technologies, IBM, Micro Focus (OpenText), Zabbix, ManageEngine (Zoho), Paessler (PRTG), Auvik Networks, Statseeker
Quantitative Methodology
Primary survey, n=3,800 respondents, Q4 2025, six countries; demand-side model with trade association cross-validation
Qualitative Methodology
47 expert interviews, Q4 2025; applied to validate demand model assumptions, identify emerging dynamics, and assess competitive positioning
Report Format
PDF and XLSX data workbook (Word format preview document)
Publisher
Market Minds Advisory
Report Code
MMA-2026-TEC-574
Published
September 2026
Contact
sales@marketmindsadvisory.com | www.marketmindsadvisory.com

Purchase the full Network Analytics Market Report (2026 to 2036).

This report gives network analytics vendor leaders, telecom procurement strategy officers, and investment analysts a full commercial picture of the market through 2036, with China profiled as the fastest-growing national market. It covers segmentation by analytics product and technology type, all seven regional markets with detailed demand mechanisms, and a competitive assessment of twenty vendors evaluated on network analytics revenue. Readers get quantified trend, driver, and restraint analysis, engineering talent cost exposure modeling, and portfolio margin architecture across three distinct certification tiers. A dedicated revenue lever framework and anonymized case study translate the analysis into specific, actionable vendor decisions.
Twenty-vendor competitive benchmarking on network analytics revenue basis
Seven-region demand architecture with quantified growth mechanisms
Segment-level CAGR modeling across six MECE analytics product types
Engineering talent cost exposure and hedging mitigation playbook analysis
Three-tier portfolio margin architecture and certification analysis
Anonymized client case study with recommended autonomous intelligence strategy

Built For The People Who Decide

From boardroom strategy to bench-side execution, this report is read cover-to-cover by leaders shaping the next decade of their industry, turning demand scenarios, market dynamics and valuation benchmarks into decisions.
CXOs/ Presidents/ VPs/ Managers
M&A and Corporate Development
Strategy Teams and R&D Heads
Procurement and Product Directors
Regulatory and Compliance Leaders
Investor Relations and Equity Analysts