Market Minds Advisory
Neon Gas Market

Neon Gas Market: On-tool recycling, steel-linked supply and demand that no longer tracks wafer starts, to 2036

The 2022 shortage did not just move supply to new countries. It made every fab install recycling, and nobody uninstalls a recovery system when the price comes back down again.

Lead Analyst

Bilal Shaikh

Published

September 2026

Make Smarter Decisions with Customized Research Insights

Request a free sample report and evaluate market opportunities, growth trends, and competitive dynamics relevant to your business needs.

2025 MARKET VALUE$0.4BMarket Size 2025
2036 FORECAST VALUE$0.8BBase Case , 2026 to 2036
CAGR 2026 TO 20365.6 %Bull 6.8% / Bear 4.4%
INCREMENTAL OPPORTUNITY$0.3BNet 10- year value creation
EXPANSION MULTIPLE1.72x2036 value over 2026 base
Strategic Levers
M&A Pipeline
Regional Outlook
Country Rankings
Competitive Intelligence
Segmental Deep-dive
Call-Us : 91 93563 13602

Executive Snapshot and Market Trajectory

The 2022 supply shock pushed neon above twelve times its previous price and changed both sides of this market permanently. Supply moved out of Ukraine into China and Korea. Demand fell, because every fab fitted recycling, and recovery systems do not get removed when prices normalise. Both changes are permanent.
On-tool recovery now runs near 87% across installed lithography scanners, which means neon consumption grows well below wafer output rather than alongside it. Most forecasting still extrapolates from wafer starts and is wrong by a wide margin. East Asia holds 40% of value because the fabs are there. Lithography takes 68% of volume. Extreme ultraviolet tools use none of it at all. Recycling equipment stays fitted regardless of price.
Cryogenic refrigeration compounds at 8.4%, half again the market rate of 5.6%, serving superconducting and hydrogen liquefaction duty in a temperature range where nothing else works well. The long-run supply question is steel: roughly 74% of neon comes from air separation units attached to blast furnace plants that decarbonisation will eventually retire. That population shrinks as electric arc and hydrogen routes take over. No replacement extraction route has been funded, and standalone recovery costs more.
Market Definition
This report covers neon supplied in purified commercial grades, spanning semiconductor deep ultraviolet lithography, excimer laser medical systems, industrial laser and marking, lighting signage and display, cryogenic refrigeration, and analytical and calibration mixtures. Value is measured at producer level on cubic metres of purified neon supplied, including recovered material re-entering commercial sale. Excluded are crude neon-helium mixtures traded between processors before purification, other rare gases including krypton and xenon, helium in all grades, and gas handling equipment or recycling systems sold as hardware.
Base Year Value
$0.4B in 2025 (MMA Primary Research Dataset, August 2026)
Forecast Period
2026 to 2036, eleven discrete annual values
CAGR
5.6% base case. Bull 6.8%. Bear 4.4%.
Fastest Growth Segment
Cryogenic Refrigeration: 8.4% CAGR
Fastest Growth Country
China: 8.4% CAGR
Fastest Growth Region
South Asia and Pacific: 7.6% CAGR
Largest Region
East Asia: 40% of 2025 global value
Market Leaders
Linde, Air Liquide, Messer Group, Air Products and Chemicals and TEMC lead the market. Source: MMA Primary Research Dataset, July 2026.
Primary Survey
n=3,800 procurement and R&D decision-makers, Q4 2025, six countries
Methodology
Demand-side build-up, cross-validated against public data, 47 expert interviews

Neon Gas Market Forecast Scenarios

neon-gas-market-trends-size-forecast-scenario-1787555912260
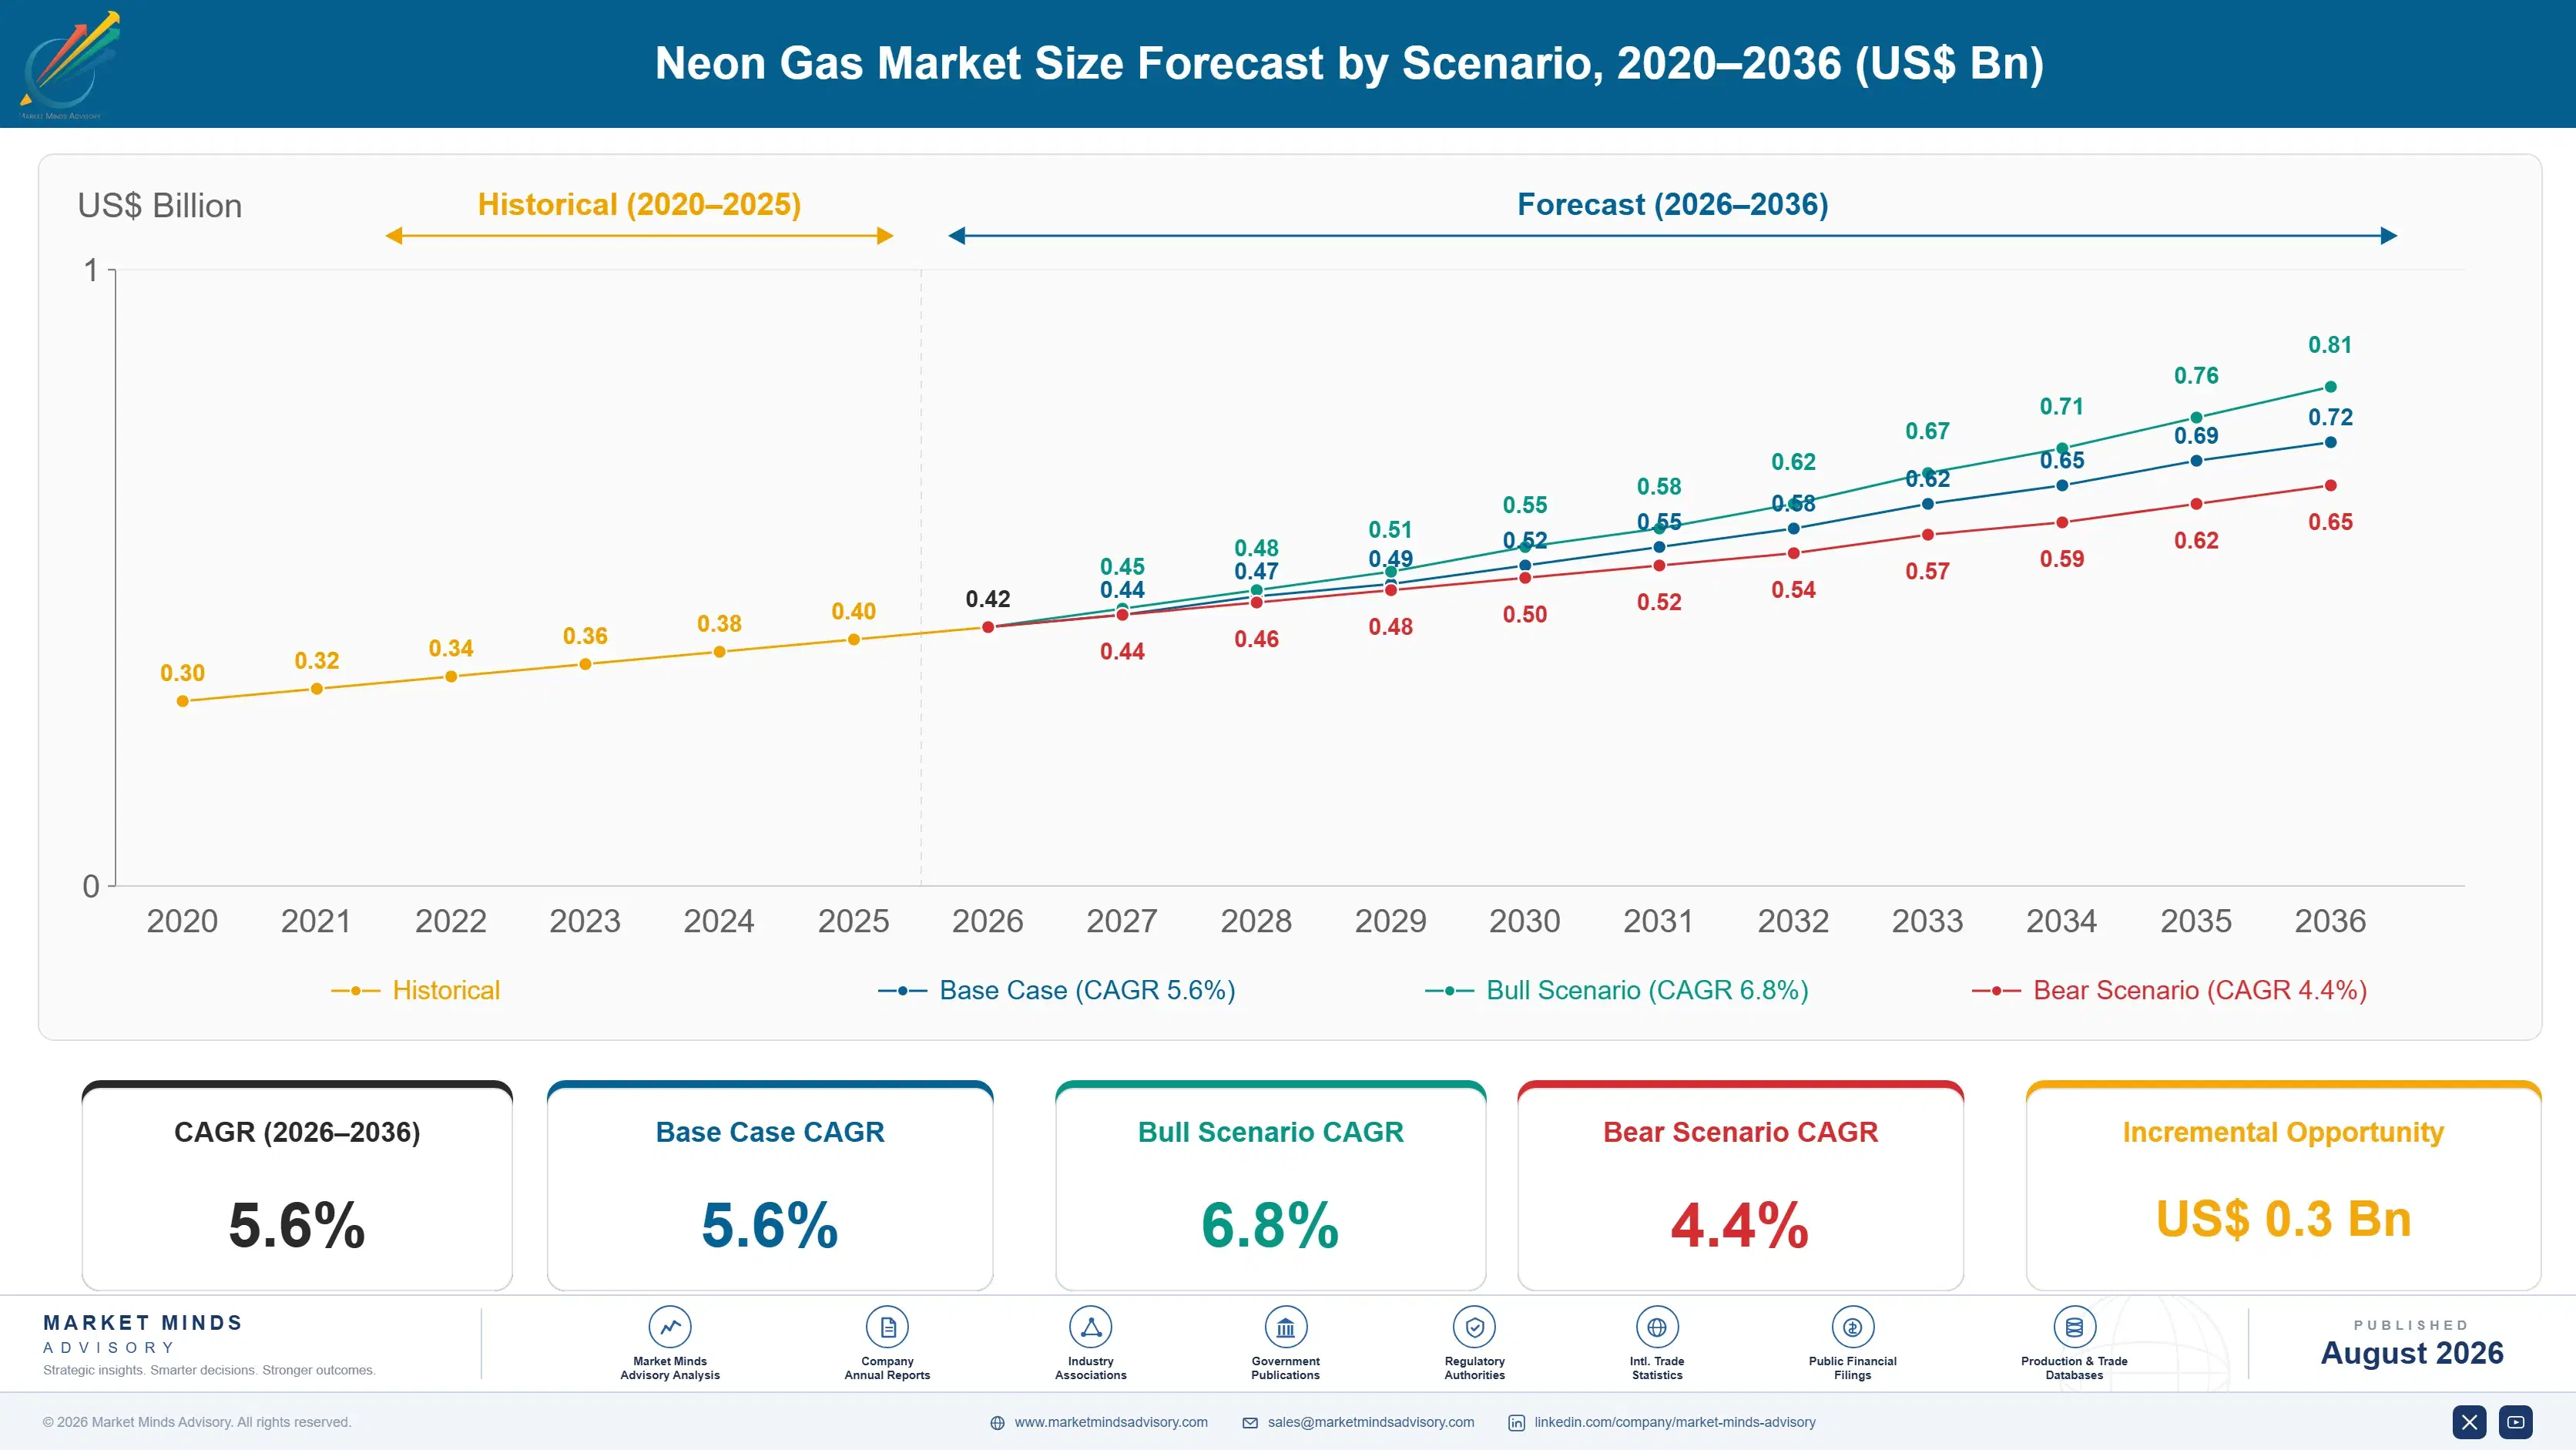
The 2020 to 2025 period produced a 4.4% growth rate that describes almost nothing useful about what happened. Prices rose above twelve times their previous level when Ukrainian supply stopped, then collapsed below the starting point as Chinese and Korean capacity arrived and fabs cut consumption through recycling. Volume and value moved in opposite directions for much of it.
The 5.6% base case rests on three mechanisms. Chinese mature-node fab construction, which is deep ultraviolet lithography rather than extreme ultraviolet and therefore consumes neon, with country growth at 8.4% leading the market. Cryogenic refrigeration at 8.4% on superconducting and hydrogen liquefaction duty. And excimer laser medical systems, where vision correction volumes keep expanding across Asian markets steadily. Recovery-adjusted demand rather than wafer output is the correct base for all three.
The 6.8% bull case is deep ultraviolet capacity expanding faster than expected as mature-node demand holds and extreme ultraviolet stays confined to leading-edge logic. The 4.4% bear case is steel decarbonisation retiring the very large air separation units that neon extraction depends on, tightening supply against demand already suppressed by recycling. Standalone extraction costs considerably more per cubic metre than by-product capture.

The Shortage That Shrank Demand

When Ukrainian production stopped in 2022, neon prices rose above twelve times their previous level and the semiconductor industry responded on two fronts at once. Purchasing teams qualified Chinese, Korean and American supply as fast as anyone would sell it. Engineering teams fitted on-tool recycling to excimer laser sources, recovering neon from the gas cabinet instead of venting it. Both responses worked. Prices then fell below where they had started, which surprised almost everybody who had extrapolated the shortage forward.
TOP-FIVE CONCENTRATION62%Combined position across purified supply held by the leading producers
ATMOSPHERIC CONCENTRATION18.2 ppmParts of neon present in ordinary atmospheric air
ON-TOOL RECOVERY RATE87%Portion recaptured by recycling systems fitted to lithography scanners
LITHOGRAPHY APPLICATION SHARE68%Share of volume consumed inside deep ultraviolet laser sources
STEEL-LINKED SUPPLY SHARE74%Portion extracted from air separation units serving steel plants
PEAK PRICE MULTIPLE12xRise above the pre-disruption level during the supply shock
The second response is the one that matters now, because it is permanent. Recovery systems fitted during a crisis stay fitted, and on-tool recapture runs near 87% across the installed scanner base. Neon consumption per wafer therefore fell by roughly the same proportion and will not go back. Forecasts built from wafer start projections overstate this market substantially, and a good many of them still exist.
Supply carries its own quiet dependency. Neon is 18.2 parts per million of air, so extracting it economically requires processing enormous volumes, which only happens where a steel plant already needs the oxygen. Around 74% of supply comes from those units.
"Everyone learned the wrong lesson from 2022. The story was not that supply was concentrated in one country. It was that a gas nobody had bothered to recover suddenly got recovered at eighty seven per cent, and the demand curve moved down a step that it is never coming back up."
Principal, Industrial and Electronic Gases Practice · MMA Chemicals and Materials Practice · August 2026

Market Trends

On-tool recycling permanently lowers consumption per wafer

Excimer laser recycling systems fitted across the installed scanner base during the 2022 shortage now recover close to 87% of neon from the gas cabinet rather than venting it. That equipment stays installed regardless of price, because removing it saves nothing and reintroduces exposure nobody wants twice. Neon consumption per wafer therefore stepped down and stayed down. Commercially this decouples demand from wafer output entirely, and suppliers who size capacity against semiconductor production forecasts are building against a relationship that no longer holds at all. The price collapse after 2022 already demonstrated this plainly.
Market Impact: Chinese demand compounds at 8.4%
Deep ultraviolet capacity grows while leading edge moves away

Extreme ultraviolet lithography uses tin plasma and hydrogen rather than neon, so every leading-edge layer migrating to it removes neon intensity from the most advanced fabs. Deep ultraviolet meanwhile keeps expanding through mature-node construction, particularly across China where country growth at 8.4% leads this market and the capacity being built is almost entirely deep ultraviolet. Commercially this splits demand geographically: the most advanced fabs consume less neon each year while the fastest-growing capacity consumes more, and the net depends on which builds faster. Chinese construction is currently winning that arithmetic comfortably.
Market Impact: Segment compounds at 8.4% annually

Market Opportunities and Growth Drivers

Chinese mature-node construction consumes deep ultraviolet neon

Chinese fab construction has concentrated on mature and mid-range nodes where deep ultraviolet lithography is the only option available, and that capacity consumes neon in the excimer laser sources at every scanner. Country growth at 8.4% is the fastest here and it rests on capital projects already committed rather than on any forecast. Domestic Chinese neon production expanded sharply after 2022 through Baosteel, Hangyang and others, which means the demand growth and the supply growth are occurring inside the same country simultaneously. That insulates the Chinese market from external disruption almost entirely.
Market Impact: Supplies 74% from steel-linked units

Cryogenic duty grows with superconducting and hydrogen systems

Neon liquefies around 27 kelvin, filling a temperature range between liquid nitrogen and liquid helium where superconducting magnets, quantum computing hardware and hydrogen liquefaction pre-cooling all need refrigeration. Growth at 8.4% is the fastest application in this market, though the absolute volumes remain small against lithography. Helium supply volatility has pushed several system designers toward neon where the temperature permits it. Closed-cycle systems mean the gas is largely retained rather than consumed, so growth follows installed systems rather than operating hours. Purity and handling requirements keep pricing above bulk semiconductor grades.
Market Impact: Prices fell below 2021 levels

Market Restraints and Challenges

Steel decarbonisation threatens the air separation units supplying neon

Roughly 74% of neon comes from very large air separation units built to supply oxygen to blast furnace steel plants, because recovering a gas present at 18.2 parts per million only pays where enormous air volumes are already being processed. The root cause is atmospheric chemistry rather than any commercial choice. As integrated steelmaking gives way to electric arc and hydrogen direct reduction routes, that unit population shrinks. Producers are evaluating dedicated recovery and standalone extraction, both of which cost considerably more per cubic metre than by-product capture. Remaining unit life is now the screening criterion that matters.
Market Impact: Recovers 87% on installed tools

Price collapse discourages the capacity diversification recently built

Prices fell below pre-disruption levels once Chinese, Korean and American capacity arrived into demand already reduced by recycling, which left several producers holding investments made at crisis economics. The root cause is that supply responded to a price signal while demand responded to the same signal by shrinking, and both responses landed at once. Commercially this discourages further diversification exactly when the steel-linked supply question argues for it. Producers are seeking long-term contracts with semiconductor buyers to underwrite capacity that spot pricing cannot justify. Several producers are already operating well below design throughput.
Market Impact: Lithography holds 68% of volume
3 additional market trends, 4 additional growth drivers, and 2 additional restraints and challenges are covered in the full report. Contact sales@marketmindsadvisory.com to access the complete intelligence.

Segment CAGR and Growth Architecture

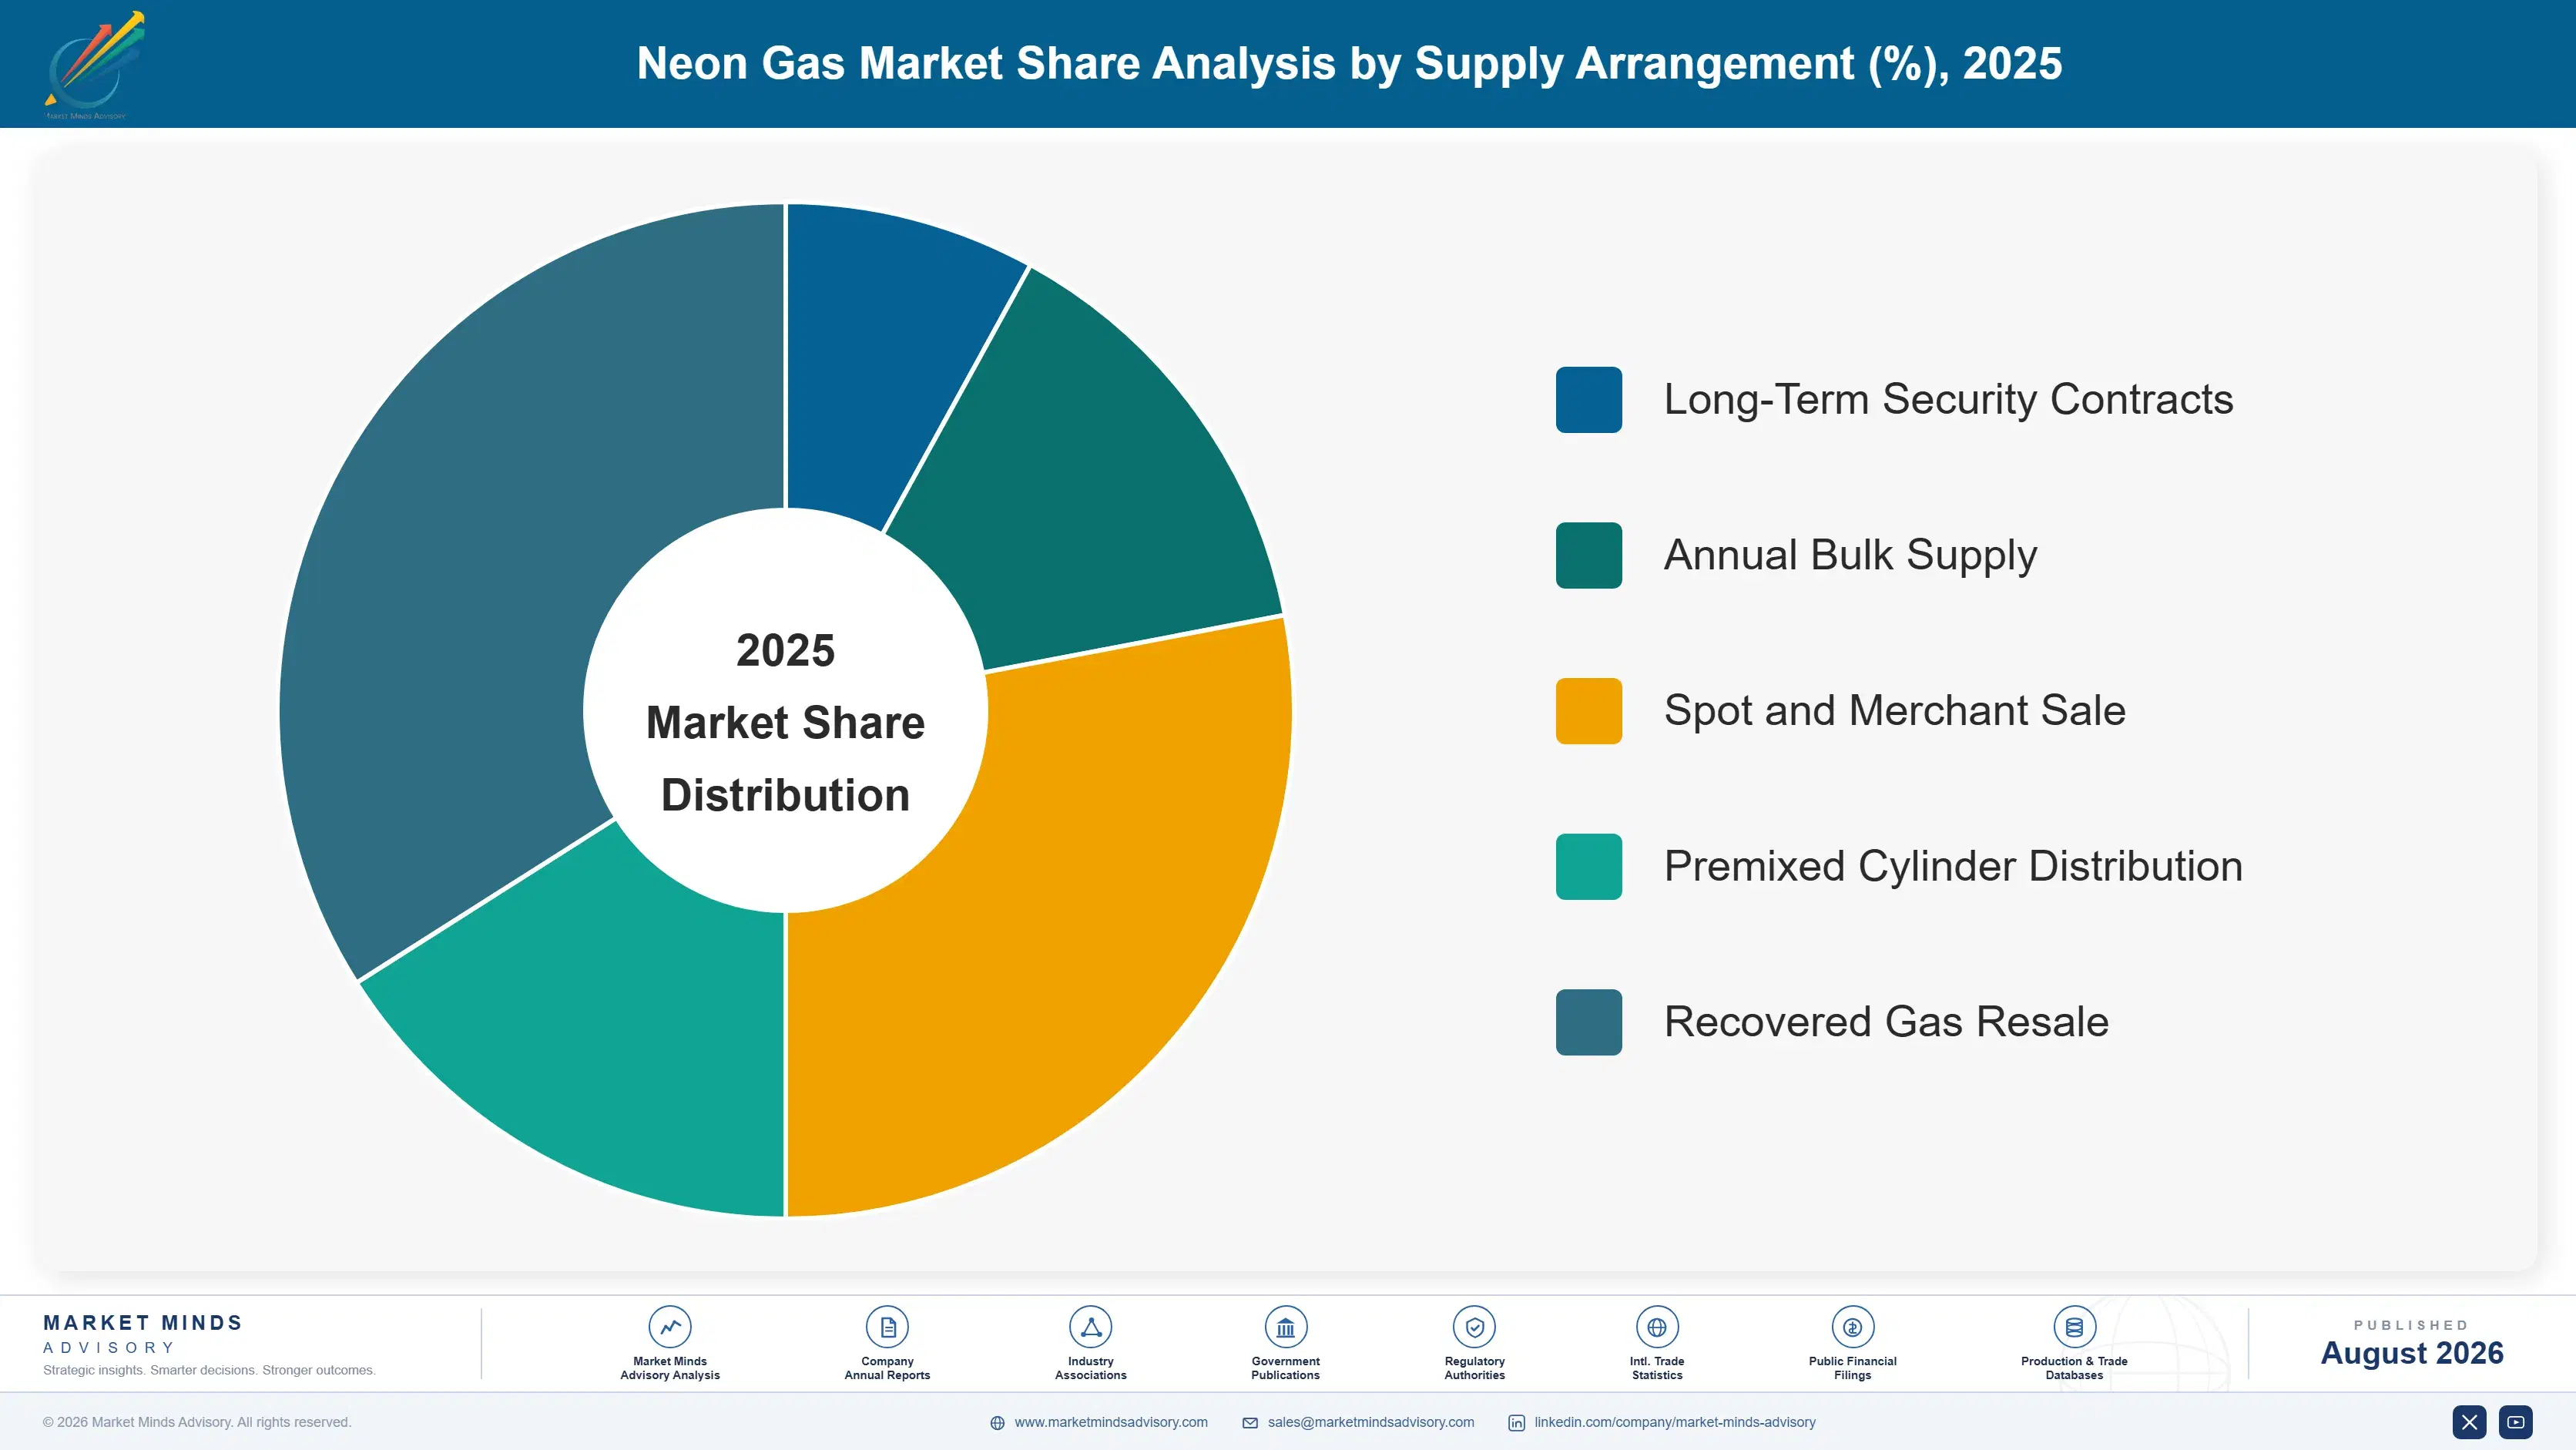
Volume is classified here by end application, since purity requirement, contract structure and price tolerance all differ sharply between a lithography scanner and a signage tube. Production route, supply arrangement and purity grade are each handled separately in the framework below, because recovered and virgin material both serve exactly the same set of applications interchangeably.
neon-gas-market-trends-market-share-analysis-1787555912792

Cryogenic Refrigeration

Growing at 8.4%, half again the market rate, neon liquefies near 27 kelvin and occupies a refrigeration range sitting between liquid nitrogen and liquid helium where superconducting magnets, quantum computing hardware and hydrogen liquefaction pre-cooling all require cooling. Helium supply volatility has pushed several system designers toward neon wherever the temperature range permits substitution. Closed-cycle designs retain rather than consume the gas, so demand follows installed system count rather than operating hours, which makes it a fill-and-top-up business. Absolute volumes stay small against lithography, and pricing runs above bulk grades because purity and handling requirements are demanding. Reaching these customers requires scientific supply channels rather than fab account management, which most semiconductor-focused producers have never built.
CAGR 8.4%

Excimer Laser Medical Systems

Vision correction, dermatological and angioplasty excimer systems use neon in argon fluoride and krypton fluoride laser mixtures, and growth at 7.4% follows procedure volumes expanding across Asian and Middle Eastern markets where disposable income and clinic density are both rising. Gas consumption per system is small and premixed cylinders rather than bulk supply are the normal format, which raises unit pricing substantially above semiconductor grades. Purity specifications are strict because laser cavity contamination degrades output rapidly. Distribution rather than production capability decides who serves this segment, since clinics buy through medical gas channels. Volumes per clinic are tiny and reorder is regular, which makes this a distribution business with gas attached rather than the reverse.
CAGR 7.4%
Full segment breakdown across 6 segments available in the complete report.

Regional Architecture and Country Demand Map

East Asia holds 40% of value because semiconductor fabrication concentrates there, well above the standard regional band and noted here as an exception. North America follows at 20% on new fab construction and cryogenic research demand together. Western Europe sits at 14% for the same reason inverted.

East Asia

At 40% this region sits well above the standard band, and the reason is simply that most of the world's semiconductor fabrication capacity is located here. Taiwanese, Korean, Japanese and Chinese fabs consume the majority of lithography neon between them. China has also become a major producer since 2022 through Baosteel, Hangyang and Suzhou Jinhong, which makes it the only large market where supply and demand growth are happening inside the same borders. Korean production through TEMC and POSCO serves domestic fabs directly. Growth at 6.6% reflects mature-node construction more than leading-edge expansion. Taiwanese demand is the most technically demanding and the most heavily recycled, since scanner recovery systems went in first there.
Share: 40% | CAGR: 6.6% (2026 to 2036)

North America

At 20% this region sits below the standard band, because fabrication capacity here is smaller than in East Asia despite substantial recent construction under domestic semiconductor policy. New fabs being built are weighted toward leading-edge logic using extreme ultraviolet lithography, which consumes no neon at all, so capacity growth translates into demand less directly than headline numbers suggest. Cryogenic research and superconducting system demand is proportionally stronger here than anywhere. Growth at 6.0% reflects a mix of deep ultraviolet layers in new fabs and expanding cryogenic applications. Crude neon recovery from domestic steel-linked air separation units is limited relative to consumption, so material arrives from Asian and European purifiers. Buyers now audit supply redundancy closely.
Share: 20% | CAGR: 6.0% (2026 to 2036)
Regional intelligence for 5 additional markets available in the complete report: Western Europe, South Asia and Pacific, Latin America, Middle East and Africa, Eastern Europe. Contact sales@marketmindsadvisory.com.
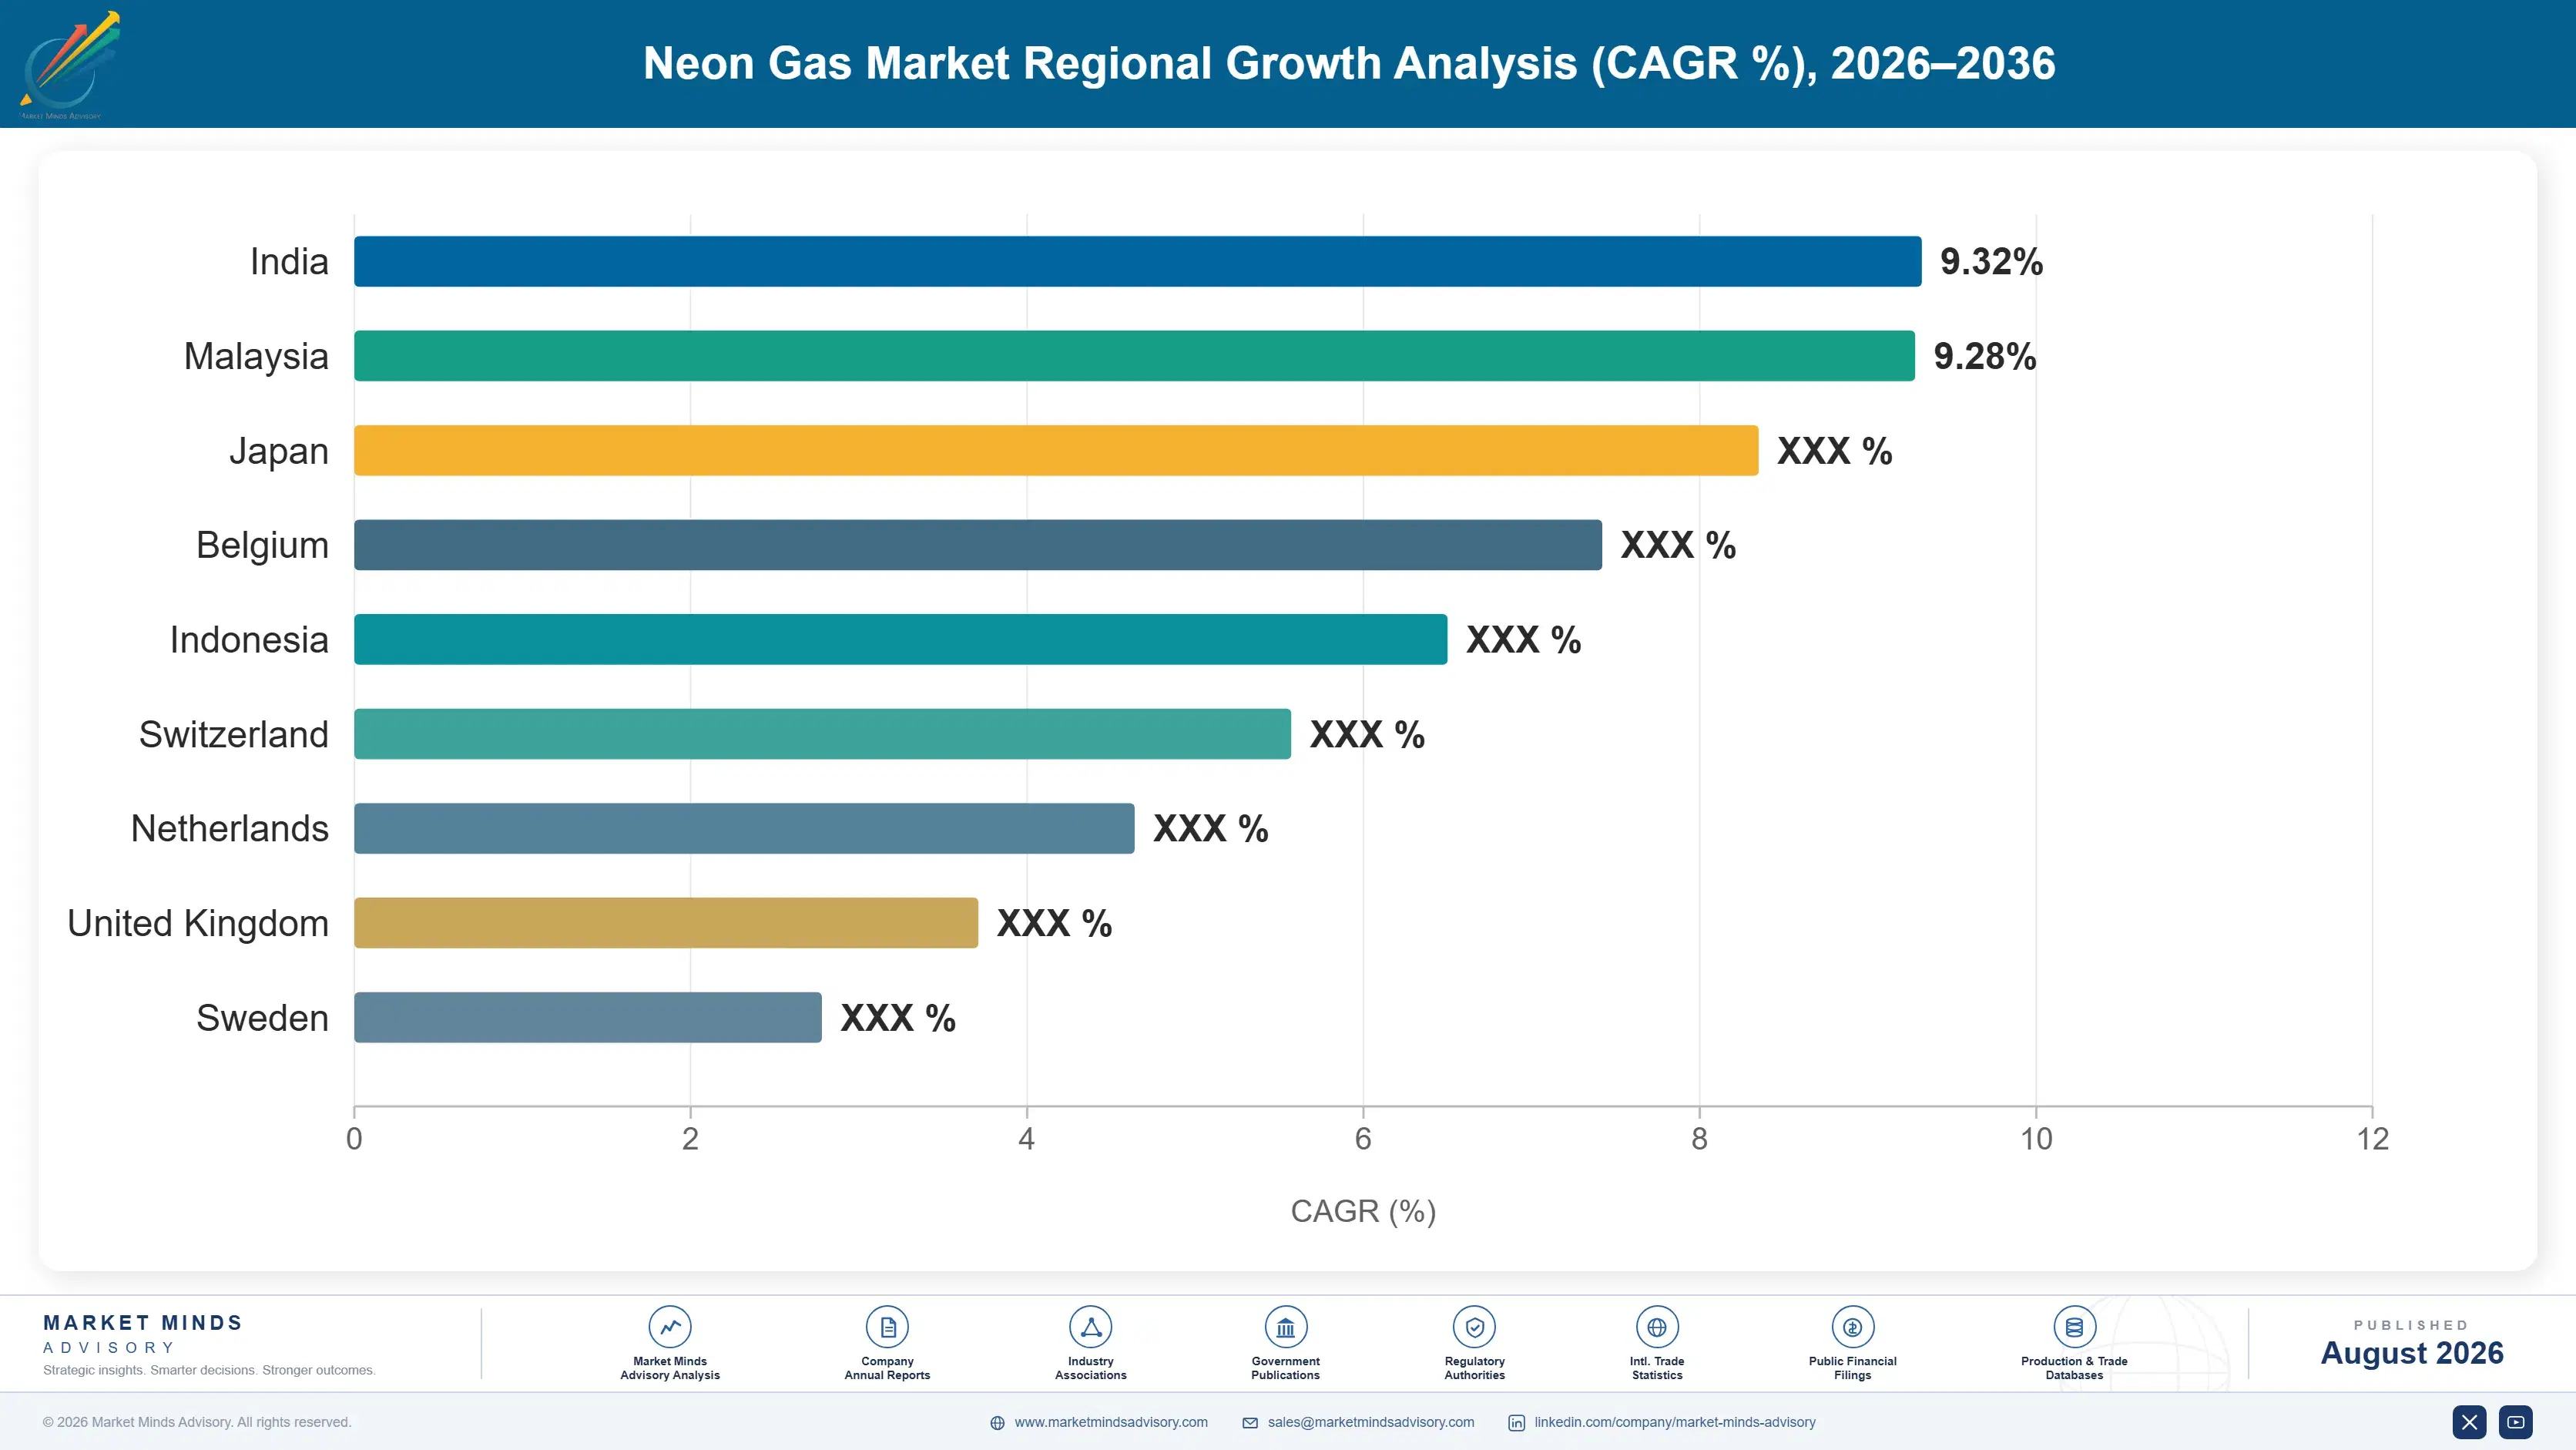
neon-gas-market-trends-country-cagr-analysis-1787555913303

Where Neon Value Now Concentrates

Four moves matter in a gas whose shortage taught its own customers to stop needing quite so much of it. Two concern demand that no longer tracks the driver everybody still models it against, and the other two concern a supply base attached to an industry that is being deliberately dismantled over coming decades.

Model demand net of on-tool recovery

On-tool recycling recovers close to 87% of neon across the installed scanner base and that equipment is never removed, because taking it out saves nothing and reintroduces exposure nobody wants to face twice. Consumption per wafer stepped down permanently. Producers sizing capacity against semiconductor wafer start forecasts are building against a relationship that stopped holding in 2022, and several already discovered that when prices collapsed below pre-disruption levels. Net demand is the only number worth planning on. Recovery-adjusted demand is the only number worth building capacity against, and it is considerably smaller.
Market Impact: Adjusts demand for an 87% on-tool recovery rate

Follow mature-node construction rather than leading edge

Extreme ultraviolet lithography uses no neon at all, so every leading-edge fab announcement generates less demand than its capital cost implies, while mature-node deep ultraviolet construction generates it at every scanner. Chinese growth at 8.4% leads this market for exactly that reason. Producers targeting the most advanced fabs are chasing capacity that consumes progressively less of what they sell. The demand is where the older technology is being installed, which is an uncomfortable message for a sales organisation to internalise. Mature-node scanners consume neon at every single tool installed. Chinese construction leads that arithmetic comfortably today.
Market Impact: Serves demand now growing at 8.4% each year

Secure crude neon ahead of blast furnace retirement

Around 74% of neon comes from air separation units built for blast furnace oxygen demand, and electric arc and hydrogen direct reduction routes will retire much of that population over the coming decades. Contracting crude neon offtake from units with long remaining life, and evaluating recovery at the largest units outside steel, protects a supply position competitors will be scrambling for later. The alternative is standalone extraction, which costs considerably more per cubic metre and nobody currently wants to fund. Screening counterparty units on remaining life rather than on delivered crude price is straightforward work that almost nobody currently performs.
Market Impact: Protects the 74% of crude tied to steel

Build cryogenic and medical channels away from semiconductors

Cryogenic refrigeration at 8.4% and excimer laser medical systems at 7.4% both grow faster than lithography and both price well above bulk semiconductor grades, because purity requirements are strict and volumes per customer are small. Neither is exposed to recycling in the way lithography is. Reaching them requires medical gas distribution and scientific supply channels rather than fab account management. Producers organised entirely around semiconductor contracts are missing the fastest and highest-margin demand available. Both segments price well above bulk grades and neither carries recycling exposure of any kind. Distribution capability rather than gas quality decides it.
Market Impact: Targets segments growing at 8.4% and 7.4% respectively

Who Controls the Margin Pool

Five producers hold 62% of purified supply, measured on cubic metres of purified neon supplied, the basis used throughout this section. Concentration follows purification capability and crude neon offtake access rather than any air separation ownership, since crude gas is frequently bought from steel-linked units the purifier does not own. The 2022 shortage brought new Chinese and Korean entrants who have kept their positions.
Competition runs on four dimensions. Crude neon offtake contracts, which determine whether a purifier has anything at all to process. Purification technology, since semiconductor grade demands impurity control at parts-per-billion levels. Geographic proximity to fabs, because cylinder logistics across long distances is expensive relative to the value moved. And contract structure, because buyers scarred by 2022 now pay for supply security rather than for the lowest available price.

Rankings shift toward Chinese and Korean producers sited next to the fabs and toward whoever secures crude offtake as blast furnace units begin retiring across Europe and elsewhere. European purification technology remains the most advanced anywhere. Buyers now dual-source almost universally, which caps how much share any single producer can realistically take from another.
neon-gas-market-trends-company-positioning-matrix-1787555913825

Competitive Moat and Risk Dimensions

LINDE

Moat: Global purification and logistics

The company operates purification capability across multiple continents alongside crude neon offtake arrangements with steel-linked air separation units, which gave it the ability to supply through the 2022 disruption when single-region producers could not. Semiconductor customers scarred by that period now pay for exactly this kind of geographic redundancy rather than for lowest delivered price.
LINDE

Risk: Crude offtake as steel changes

Roughly 74% of neon originates in air separation units built for blast furnace oxygen, and electric arc and hydrogen direct reduction steelmaking will retire much of that population. Offtake contracts do not survive the closure of the unit behind them. Producers securing long-life units or funding standalone extraction early will hold supply that incumbents assumed would always be available.
TEMC

Moat: Korean fab proximity position

The company built purification capacity in direct response to the 2022 shortage and sits alongside Korean semiconductor fabrication, which makes cylinder logistics short and supply security tangible to customers who lived through a disruption. Korean steel-linked crude access through domestic air separation supports the position without depending on imported crude gas.
TEMC

Risk: Single-market concentration and pricing

Capacity built during crisis economics now competes in a market where prices fell below pre-disruption levels, and concentration in one national fab base leaves little diversification if Korean capital spending pauses. Larger producers spread that exposure across regions and applications. Cryogenic and medical channels remain largely unserved from this position.

Players Tracked

Prominent Players

Linde
Air Liquide
Messer Group
Air Products and Chemicals
TEMC

Other Key Players

Cryoin Engineering
Iceblick
Baosteel Gases
Hangyang Group
Suzhou Jinhong Gas
Yingde Gases
POSCO
Nippon Sanso Holdings
Guangdong Huate Gas
Shandong Feiyuan Gas
Wuhan Iron and Steel Gases
SK Materials Airplus
Coregas
Gulf Cryo
Shenzhen Kexin Gas

Recent Developments

FEBRUARY 2025

A Chinese producer commissioned additional neon purification capacity

A Chinese industrial gas producer commissioned further purification capacity drawing crude neon from steel-linked air separation units, targeting domestic mature-node fab demand rather than export markets. This was organic capital investment rather than any acquisition, joint venture or partnership arrangement with another company. Domestic fab qualification followed quickly.
Signal: Chinese supply and demand growth now occur inside the same borders, which insulates that market from external disruption
JUNE 2025

A semiconductor manufacturer standardised recycling across its scanner base

A major semiconductor manufacturer completed installation of neon recovery systems across its remaining deep ultraviolet scanner base, following pilot results confirming recovery rates well above initial expectations. This was internal capital investment rather than any commercial transaction with a gas supplier or equipment vendor. Remaining vented volume is now negligible.
Signal: Recycling installation is now effectively universal across the industry, which fixes the lower demand curve firmly in place
OCTOBER 2025

A gas producer contracted long-term crude neon offtake

An industrial gas producer signed a long-term crude neon offtake agreement with a steel operator whose air separation units have extended remaining operating life, citing decarbonisation-driven closures elsewhere. This was a supply agreement rather than any equity investment or joint venture between the two parties.
Signal: Crude offtake security is becoming the scarce asset as blast furnace air separation capacity begins retiring

What Governs Producer Cost

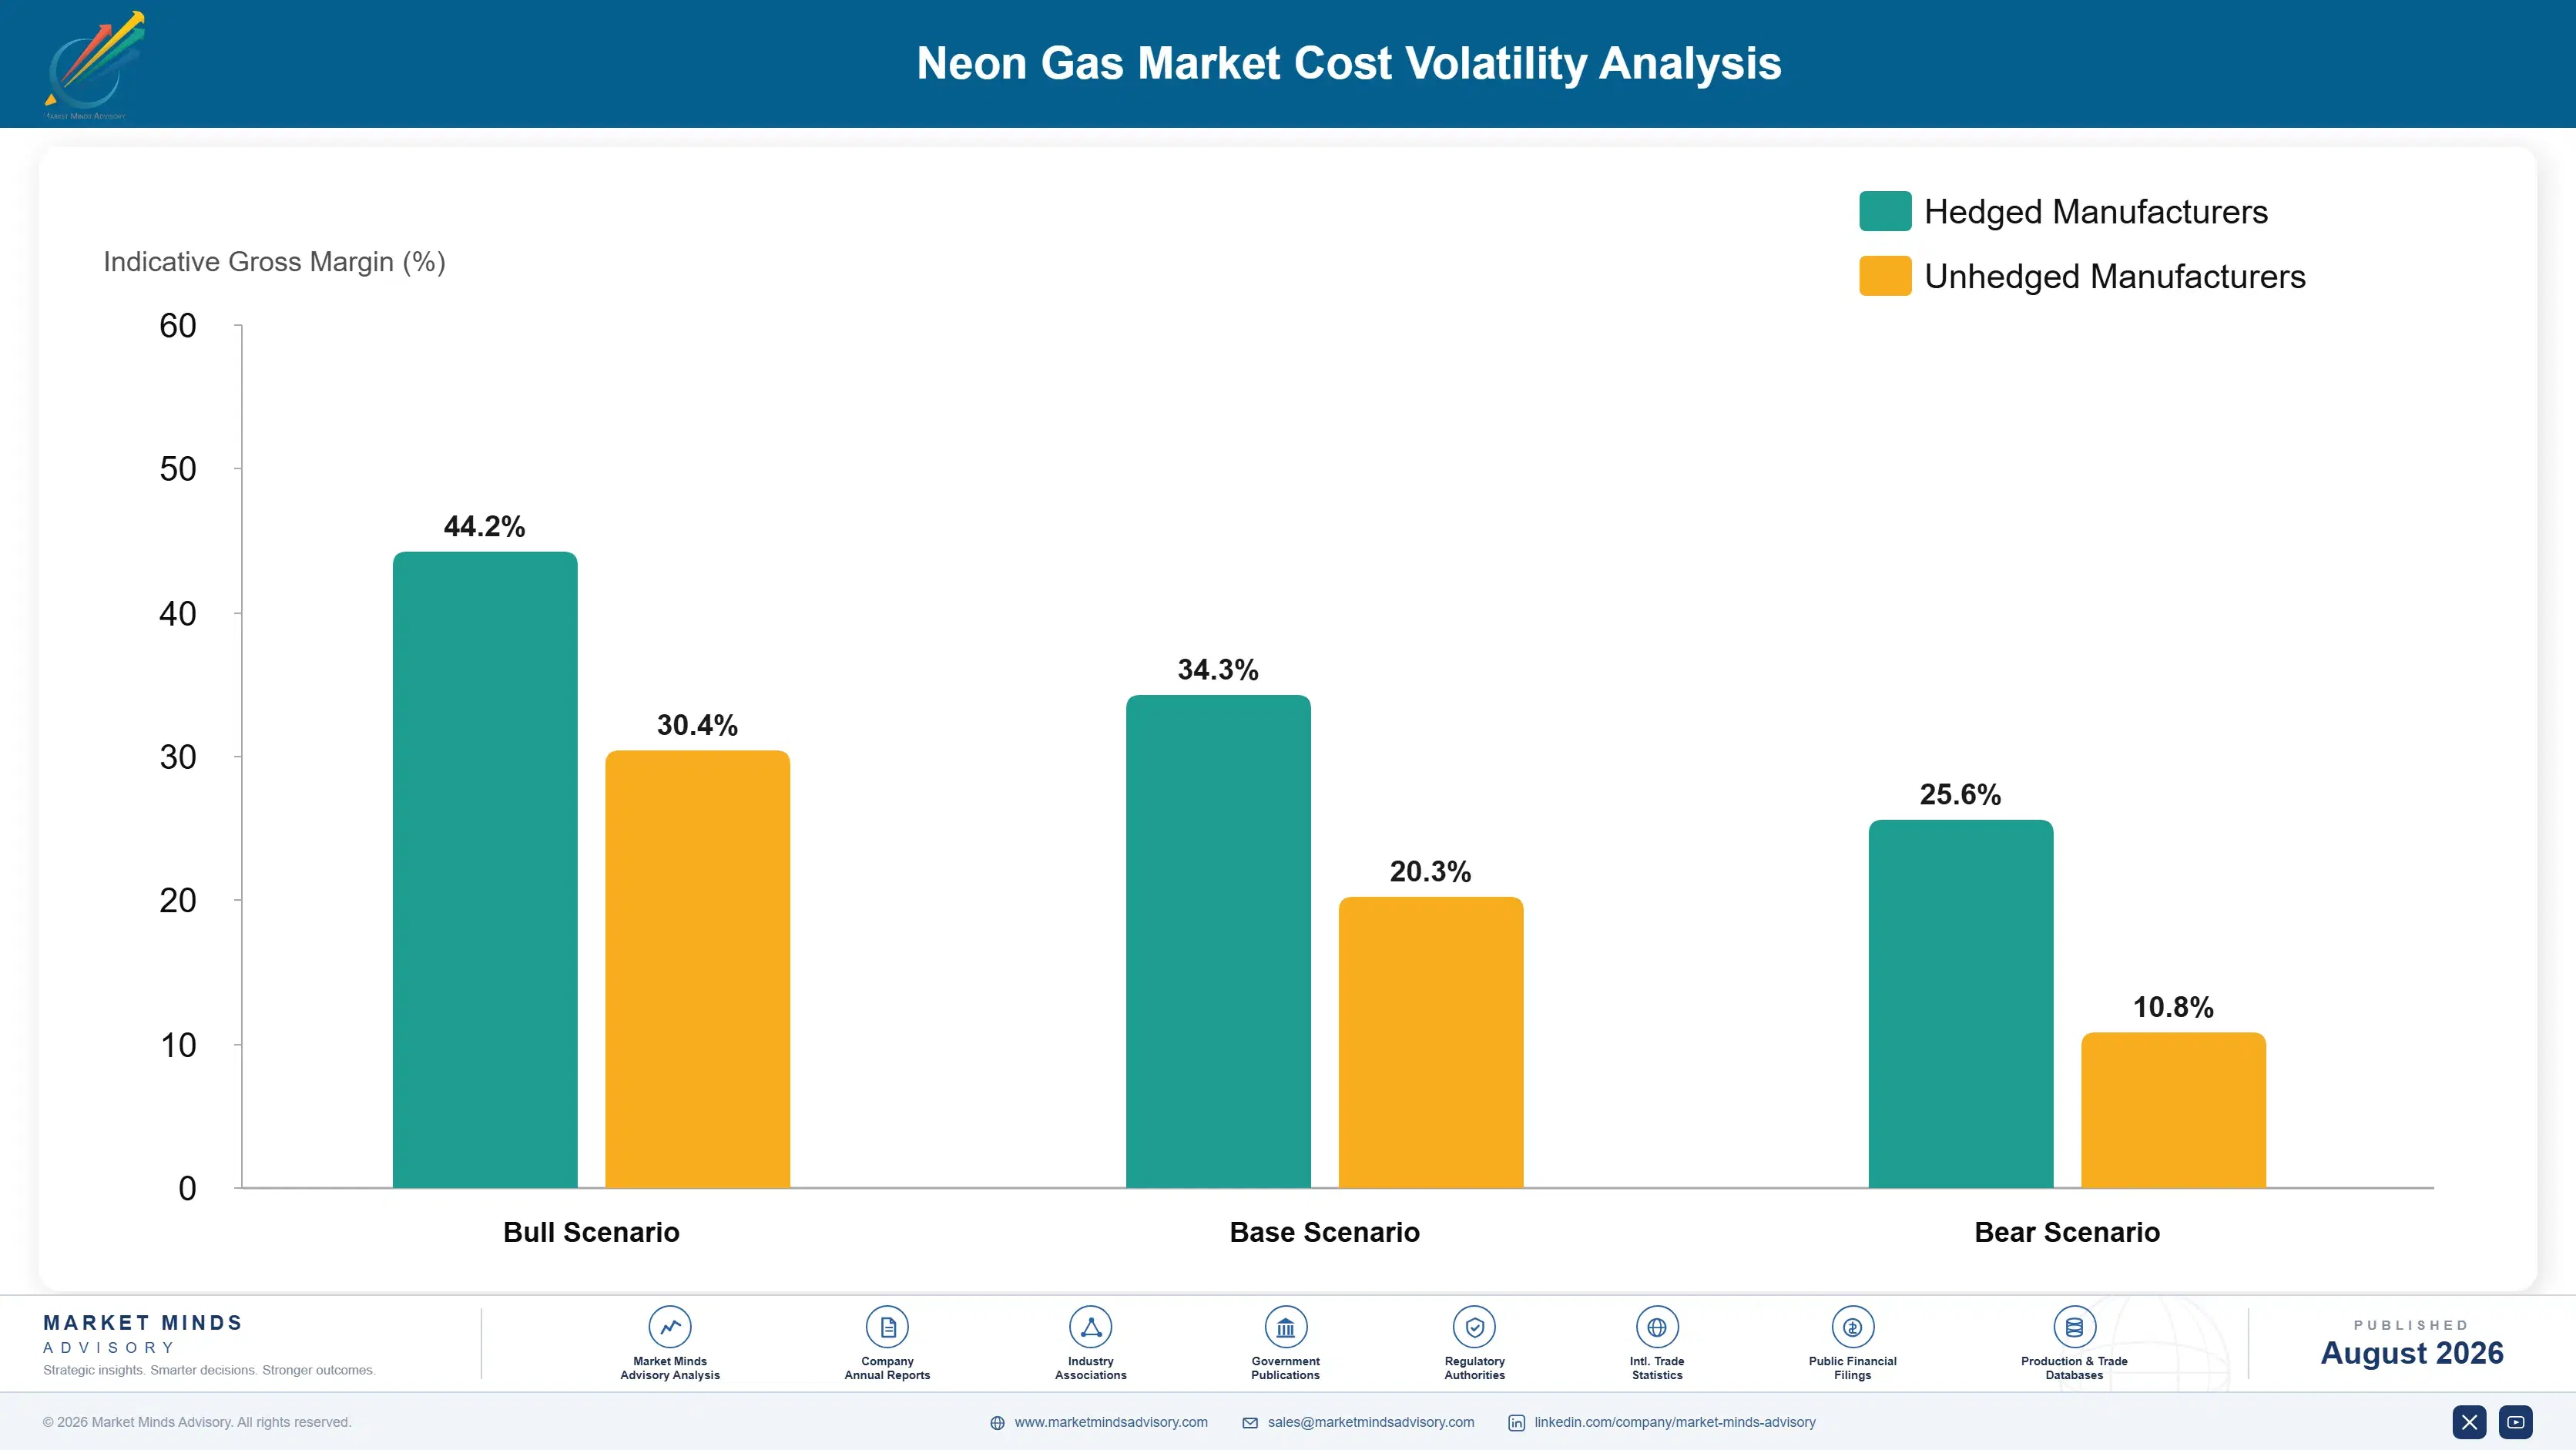
Crude neon purchase accounts for roughly 58% of purified cost, and that crude arrives as a neon-helium mixture from air separation units the purifier usually does not own. Purification energy and cryogenic distillation add around 21%, since separating neon from helium requires very low temperatures. Cylinder handling, testing and logistics take most of the remainder. Capital recovery matters greatly for capacity built during the shortage.
Neon prices rose above twelve times their pre-disruption level through 2022 as Ukrainian purification stopped, then fell below the starting point by 2024 as new capacity arrived into demand reduced by recycling. Linde noted rare gas pricing volatility across its electronics business in its Annual Report 2023. Semiconductor buyers holding fixed contracts through the spike paid far less than spot, and several subsequently locked multi-year terms at the low.

The disadvantage falls on producers whose capacity was built at crisis economics and who lack crude offtake security, and it appears as utilisation rather than unit cost. A purifier without contracted crude runs intermittently while carrying full capital charge. Producers with long-life offtake and diversified applications spread that cost, and those without either are the ones exiting.
neon-gas-market-trends-cost-volatility-analysis-1787555914020

Contract crude offtake from air separation units with long remaining life

Around 74% of crude neon comes from blast furnace air separation units that decarbonisation will progressively retire, and an offtake contract does not outlive the unit behind it. Screening counterparty units for remaining operating life rather than just price protects supply competitors will be chasing later. The screening work is straightforward and almost nobody does it.

Diversify into medical and cryogenic channels beyond semiconductors

Cryogenic refrigeration and excimer laser medical demand grow faster than lithography, price well above bulk grades and carry no recycling exposure at all. Both require distribution through scientific and medical gas channels rather than fab account management. Building those channels loads purification capacity that semiconductor demand alone leaves running below its design throughput. Channel building takes time nobody can compress.

Structure semiconductor contracts on security rather than spot price

Buyers who lived through the 2022 shortage will pay for supply certainty, and several have signed multi-year terms specifically to avoid repeating it. Contracts priced on guaranteed availability from geographically separated sources hold value when spot prices fall, which pure price competition does not. Producers competing only on delivered cost are surrendering the one thing customers genuinely learned to value.

Portfolio Architecture for Margin Defence

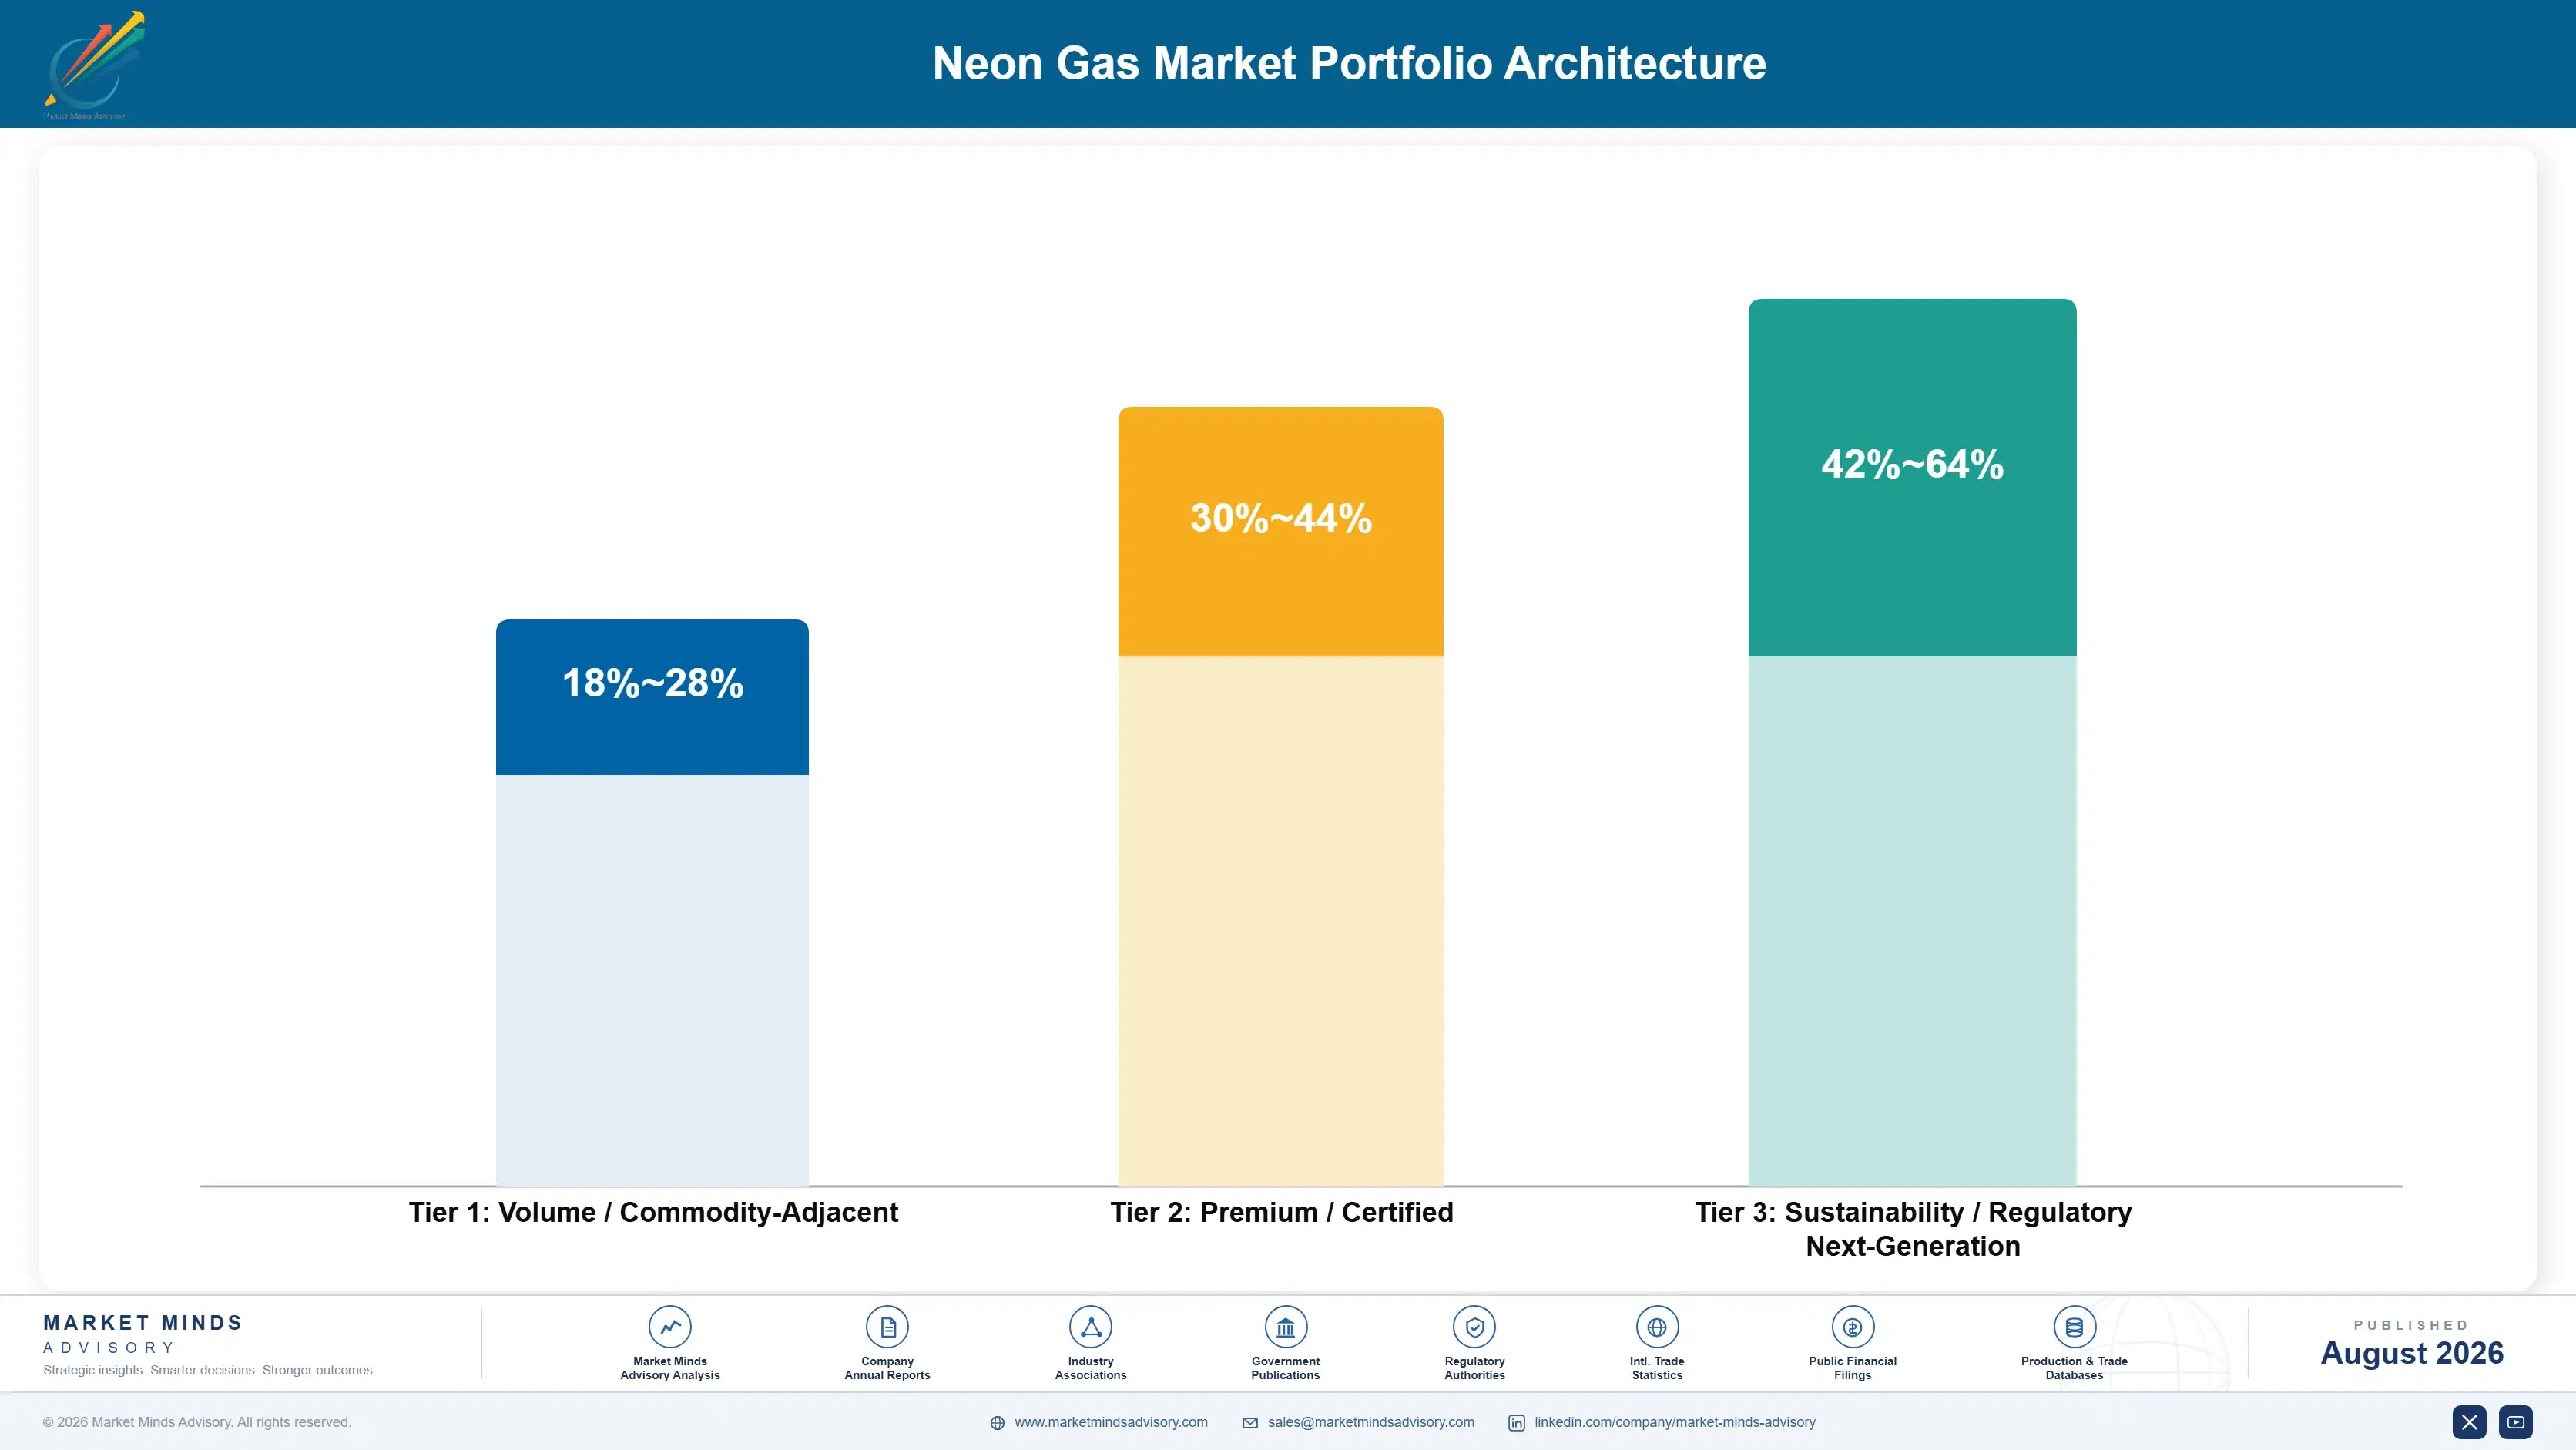
Margin separates on application and contract structure rather than on production scale, which is unusual for an industrial gas and follows from how small the total volumes are. Bulk semiconductor supply on spot or annual pricing runs at gross margins in the low twenties, squeezed by capacity built during the shortage now chasing reduced demand. Multi-year security contracts run better. Cryogenic and medical grades in cylinders run considerably higher, because purity, packaging and distribution all narrow the field of who can serve them.
The tension is that semiconductor volume fills purification capacity while medical and cryogenic demand earns the margin, and reaching the latter requires distribution channels that a fab-focused producer has never built. Several producers who added capacity during the crisis find themselves with throughput and no route to the customers who would pay properly for it. Building that route from depressed semiconductor margins is uncomfortable and slow.

High-value pools sit in cryogenic supply, medical laser mixtures and multi-year security contracts. Spot semiconductor supply is where the crisis-era capacity is competing itself into difficulty. Several of those producers will not survive the next contract round at current pricing levels.

Volume / Commodity-Adjacent

Bulk semiconductor grade supplied on spot or annual pricing against capacity built during the shortage. The ten-point range separates producers with contracted crude offtake and fab proximity from those buying crude opportunistically and shipping distances.
Gross Margin: 18%-28%

Premium / Certified

Multi-year semiconductor security contracts with geographically separated sourcing commitments. The fourteen-point spread reflects how genuinely redundant a producer's supply actually is, since buyers audit that claim rather than accepting it on assurance.
Gross Margin: 30%-44%

Sustainability / Regulatory / Next-Generation

Cryogenic grades and premixed excimer laser medical cylinders. The twenty-two-point range is wide because purity specification, packaging format and distribution channel all vary substantially, and customers here compare against system downtime rather than gas cost.
Gross Margin: 42%-64%
neon-gas-market-trends-portfolio-architecture-1787555914522

High-value Sub-segments and Strategic Watch-out

Cryogenic Refrigeration Supply

Compounding at 8.4% on superconducting, quantum and hydrogen liquefaction duty in a range where nothing else works well. Closed-cycle systems mean fill and top-up rather than continuous consumption, which suits a small high-purity business. Scientific distribution channels are the real barrier to entry in this segment.
Gross Margin: 44%-64%

Medical Laser Gas Mixtures

Growing at 7.4% on vision correction and dermatological procedure volumes across Asian and Gulf markets. Premixed cylinder supply through medical gas distribution rather than fab channels, which most semiconductor-focused producers have never built at all. Reorder is regular and volumes per clinic are genuinely tiny.
Gross Margin: 42%-58%

Multi-Year Security Contracts

The commercial response to 2022, where buyers pay for geographically separated sourcing rather than lowest delivered price. Redundancy claims get audited properly, so this rewards producers whose supply genuinely is diversified across regions. Audited supply redundancy is what buyers here actually pay a real premium for.
Gross Margin: 30%-44%

Spot Semiconductor Supply

The volume base, contested by capacity built at crisis economics against demand cut by 87% on-tool recovery. Manage this for utilisation and crude offtake security rather than for any margin recovery that is not coming. Crude offtake security matters far more here than any pricing decision.
Gross Margin: 18%-28%

How Neon Demand Renews

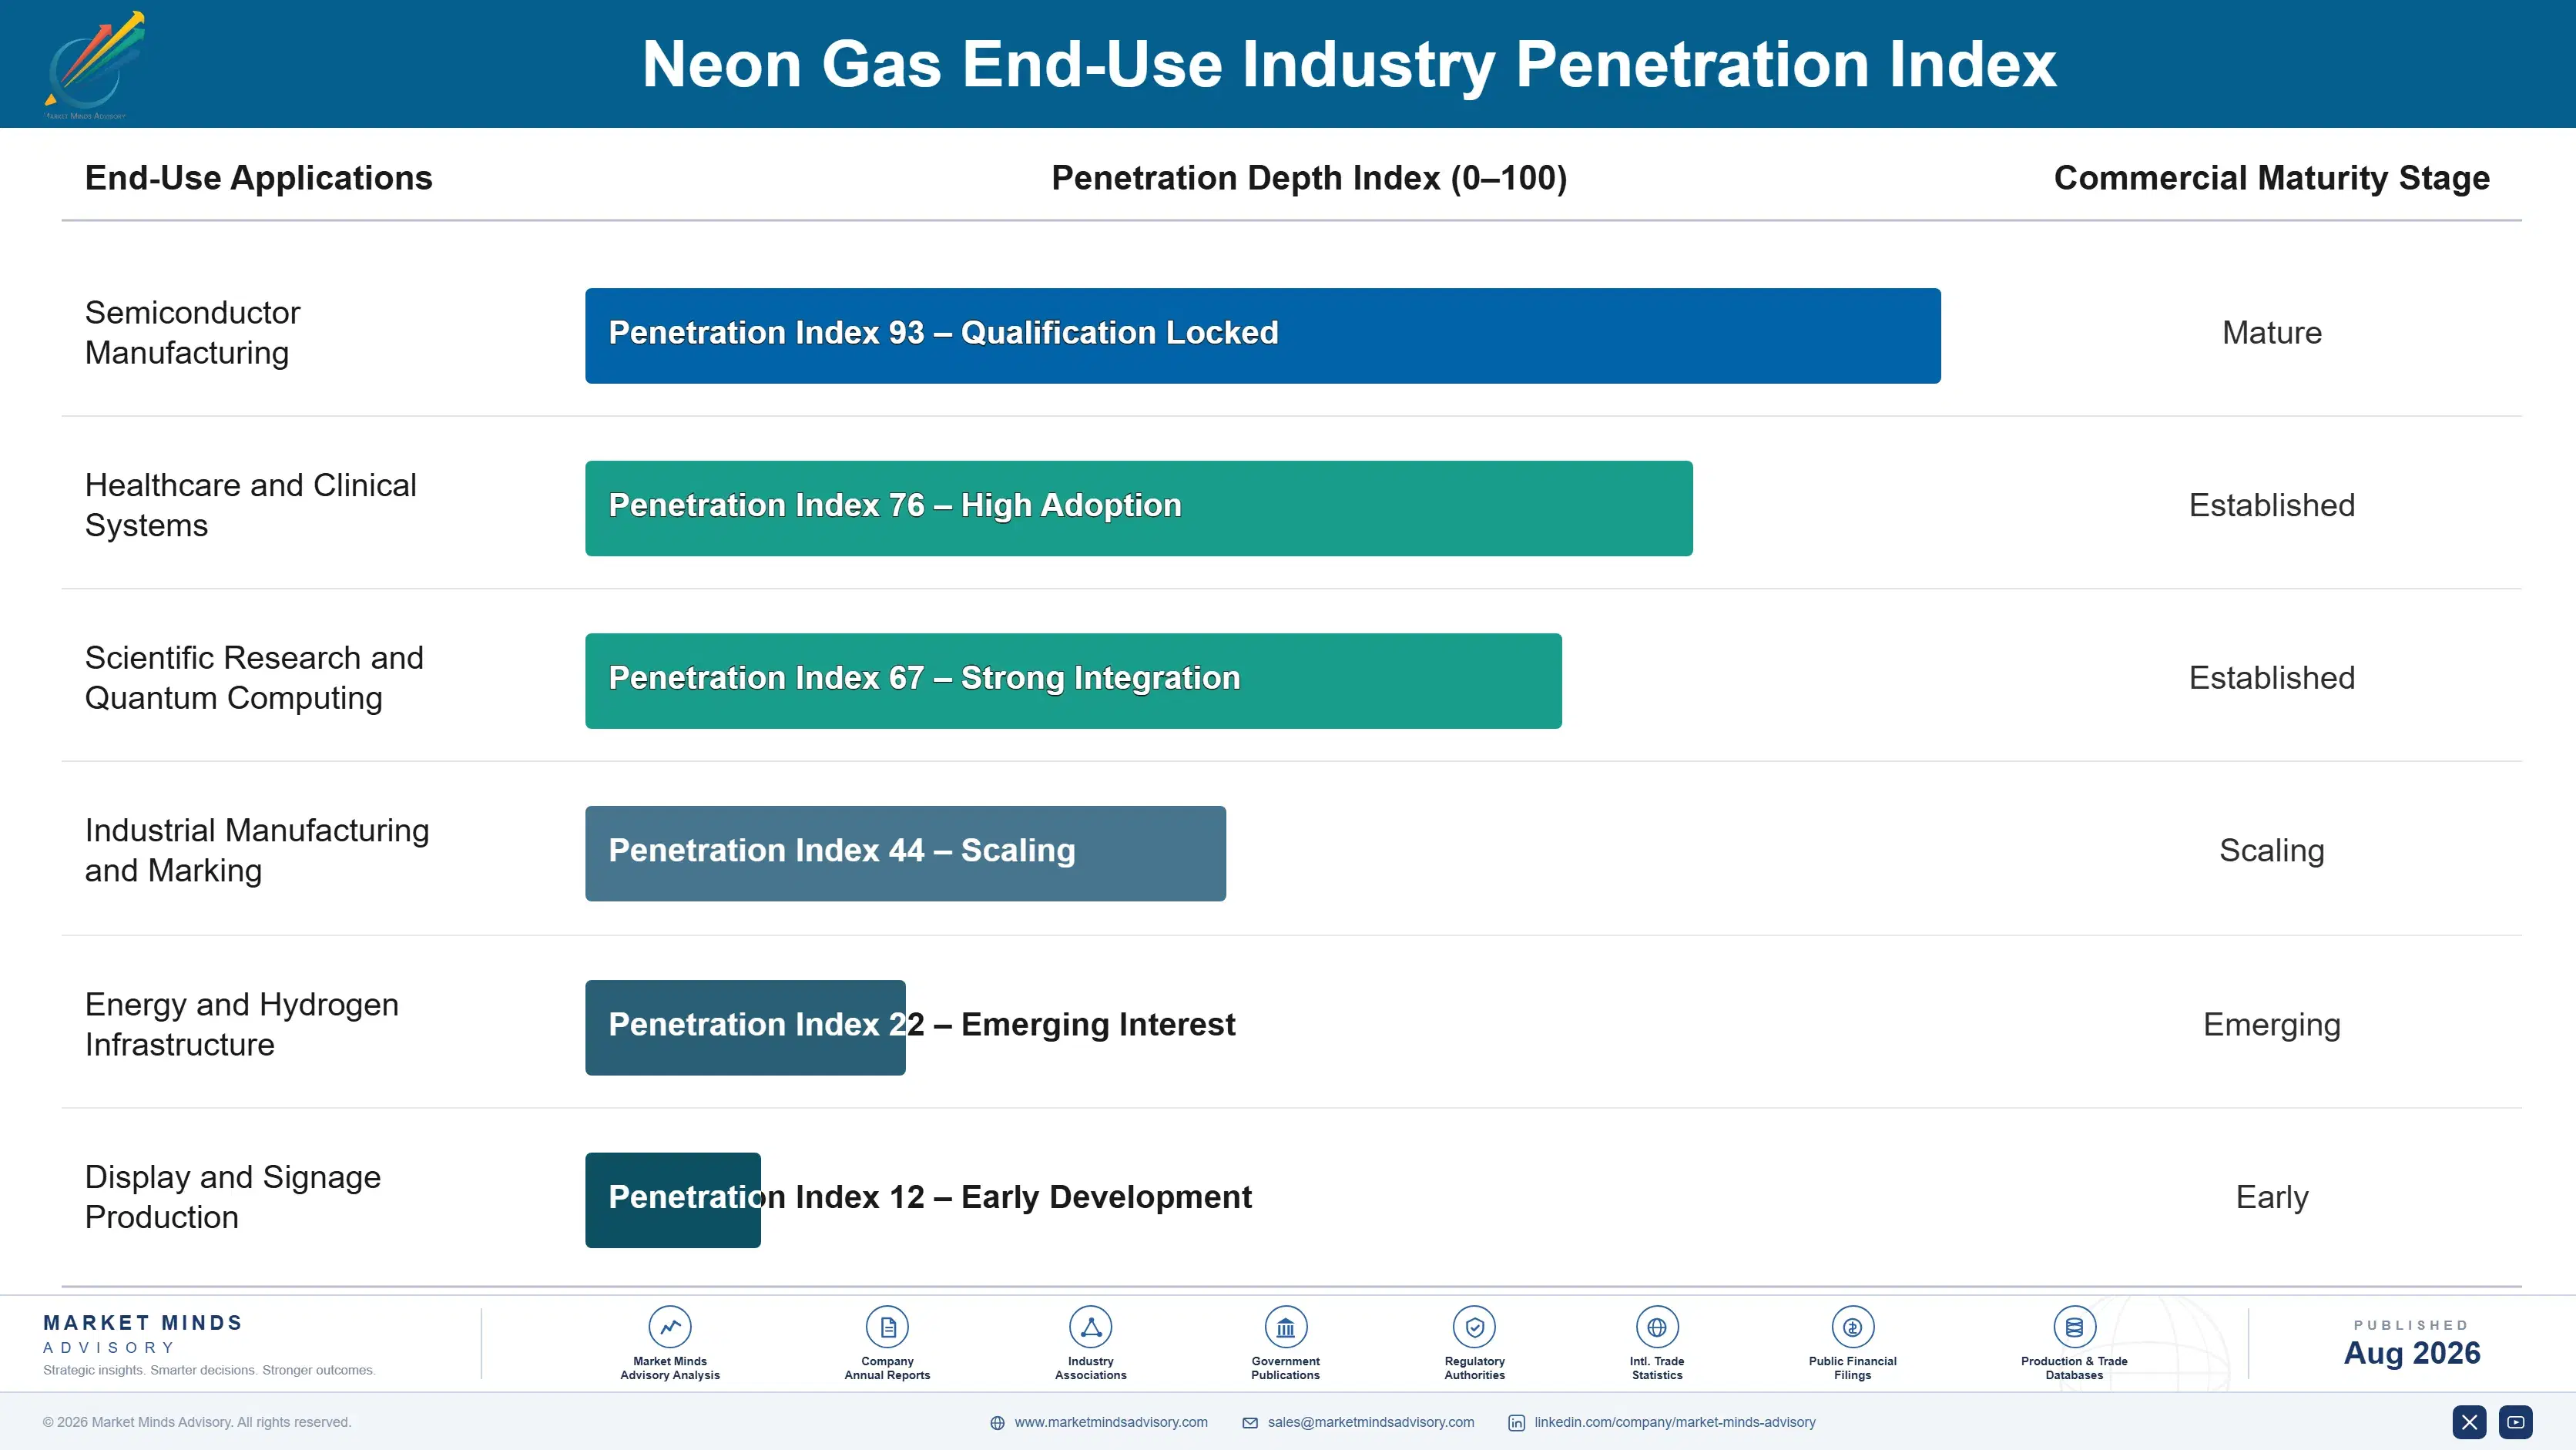
Demand renews as a consumable inside operating equipment, which normally produces a reliable annuity, and recycling has changed exactly that character. A scanner recovering 87% of its neon still needs make-up gas, but the annuity per tool shrank by roughly the recovery rate and the reorder interval lengthened correspondingly. Cryogenic systems behave differently again, retaining gas in closed cycles so revenue follows installation and occasional top-up rather than continuous consumption.
Stickiness by vertical follows qualification depth rather than contract length. A semiconductor fab qualifies gas to parts-per-billion impurity specifications and audits the supply chain behind it, which makes switching a documented exercise nobody undertakes casually. Medical laser customers buy premixed cylinders through distribution and switch more readily on availability. Industrial marking and signage buy almost purely on price and switch constantly.

The buyer changed permanently in 2022, and this is the part suppliers still underestimate. Neon was a procurement line item priced against alternatives. It is now a supply security question owned jointly by procurement and manufacturing risk, and those people ask where the crude comes from and what happens if that source stops. That is a different conversation entirely.
neon-gas-market-trends-end-use-penetration-index-1787555915007

Where To Place The Bet

These are among the four positions where our research anticipates prominent divergence between winners and laggards over the coming forecast period. Each is grounded in the demand model, the regulatory perimeter, and the announced capacity pipeline.
01 / RECOVERY ADJUSTED SIZING

Stop forecasting neon from wafer start projections

On-tool recycling recovers close to 87% of neon across the installed deep ultraviolet scanner base, and that equipment stays fitted permanently because removing it saves nothing while reintroducing an exposure nobody wants to experience a second time. Consumption per wafer stepped down and will not return to previous levels under any pricing scenario. Producers sizing capacity against semiconductor wafer output forecasts are building against a relationship that stopped holding in 2022, and the price collapse that followed has already demonstrated the point plainly enough.
02 / MATURE NODE TARGETING

Sell where deep ultraviolet capacity is actually being built

Extreme ultraviolet lithography uses tin plasma and hydrogen rather than neon, so every leading-edge fab announcement generates considerably less neon demand than its headline capital cost would suggest to anybody reading it. Mature-node deep ultraviolet construction, by contrast, generates real demand at every single scanner that gets installed. Chinese country growth at 8.4% leads this market precisely because that is where deep ultraviolet capacity is being built fastest, and sales organisations oriented toward the most advanced customers are chasing consumption that shrinks every year.
03 / CRUDE OFFTAKE SECURITY

Contract supply against blast furnace retirement schedules

Roughly 74% of neon originates in very large air separation units built to supply oxygen to blast furnace steelmaking, and electric arc and hydrogen direct reduction routes will retire a substantial share of that population over the coming decades. An offtake contract does not survive the closure of the unit standing behind it, which makes remaining operating life the screening criterion nobody currently applies. Standalone extraction remains the alternative and it costs considerably more per cubic metre than anybody presently wants to fund.
04 / NON-SEMICONDUCTOR CHANNEL BUILDING

Build medical and cryogenic distribution alongside fab supply

Cryogenic refrigeration at 8.4% and excimer laser medical systems at 7.4% both grow faster than lithography, price well above bulk semiconductor grades and carry no exposure to the recycling that reshaped the largest application. Reaching either requires scientific and medical gas distribution rather than fab account management, which is a genuinely different commercial capability. Producers holding purification capacity built during the shortage and no route to these customers are running throughput without any margin at all to show for it at the end of a year.

Engagement Snapshot From the Field

A live engagement with an industry participant carrying material or product regulatory and market exposure ahead of a defining policy shift, showing how our research translates into a defensible multi-year portfolio strategy.
MARKET MINDS ADVISORY · CLIENT ENGAGEMENT SUMMARY
Neon Gas Producer Strategic Portfolio Review and Transition Roadmap 2026·Investment Scenario on Neon Gas Exposure Evaluation 2025-26
CLIENT PROFILE
A regional industrial gas producer operating neon purification capacity commissioned during the 2022 shortage (client-reported, unverified by MMA), supplying semiconductor customers across two Asian markets. Crude neon was purchased on annual terms from three steel-linked air separation units. No medical or cryogenic channel existed anywhere in the business. Utilisation had fallen sharply throughout 2025. Contracts were annual.
STRATEGIC CHALLENGE
Purification throughput had fallen well below design as semiconductor prices collapsed and customers renewed at rates barely covering variable cost. Management proposed further price reductions to defend volume. Nobody had asked whether semiconductor demand could support the capacity at all after recycling installation became universal. The assumption had never been examined.
MMA APPROACH
MMA rebuilt regional neon demand net of on-tool recovery rather than from wafer start projections, then compared it against installed purification capacity across all suppliers. Crude offtake counterparties were screened for remaining operating life against steel decarbonisation plans. Medical and cryogenic channel requirements were costed against realistic build timelines. Competitor capacity was mapped alongside.
KEY FINDINGS
  1. Regional purification capacity exceeded recovery-adjusted demand by a wide margin, which meant price reduction would deepen losses without recovering meaningful volume from anybody.
  2. Two of the three crude offtake counterparties operated blast furnace units with publicly stated closure plans inside the contract horizon, leaving supply exposed in a way nobody had checked.
  3. Medical laser cylinder demand across the same two markets carried gross margins roughly double semiconductor supply, at volumes the existing purification capacity could serve easily.
  4. Cryogenic demand from regional research and superconducting programmes was small but growing at rates well above the semiconductor business and entirely unserved by any local producer.
CLIENT PROFILE
A regional industrial gas producer operating neon purification capacity commissioned during the 2022 shortage (client-reported, unverified by MMA), supplying semiconductor customers across two Asian markets. Crude neon was purchased on annual terms from three steel-linked air separation units. No medical or cryogenic channel existed anywhere in the business. Utilisation had fallen sharply throughout 2025. Contracts were annual.
STRATEGIC CHALLENGE
Purification throughput had fallen well below design as semiconductor prices collapsed and customers renewed at rates barely covering variable cost. Management proposed further price reductions to defend volume. Nobody had asked whether semiconductor demand could support the capacity at all after recycling installation became universal. The assumption had never been examined.
MMA APPROACH
MMA rebuilt regional neon demand net of on-tool recovery rather than from wafer start projections, then compared it against installed purification capacity across all suppliers. Crude offtake counterparties were screened for remaining operating life against steel decarbonisation plans. Medical and cryogenic channel requirements were costed against realistic build timelines. Competitor capacity was mapped alongside.
KEY FINDINGS
  1. Regional purification capacity exceeded recovery-adjusted demand by a wide margin, which meant price reduction would deepen losses without recovering meaningful volume from anybody.
  2. Two of the three crude offtake counterparties operated blast furnace units with publicly stated closure plans inside the contract horizon, leaving supply exposed in a way nobody had checked.
  3. Medical laser cylinder demand across the same two markets carried gross margins roughly double semiconductor supply, at volumes the existing purification capacity could serve easily.
  4. Cryogenic demand from regional research and superconducting programmes was small but growing at rates well above the semiconductor business and entirely unserved by any local producer.
RECOMMENDED STRATEGY
Phase 1: Phase one: stop defending semiconductor volume on price and hold pricing at contribution, accepting throughput loss rather than deepening it further. Phase 2: Phase two: build medical gas distribution for premixed excimer cylinders, which loads capacity at roughly double the margin semiconductor supply currently returns. Phase 3: Phase three: renegotiate crude offtake toward units with confirmed long operating life, screening on closure schedules rather than on delivered crude price.
OUTCOME
Semiconductor pricing held and volume fell as expected, with contribution improving despite lower throughput. Medical cylinder supply commenced during 2026 and is filling capacity at materially better margin. Crude offtake has been restructured across two long-life units, and the client reports the business returning to profit (client-reported, unverified by MMA).

Frequently Asked Questions

Foundational context covering the market sizes, CAGR, scope, country, region and competition that inform every finding below. This section is provided to cover basics and most often pre-purchase conversations, answered from the MMA Primary Research Dataset.

What is the current size of the Neon Gas Market?

The market was valued at USD 0.42 billion in 2025, rising to an estimated USD 0.44 billion in 2026. East Asia holds the largest regional share at 40% of value.

How large will the Neon Gas Market be by 2036?

MMA forecasts USD 0.76 billion by 2036 under the base case, an expansion multiple of 1.72 times the 2026 value. That represents USD 0.32 billion of incremental value.

What is the CAGR for the Neon Gas Market 2026 to 2036?

The base case runs at 5.6% compound annual growth between 2026 and 2036, with a bull case at 6.8% and a bear case at 4.4%. Historical growth from 2020 to 2025 was 4.4%.

Which segment is growing fastest?

Cryogenic refrigeration leads at 8.4%, half again the market rate, serving superconducting and hydrogen liquefaction duty near 27 kelvin. Medical laser systems follow at 7.4%.

Who are the major companies in the Neon Gas Market?

Linde, Air Liquide, Messer Group, Air Products and Chemicals and TEMC hold 62% of purified supply. Purification capability and crude offtake access sustain those positions.

Which country is growing fastest?

China leads at 8.4%, driven by mature-node fab construction using deep ultraviolet lithography, with domestic purification capacity expanding inside the same market at the same time.

Report Segmentation Architecture

The full report scope spans multiple orthogonal segmentation dimensions, with cross-tabulated demand data provided for each dimension pair. Coverage extends further to regional breakdowns, trend trajectories, and the competitive detail needed to support segment-level decision-making.

By Application

  • Semiconductor Deep Ultraviolet Lithography
  • Excimer Laser Medical Systems
  • Industrial Laser and Marking
  • Lighting, Signage and Display
  • Cryogenic Refrigeration
  • Analytical and Calibration Mixtures

By End-Use Industry

  • Semiconductor Manufacturing
  • Healthcare and Clinical Systems
  • Scientific Research and Quantum Computing
  • Industrial Manufacturing and Marking
  • Energy and Hydrogen Infrastructure
  • Display and Signage Production

By Supply Arrangement

  • Long-Term Security Contracts
  • Annual Bulk Supply
  • Spot and Merchant Sale
  • Premixed Cylinder Distribution
  • Recovered Gas Resale

By Region

  • North America
  • Western Europe
  • East Asia
  • South Asia and Pacific
  • Latin America
  • Middle East and Africa
  • Eastern Europe

Scope, Methodology, and Coverage

Every figure in this report is reproducible from documented input assumptions. The scope below maps the historical period, the forecast horizon, the segmentation dimensions, and the countries covered, alongside the underlying primary and qualitative methodology.
Historical Period
2020 to 2025
Forecast Period
2026 to 2036
Base Year
2025 (USD billions; MMA Primary Research Dataset, August 2026)
Market Definition
The market comprises neon supplied in purified commercial grades across semiconductor deep ultraviolet lithography, excimer laser medical systems, industrial laser and marking, lighting signage and display, cryogenic refrigeration, and analytical and calibration mixtures. Value is measured at producer level on cubic metres of purified neon supplied through long-term, annual, spot, cylinder and recovered-gas channels. Crude neon-helium mixtures traded between processors before purification, other rare gases including krypton and xenon, helium in all grades, and gas handling or recycling equipment sold as hardware fall outside scope.
Quantitative Units
USD billions (current prices); thousand cubic metres purified neon; USD per cubic metre by grade and application
Segmentation Dimensions
By Application; By End-Use Industry; By Supply Arrangement; By Region
Regions Covered
North America, Western Europe, East Asia, South Asia and Pacific, Latin America, Middle East and Africa, Eastern Europe
Countries Covered
China, Taiwan, South Korea, Japan, Singapore, India, Malaysia, Australia, United States, Canada, Mexico, Brazil, Argentina, Chile, Germany, France, Netherlands, Belgium, Italy, Spain, United Kingdom, Ireland, Ukraine, Poland, Czechia, Romania, Saudi Arabia, United Arab Emirates, Israel, South Africa
Key Companies Profiled
Linde, Air Liquide, Messer Group, Air Products and Chemicals, TEMC, Cryoin Engineering, Iceblick, Baosteel Gases, Hangyang Group, Suzhou Jinhong Gas, Yingde Gases, POSCO, Nippon Sanso Holdings, Guangdong Huate Gas, Shandong Feiyuan Gas, Wuhan Iron and Steel Gases, SK Materials Airplus, Coregas, Gulf Cryo, Shenzhen Kexin Gas
Quantitative Methodology
Primary survey, n=3,800 respondents, Q4 2025, six countries; demand-side model with trade association cross-validation
Qualitative Methodology
47 expert interviews, Q4 2025; applied to validate demand model assumptions, identify emerging dynamics, and assess competitive positioning
Report Format
PDF and XLSX data workbook (Word format preview document)
Publisher
Market Minds Advisory
Report Code
MMA-2026-CHM-734
Published
August 2026
Contact
sales@marketmindsadvisory.com | www.marketmindsadvisory.com

Purchase the full Neon Gas Market Report (2026 to 2036).

The full report sizes the global neon market to 2036 across six applications and seven regions, measured on cubic metres of purified neon supplied. It models demand net of on-tool recovery rather than from wafer start projections, which is the single largest correction available to anyone planning capacity in this market. Competitive analysis covers 20 producers on one consistent volume basis, with moat and risk assessment for the two leaders. Crude neon supply is mapped against steel-linked air separation units and their retirement exposure. Four quantified revenue levers close the analysis.
Six-application segment sizing with individual growth rates
Demand modelled net of on-tool recovery across installed scanners
Crude supply mapped against steel air separation unit retirement
Deep and extreme ultraviolet intensity separated by fab type
Twenty-producer competitive map on one purified volume basis
Four quantified revenue levers with commercial impact ranges

Built For The People Who Decide

From boardroom strategy to bench-side execution, this report is read cover-to-cover by leaders shaping the next decade of their industry, turning demand scenarios, market dynamics and valuation benchmarks into decisions.
CXOs/ Presidents/ VPs/ Managers
M&A and Corporate Development
Strategy Teams and R&D Heads
Procurement and Product Directors
Regulatory and Compliance Leaders
Investor Relations and Equity Analysts