Market Minds Advisory
Natural Rubber Market

Natural Rubber Market: Smallholder traceability, replanting shortfall and irreplaceable truck tyre demand to 2036

Around eighty five per cent of world supply grows on plots of a few hectares, and European rules now require every consignment to name the exact plot that it came from.

Lead Analyst

Bilal Shaikh

Published

September 2026

Make Smarter Decisions with Customized Research Insights

Request a free sample report and evaluate market opportunities, growth trends, and competitive dynamics relevant to your business needs.

2025 MARKET VALUE$44.6BMarket Size 2025
2036 FORECAST VALUE$67.2BBase Case , 2026 to 2036
CAGR 2026 TO 20363.8 %Bull 5.0% / Bear 2.6%
INCREMENTAL OPPORTUNITY$20.9BNet 10- year value creation
EXPANSION MULTIPLE1.45x2036 value over 2026 base
Strategic Levers
M&A Pipeline
Regional Outlook
Country Rankings
Competitive Intelligence
Segmental Deep-dive
Call-Us : 91 93563 13602

Executive Snapshot and Market Trajectory

European deforestation rules require every rubber consignment to identify the plot where the trees grew. Around 85% of world supply comes from smallholders working a few hectares each across six countries, and only about 27% of volume can currently document that plot at all. That is the defining fact here.
Concentrated latex grows at 5.7%, half again the market rate of 3.8%, on medical and examination glove demand that survived the pandemic surge rather than collapsing back to where it started. East Asia holds 36% of value because tyre and glove manufacturing sits there. Truck tyre carcasses run around 78% natural rubber and no synthetic replaces it. Passenger tyres substituted decades ago and stopped there.
The problem nobody can fix inside a decade is planting. Replanting is running roughly 41% below the rate that sustains current output, and a rubber tree takes seven years to reach tapping. That shortfall is already committed in the ground, and no price signal arriving now changes what will be tappable in 2033. Buyers negotiating long-term supply today are pricing against a constraint that has not yet appeared, and their counterparties mostly have not noticed.
Market Definition
This report covers natural rubber supplied in commercial grades from Hevea brasiliensis, spanning technically specified block rubber, ribbed smoked sheet, concentrated latex, crepe and sheet specialty grades, epoxidised and modified natural rubber, and skim and field coagulum grades. Value is measured on tonnage of dry rubber content at first commercial sale by processors and trading houses. Excluded are synthetic elastomers of every type, reclaimed and devulcanised rubber, guayule and dandelion-derived rubber, rubberwood, and compounded rubber sold as a finished mixture.
Base Year Value
$44.6B in 2025 (MMA Primary Research Dataset, August 2026)
Forecast Period
2026 to 2036, eleven discrete annual values
CAGR
3.8% base case. Bull 5.0%. Bear 2.6%.
Fastest Growth Segment
Concentrated Latex: 5.7% CAGR
Fastest Growth Country
India: 6.2% CAGR
Fastest Growth Region
South Asia and Pacific: 5.6% CAGR
Largest Region
East Asia: 36% of 2025 global value
Market Leaders
Sri Trang Agro-Industry, Halcyon Agri, Von Bundit, Southland Rubber and Thai Hua Rubber lead the market. Source: MMA Primary Research Dataset, July 2026.
Primary Survey
n=3,800 procurement and R&D decision-makers, Q4 2025, six countries
Methodology
Demand-side build-up, cross-validated against public data, 47 expert interviews

Natural Rubber Market Forecast Scenarios

natural-rubber-market-trends-size-forecast-scenario-1787555894051
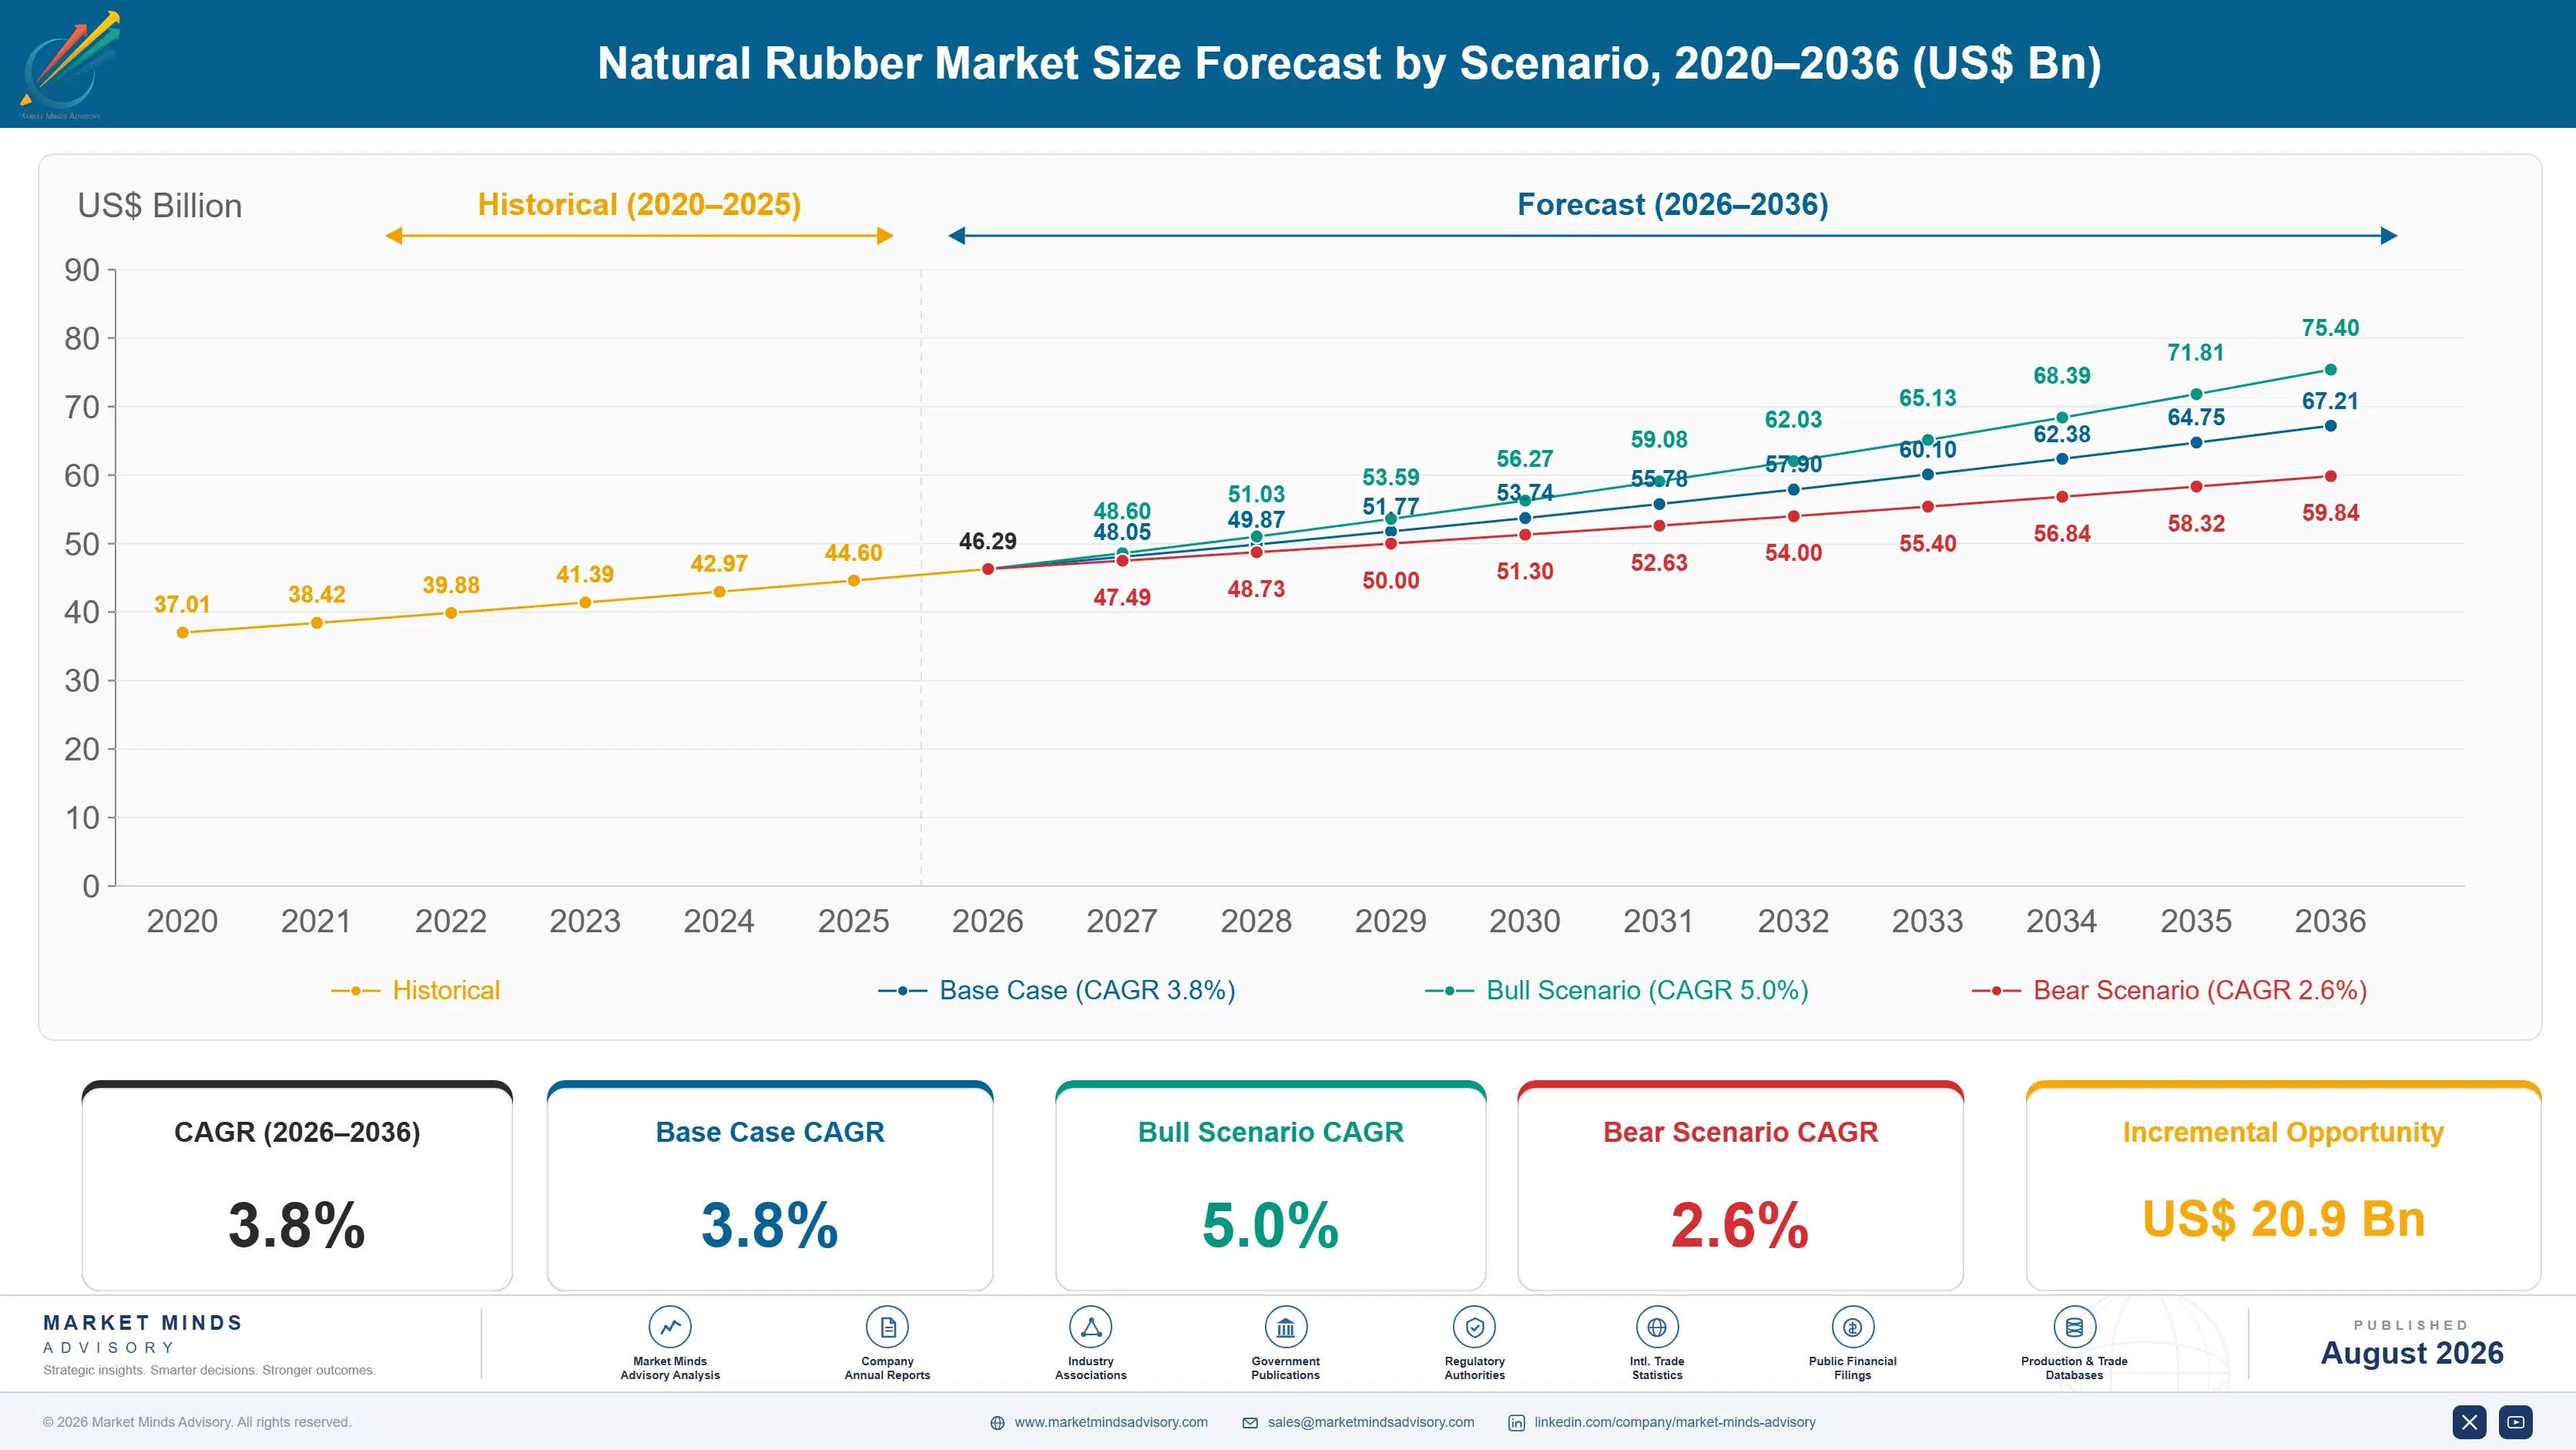
Growth ran at 2.8% between 2020 and 2025 and it was among the least orderly periods this commodity has seen. Glove demand spiked and partially retreated, Pestalotiopsis leaf fall disease cut Indonesian and Thai yields, and prices swung far enough that smallholders repeatedly stopped tapping altogether. Underneath all of it, replanting kept falling behind what sustaining output requires.
The 3.8% base case rests on three mechanisms. Truck and bus tyre demand, which cannot substitute away because natural rubber crystallises under strain in a way no synthetic matches, keeping carcass content near 78%. Concentrated latex at 5.7% on medical glove consumption that settled above its pre-pandemic base. And Indian growth at 6.2%, the fastest of any country, on tyre manufacturing expansion. Domestic Southeast Asian processing consumes a rising share of regional output rather than exporting it raw.
The 5.0% bull case is the replanting shortfall biting earlier than expected and lifting prices across a demand base that cannot substitute. The 2.6% bear case is European deforestation compliance fragmenting trade flows, with untraceable volume diverted to non-European buyers at a discount while compliant material commands a premium. Compliant material would then command a widening premium, and untraceable volume a matching discount.

Six Million Farms, One Regulation

European deforestation rules made rubber a covered commodity, which means a consignment entering the European Union must identify the geographic coordinates of the plot the trees grew on. That is straightforward for a palm estate and close to impossible for rubber, where around 85% of supply comes from smallholders working two or three hectares each, selling to village dealers who bulk material from dozens of farms before it reaches a processor. Roughly 27% of world volume can currently document its plot. The rest cannot.
TOP-FIVE CONCENTRATION22%Combined position across processing and trading held by leading participants
SMALLHOLDER SUPPLY SHARE85%Portion grown on plots of a few hectares
TRUCK TYRE CONTENT REQUIREMENT78%Rubber content in a heavy truck tyre carcass
REPLANTING RATE SHORTFALL41%Gap between current replanting and sustaining output long term
TAPPING LABOUR COST SHARE62%Portion of smallholder production cost attributable to tapping work
TRACEABLE VOLUME SHARE27%Share able to document the plot where it grew
Demand meanwhile has a floor that price cannot move. Natural rubber crystallises under strain, which gives tear resistance and low heat build-up that no synthetic elastomer reproduces, and a heavy truck tyre carcass therefore runs around 78% natural rubber. Aircraft tyres are effectively all natural. Passenger car tyres substituted decades ago and the substitution stopped there, because the remaining applications are not choices.
The supply position is worse than the price suggests. Replanting is running roughly 41% below the rate needed to sustain output, and a tree takes seven years to reach tapping and yields for about twenty five. What gets tapped in 2033 was planted before anyone reads this.
"The industry spent years treating traceability as a reporting problem and it is a procurement problem. If you cannot name the plot, you cannot sell into Europe, and there are around six million farms in this supply chain that have never been mapped by anyone."
Director, Agricultural Commodities and Elastomers Practice · MMA Chemicals and Materials Practice · August 2026

Market Trends

Deforestation rules force plot-level traceability onto smallholder supply

European rules require geographic coordinates for the plot every consignment grew on, and rubber is the hardest covered commodity to comply with because around 85% comes from smallholders selling into village dealer networks that bulk material long before a processor sees it. Only about 27% of volume can currently document origin to that standard. Commercially this is splitting the market into compliant material commanding a premium and untraceable volume flowing to buyers outside Europe. Processors investing in farm mapping are building an asset competitors cannot quickly replicate. Field survey takes seasons and cannot be accelerated afterwards.
Market Impact: Carcass content stays near 78%
Replanting shortfall commits a supply constraint years ahead

Replanting is running roughly 41% below the rate needed to sustain current output, the accumulated result of years in which prices sat too low to justify taking a tapping tree out of production for seven unproductive years. A rubber tree yields for around twenty five years, so the ageing profile of the world's tapped area is already determined. Commercially this means the supply position in the early 2030s is fixed regardless of what prices do now, and buyers negotiating long contracts are pricing against a constraint that has not yet appeared.
Market Impact: Latex grades compound at 5.7%

Market Opportunities and Growth Drivers

Truck and aircraft tyres cannot substitute away from natural rubber

Natural rubber crystallises under strain, delivering tear resistance and low heat build-up that no synthetic elastomer reproduces, which is why a heavy truck tyre carcass runs around 78% natural rubber and aircraft tyres are effectively all natural. Passenger car tyres substituted toward synthetic decades ago and the substitution then stopped, because what remains are applications where the property is required rather than preferred. Commercial vehicle fleet growth across Asian and African markets therefore converts directly into natural rubber demand with no substitution risk attached. Aircraft tyre demand adds smaller volume at the same non-negotiable requirement.
Market Impact: Consumes 62% of production cost

Glove consumption settled above its pre-pandemic baseline

Medical and examination glove demand surged during the pandemic and retreated afterwards, but it settled well above where it started as infection control practices in hospitals, food handling and personal care became routine rather than exceptional. Concentrated latex compounds at 5.7%, the fastest grade in this market. Nitrile took much of the growth in developed healthcare, while natural latex retained cost-sensitive volume across Asian, African and Latin American markets. Malaysian and Thai latex processing capacity remains the world's principal source. Allergen concerns pushed some developed healthcare volume toward nitrile permanently, though cost-sensitive markets never followed.
Market Impact: Affects yields since 2019

Market Restraints and Challenges

Tapping labour scarcity constrains output independently of price

Tapping accounts for roughly 62% of smallholder production cost and it is skilled manual work performed before dawn, which younger rural workers across Thailand, Malaysia and Indonesia increasingly decline in favour of factory and service employment. The root cause is rural wage convergence rather than any agricultural problem. Commercially this means output can fall even when prices rise, because the constraint is people rather than trees. Producers are trialling low-frequency tapping systems and mechanical aids, though both reduce yield per tree and neither has spread widely. Rural wage convergence continues across all three producing countries.
Market Impact: Only 27% currently traceable

Leaf fall disease continues suppressing yields across Southeast Asia

Pestalotiopsis leaf fall disease spread across Indonesian, Thai and Malaysian plantings from 2019 and continues reducing yields on affected area by a substantial margin. The root cause is that most commercial clones were bred for yield rather than disease resistance, leaving a genetically narrow population exposed to a pathogen nobody had planned for. Commercially it compounds the replanting shortfall by damaging trees already in the ground. Growers are replanting with more resistant clone material where it is available, which is slow and itself requires seven years. Clone diversity is improving slowly and remains genuinely narrow.
Market Impact: Runs 41% below sustaining rate
4 additional market trends, 3 additional growth drivers, and 2 additional restraints and challenges are covered in the full report. Contact sales@marketmindsadvisory.com to access the complete intelligence.

Segment CAGR and Growth Architecture

Volume is classified here by commercial grade, since grade determines the processing route, the price basis and which manufacturers are able to buy it at all. Producing origin, supply channel and end application are each handled separately in the framework below, because one single grade reaches many applications and every producing origin turns out several grades.
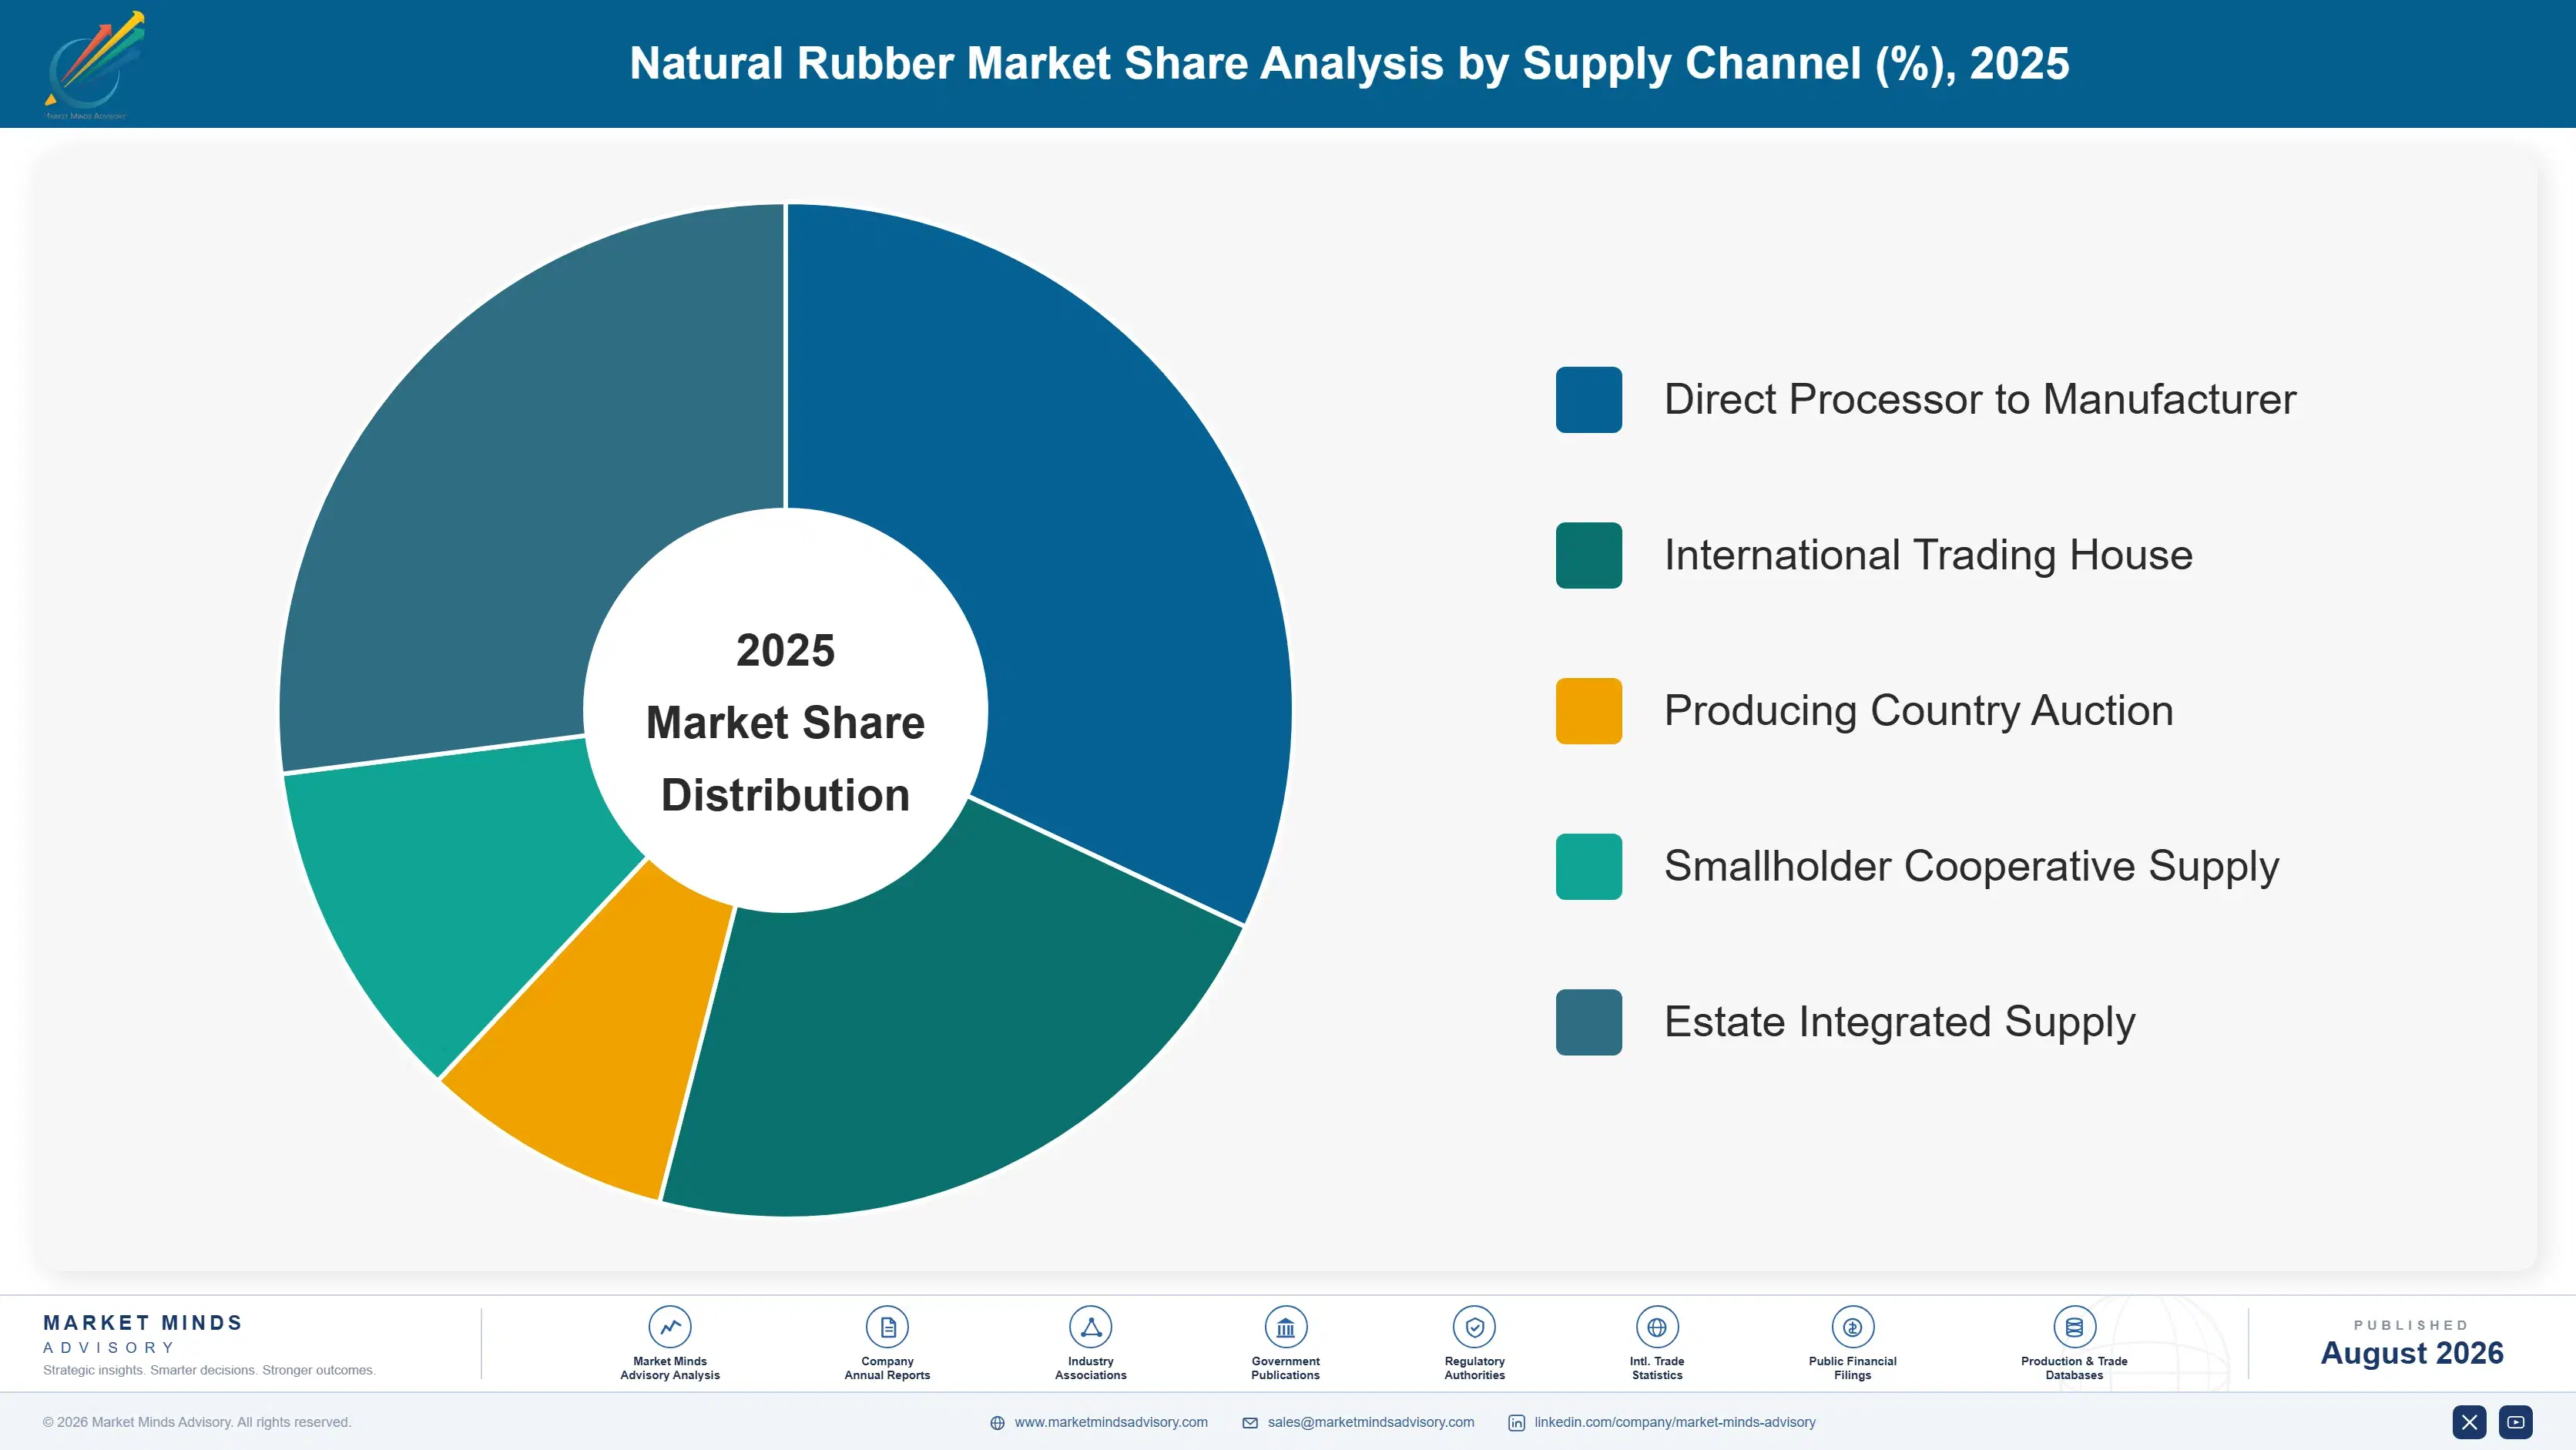
natural-rubber-market-trends-market-share-analysis-1787555894590

Concentrated Latex

Growing at 5.7%, half again the market rate, concentrated latex is centrifuged field latex sold as a liquid rather than dried, and it feeds glove, condom, adhesive and foam manufacture. Medical and examination glove demand settled well above its pre-pandemic base as infection control practices became routine across hospitals, food handling and personal care. Nitrile captured much of the developed healthcare growth while natural latex held cost-sensitive volume across Asian, African and Latin American markets. Malaysian and Thai processing capacity dominates supply. The grade requires ammonia preservation and cold chain discipline that dried grades do not, which limits how far it travels economically. Processors sited near glove manufacture hold a genuine and durable advantage here.
CAGR 5.7%

Epoxidised and Modified Natural Rubber

Chemical modification of natural rubber, principally epoxidation, alters polarity and improves oil resistance and wet grip in ways that widen where the material competes against synthetic elastomers directly. Growth at 5.0% follows tyre compound development and specialty engineering applications rather than any volume market. Malaysian producers hold the deepest capability, developed through sustained public research investment over decades. Volumes are small relative to block rubber and pricing is considerably higher, which makes this the only grade where technical development rather than commodity supply determines the commercial position anybody holds. Tyre compounders evaluate these grades against synthetic alternatives on measured performance rather than on any sustainability argument, which keeps the competition honest and the development pipeline active.
CAGR 5.0%
Full segment breakdown across 6 segments available in the complete report.

Regional Architecture and Country Demand Map

East Asia holds 36% of value because world tyre and glove manufacturing concentrates there, which is well above the usual regional band and stated as an exception. South Asia and Pacific follows at 14% on Indian tyre demand and on Southeast Asian domestic processing volume.

East Asia

At 36% this region sits above the standard band, and the reason is that world tyre and glove manufacturing relocated here decades ago and never left. China alone consumes more natural rubber than any other country by a wide margin, feeding both a domestic tyre industry and export production. Chinese producers also grow rubber in Yunnan and Hainan, and Sinochem and Hainan Rubber Group hold substantial processing and trading positions across Southeast Asian origins. Japanese and Korean tyre manufacture is technically demanding and buys on consistency rather than price. Growth at 4.3% tracks commercial vehicle fleet expansion. Traceability compliance matters here mainly for material re-exported into Europe as finished tyres. Domestic Chinese buyers apply no equivalent requirement.
Share: 36% | CAGR: 4.3% (2026 to 2036)

South Asia and Pacific

This region sits at 14%, above the standard band, because it contains both the world's principal producing countries and India, the second largest consuming nation. Indian growth at 6.2% is the fastest of any country, driven by commercial vehicle tyre manufacture expanding with road freight. Thailand, Indonesia, Vietnam and Malaysia between them grow the majority of world supply, and domestic processing and glove manufacture consume a rising share of it rather than exporting raw. Traceability compliance is hardest here, since this is where the smallholders actually are. Sri Lankan production is small and technically sophisticated, weighted toward specialty grades. Vietnamese output has grown faster than any other Asian origin over the past decade, largely through organised estate structures.
Share: 14% | CAGR: 5.6% (2026 to 2036)
Regional intelligence for 5 additional markets available in the complete report: North America, Western Europe, Latin America, Middle East and Africa, Eastern Europe. Contact sales@marketmindsadvisory.com.
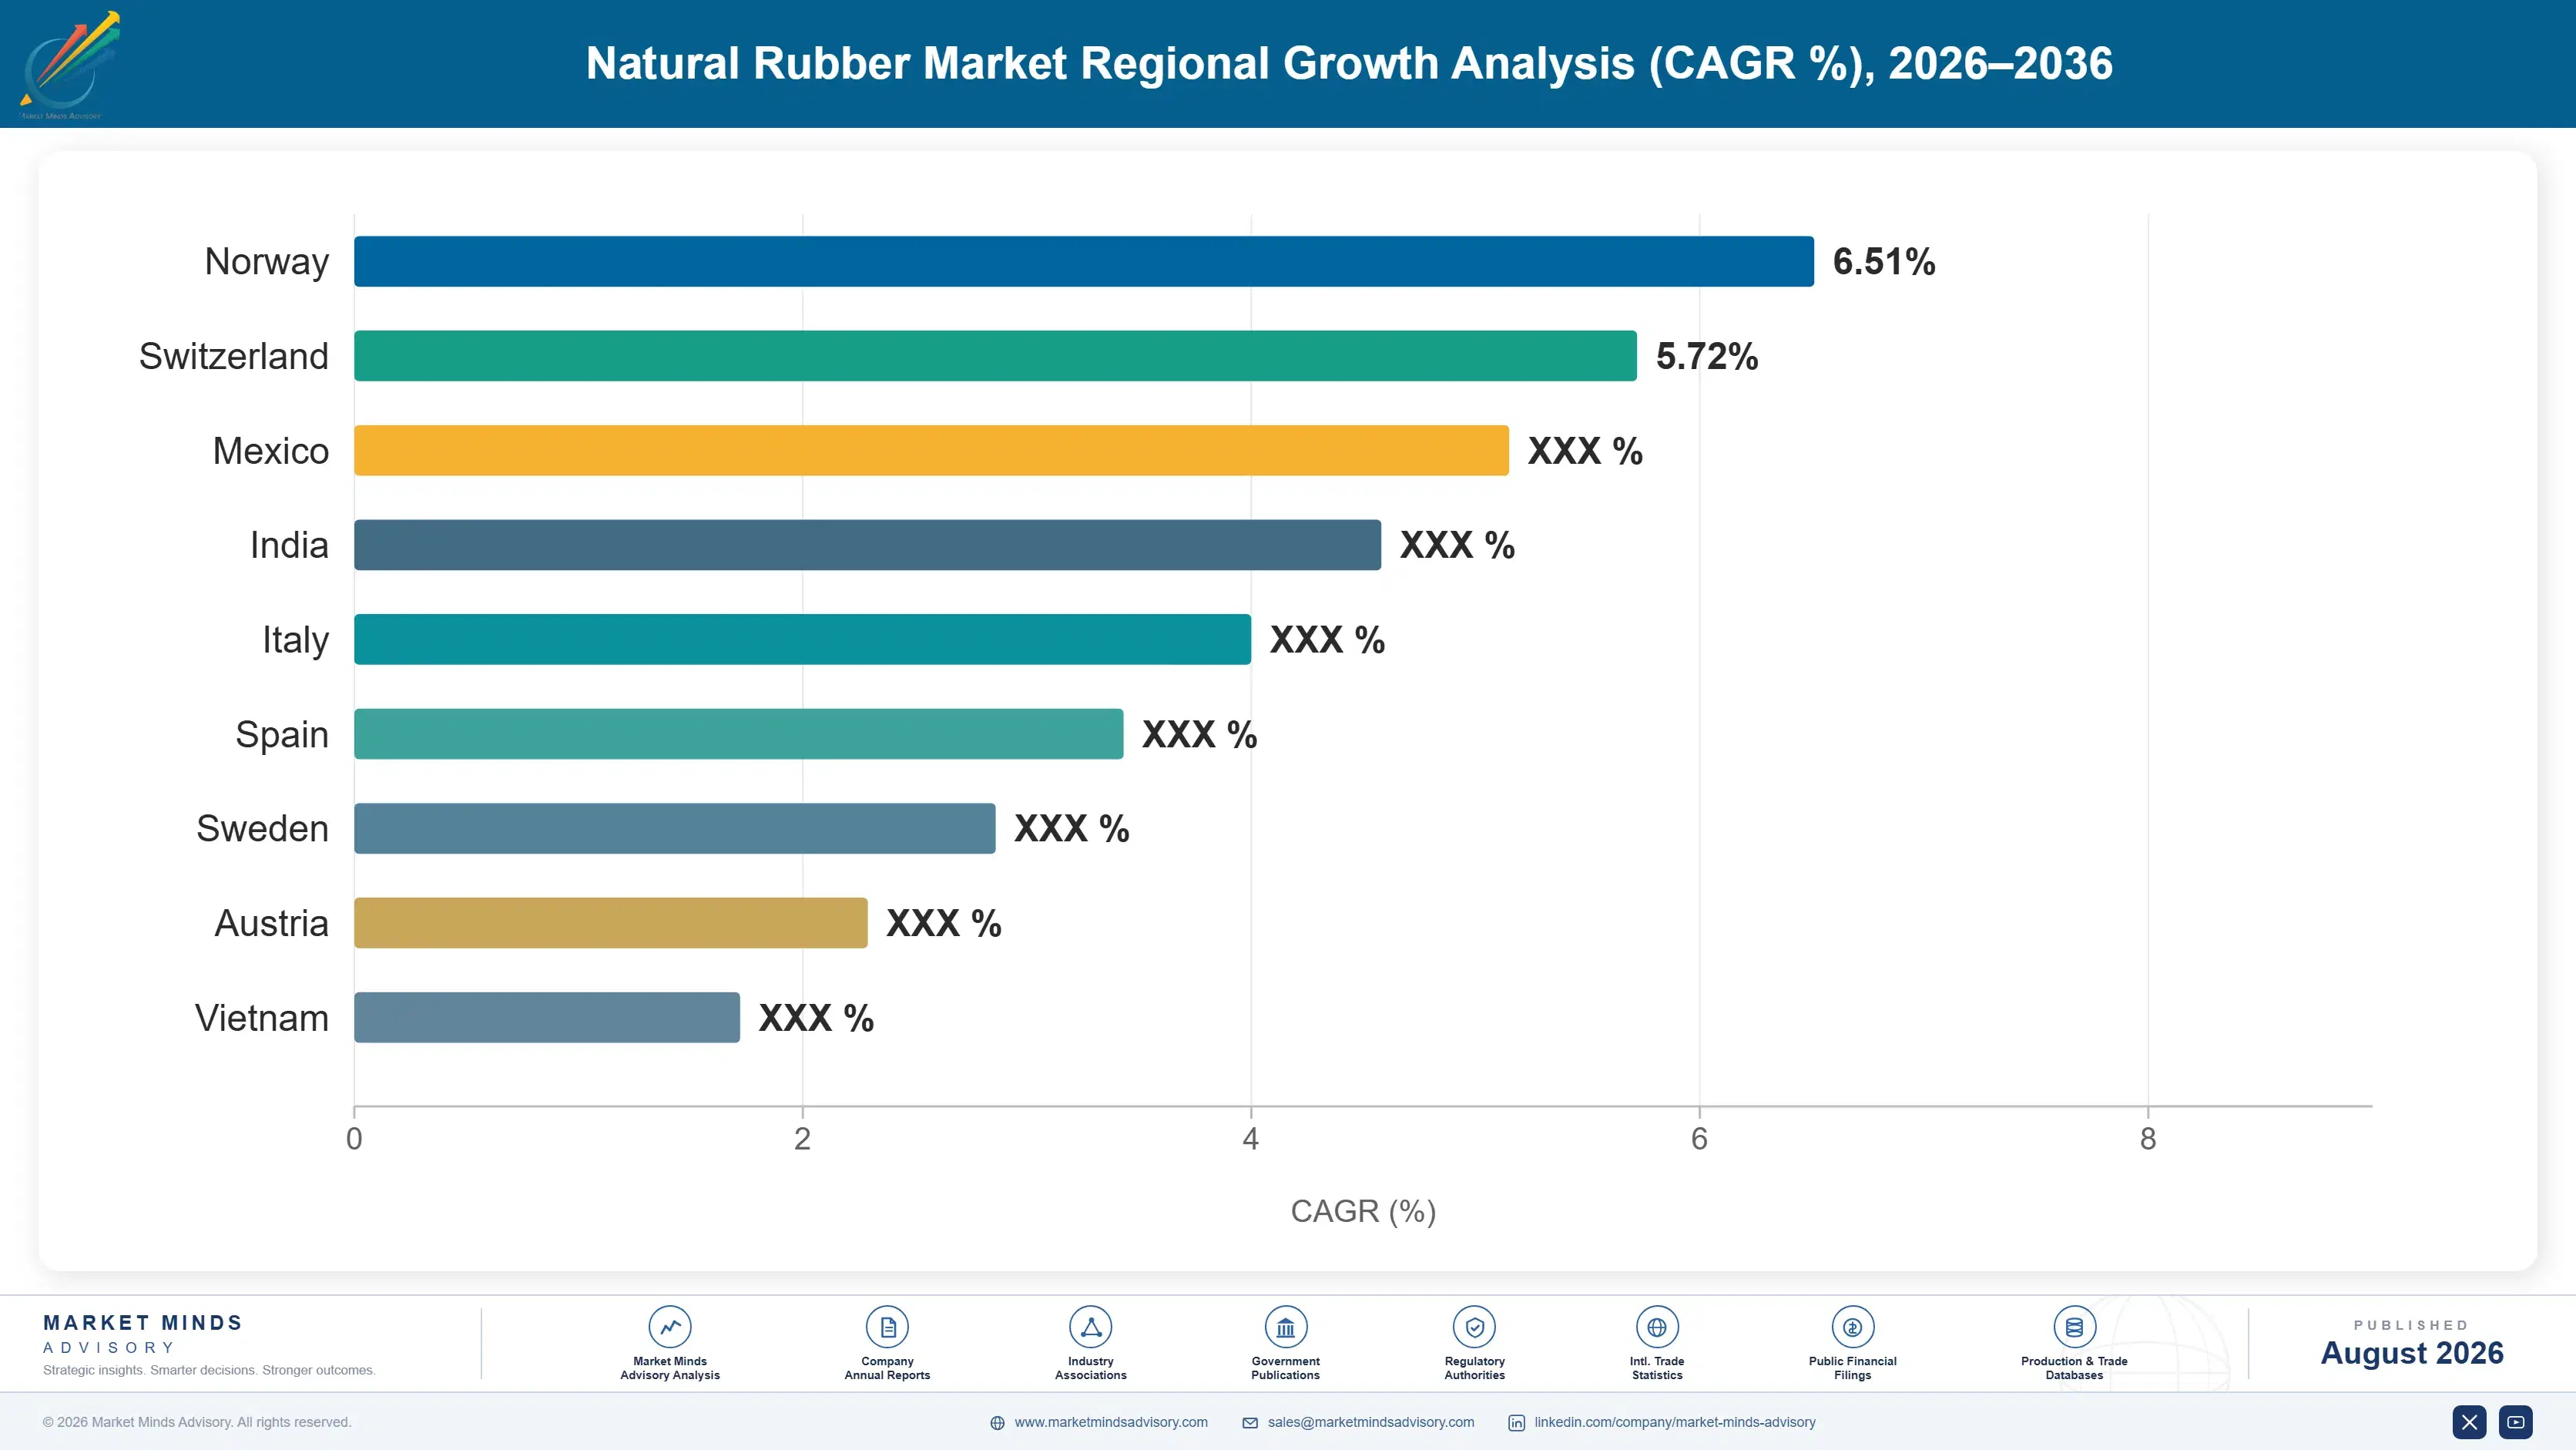
natural-rubber-market-trends-country-cagr-analysis-1787555895105

Where Rubber Margin Now Sits

Four moves matter in a commodity where the supply base is millions of farms that nobody has ever mapped and the demand base cannot substitute away from it. Two concern the traceability requirement now splitting this market in two, and the other two concern a supply constraint that is already fixed in the ground and cannot be undone.

Map farms before compliance becomes a shortage

Only around 27% of world volume can document the plot it grew on, while European rules require exactly that for every consignment. Processors who invest in mapping smallholder plots and registering them build supply that competitors cannot assemble quickly, because the work is field work across thousands of farms rather than a documentation exercise. Compliant material already trades at a premium to untraceable volume. That premium widens as European buyers approach their own deadlines and discover how little qualifying supply exists. Field survey across thousands of farms takes seasons to complete.
Market Impact: Addresses the 73% of volume lacking any traceability

Contract West African supply for compliance advantage

Côte d'Ivoire and neighbouring producers have expanded faster than any other origin over the past decade, and their estate and outgrower structures are considerably more organised than Southeast Asian smallholder networks, which makes plot documentation genuinely achievable rather than aspirational. That converts a production position into a compliance position worth real premium into Europe. Buyers building European supply chains around West African material are solving traceability and growth together, while competitors negotiate with village dealer networks that keep no records at all. Only about 27% of world volume can document its plot at all.
Market Impact: Serves the traceable 27% of world volume directly

Contract long against the committed planting shortfall

Replanting is running roughly 41% below the rate that sustains output, a tree takes seven years to reach tapping, and the ageing profile of the world's tapped area is therefore already determined regardless of prices now. Buyers securing multi-year supply at current terms are contracting ahead of a constraint their counterparties have not priced. Sellers doing the same are giving away the only real optionality in this market. Which side of that trade to take depends entirely on whether a participant grows the material or consumes it. Neither side can change what will be tappable in 2033.
Market Impact: Prices against a 41% shortfall in committed planting

Serve latex grades with cold chain and preservation discipline

Concentrated latex compounds at 5.7%, the fastest grade here, on glove demand that settled well above its pre-pandemic base as infection control became routine. The grade needs ammonia preservation and temperature discipline that dried rubber does not, which limits economic shipping distance and rewards processors sited close to glove manufacture. Malaysian and Thai capacity dominates for exactly that reason. Participants treating latex as another grade of block rubber lose it on quality complaints rather than on price. Malaysian and Thai capacity dominates for exactly that reason, and the grade already carries margin several points above dried block rubber.
Market Impact: Serves the fastest grade, growing at 5.7% annually

Who Controls the Margin Pool

Five participants hold only 22% of this market, measured on tonnage of dry rubber content at first commercial sale, the basis used throughout this section. That fragmentation is unavoidable when around 85% of supply comes from smallholders selling into village dealer networks. Processors and trading houses aggregate rather than produce, and their position rests on origin relationships rather than on any asset. Origin relationships are the whole business.
Competition runs on four dimensions. Origin network breadth, since a buyer needs continuous supply through disease outbreaks, drought and price-driven tapping stoppages alike. Traceability capability, which now determines European market access outright rather than merely influencing it. Grade range across block, sheet, latex and modified material. And working capital depth, because aggregating from millions of farms is a financing business at least as much as a processing one.

Rankings shift toward participants who have genuinely mapped farms and toward those holding West African positions where documentation is achievable rather than aspirational. Chinese state-linked traders are expanding origin control steadily. Consuming tyre manufacturers are increasingly contracting direct to compliant processors rather than through traders, which compresses the trading layer considerably.
natural-rubber-market-trends-company-positioning-matrix-1787555895622

Competitive Moat and Risk Dimensions

SRI TRANG AGRO-INDUSTRY

Moat: Thai origin network depth

The company aggregates from an unusually broad Thai smallholder network built over decades, which delivers supply continuity through disease outbreaks and price-driven tapping stoppages that break thinner sourcing arrangements. Downstream glove manufacture consumes latex internally, which loads processing capacity without depending on merchant sale and gives the group visibility across the full chain.
SRI TRANG AGRO-INDUSTRY

Risk: Thai concentration and labour scarcity

Tapping labour at roughly 62% of smallholder cost is becoming scarce fastest in Thailand and Malaysia as rural wages converge with factory employment, which constrains output regardless of price. Concentration in one origin also concentrates leaf fall disease exposure. Participants building West African positions access growth and easier traceability compliance at the same time.
HALCYON AGRI

Moat: Multi-origin traceability investment

The group operates processing across both Southeast Asian and African origins and has invested substantially in farm-level mapping and digital origin documentation ahead of the European requirement. That combination gives it compliant supply at a moment when only around 27% of world volume can document its plot, which is a genuine commercial asset rather than a reporting exercise.
HALCYON AGRI

Risk: Capital intensity across scattered origins

Operating processing across many origins ties up working capital in a commodity whose price swings sharply and whose smallholder suppliers require prompt payment. Traceability investment adds cost ahead of the premium it earns. Participants concentrated in fewer origins carry lighter balance sheets and can wait for compliant material to command a wider premium before investing.

Players Tracked

Prominent Players

Sri Trang Agro-Industry
Halcyon Agri
Von Bundit
Southland Rubber
Thai Hua Rubber

Other Key Players

Sinochem International
Kirana Megatara
Thai Rubber Latex Group
Teck Bee Hang
Yunnan State Farms
Hainan Rubber Group
Socfin
SIPH
Tradewinds Plantation
Vietnam Rubber Group
Chip Lam Seng
Weber and Schaer
Corrie MacColl
Rubberex
Tong Thai Rubber

Recent Developments

JANUARY 2025

A processor completed plot mapping across a smallholder network

A major processor completed geolocation mapping of smallholder plots across a significant portion of its Thai supply base, registering coordinates against deliveries to meet European documentation requirements. This was internal operational investment rather than any acquisition, joint venture or partnership with another company. Coordinates now travel with each delivery.
Signal: Farm mapping is field work rather than documentation, which makes it slow to copy and genuinely defensible once completed
MAY 2025

A tyre manufacturer contracted directly with an African processor

A tyre manufacturer signed a multi-year supply agreement with a West African processor, citing traceable origin documentation and production growth as the rationale for bypassing traditional trading intermediaries. This was a supply agreement rather than any equity investment or joint venture arrangement. Volumes committed extend across several years.
Signal: Consuming manufacturers are now contracting direct to compliant processors, which compresses the traditional trading layer considerably
SEPTEMBER 2025

A producing country announced replanting subsidy expansion

A major producing country expanded replanting subsidy provisions for smallholders, responding to an ageing tree profile and yields declining on affected area. This was a government policy measure rather than any commercial transaction between companies in the supply chain. Uptake among smallholders is expected to build slowly across several seasons.
Signal: Policy responses arrive seven years before any output effect, which is the fundamental timing problem in this commodity

What Sets Delivered Cost

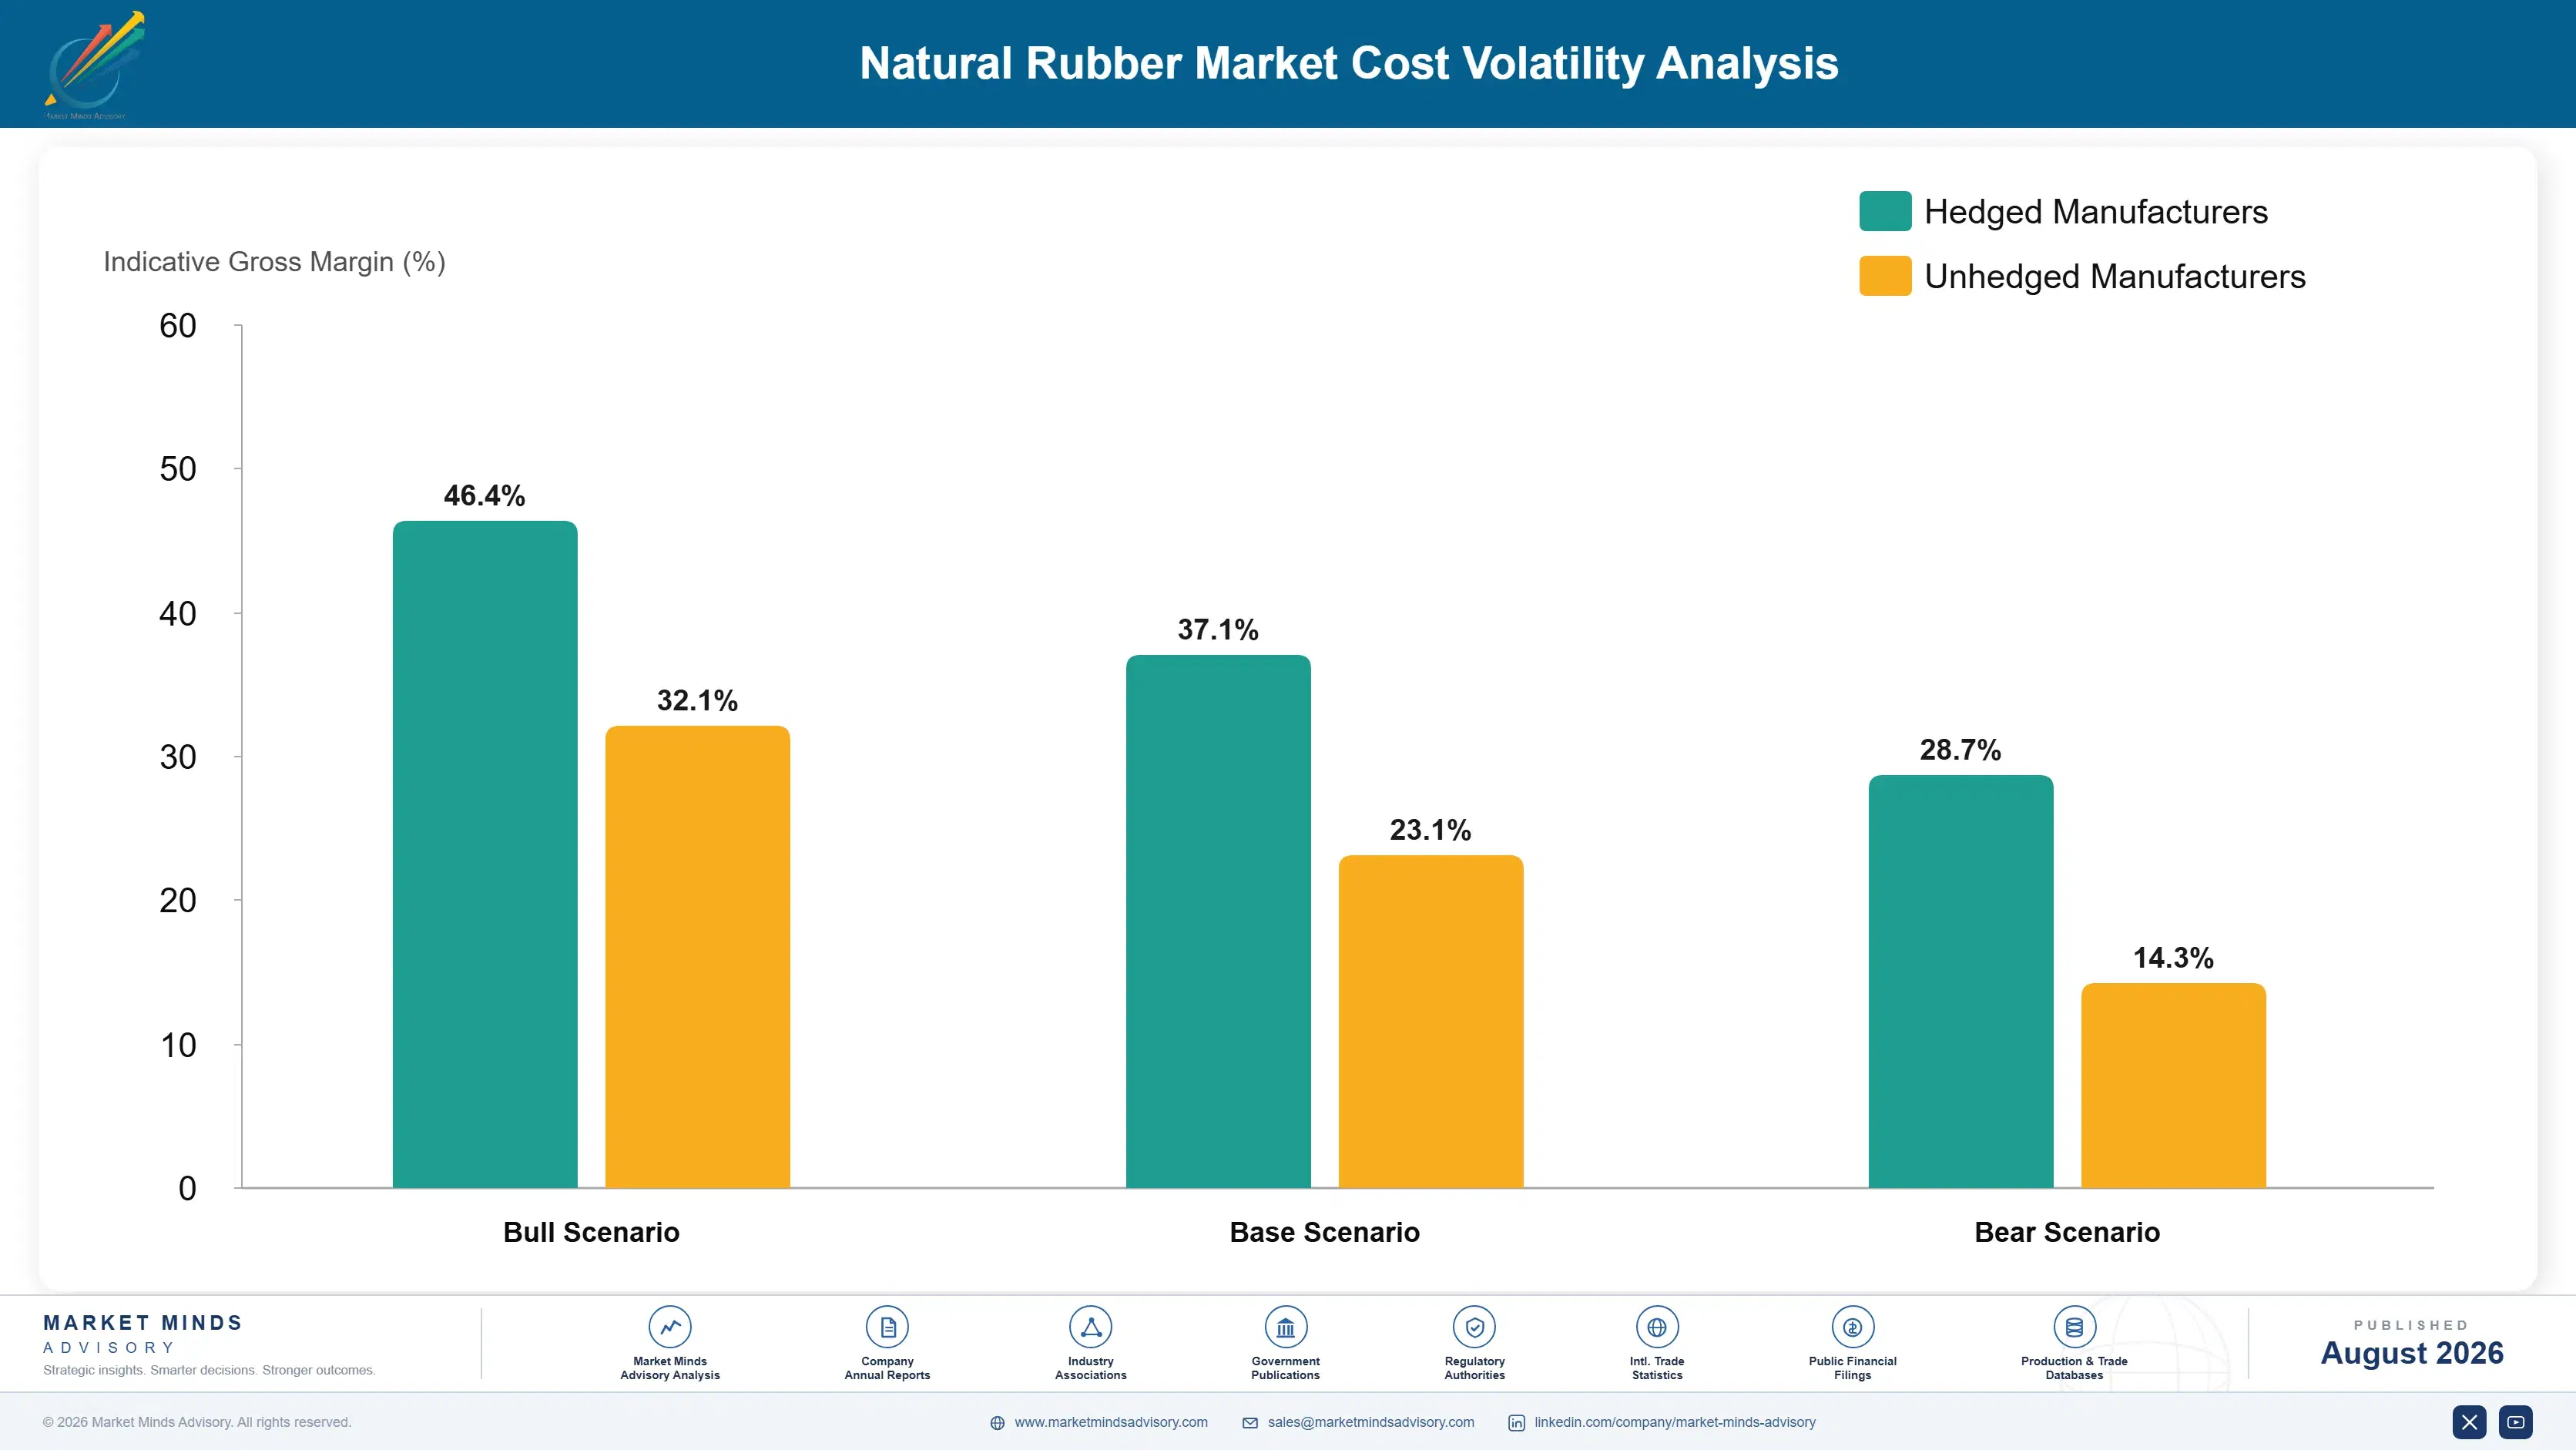
Field material purchased from smallholders and dealers accounts for roughly 81% of processor cost, which leaves conversion margin thin and highly sensitive to purchase discipline. Within the smallholder's own economics, tapping labour takes around 62%, fertiliser and estate maintenance most of the rest. Processing energy and coagulation chemicals are modest by comparison. Working capital carrying cost is significant because payment to farmers is prompt and buyer terms are not.
Natural rubber prices moved sharply through 2024 as Thai and Indonesian output fell on leaf fall disease and adverse weather together. Sri Trang Agro-Industry recorded raw material cost pressure across its operations in its Annual Report 2024. Processors on fixed-price forward commitments absorbed most of the movement, and several processors with thin working capital reduced purchasing volumes rather than fund inventory at those elevated field prices.

The disadvantage falls on processors without financing depth, and it operates through purchasing capacity rather than through unit cost. When field prices rise, a processor must fund the same tonnage at higher cost immediately while receiving payment later, so the thinly capitalised simply buy less. Traceability investment compounds this, since farm mapping costs money now against a premium earned later, and smaller processors defer it.
natural-rubber-market-trends-cost-volatility-analysis-1787555895819

Fund farm mapping as a supply access investment, not compliance

Only around 27% of world volume can document its plot, and European market access now depends on it entirely. Treating mapping as a compliance cost invites deferral, while treating it as securing access to a premium buyer segment gets it funded. The work is field survey across thousands of farms and takes seasons, so late starters cannot catch up quickly.

Match forward sales to secured field purchasing capacity

Field material at roughly 81% of cost means a processor selling forward without funded purchasing capacity is short a commodity that can move sharply within weeks. Smallholders stop tapping when price falls below the value of the labour, so supply tightens fast. Matching commitments to financed purchasing avoids buying into a squeeze at any price.

Diversify origins across disease and weather exposure

Leaf fall disease has cut yields across Indonesian, Thai and Malaysian area since 2019, and clone populations are genetically narrow enough that a single pathogen affects wide geographies at once. West African origins carry different exposure and have grown faster than anywhere. Multi-origin sourcing costs more to operate and delivers continuity that single-origin processors cannot offer buyers.

Portfolio Architecture for Margin Defence

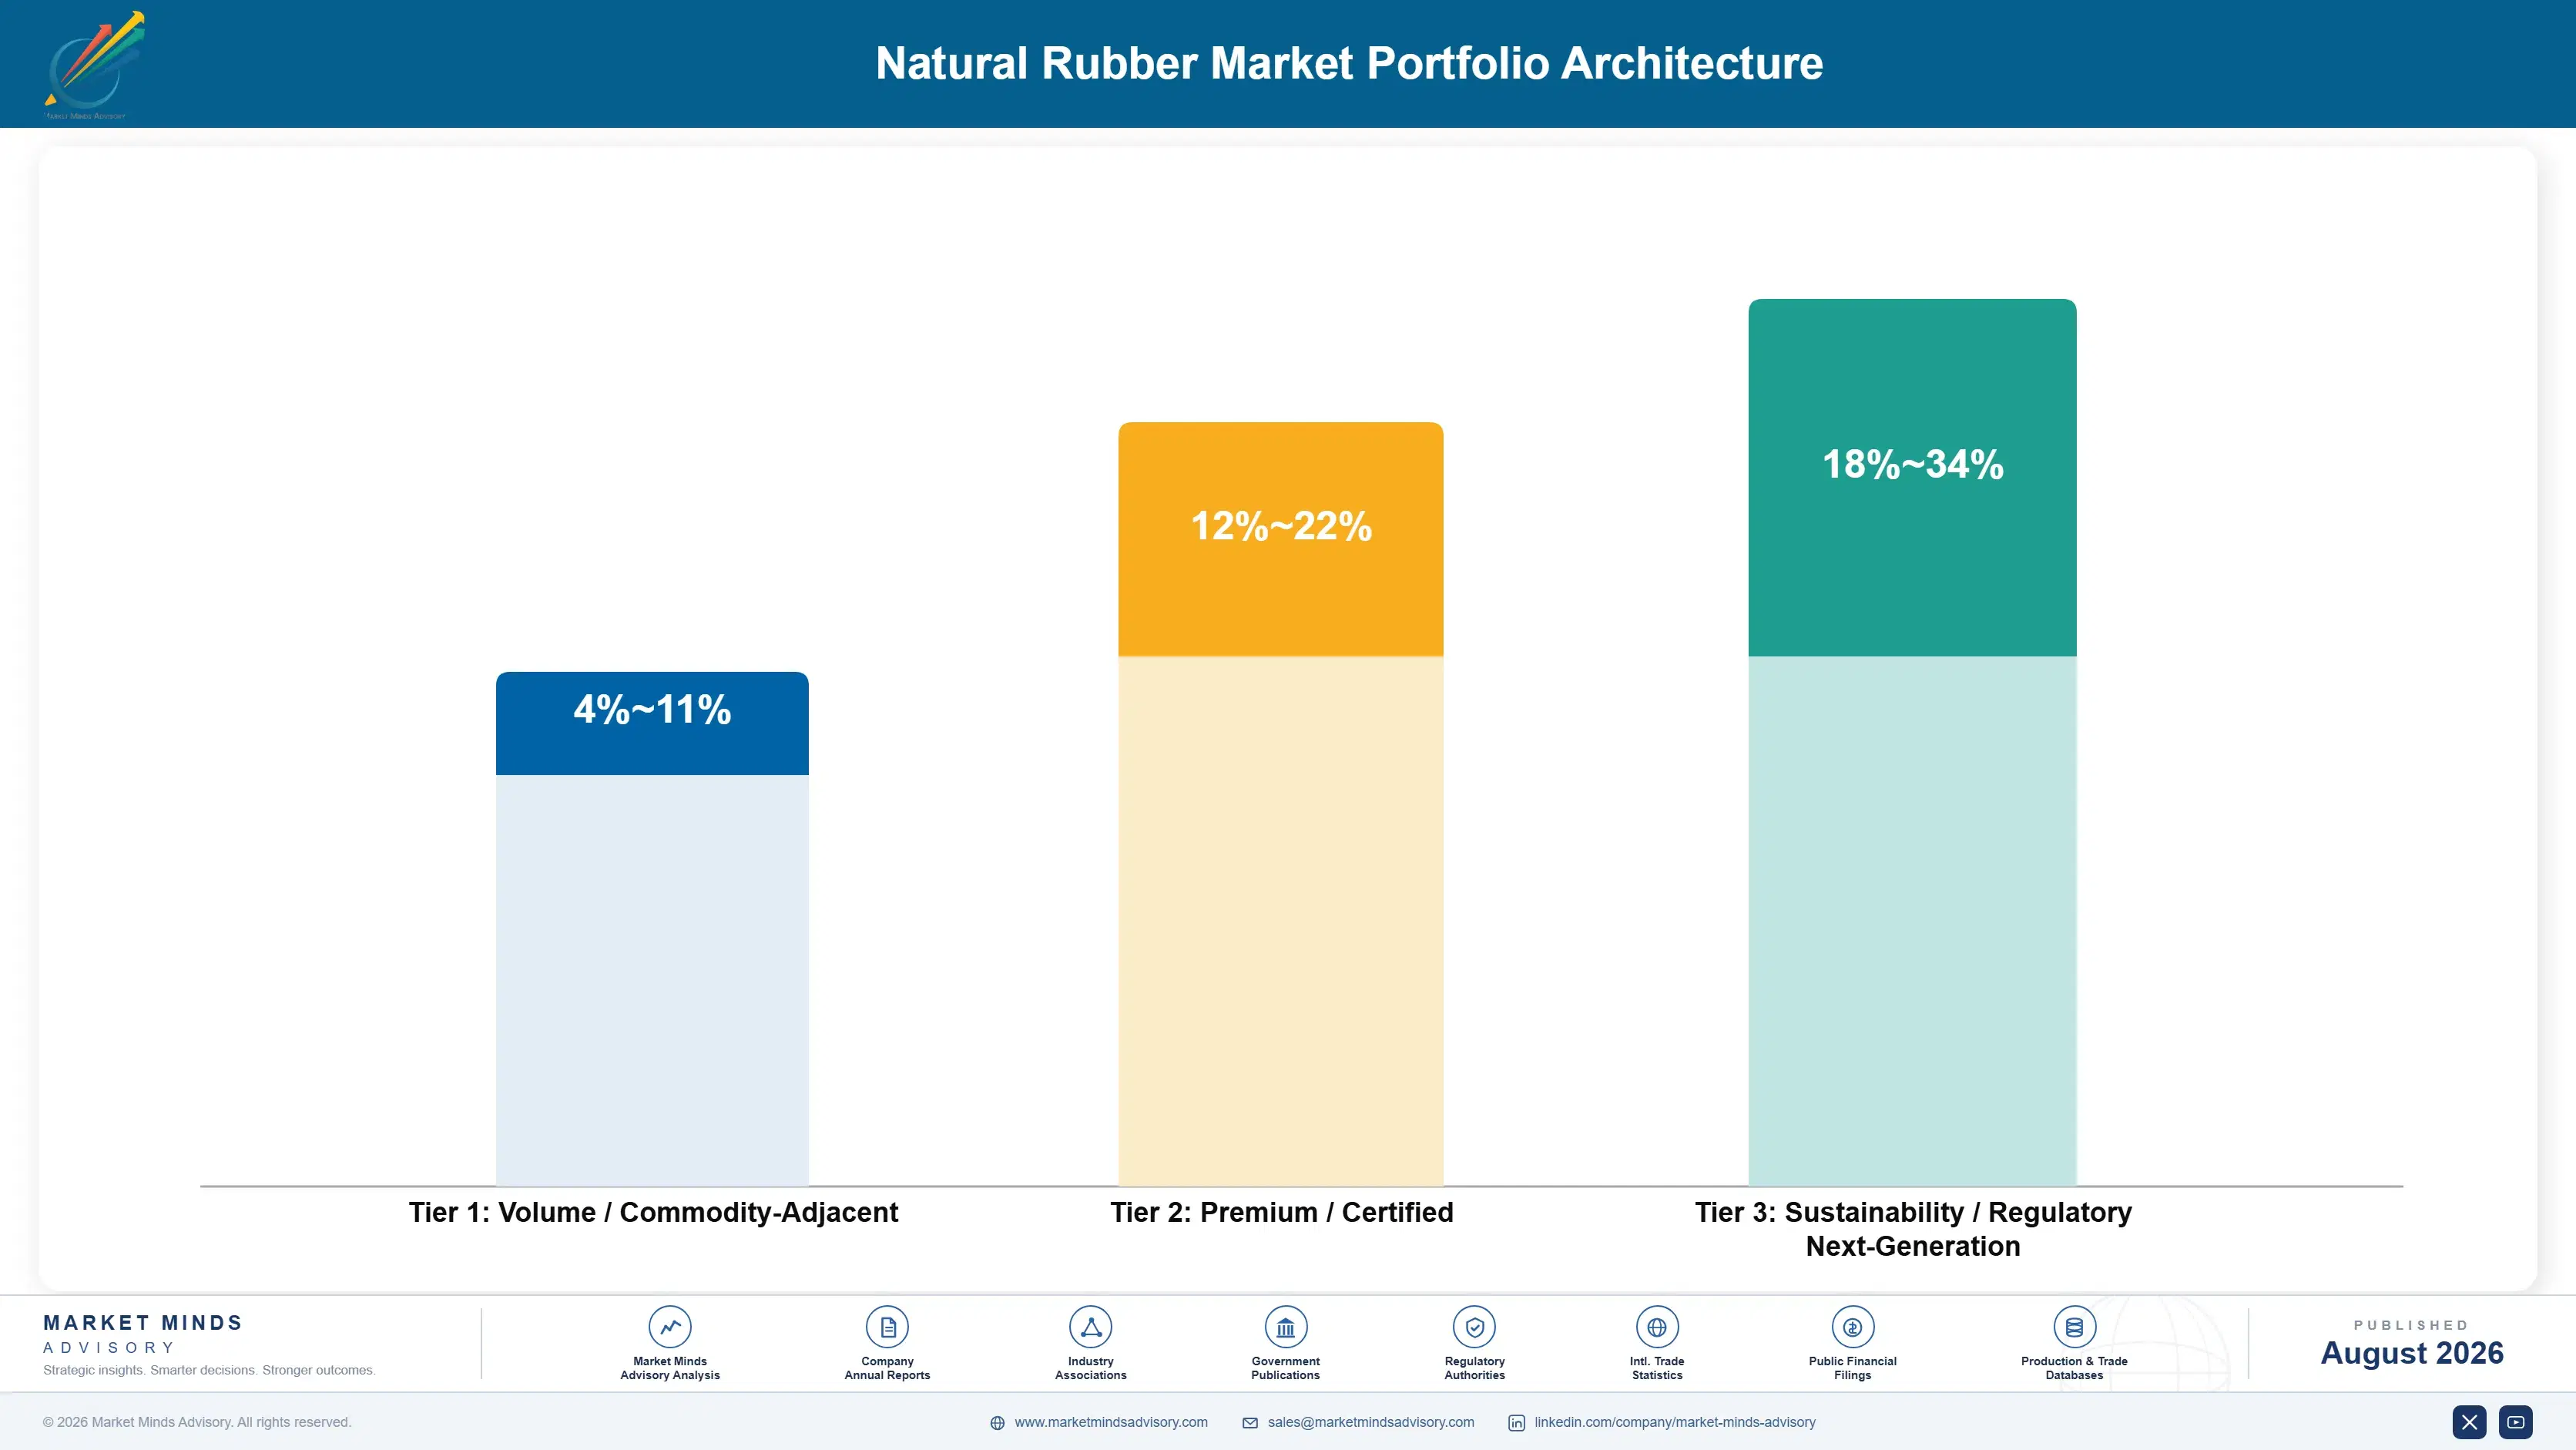
Margin here is thin across the board and it separates on documentation and grade rather than on scale. Standard block rubber sold on specification runs at gross margins in the mid single digits, because the grade is fungible and buyers compare landed cost across origins without sentiment. Concentrated latex runs better on preservation and handling requirements that narrow the supplier field. Traceable documented material earns a genuine premium today. Epoxidised and modified grades run higher again on technical content.
The tension is that volume sits in undifferentiated block rubber while the emerging premium sits in documentation that costs money now and pays later. Processors funding farm mapping do it from margins already thin, and several have concluded they will wait until the premium widens. That decision looks prudent quarterly and looks poor across three years, since mapping is field work that cannot be accelerated once buyers are already asking.

High-value pools sit in traceable documented supply, concentrated latex and modified grades. Undocumented block rubber is where the market is heading toward a discount that has not fully arrived yet. Buyers are already asking questions that separate the two.

Volume / Commodity-Adjacent

Standard technically specified block rubber and sheet sold on grade specification against every other origin. The seven-point range separates processors with financed purchasing capacity and origin depth from those buying opportunistically on the field market.
Gross Margin: 4%-11%

Premium / Certified

Concentrated latex and consistent high-grade material where preservation, handling and quality discipline narrow the supplier field considerably. The ten-point spread reflects cold chain capability and proximity to glove manufacture rather than any grade difference.
Gross Margin: 12%-22%

Sustainability / Regulatory / Next-Generation

Plot-documented traceable supply and epoxidised or modified grades. The sixteen-point range is wide because the traceability premium is still forming and varies enormously between buyers approaching compliance deadlines and those who are not.
Gross Margin: 18%-34%
natural-rubber-market-trends-portfolio-architecture-1787555896315

High-value Sub-segments and Strategic Watch-out

Plot-Documented Traceable Supply

Only around 27% of volume qualifies and European market access depends on it entirely. The premium widens as buyers approach deadlines and discover how little compliant material exists, and mapping cannot be accelerated once demand arrives. Slow field survey work is the whole barrier here.
Gross Margin: 18%-32%

Concentrated Latex Grades

Compounding at 5.7% on glove demand that settled above its pre-pandemic base. Ammonia preservation and cold chain discipline limit shipping distance and narrow the supplier field, which supports margin better than any dried grade manages. Proximity to glove manufacture is what actually decides position here.
Gross Margin: 13%-24%

Standard Block Rubber

The volume base, fungible across origins and compared on landed cost alone. Manage this for financed purchasing capacity and origin breadth rather than for margin, which is not going to improve at all. Landed cost across competing origins is the only comparison buyers ever make.
Gross Margin: 4%-11%

Modified and Epoxidised Grades

Growing at 5.0% on tyre compound development and specialty engineering demand. Malaysian technical capability dominates through decades of public research, and volumes stay small enough that this remains a capability business. Technical development rather than supply position decides who wins. Volumes stay modest and pricing stays well above commodity grades.
Gross Margin: 22%-34%

How Rubber Demand Persists

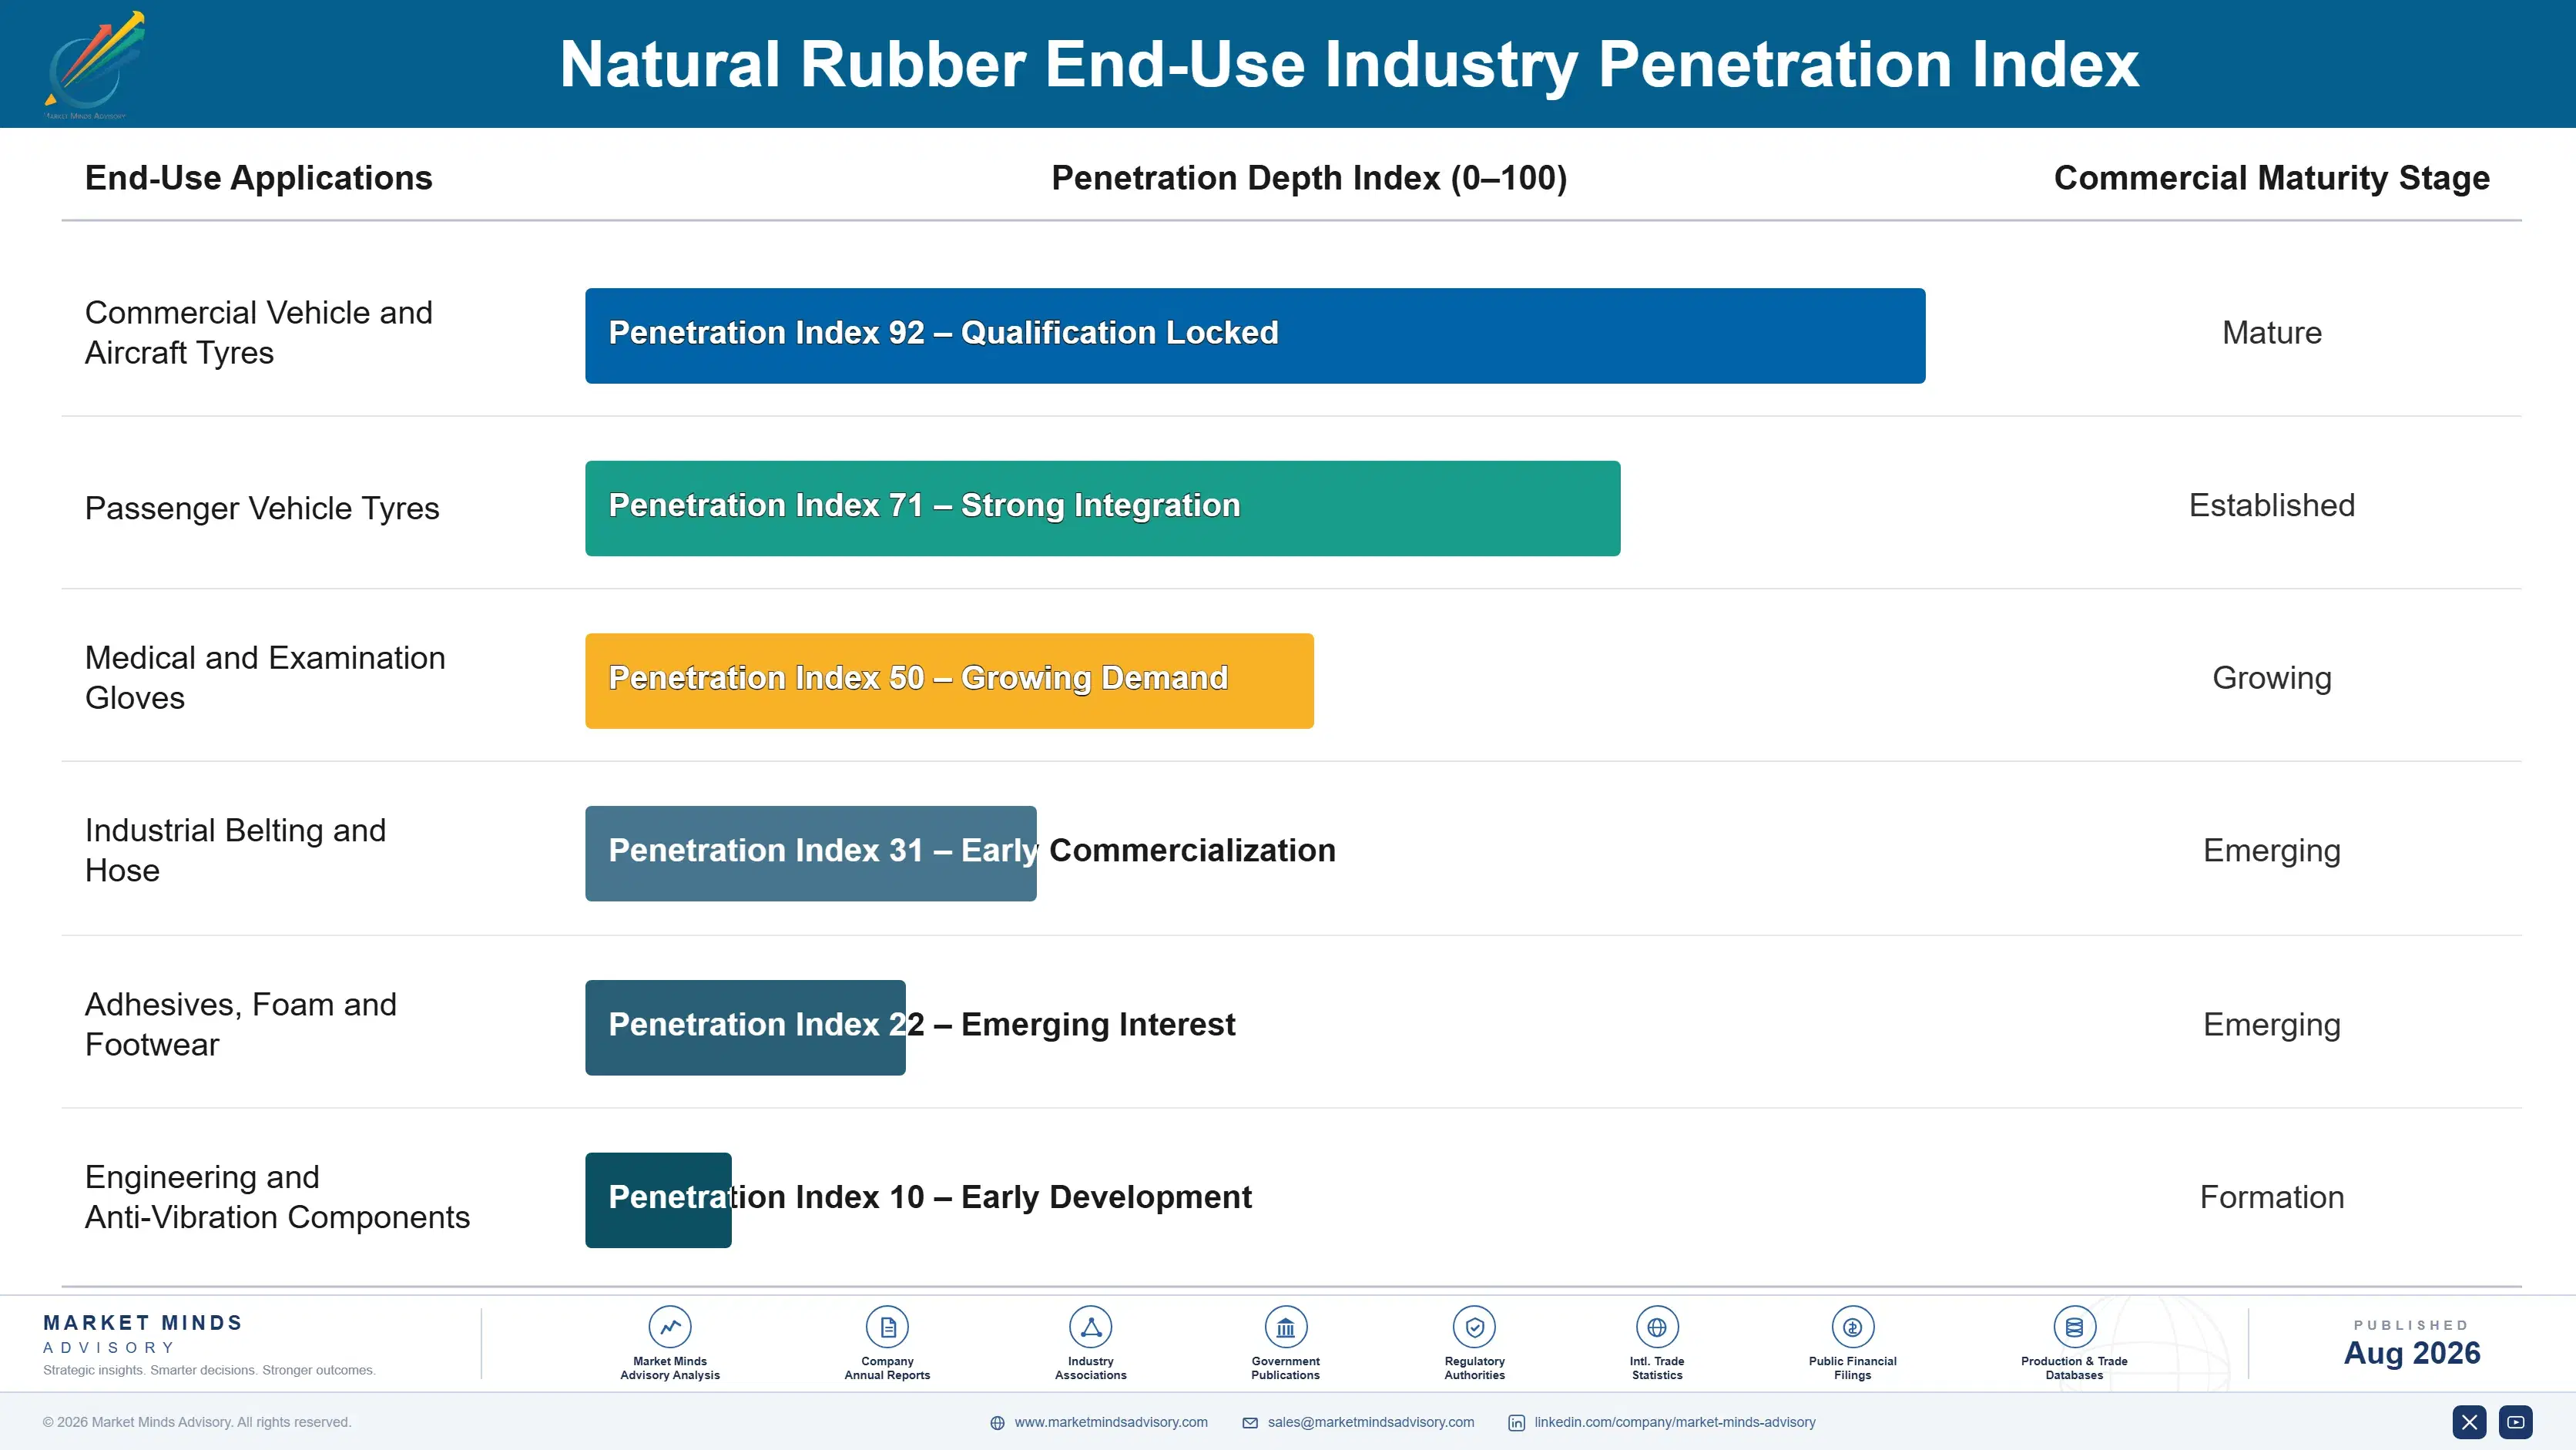
Demand here renews with vehicle kilometres rather than with vehicle sales, which makes it far steadier than most industrial commodities and far less cyclical than tyre manufacturers themselves. Replacement tyres are consumed continuously by fleets that must keep running, and a truck operator defers many things before deferring a tyre change. That produces an annuity underneath the visible order flow that survives recessions considerably better than original equipment volume does.
Adoption depth varies sharply by vertical and it follows whether substitution is even possible. Commercial vehicle and aircraft tyres are locked in permanently, since strain crystallisation is a property no synthetic delivers. Passenger tyres substituted decades ago and will not return. Gloves, adhesives and foam sit in between, competing against nitrile and synthetic latex on price and allergen considerations rather than on any performance requirement.

The buyer has changed most at the compliance end rather than the technical end. Purchasing was a price and grade conversation with a trading house. It now involves sustainability teams asking which plots material came from, and those people can veto a supplier whose price and quality are both perfectly acceptable.
natural-rubber-market-trends-end-use-penetration-index-1787555896804

Where To Place The Bet

These are among the four positions where our research anticipates prominent divergence between winners and laggards over the coming forecast period. Each is grounded in the demand model, the regulatory perimeter, and the announced capacity pipeline.
01 / ORIGIN DOCUMENTATION INVESTMENT

Map the farms before the premium becomes access

Only around 27% of world natural rubber volume can currently document the plot it grew on, while European rules require precisely that geolocation for every single consignment entering the Union. Processors treating this as a reporting requirement will defer it, and processors treating it as securing access to the highest-paying buyer segment will fund it properly. The work is field survey across thousands of smallholder plots and takes seasons to complete, which means late starters simply cannot catch up once buyers begin asking.
02 / WEST AFRICAN SOURCING

Buy where documentation is actually achievable today

Côte d'Ivoire and its neighbours have expanded production faster than any other origin over the past decade, and their estate and outgrower structures keep records that Southeast Asian village dealer networks simply do not maintain in any form. That turns a production growth position into a compliance position carrying real premium into European markets. Participants building supply chains around West African material solve traceability and volume growth in the same decision, rather than pursuing each of them separately and considerably more expensively than they need to.
03 / PLANTING GAP POSITIONING

Take the side of a supply constraint already committed

Replanting is running roughly 41% below the rate that sustains current output, a rubber tree needs seven years before it can be tapped, and the ageing profile of the world's tapped area is therefore already fixed regardless of what prices do from here. Buyers who contract multi-year supply now are pricing ahead of a constraint their counterparties have not yet recognised. Sellers doing precisely the same thing are surrendering the only genuine optionality this commodity currently offers anybody at all.
04 / LATEX HANDLING CAPABILITY

Treat concentrated latex as a separate physical business

Concentrated latex compounds at 5.7%, the fastest grade in this market, on glove demand that settled well above its pre-pandemic base as infection control became routine practice across healthcare and food handling. The grade requires ammonia preservation and temperature discipline that dried rubber never needs, which limits economic shipping distance considerably and rewards processors sited close to glove manufacture. Participants who handle it as simply another grade of block rubber lose the business on quality complaints rather than on price.

Engagement Snapshot From the Field

A live engagement with an industry participant carrying material or product regulatory and market exposure ahead of a defining policy shift, showing how our research translates into a defensible multi-year portfolio strategy.
MARKET MINDS ADVISORY · CLIENT ENGAGEMENT SUMMARY
Natural Rubber Producer Strategic Portfolio Review and Transition Roadmap 2026·Investment Scenario on Natural Rubber Exposure Evaluation 2025-26
CLIENT PROFILE
A Southeast Asian natural rubber processor handling around 190,000 tonnes annually (client-reported, unverified by MMA), supplying block rubber and sheet to tyre manufacturers across Asian and European markets. Sourcing ran entirely through village dealer networks. No farm-level documentation existed. European customers represented roughly a third of volume. Margins had been compressing steadily for two years running.
STRATEGIC CHALLENGE
European customers had begun requesting plot-level origin documentation the company could not provide for any of its volume, and management assumed a declaration from dealers would satisfy the requirement. Nobody had established what the rules actually demanded or how long building genuine documentation would take. Time had been assumed rather than checked.
MMA APPROACH
MMA established the documentation standard European buyers were actually applying rather than the one assumed, then mapped the client's dealer network to determine how many distinct farms sat behind its volume. Mapping cost and timeline were modelled against the European revenue at risk. Alternative origin sourcing was assessed as a partial substitute.
KEY FINDINGS
  1. Dealer declarations did not meet the standard European buyers were applying, which meant the entire third of volume going to Europe was at risk rather than merely subject to additional paperwork.
  2. Roughly 11,000 distinct smallholder farms sat behind the client's volume, and mapping them would take two full seasons of field survey work that could not be compressed.
  3. Two competitors had already begun mapping and were quoting compliant material at a premium, which explained recent tender losses management had attributed entirely to price.
  4. West African material could substitute for part of the European volume during the mapping period, at a landed cost premium far smaller than the revenue otherwise at risk.
CLIENT PROFILE
A Southeast Asian natural rubber processor handling around 190,000 tonnes annually (client-reported, unverified by MMA), supplying block rubber and sheet to tyre manufacturers across Asian and European markets. Sourcing ran entirely through village dealer networks. No farm-level documentation existed. European customers represented roughly a third of volume. Margins had been compressing steadily for two years running.
STRATEGIC CHALLENGE
European customers had begun requesting plot-level origin documentation the company could not provide for any of its volume, and management assumed a declaration from dealers would satisfy the requirement. Nobody had established what the rules actually demanded or how long building genuine documentation would take. Time had been assumed rather than checked.
MMA APPROACH
MMA established the documentation standard European buyers were actually applying rather than the one assumed, then mapped the client's dealer network to determine how many distinct farms sat behind its volume. Mapping cost and timeline were modelled against the European revenue at risk. Alternative origin sourcing was assessed as a partial substitute.
KEY FINDINGS
  1. Dealer declarations did not meet the standard European buyers were applying, which meant the entire third of volume going to Europe was at risk rather than merely subject to additional paperwork.
  2. Roughly 11,000 distinct smallholder farms sat behind the client's volume, and mapping them would take two full seasons of field survey work that could not be compressed.
  3. Two competitors had already begun mapping and were quoting compliant material at a premium, which explained recent tender losses management had attributed entirely to price.
  4. West African material could substitute for part of the European volume during the mapping period, at a landed cost premium far smaller than the revenue otherwise at risk.
RECOMMENDED STRATEGY
Phase 1: Phase one: begin field mapping immediately across the highest-volume dealer catchments, sequencing by European customer exposure rather than by geographic convenience. Phase 2: Phase two: contract West African supply to bridge European commitments through the two seasons that mapping requires to complete properly. Phase 3: Phase three: price documented material separately from undocumented volume rather than blending the two, so that the premium stays visible and defensible.
OUTCOME
Mapping covers roughly 60% of European-destined volume after one season and continues on schedule. West African bridging supply held two customer relationships that would otherwise have lapsed. Documented material now prices separately, and the client reports recovering the premium competitors had been taking (client-reported, unverified by MMA).

Frequently Asked Questions

Foundational context covering the market sizes, CAGR, scope, country, region and competition that inform every finding below. This section is provided to cover basics and most often pre-purchase conversations, answered from the MMA Primary Research Dataset.

What is the current size of the Natural Rubber Market?

The market was valued at USD 44.6 billion in 2025, rising to an estimated USD 46.29 billion in 2026. East Asia holds the largest regional share at 36% of value.

How large will the Natural Rubber Market be by 2036?

MMA forecasts USD 67.23 billion by 2036 under the base case, an expansion multiple of 1.45 times the 2026 value. That represents USD 20.94 billion of incremental value.

What is the CAGR for the Natural Rubber Market 2026 to 2036?

The base case runs at 3.8% compound annual growth between 2026 and 2036, with a bull case at 5.0% and a bear case at 2.6%. Historical growth from 2020 to 2025 was 2.8%.

Which segment is growing fastest?

Concentrated latex leads at 5.7%, half again the market rate, on glove demand that settled above its pre-pandemic base. Epoxidised and modified grades follow at 5.0%.

Who are the major companies in the Natural Rubber Market?

Sri Trang Agro-Industry, Halcyon Agri, Von Bundit, Southland Rubber and Thai Hua Rubber hold 22% between them. Fragmentation is unavoidable when smallholders grow 85% of supply.

Which country is growing fastest?

India leads at 6.2%, driven by commercial vehicle tyre manufacture expanding with road freight growth and by domestic processing capacity being added steadily across the country.

Report Segmentation Architecture

The full report scope spans multiple orthogonal segmentation dimensions, with cross-tabulated demand data provided for each dimension pair. Coverage extends further to regional breakdowns, trend trajectories, and the competitive detail needed to support segment-level decision-making.

By Commercial Grade

  • Technically Specified Block Rubber
  • Ribbed Smoked Sheet
  • Concentrated Latex
  • Crepe and Sheet Specialty Grades
  • Epoxidised and Modified Natural Rubber
  • Skim and Field Coagulum Grades

By End-Use Industry

  • Commercial Vehicle and Aircraft Tyres
  • Passenger Vehicle Tyres
  • Medical and Examination Gloves
  • Industrial Belting and Hose
  • Adhesives, Foam and Footwear
  • Engineering and Anti-Vibration Components

By Supply Channel

  • Direct Processor to Manufacturer
  • International Trading House
  • Producing Country Auction
  • Smallholder Cooperative Supply
  • Estate Integrated Supply

By Region

  • North America
  • Western Europe
  • East Asia
  • South Asia and Pacific
  • Latin America
  • Middle East and Africa
  • Eastern Europe

Scope, Methodology, and Coverage

Every figure in this report is reproducible from documented input assumptions. The scope below maps the historical period, the forecast horizon, the segmentation dimensions, and the countries covered, alongside the underlying primary and qualitative methodology.
Historical Period
2020 to 2025
Forecast Period
2026 to 2036
Base Year
2025 (USD billions; MMA Primary Research Dataset, August 2026)
Market Definition
The market comprises natural rubber from Hevea brasiliensis supplied in commercial grades, including technically specified block rubber, ribbed smoked sheet, concentrated latex, crepe and sheet specialty grades, epoxidised and modified natural rubber, and skim and field coagulum grades. Value is measured on tonnage of dry rubber content at first commercial sale by processors and trading houses across direct, trading, auction, cooperative and estate channels. Synthetic elastomers, reclaimed and devulcanised rubber, guayule and dandelion-derived rubber, rubberwood, and compounded rubber sold as a finished mixture fall outside scope.
Quantitative Units
USD billions (current prices); thousand tonnes dry rubber content; USD per tonne by grade and origin
Segmentation Dimensions
By Commercial Grade; By End-Use Industry; By Supply Channel; By Region
Regions Covered
North America, Western Europe, East Asia, South Asia and Pacific, Latin America, Middle East and Africa, Eastern Europe
Countries Covered
Thailand, Indonesia, Vietnam, Malaysia, India, Sri Lanka, Myanmar, Cambodia, China, Japan, South Korea, United States, Canada, Mexico, Brazil, Guatemala, Colombia, Germany, France, Italy, Spain, United Kingdom, Poland, Romania, Serbia, Côte d'Ivoire, Ghana, Nigeria, Liberia, Cameroon
Key Companies Profiled
Sri Trang Agro-Industry, Halcyon Agri, Von Bundit, Southland Rubber, Thai Hua Rubber, Sinochem International, Kirana Megatara, Thai Rubber Latex Group, Teck Bee Hang, Yunnan State Farms, Hainan Rubber Group, Socfin, SIPH, Tradewinds Plantation, Vietnam Rubber Group, Chip Lam Seng, Weber and Schaer, Corrie MacColl, Rubberex, Tong Thai Rubber
Quantitative Methodology
Primary survey, n=3,800 respondents, Q4 2025, six countries; demand-side model with trade association cross-validation
Qualitative Methodology
47 expert interviews, Q4 2025; applied to validate demand model assumptions, identify emerging dynamics, and assess competitive positioning
Report Format
PDF and XLSX data workbook (Word format preview document)
Publisher
Market Minds Advisory
Report Code
MMA-2026-CHM-723
Published
August 2026
Contact
sales@marketmindsadvisory.com | www.marketmindsadvisory.com

Purchase the full Natural Rubber Market Report (2026 to 2036).

The full report sizes the global natural rubber market to 2036 across six commercial grades and seven regions, measured on dry rubber content at first commercial sale. It quantifies traceability readiness by origin against European deforestation requirements and models the replanting shortfall as a committed supply constraint rather than a price-responsive one. Competitive analysis covers 20 processors and trading houses on one consistent tonnage basis, with moat and risk assessment for the two leaders. Substitution boundaries are mapped by tyre type and application. Four quantified revenue levers close the analysis.
Six-grade segment sizing with individual growth rates
Traceability readiness assessed origin by origin against European rules
Replanting shortfall modelled as a committed supply constraint
Substitution boundaries mapped by tyre type and application
Twenty-participant competitive map on one dry rubber basis
Four quantified revenue levers with commercial impact ranges

Built For The People Who Decide

From boardroom strategy to bench-side execution, this report is read cover-to-cover by leaders shaping the next decade of their industry, turning demand scenarios, market dynamics and valuation benchmarks into decisions.
CXOs/ Presidents/ VPs/ Managers
M&A and Corporate Development
Strategy Teams and R&D Heads
Procurement and Product Directors
Regulatory and Compliance Leaders
Investor Relations and Equity Analysts