Market Minds Advisory
Natural Cosmetics Market

Natural Cosmetics Market: Natural Cosmetics Market: Certification, Botanical Supply and the Retail Rules Nobody Voted For

Certification, not formulation, is the barrier. Botanical ingredient supply runs on agricultural cycles while retailer exclusion lists now function as private regulation, arriving faster than any statute in this category ever could.

Lead Analyst

Published

September 2026

Make Smarter Decisions with Customized Research Insights

Request a free sample report and evaluate market opportunities, growth trends, and competitive dynamics relevant to your business needs.

2025 MARKET VALUE$42.0BMarket Size 2025
2036 FORECAST VALUE$102.0BBase Case , 2026 to 2036
CAGR 2026 TO 20368.4 %Bull 9.6% / Bear 7.2%
INCREMENTAL OPPORTUNITY$56.5BNet 10- year value creation
EXPANSION MULTIPLE2.24x2036 value over 2026 base
Strategic Levers
M&A Pipeline
Regional Outlook
Country Rankings
Competitive Intelligence
Segmental Deep-dive
Call-Us : 91 93563 13602

Executive Snapshot and Market Trajectory.

Anybody can make a natural cosmetic. Very few can certify one, hold the certification through an ingredient shortage, and still ship it on time. That gap between formulation and provable compliance is where the commercial value in this category now sits. Nobody buys a claim they cannot check.
Certified natural skincare grows at 12.6%, half again the market rate of 8.4%, because the certification mark does the persuading that advertising used to do. East Asia holds 29% of demand and, more usefully, most of the formulation capability. Retailer ingredient exclusion lists at major beauty chains now gate shelf access ahead of any legislature, and brands that failed to anticipate them lost distribution rather than lost arguments. Nobody appealed that decision anywhere.
Concentration is moderate at 26%, and the five largest groups compete less with each other than with a long tail of founder-led brands that certification has made credible. Preservation is the technical constraint nobody advertises: natural systems give roughly 16 months of stability against 30 or more for conventional formulations, and that single number governs range breadth, distribution reach and working capital. Almost nobody outside the laboratory discusses it.
Market Definition
The natural cosmetics market covers finished personal care products formulated to a recognised natural or organic standard, spanning skincare, haircare, colour cosmetics, body and bath care, fragrance and oral hygiene. Scope includes products certified by COSMOS, NATRUE, Ecocert or an equivalent national scheme, and products marketed to a published natural ingredient policy without formal certification. Excluded are raw botanical ingredients sold to formulators, dietary supplements, pharmaceutical topicals, professional salon equipment and conventional products carrying only a single natural claim.
Base Year Value
$42.0B in 2025 (MMA Primary Research Dataset, August 2026)
Forecast Period
2026 to 2036, eleven discrete annual values
CAGR
8.4% base case. Bull 9.6%. Bear 7.2%.
Fastest Growth Segment
Certified Natural Skincare: 12.6% CAGR
Fastest Growth Country
India: 10.6% CAGR
Fastest Growth Region
South Asia and Pacific: 10.6% CAGR
Largest Region
East Asia: 29% of 2025 global value
Market Leaders
L'Oreal, Beiersdorf, Unilever, Amorepacific and Weleda. Source: MMA Analysis, July 2026.
Primary Survey
n=3,800 procurement and R&D decision-makers, Q4 2025, six countries
Methodology
Demand-side build-up, cross-validated against public data, 47 expert interviews

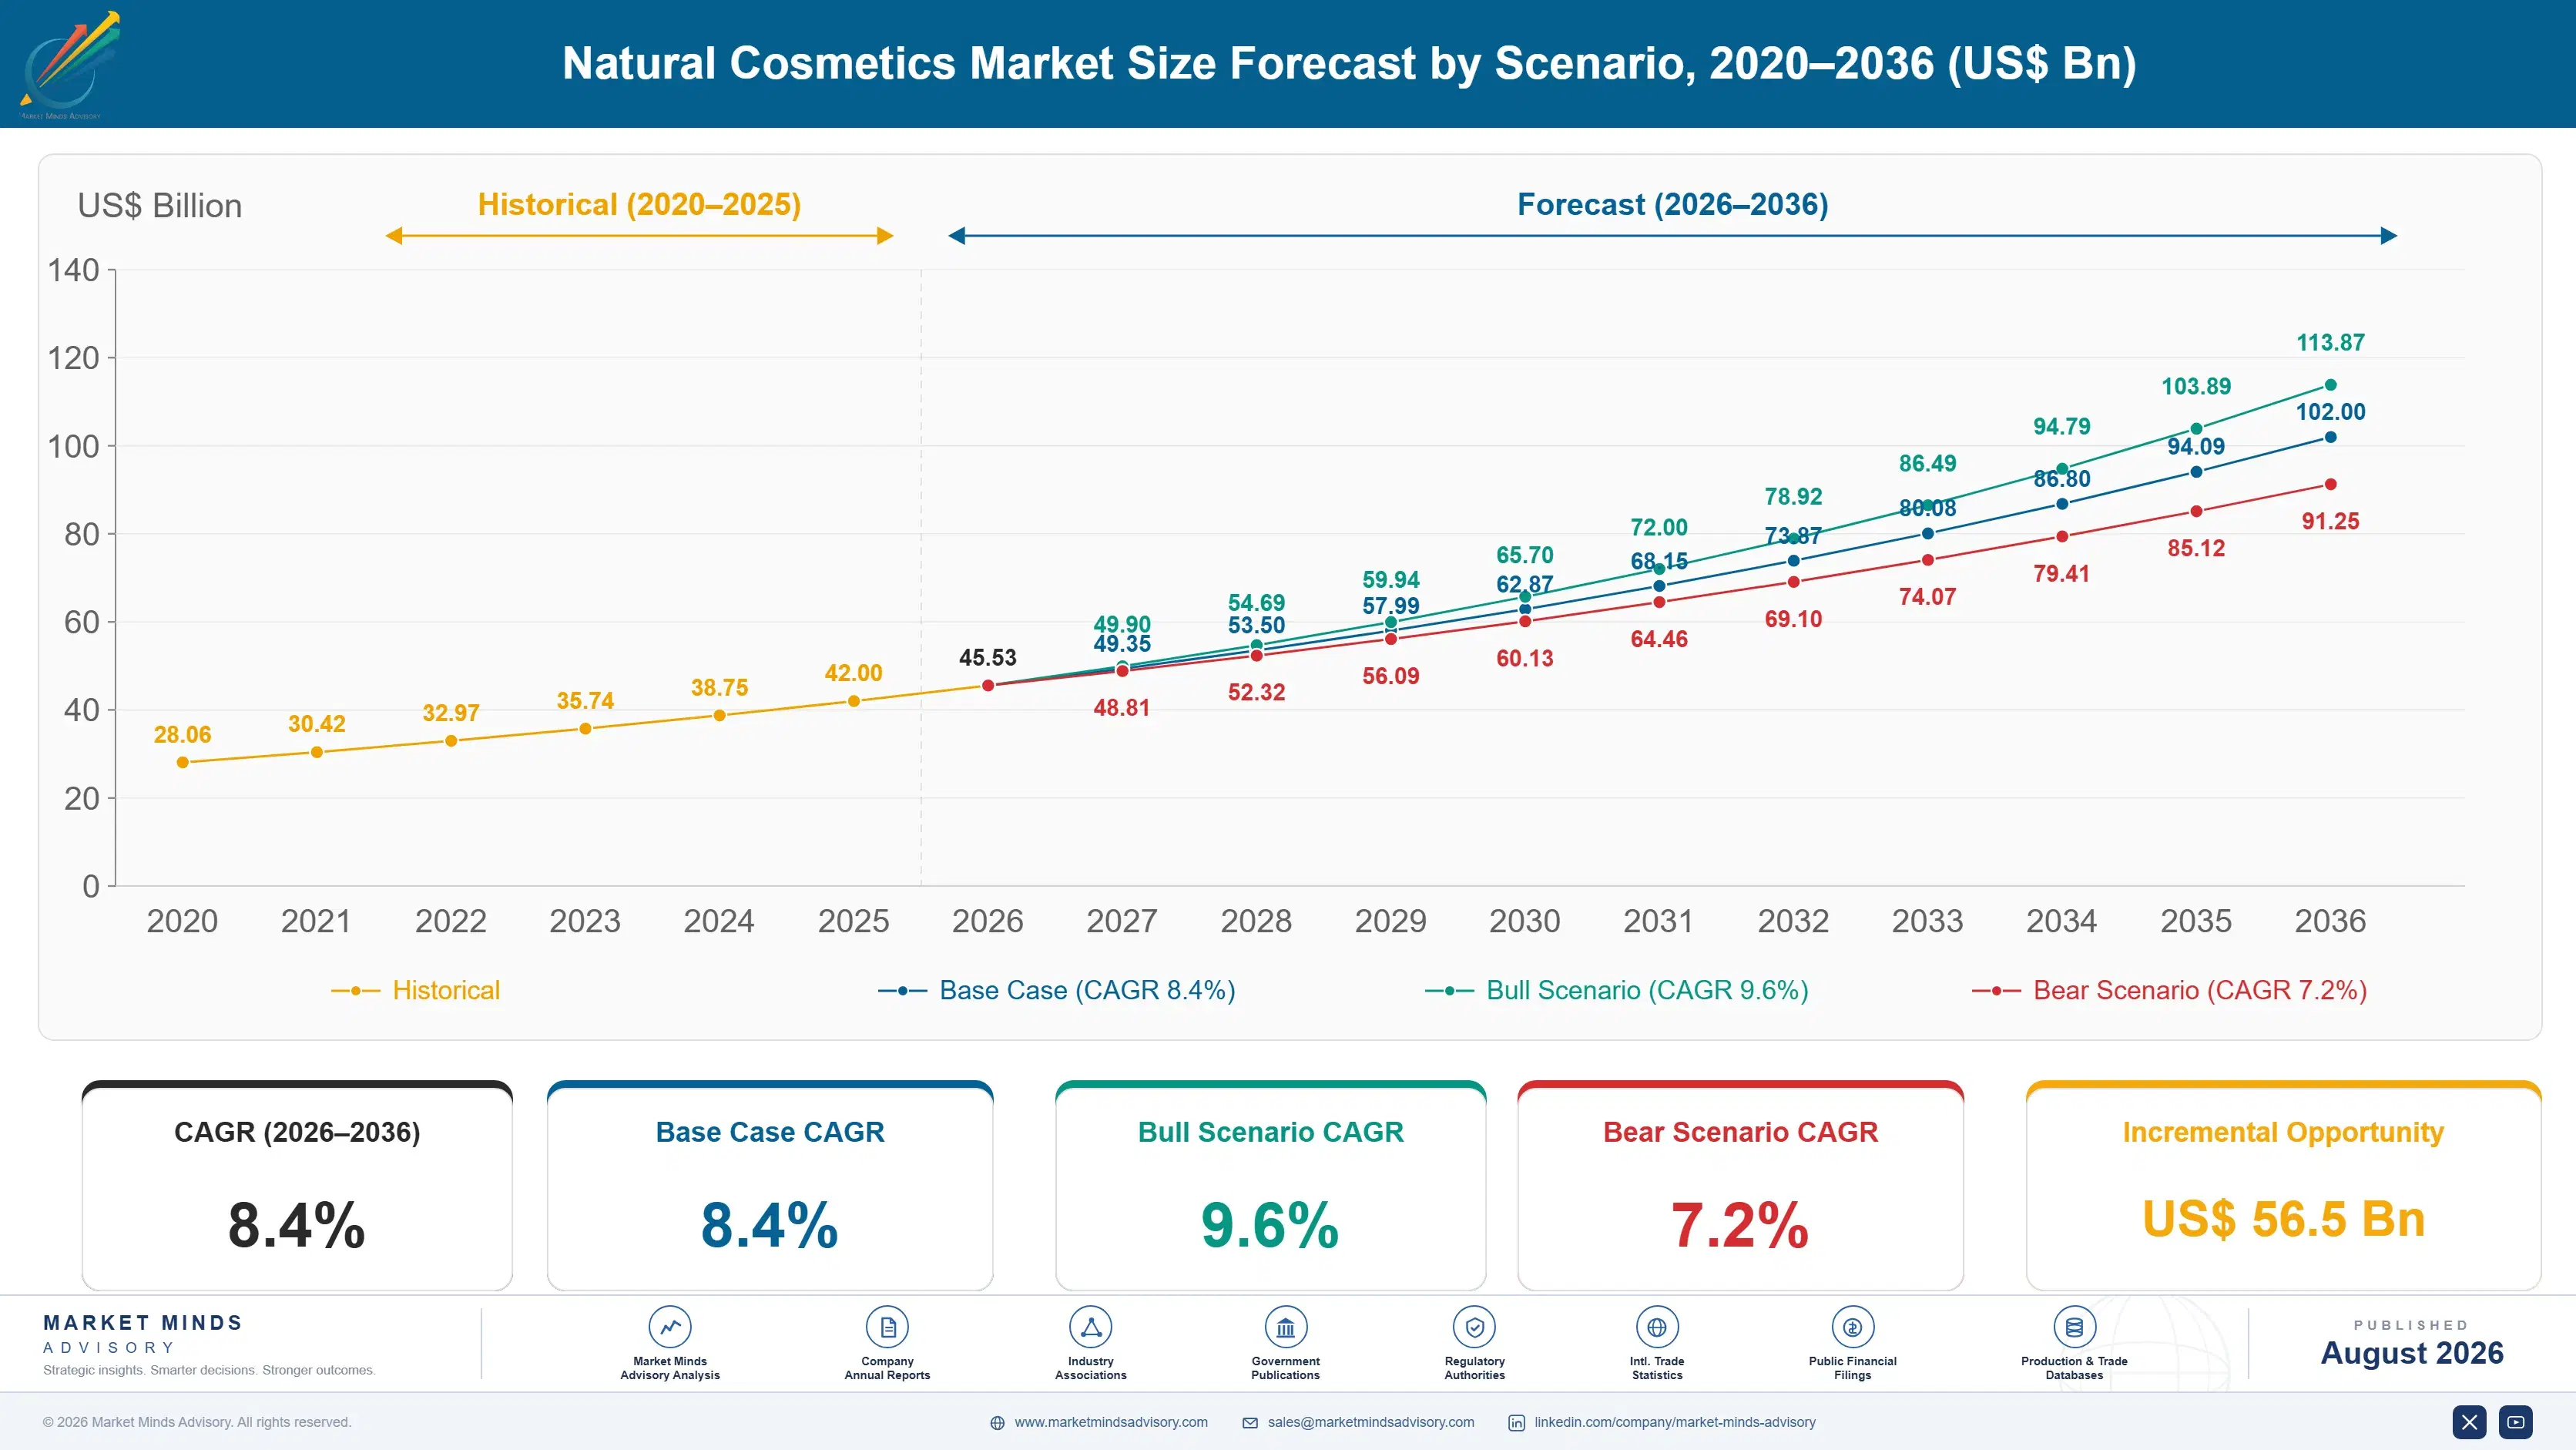
Natural Cosmetics Market Forecast Scenarios

natural-cosmetics-market-size-forecast-scenario-1788167807178
Between 2020 and 2025 the category compounded at 7.2%, and almost none of that came from persuasion. Retailer exclusion lists narrowed what could sit on a shelf, EU restrictions removed synthetic polymers from rinse-off formats, and brands reformulated because distribution depended on it. Demand followed supply, which is the reverse of how the category describes itself. That reversal is worth understanding properly.
The 8.4% base case rests on three mechanisms. Certification lead times of around 11 months keep supply constrained enough to hold pricing. Preservation chemistry has improved sufficiently that shelf life no longer disqualifies mass retail distribution. And ingredient exclusion policies at large chains keep converting conventional shelf space into certified shelf space without any brand spending a dollar to make it happen. None of the three requires a change in consumer sentiment. Sentiment changed some years ago already.
The bull case at 9.6% turns on preservation systems reaching 24 months, which would open mass grocery distribution that currently rejects the category on stock rotation grounds. The bear case at 7.2% is agricultural: a shea or argan harvest failure raises input cost faster than certified brands can reprice, and unlike conventional competitors they cannot substitute at all.

Where Certification Replaced Marketing

Natural cosmetics is a compliance business wearing a consumer marketing costume. A brand's competitive position is set by which certification it holds, how many months the audit took, and whether its botanical supply can survive a poor harvest without breaking the standard. Formulation talent is widely available. Certified supply chains capable of documenting every input back to the field where it grew are not.
TOP FIVE CONCENTRATION26%Share held by the five largest natural cosmetics groups
CERTIFIED SKU SHARE41%Portion of launches carrying a recognised third party certification
AVERAGE SELLING PRICEUSD 18.40Mean unit shelf price across skincare and haircare lines
INGREDIENT COST SHARE34% of COGSBotanical actives and carrier oils as proportion of production cost
MEDIAN SHELF LIFE16 monthsMedian stability window under natural preservation systems currently achievable
CERTIFICATION LEAD TIME11 monthsTypical duration from formulation submission to certified label approval
Ingredients run at roughly a third of production cost, considerably higher than conventional formulations, because botanical actives are agricultural products priced by harvest rather than by petrochemical feedstock. Packaging adds nearly a fifth, and certified packaging costs more again. The economics reward brands that hold long supply agreements with growers over brands that buy on the spot market, which is an unglamorous advantage nobody puts on a bottle.
Shelf life is the constraint that decides distribution. A sixteen month stability window works in specialist retail and direct sales, where stock turns quickly and the brand controls the shelf. It fails in mass grocery, where a buyer plans on a longer horizon and will not carry the write-off risk. Every serious preservation programme in this category is really a distribution programme in disguise.
"The brands that will still be here in ten years are the ones that treated certification as an operating system rather than a logo. Everybody else bought a mark and then discovered they could not hold it through a bad harvest."
Director, Consumer Formulation and Ingredients Practice · MMA Chemicals and Materials Practice · August 2026

Market Trends

Retailer exclusion lists outrun cosmetic regulation

Major beauty chains and drug retailers now publish ingredient exclusion lists running to several hundred substances, well beyond what EU Regulation 1223/2009 restricts. A brand that fails the list loses shelf space regardless of its legal compliance, and appeals are not a mechanism these programmes offer. The effect is a private regulatory layer moving faster than any statutory process, applied by buyers rather than by chemists. Brands with certified formulations pass automatically because certification already excludes most of the listed substances. Everybody else reformulates on the retailer's timetable, which is rarely generous.
Market Impact: Removes 5 polymer classes commercially
Preservation chemistry decides which channels open

Natural preservation systems built on organic acids, glyceryl esters and fermentation-derived actives have pushed median stability from roughly 12 months toward 16, and the leading formulators are working toward 24. That number is not a technical vanity metric. It determines whether a mass grocery buyer will list the product at all, because a shorter window transfers write-off risk onto the retailer. Every extension of stability opens distribution that no amount of brand investment could reach, which makes preservation research the highest return laboratory spend in this category by a distance.
Market Impact: Cuts development to 9 months

Market Opportunities and Growth Drivers

EU microplastics restriction removes synthetic polymers

Commission Regulation 2023/2055 restricts intentionally added synthetic polymer microparticles across cosmetic formats on a staged timetable, removing film formers, rheology modifiers and exfoliants that conventional products had used for decades. Natural alternatives exist but perform differently, and reformulating a whole range takes longer than the compliance window allows. Brands already formulating to COSMOS or NATRUE were largely unaffected because those standards had excluded the same materials for years. The regulation therefore transferred development burden onto conventional producers and handed certified brands a timing advantage they did not have to earn.
Market Impact: Raises input cost 30% seasonally

East Asian formulation capability sets global launch pace

Korean and Japanese contract formulators supply a large share of the certified natural launches sold under Western brand names, and their development cycles run considerably shorter than in-house European laboratories manage. A brand can move from brief to shipped product in under 9 months through that route, against a year and a half internally. The consequence is that ingredient trends now originate in Seoul and reach Paris and New York already commercialised. Western groups have responded by acquiring or contracting into the same base rather than trying to match the pace.
Market Impact: Adds 11 months before launch

Market Restraints and Challenges

Botanical supply follows harvests, not demand plans

Shea, argan, rosehip and marula supply is agricultural, concentrated in a small number of growing regions, and priced by harvest rather than by contract. A poor season raises input cost 30% or more within a quarter, and a certified brand cannot substitute a synthetic equivalent without losing the mark that justifies its price. The root cause is that certification standards deliberately restrict the permitted input list, which is exactly what makes them credible. Participants are responding with multi-season grower agreements, cultivation programmes in second-source regions and formulation designs that allow one botanical to replace another inside the standard.
Market Impact: Gates 41% of certified launches

Certification cost excludes smaller brands from shelves

A COSMOS or NATRUE certification runs roughly 11 months from submission and carries audit, documentation and annual renewal costs that a brand below a certain revenue simply cannot absorb across a full range. The root cause is that the standard audits the supply chain rather than the finished product, so cost scales with the number of ingredients rather than with volume sold. Small brands therefore certify one hero product and market the rest on an unverified claim. Mitigation is emerging through group certification schemes, shared supplier documentation and contract manufacturers who hold the certification on their clients' behalf.
Market Impact: Extends shelf life 4 months
3 additional market trends, 4 additional growth drivers, and 2 additional restraints and challenges are covered in the full report. Contact sales@marketmindsadvisory.com to access the complete intelligence.

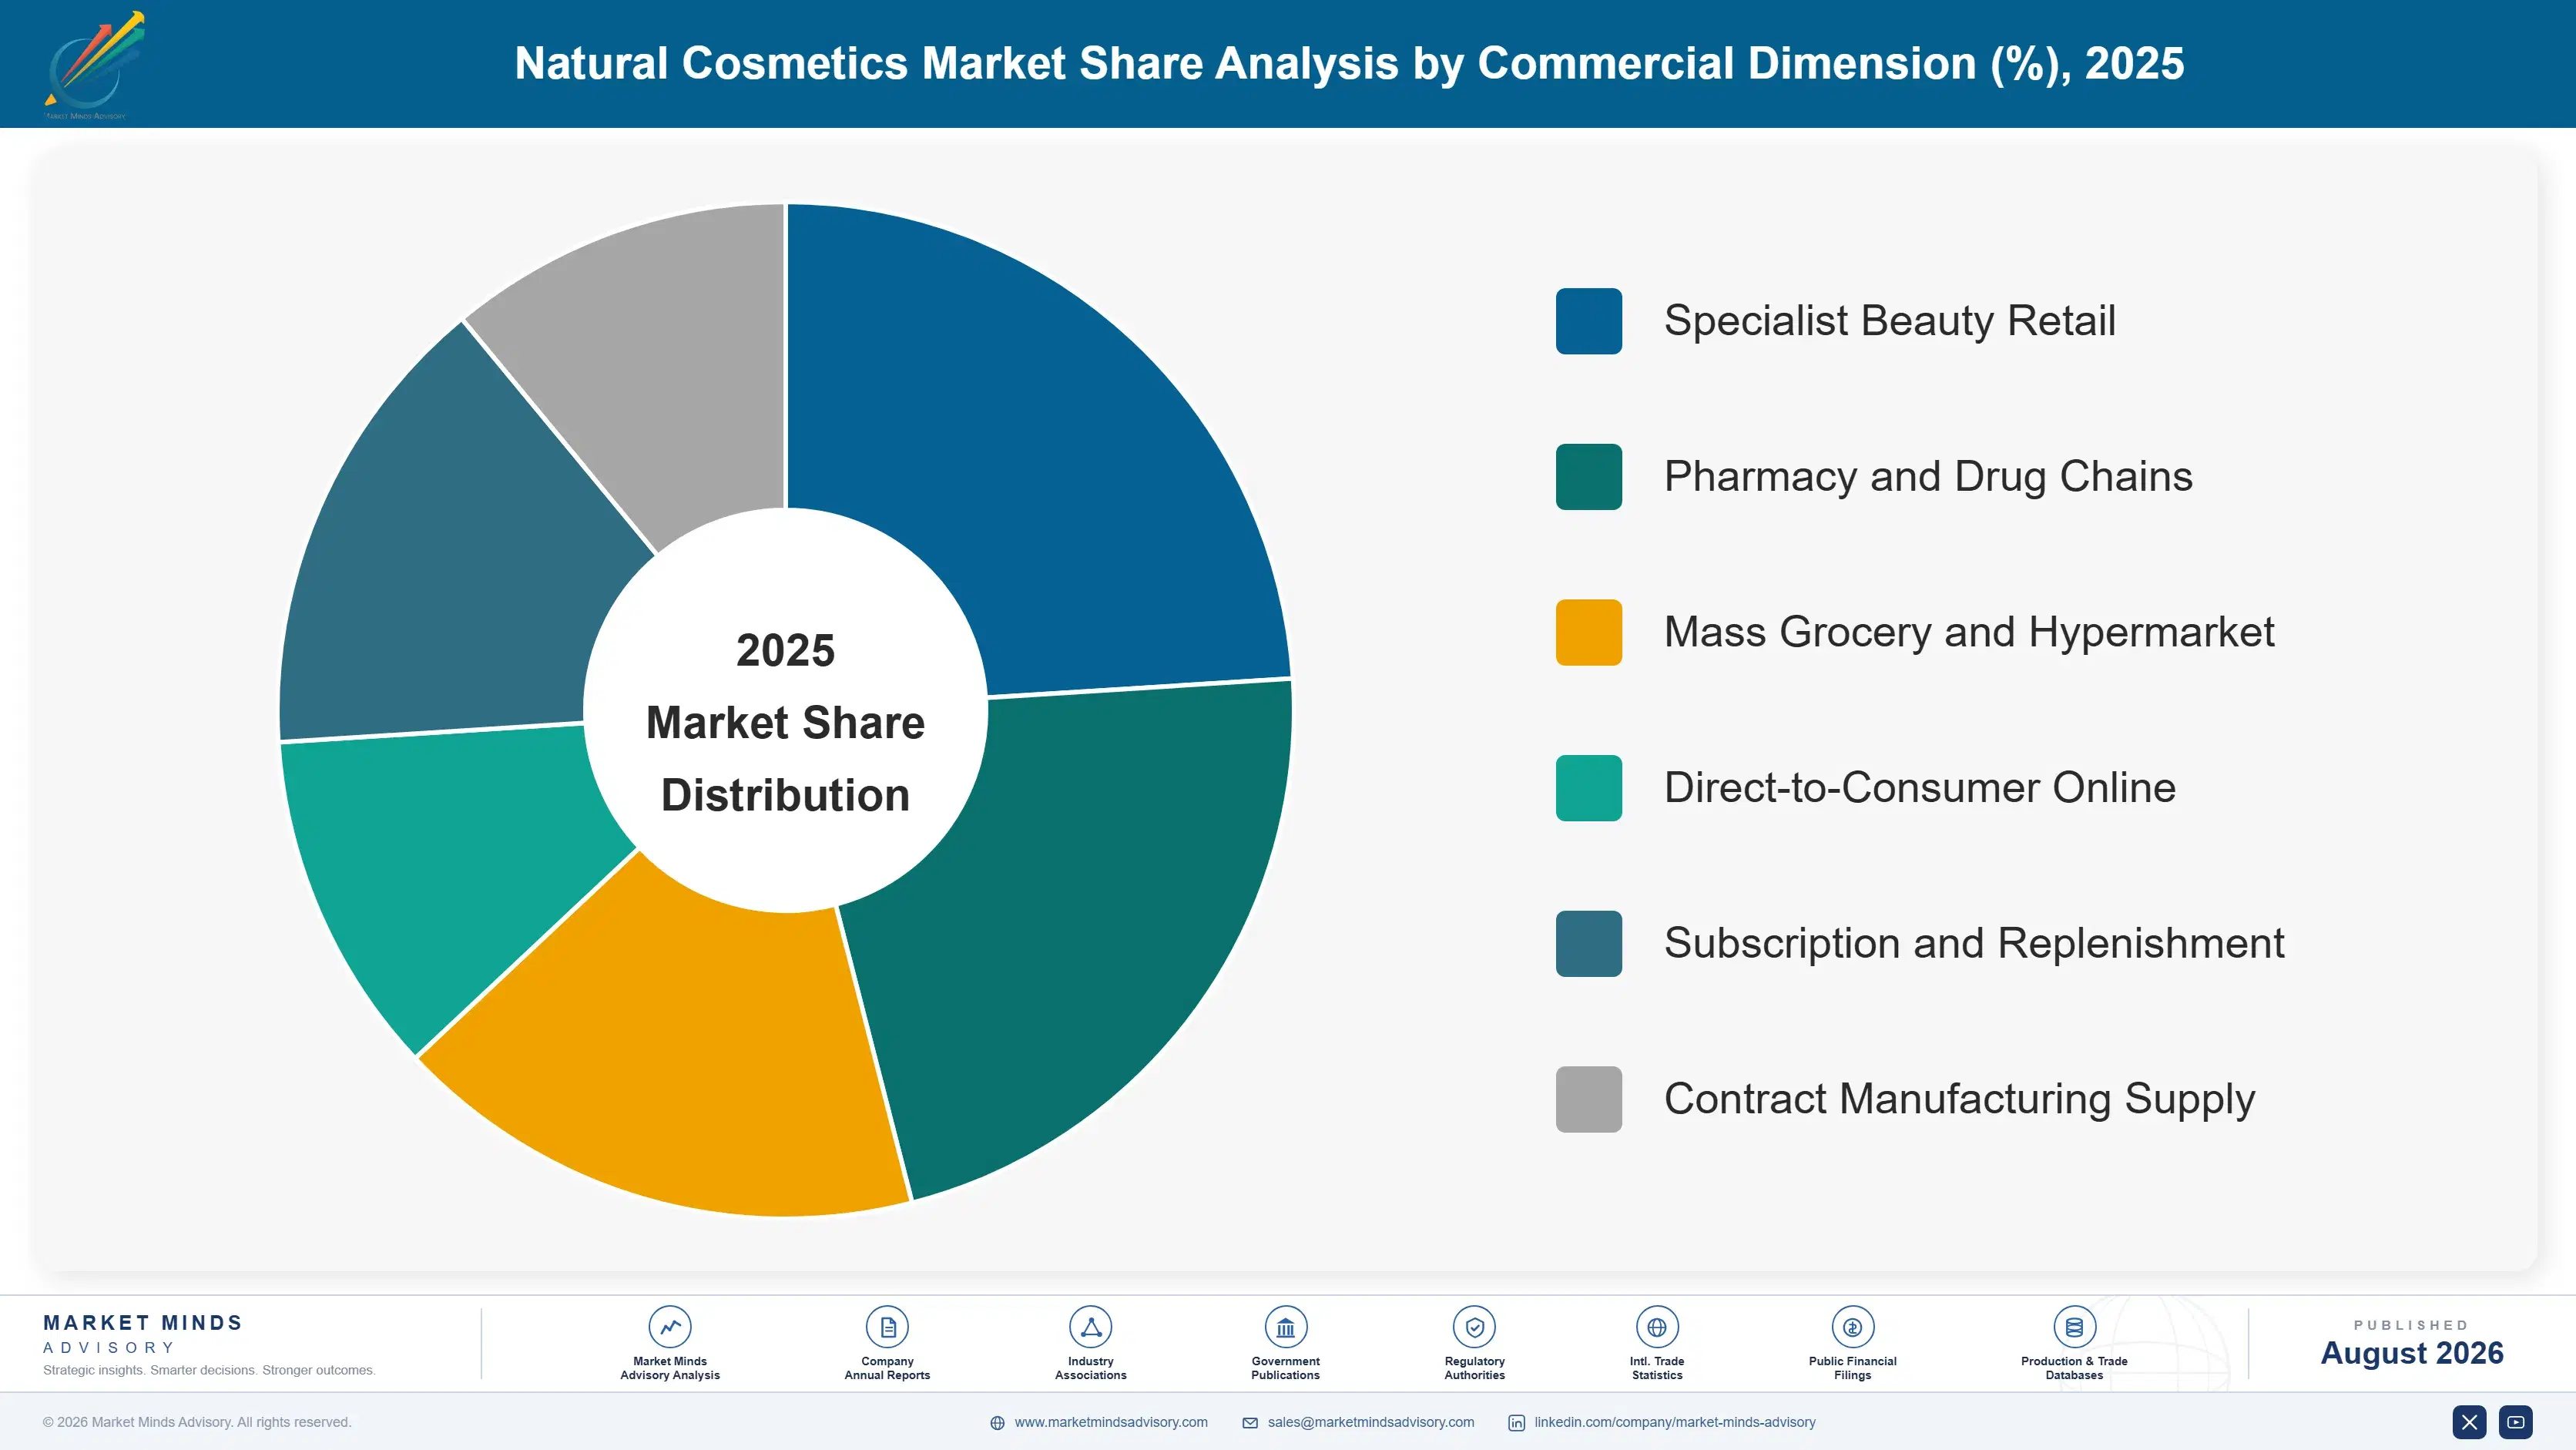
Segment CAGR and Growth Architecture

Segmentation follows finished product category, the dimension on which formulation, certification scope and retail buying all operate. Skincare and haircare carry the certification burden and the pricing power. Colour cosmetics and fragrance sit further behind because pigment and aroma chemistry constrain what a natural standard permits, which shows up directly in their growth rates every year.
natural-cosmetics-market-market-share-analysis-1788167807738

Certified Natural Skincare

Skincare grows at 12.6%, half again the market rate of 8.4%, and it is the only category where certification reliably supports a price premium rather than merely permitting a claim. Serums, moisturisers and cleansers carry high active concentrations, which makes ingredient provenance commercially meaningful to the buyer in a way that a bath product never achieves. Certification here is also technically easier: the format tolerates natural preservation better than emulsion-heavy or aqueous alternatives. The result is that most brands enter the category through skincare, prove the certification operationally, then extend into adjacent categories using documentation they already hold. Nobody starts with fragrance. That sequence is so consistent across the category that it now reads as a rule.
CAGR 12.6%

Natural Haircare and Scalp Care

Haircare at 10.2% is being pulled by scalp treatment rather than by shampoo, which is where the margin sits and where certified botanical actives command a genuine premium. Sulphate-free and silicone-free reformulation had already moved the conventional category most of the way toward natural specification before certification arrived, so the technical gap to close was small. The commercial obstacle is different: haircare is a volume business sold through grocery and drug channels that demand long shelf life, and natural preservation still constrains listings. Brands solving stability in this format reach distribution that skincare brands never needed to fight for. It is the least glamorous problem in the category and easily the most valuable one to solve.
CAGR 10.2%
Full segment breakdown across 6 segments available in the complete report.

Regional Architecture and Country Demand Map

East Asia leads on 29%, and it leads on capability rather than only on consumption: a large share of the world's certified natural formulation happens there. Western demand is regulation-shaped, South Asian demand is tradition-shaped, and those are genuinely different commercial problems to solve properly.

East Asia

Korea and Japan between them supply the contract formulation capacity that a large part of the global certified natural category depends on, and Chinese demand has grown fast enough that domestic brands now compete credibly on ingredient provenance rather than on price alone. Regulatory change in China removing mandatory animal testing for most imported general cosmetics opened the market to certified European and Korean brands that had previously stayed out on principle. The region's advantage is that formulation, certification support and manufacturing sit within a few hours of each other, which compresses development cycles in a way no other region matches. Launch pace here now sets the pace almost everywhere else.
Share: 29% | CAGR: 9.4% (2026 to 2036)

North America

Retailer ingredient policies did more to build this market than any regulation. Sephora, Target and Credo published exclusion lists that function as de facto standards, and a brand that fails one loses national distribution without recourse. Federal cosmetic regulation modernised under MoCRA brought facility registration and adverse event reporting, but it says nothing about natural composition, which leaves the retailers as the effective standard setters. The commercial consequence is that certification bodies matter less here than buyer relationships, and brands invest in retailer compliance teams rather than in European certification. It produces a market that looks natural on the shelf while resting entirely on a set of purely private rules.
Share: 25% | CAGR: 8.0% (2026 to 2036)
Regional intelligence for 5 additional markets available in the complete report: Western Europe, South Asia and Pacific, Latin America, Middle East and Africa, Eastern Europe. Contact sales@marketmindsadvisory.com.
natural-cosmetics-market-country-cagr-analysis-1788167808259

Four Moves That Compound Certification

None of these four requires a new formulation. Each takes an asset the business already holds, the certification documentation, the grower relationships, the stability data, the retailer compliance file, and converts it into revenue that competitors without those assets cannot reach. The common feature is that all four are operational rather than creative, which is why they are consistently underfunded.

Sell certification capacity to other brands

A brand holding COSMOS certification across a full ingredient list has built an audit trail worth considerably more than the products it currently sells. Contract manufacturing for smaller certified brands uses that documentation again at near-zero marginal compliance cost, and it converts an 11 month certification burden into a recurring revenue line. Margins on certified contract work run 8 to 12 points below own-brand but require no marketing spend at all. The strategic benefit is larger than the revenue: it gives visibility into competitor formulations and locks challengers into your supply relationships.
Market Impact: Recovers the 11 month certification cost across clients

Contract multi-season supply with named growers

Buying shea, argan or rosehip on the spot market exposes the whole range to a 30% harvest swing that a certified formulation cannot dodge through substitution. Three-year grower agreements at agreed volumes cost 5 to 8% above spot in a normal year and save far more than that in a bad one. They also generate the traceability documentation certification bodies require, which would otherwise be a separate expense. Brands running these agreements have held pricing through two poor seasons while competitors repriced twice and lost listings. Nobody wins a listing back easily.
Market Impact: Caps the 30% input swing across three seasons

Fund preservation research as distribution strategy

Moving median stability from 16 months to 24 is not a laboratory achievement so much as a channel decision taken in a laboratory. Mass grocery buyers reject the category on write-off risk, and that rejection disappears at roughly 24 months. The addressable retail footprint at that point is several times the specialist and direct channels combined. Preservation programmes cost less than a single national advertising campaign and open distribution that no campaign could ever buy. Very few brands allocate spending that way. The ones that do are quietly listing in channels their competitors cannot enter.
Market Impact: Opens mass grocery listings at 24 month stability

Build the retailer compliance file first

Retailer exclusion lists at the major beauty chains cover several hundred substances and are updated without consultation. Brands that maintain a live compliance file mapping every SKU against every list can respond to an update in weeks; brands that do not lose listings while they reformulate. The file costs perhaps 2 people to maintain and protects the 41% of revenue that flows through chains operating these programmes. It also shortens new listing conversations considerably, because the buyer's first question is already answered before the meeting starts. That is an unusually cheap piece of insurance.
Market Impact: Protects the 41% of revenue flowing through retail chains

Who Controls the Margin Pool

CR5 stands at 26%, measured on natural cosmetics revenue as disclosed in group segment reporting and MMA estimates where segments are not broken out. That is low for a consumer category and it reflects a real fragmentation: the large groups arrived by acquisition rather than by building, and the founder-led brands they bought retain distinct positions. The gap between the leader and the fifth ranked participant is narrow.
Competition currently runs on three fronts. Certification breadth decides which retailers will list you. Ingredient security decides whether you can hold price through a poor harvest. Formulation speed decides whether you reach a trend before it passes, and the groups contracting into Korean development capability are winning that one comfortably. Advertising weight, which used to decide everything in cosmetics, now decides little here.

Rankings will shift where preservation and supply meet. A participant that reaches 24 month stability while holding multi-season grower contracts can enter mass grocery at a price the specialist brands cannot follow, and that is a different market rather than a bigger share of this one. The pressure runs the other way too: contract manufacturers holding their own certifications are turning into competitors for the brands that trained them.
natural-cosmetics-market-company-positioning-matrix-1788167808784

Competitive Moat and Risk Dimensions

L'OREAL

Moat: Acquired brands retain autonomy

The group bought natural brands and then largely left them alone, which preserved the founder credibility that a corporate relaunch would have destroyed. Distribution, procurement and certification support flow in from the centre while brand identity stays local. That combination is difficult to copy because it requires a large group to accept lower control than its systems are designed for.
L'OREAL

Risk: Conventional portfolio invites scrutiny

The same corporate name sits behind conventional ranges using materials the natural brands exclude by certification, and a consumer base that checks ingredient lists also checks ownership. Activist campaigns and retailer questionnaires increasingly ask about group-level practice rather than brand-level formulation. Managing that contradiction consumes disproportionate communications effort and occasionally costs a listing outright.
BEIERSDORF

Moat: Dermatological credibility transfers cleanly

Decades of clinical positioning in skin care give the group an evidence vocabulary most natural brands cannot claim, and that matters increasingly as buyers ask whether a botanical actually performs. Certified ranges launched under an established dermatological name carry both signals at once. Building that credibility from a natural starting point takes longer than most challengers have funding for.
BEIERSDORF

Risk: European weighting limits growth

Revenue concentration in Western Europe places the group in the slowest growing region for this category, where penetration is high and the remaining opportunity is trading buyers upward rather than recruiting new ones. East Asian and South Asian positions are comparatively thin, and building them means competing against local formulators with shorter development cycles and better cost positions.

Players Tracked

Prominent Players

L'Oreal
Beiersdorf
Unilever
Amorepacific
Weleda

Other Key Players

Shiseido
Kao Corporation
LG Household and Health Care
The Estee Lauder Companies
Natura and Co
Groupe Rocher
WALA Heilmittel
Pierre Fabre
Coty
Puig
Lush Cosmetics
Rituals Cosmetics
Himalaya Wellness
Forest Essentials
Laverana

Recent Developments

FEBRUARY 2025

COSMOS standard revision tightens permitted preservative list

The COSMOS-standard technical committee published a revision narrowing the permitted preservative list and adding documentation requirements for botanical origin. Certified brands were given a transition window to reformulate or resubmit, and several ranges built on borderline materials required laboratory work that had not been budgeted for.
Signal: Certification standards now move faster than brands can reformulate, and that gap is widening quite steadily with every revision.
JUNE 2025

Amorepacific commissioned an organic botanical extraction facility

Amorepacific brought a dedicated organic-certified botanical extraction plant into operation in South Korea, an organic capacity expansion rather than any acquisition or joint venture. The facility processes fermented and cold-extracted actives internally, removing a supplier dependency that had constrained certification documentation on several export ranges.
Signal: Owning extraction shortens certification documentation and removes the supplier risk that stops most export ranges from scaling properly.
OCTOBER 2025

Major beauty retailer extended its ingredient exclusion programme

A leading specialist beauty chain extended its published ingredient exclusion programme to cover additional preservative and fragrance allergen categories across all listed brands. This was a buying decision rather than any regulatory requirement, and suppliers were given a fixed compliance date with no appeal process attached to it.
Signal: Retail buyers are now setting composition standards that no legislature has ever debated or approved anywhere.

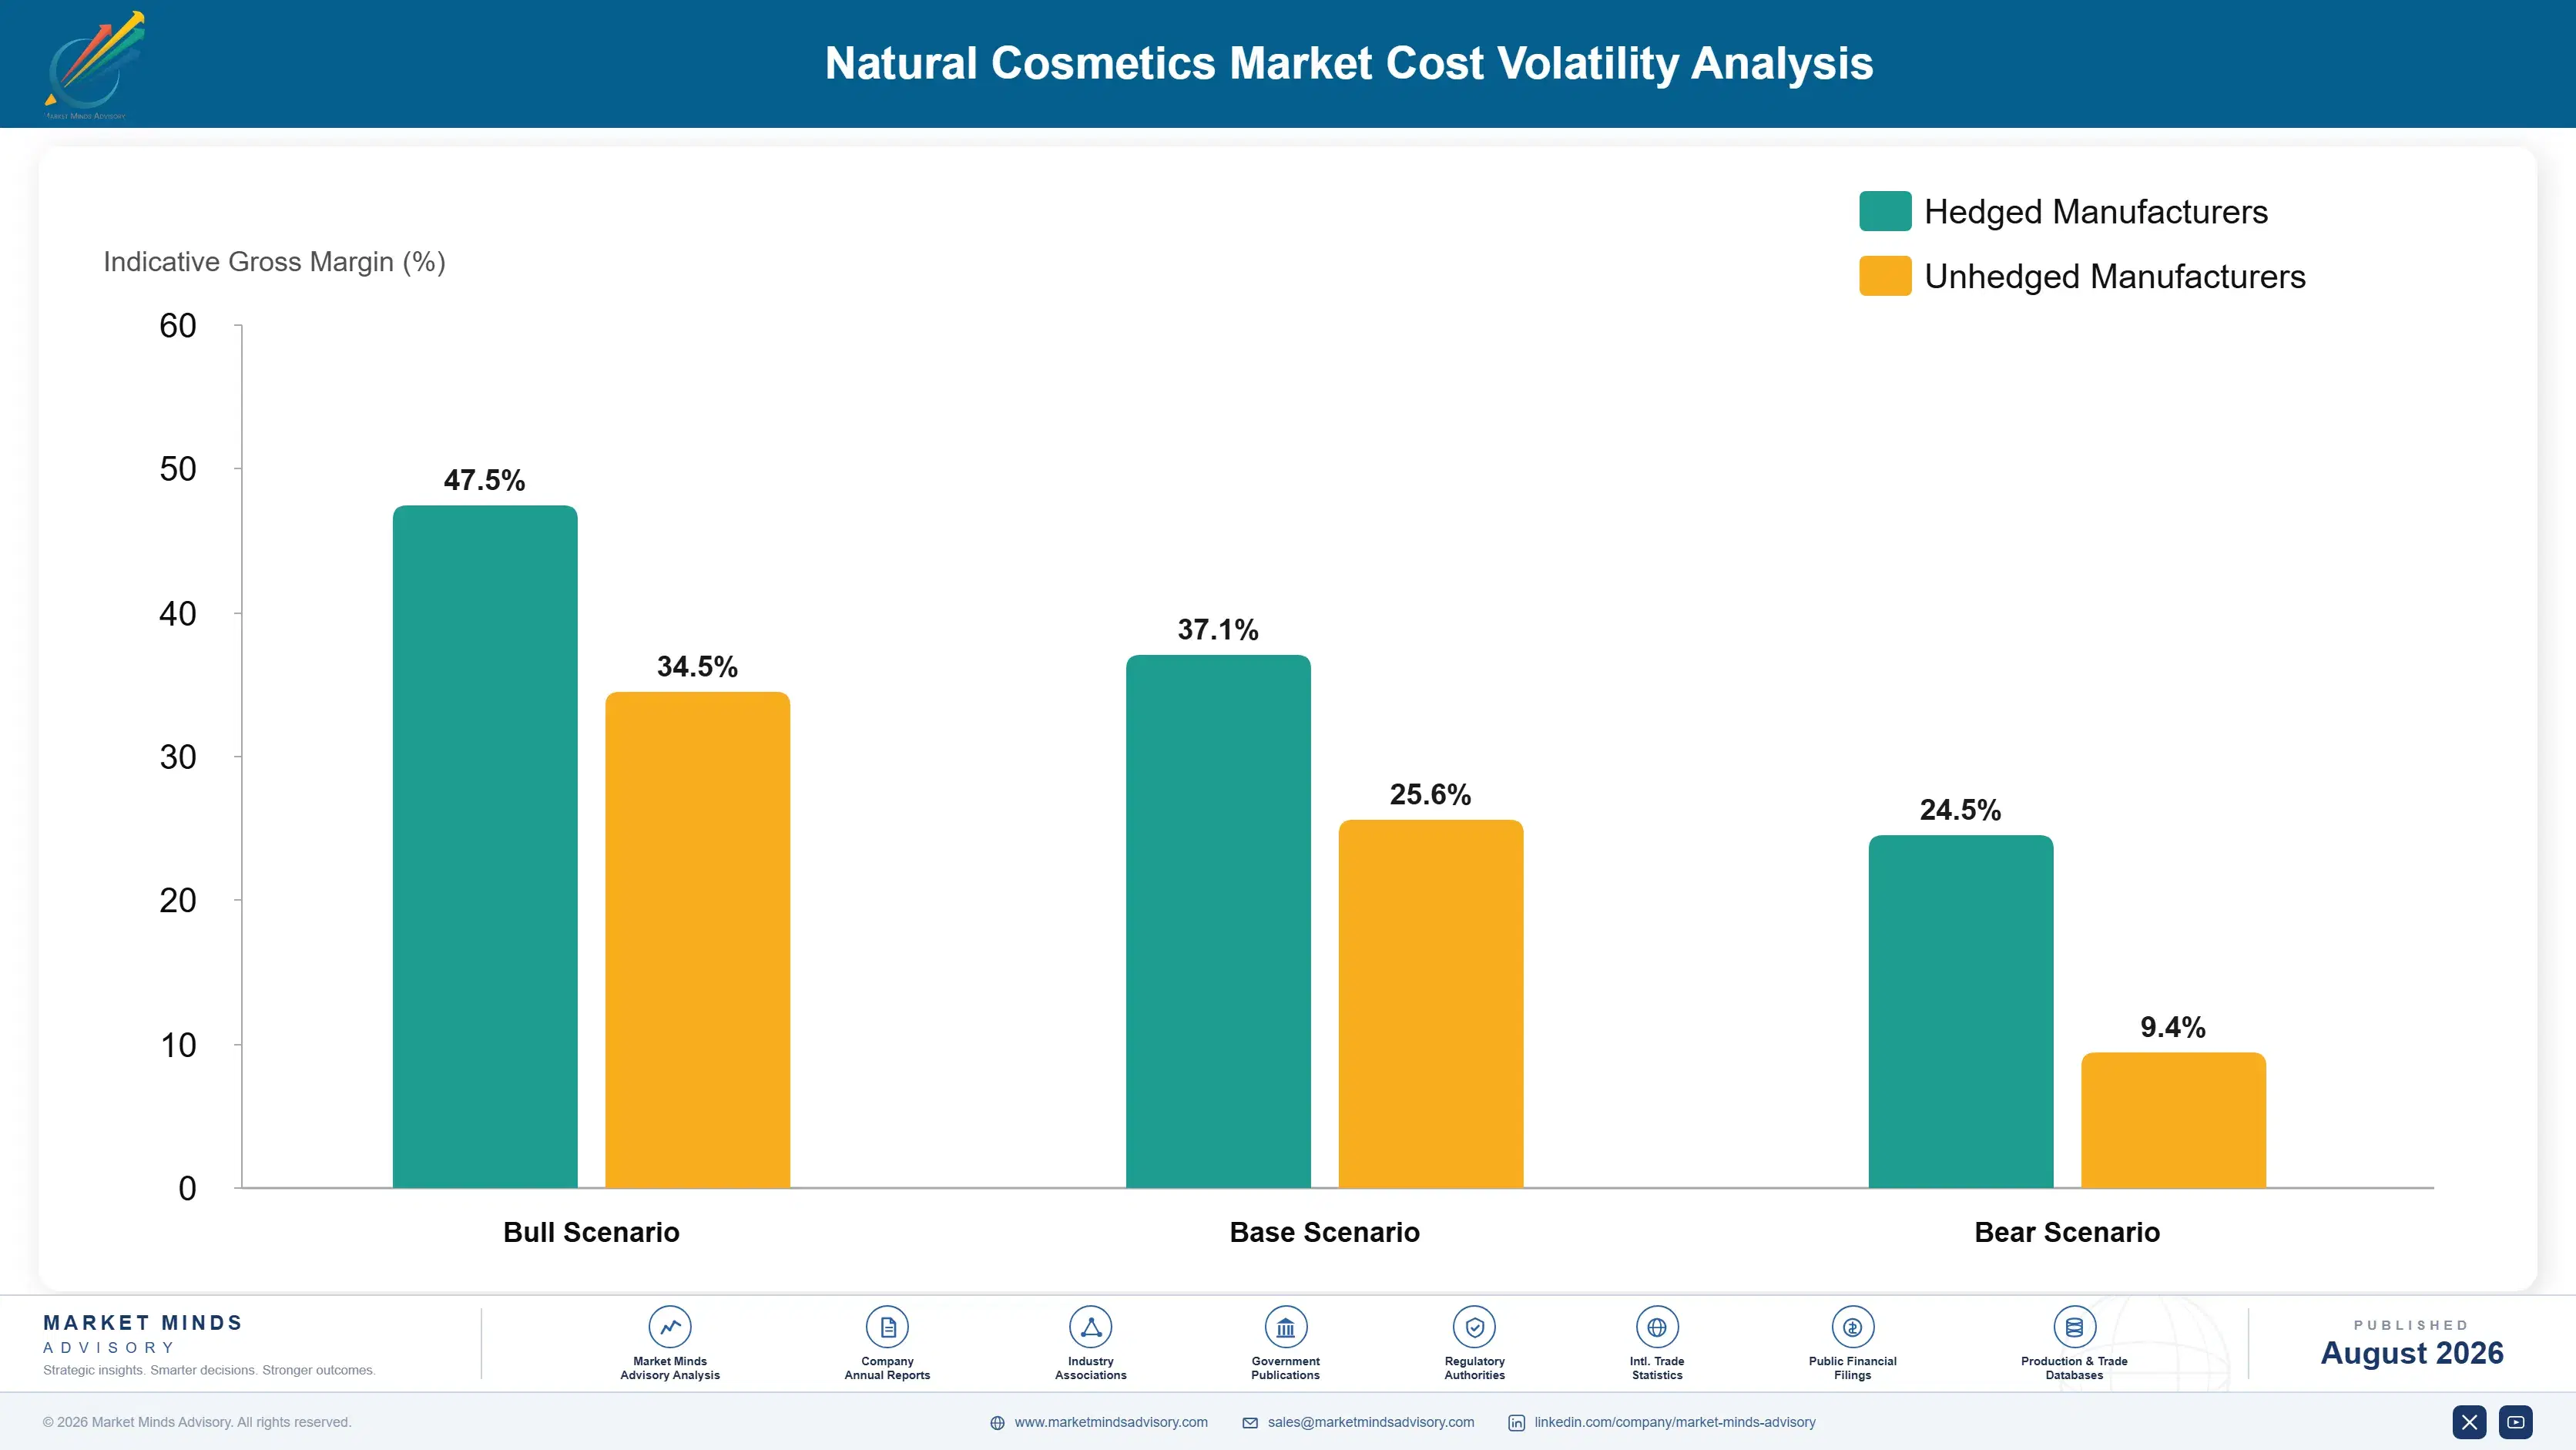
When The Harvest Sets Your Margin

Botanical actives and carrier oils account for roughly 34% of cost of goods, considerably above the conventional cosmetics benchmark, and certified packaging adds a further 19%. Shea originates almost entirely in West Africa, argan in Morocco, rosehip in Chile and Lesotho. Each is a single-origin agricultural product with a defined harvest window and no synthetic substitute available inside the standard.
The 2024 West African shea season illustrated the exposure. USDA Foreign Agricultural Service reporting recorded a materially reduced kernel harvest across Ghana and Burkina Faso, and processed butter pricing rose sharply into the following year. Beiersdorf noted raw material cost pressure in personal care inputs in its Annual Report 2024. Certified brands absorbed it because reformulating away from shea would have required a fresh certification submission running close to a year.

The competitive disadvantage is asymmetric. A conventional producer facing the same shea price switches to a synthetic emollient in a quarter and loses nothing a consumer notices. A certified brand cannot, and it either absorbs the cost or breaks the promise its price depends on. Exposure varies sharply by scale: large groups hold forward contracts and multiple origins, while founder-led brands buy spot and take the full swing.
natural-cosmetics-market-cost-volatility-analysis-1788167808979

Contract multiple growing origins for every critical botanical

Single-origin dependency is the whole exposure. Qualifying a second growing region for shea, argan or rosehip costs certification submission time upfront and removes the harvest concentration that makes pricing uncontrollable. The work takes roughly a year per ingredient and pays for itself the first season either origin fails, which on recent evidence is often enough.

Design formulations with certified substitution built in

A formulation approved with two interchangeable botanical actives inside the same certification lets a brand switch on price without resubmission. It costs more in development and stability testing at the outset. The saving arrives every time one input spikes, and it converts a rigid cost structure into a flexible one without touching the certification mark or the consumer promise.

Invest in processing capacity at origin

Buying processed butter rather than kernels leaves the margin and the supply priority with the processor. Participants funding processing capacity in Ghana or Burkina Faso secure allocation ahead of spot buyers and capture value that otherwise leaves the growing region entirely. The commercial return is supply security in a poor season, which is worth considerably more than the processing margin.

Portfolio Architecture for Margin Defence

Margin architecture in this category follows certification depth rather than product format. Volume product certified to a minimum standard competes on price against conventional equivalents and earns conventional margins. Fully certified premium skincare earns something closer to a pharmaceutical gross margin, because the buyer is paying for verification rather than for ingredients. The gap between those two positions is wider here than in conventional cosmetics.
The volume versus premium tension is real but not symmetrical. Volume certified product builds the supply relationships and the extraction scale that premium product then uses at low marginal cost, so abandoning volume weakens the premium position. Running only premium leaves a brand buying botanical inputs at small-buyer prices. The groups performing best hold both and treat the volume tier as a procurement platform rather than a profit centre.

High-value pools concentrate in certified skincare actives, scalp treatment and the regulatory-driven reformulation work that conventional producers now need. That third pool is the least obvious and possibly the largest: brands with certified formulation capability are selling development services to companies that spent decades avoiding this category. Nobody planned for that revenue line and several participants have not yet noticed they hold it.

Volume / Commodity-Adjacent

Minimum-standard certified body wash, shampoo and basic skincare sold through grocery and drug channels. Competes directly against conventional product on price, and the certification adds cost without adding much premium. The 9 point spread reflects private label exposure across the tier.
Gross Margin: 32 to 41%

Premium / Certified

Fully certified skincare and scalp treatment sold through specialist beauty retail and direct channels. Verification rather than formulation supports the price, and buyers check the mark before the ingredient list. The 8 point spread reflects channel mix between direct and wholesale.
Gross Margin: 58 to 66%

Sustainability / Regulatory / Next-Generation

Fermentation-derived actives, biotech botanical equivalents and certified reformulation services sold to conventional producers. Margins are high because capability is scarce rather than because volume is large. The 12 point spread reflects the difference between product sales and development contracts.
Gross Margin: 62 to 74%
natural-cosmetics-market-portfolio-architecture-1788167809474

High-value Sub-segments and Strategic Watch-out

Certified Natural Skincare Actives

High value and high growth at 12.6%. Certification supports the price, active concentration supports the claim, and East Asian formulation capacity supplies the innovation. The 7 point spread reflects whether the brand owns extraction or buys finished actives from a third party supplier group instead.
Gross Margin: 64 to 71%

Natural Scalp Treatment

High value with moderate growth. Scalp care carries skincare margins inside a haircare purchase, and the certified botanical claim is unusually credible in this format. The 7 point spread separates specialist retail from grocery listings, where price expectations are considerably lower than they are elsewhere entirely.
Gross Margin: 56 to 63%

Certified Body and Bath Volume

The volume core. It earns little directly but it funds the botanical procurement scale and grower relationships that the premium tiers depend on. The 8 point spread reflects private label share, which varies enormously between participants and channels. Abandoning it costs more than it saves.
Gross Margin: 31 to 39%

Certified Natural Fragrance

The strategic watch-out. Natural aroma chemistry restricts the palette severely, growth trails the category at 5.9%, and consumers reject performance compromises here more readily than in skincare. The 11 point spread reflects how much certified essential oil content a formulation actually carries in real practice.
Gross Margin: 44 to 55%

Why This Demand Repeats

Natural cosmetics is a replenishment business and the economics rest on that. A certified skincare buyer repurchases a serum roughly every 10 weeks and a cleanser more often, which means acquisition cost amortises across many purchases rather than one. The annuity is stronger than in conventional cosmetics because switching carries a verification cost: a buyer who has checked one brand's certification does not want to check another's.
Stickiness varies sharply by end use. Skincare buyers are the most loyal, because a formulation that suits a skin type is expensive to replace by trial and error. Haircare buyers switch readily on promotion. Colour cosmetics buyers hold no loyalty to the natural claim at all and choose on shade and finish, which is why certified colour ranges struggle to build repeat rates that skincare achieves without effort.

Buyer profiles have shifted generationally in a way that changed the argument. Older buyers came to natural cosmetics through health concern and wanted reassurance. Younger buyers arrived through ingredient literacy and want documentation, which is a higher bar and a more durable one. They read certification marks fluently, check ownership structures, and treat a vague claim as evidence against a brand rather than for it.
natural-cosmetics-market-end-use-penetration-index-1788167809965

Where The Value Actually Sits

These are among the four positions where our research anticipates prominent divergence between winners and laggards over the coming forecast period. Each is grounded in the demand model, the regulatory perimeter, and the announced capacity pipeline.
01 / CERTIFICATION ASSET MONETISATION

Treat the audit trail as a product, not a cost

A full COSMOS ingredient audit trail costs roughly 11 months to build and then sits idle between renewals, which is an expensive asset to leave unused. Contract manufacturing for smaller certified brands uses the same documentation at almost no marginal compliance cost and generates recurring revenue without any marketing spend attached to it. The strategic return exceeds the financial one, because it puts you inside the supply chain of every challenger brand in your entire category, which is worth having.
02 / BOTANICAL SUPPLY SECURITY

Contract growers before the harvest fails, not after

Certification removes the substitution option that conventional producers use to absorb a 30% input swing, which turns an agricultural risk into a margin risk with no escape route at all. Multi-season grower agreements cost 5 to 8% above spot in a normal year and protect the entire range in a poor one. The brands that signed them before the 2024 shea season held their pricing while everybody else repriced twice and lost listings they have not yet won back since.
03 / PRESERVATION AS DISTRIBUTION

Stability research buys shelf space advertising cannot

Median natural stability at 16 months keeps this category out of mass grocery, where buyers plan on longer horizons and refuse to carry write-off risk on a supplier's behalf. Reaching 24 months removes that objection entirely and opens a retail footprint several times larger than the specialist and direct channels combined. A preservation programme costs less than one national campaign and delivers distribution that no campaign could purchase at any price whatsoever, which very few boards yet seem to believe.
04 / RETAIL COMPLIANCE DISCIPLINE

The buyer sets the standard, so answer first

Retailer ingredient exclusion lists now gate 41% of category revenue and they change without consultation or appeal, which makes them a harder constraint than any cosmetic regulation currently in force. A live compliance file mapping every SKU against every published list costs perhaps two people and converts a reformulation emergency into a routine quarterly task. Brands without one lose listings while they scramble, and winning a delisted position back is considerably harder than holding it was in the first place.

Engagement Snapshot From the Field

A live engagement with an industry participant carrying material or product regulatory and market exposure ahead of a defining policy shift, showing how our research translates into a defensible multi-year portfolio strategy.
MARKET MINDS ADVISORY · CLIENT ENGAGEMENT SUMMARY
Natural Cosmetics Producer Strategic Portfolio Review and Transition Roadmap 2026·Investment Scenario on Natural Cosmetics Exposure Evaluation 2025-26
CLIENT PROFILE
A European natural cosmetics group with certified skincare and haircare ranges sold across specialist retail in eleven countries, with annual revenue in the mid hundreds of millions of euros (client-reported, unverified by MMA). The business held COSMOS certification across most of its range and bought botanical inputs largely on the spot market through a single broker relationship.
STRATEGIC CHALLENGE
Two consecutive poor shea seasons had pushed input cost up sharply and the group had repriced twice, losing three retail listings in the process. Management wanted to know whether the exposure was manageable through hedging or whether it required rebuilding the sourcing model, and separately whether the certification the group already held could generate revenue directly.
MMA APPROACH
MMA mapped every botanical input against origin concentration and harvest volatility, then modelled margin under three harvest scenarios. Forty-seven expert interviews across certification bodies, contract manufacturers and specialist retail buyers established what contract terms growers would actually accept and what a certified contract manufacturing offer would command from smaller brands in the same market.
KEY FINDINGS
  1. Four botanical inputs accounted for 71% of harvest exposure, and all four came from single growing regions through the same broker relationship.
  2. Growers in two origins would sign three-year volume agreements at roughly 6% above spot, terms nobody in the business had ever tested directly.
  3. Certified contract manufacturing demand from smaller brands exceeded available European capacity, and the group's idle certified lines could serve it immediately without new investment.
  4. Retail buyers rated supply reliability above formulation novelty when deciding listings, which reversed the group's own assumption about why it had lost three positions.
CLIENT PROFILE
A European natural cosmetics group with certified skincare and haircare ranges sold across specialist retail in eleven countries, with annual revenue in the mid hundreds of millions of euros (client-reported, unverified by MMA). The business held COSMOS certification across most of its range and bought botanical inputs largely on the spot market through a single broker relationship.
STRATEGIC CHALLENGE
Two consecutive poor shea seasons had pushed input cost up sharply and the group had repriced twice, losing three retail listings in the process. Management wanted to know whether the exposure was manageable through hedging or whether it required rebuilding the sourcing model, and separately whether the certification the group already held could generate revenue directly.
MMA APPROACH
MMA mapped every botanical input against origin concentration and harvest volatility, then modelled margin under three harvest scenarios. Forty-seven expert interviews across certification bodies, contract manufacturers and specialist retail buyers established what contract terms growers would actually accept and what a certified contract manufacturing offer would command from smaller brands in the same market.
KEY FINDINGS
  1. Four botanical inputs accounted for 71% of harvest exposure, and all four came from single growing regions through the same broker relationship.
  2. Growers in two origins would sign three-year volume agreements at roughly 6% above spot, terms nobody in the business had ever tested directly.
  3. Certified contract manufacturing demand from smaller brands exceeded available European capacity, and the group's idle certified lines could serve it immediately without new investment.
  4. Retail buyers rated supply reliability above formulation novelty when deciding listings, which reversed the group's own assumption about why it had lost three positions.
RECOMMENDED STRATEGY
Phase 1: Phase one: sign three-year agreements with growers in two origins for the four inputs carrying most of the harvest exposure. Phase 2: Phase two: qualify a second growing region per input through certification submission, accepting a year of documentation work before any commercial benefit appears. Phase 3: Phase three: open certified contract manufacturing on idle lines, priced to recover certification overhead rather than to compete with the group's own brands.
OUTCOME
Within four quarters the group had signed grower agreements covering three of the four exposed inputs and reported input cost variance narrowing considerably against the prior year (client-reported, unverified by MMA). Contract manufacturing revenue reached a mid single digit percentage of group turnover in its first full year, and two of the three lost retail listings were recovered.

Frequently Asked Questions

Foundational context covering the market sizes, CAGR, scope, country, region and competition that inform every finding below. This section is provided to cover basics and most often pre-purchase conversations, answered from the MMA Primary Research Dataset.

What is the current size of the Natural Cosmetics Market?

The global natural cosmetics market was valued at USD 42.0 billion in 2025, covering certified and policy-based natural finished personal care products. The 2026 figure reaches USD 45.5 billion.

How large will the Natural Cosmetics Market be by 2036?

MMA forecasts USD 102.0 billion by 2036, an increase of USD 56.5 billion over the 2026 base. That represents an expansion multiple of 2.24 times across the forecast period.

What is the CAGR for the Natural Cosmetics Market 2026 to 2036?

The base case compound annual growth rate is 8.4%, with a bull case at 9.6% and a bear case at 7.2%. Historical growth between 2020 and 2025 ran at 7.2%.

Which segment is growing fastest?

Certified natural skincare grows at 12.6%, half again the market rate of 8.4%, because certification supports a genuine price premium in high-active formats. Scalp treatment within haircare follows at 10.2%.

Who are the major companies in the Natural Cosmetics Market?

L'Oreal, Beiersdorf, Unilever, Amorepacific and Weleda lead on natural cosmetics revenue, with combined CR5 of 26%. A long tail of founder-led certified brands holds the remainder.

Which country is growing fastest?

India grows fastest at 10.6%, driven by Ayurvedic brands professionalising their sourcing documentation and pursuing certification for export markets. South Asia and Pacific leads regionally at 10.6%.

Report Segmentation Architecture

The full report scope spans multiple orthogonal segmentation dimensions, with cross-tabulated demand data provided for each dimension pair. Coverage extends further to regional breakdowns, trend trajectories, and the competitive detail needed to support segment-level decision-making.

By Product Category

  • Certified Natural Skincare
  • Natural Haircare and Scalp Care
  • Natural Colour Cosmetics
  • Natural Body and Bath Care
  • Natural Fragrance
  • Natural Oral and Personal Hygiene

By End-Use Industry

  • Retail Consumer Beauty
  • Professional Salon and Spa
  • Hospitality and Amenity Supply
  • Dermatological and Pharmacy Channels
  • Wellness and Resort Operators
  • Private Label Manufacturing

By Commercial Dimension

  • Specialist Beauty Retail
  • Pharmacy and Drug Chains
  • Mass Grocery and Hypermarket
  • Direct-to-Consumer Online
  • Subscription and Replenishment
  • Contract Manufacturing Supply

By Region

  • North America
  • Western Europe
  • East Asia
  • South Asia and Pacific
  • Latin America
  • Middle East and Africa
  • Eastern Europe

Scope, Methodology, and Coverage

Every figure in this report is reproducible from documented input assumptions. The scope below maps the historical period, the forecast horizon, the segmentation dimensions, and the countries covered, alongside the underlying primary and qualitative methodology.
Historical Period
2020 to 2025
Forecast Period
2026 to 2036
Base Year
2025 (USD billions; MMA Primary Research Dataset, August 2026)
Market Definition
The natural cosmetics market covers finished personal care products formulated to a recognised natural or organic standard, spanning skincare, haircare, colour cosmetics, body and bath care, fragrance and oral hygiene. Scope includes products certified by COSMOS, NATRUE, Ecocert or an equivalent national scheme, and products marketed to a published natural ingredient policy without formal certification. Excluded are raw botanical ingredients sold to formulators, dietary supplements, pharmaceutical topicals, professional salon equipment and conventional products carrying only a single natural claim.
Quantitative Units
USD billion, 2025 base year, 2026 to 2036 forecast period
Segmentation Dimensions
Product category, end-use industry, commercial channel, region
Regions Covered
North America, Western Europe, East Asia, South Asia and Pacific, Latin America, Middle East and Africa, Eastern Europe
Countries Covered
United States, Canada, Germany, France, United Kingdom, Italy, Spain, Poland, China, Japan, South Korea, India, Australia, Brazil, Mexico, Saudi Arabia, United Arab Emirates, South Africa
Key Companies Profiled
20 companies across certified brand owners, diversified consumer groups and contract formulators
Quantitative Methodology
Primary survey, n=3,800 respondents, Q4 2025, six countries; demand-side model with trade association cross-validation
Qualitative Methodology
47 expert interviews, Q4 2025; applied to validate demand model assumptions, identify emerging dynamics, and assess competitive positioning
Report Format
PDF and XLSX data workbook (Word format preview document)
Publisher
Market Minds Advisory
Report Code
MMA-2026-CHM-191
Published
August 2026
Contact
sales@marketmindsadvisory.com | www.marketmindsadvisory.com

Purchase the full Natural Cosmetics Market Report (2026 to 2036).

The full MMA report on the natural cosmetics market runs to detailed segment and regional models across the 2026 to 2036 forecast period, with certification cost benchmarks and botanical input exposure mapped by origin. It profiles 20 companies on a consistent revenue basis, covering certified brand owners, diversified consumer groups and the contract formulators increasingly competing with both. Preservation stability data is presented alongside the distribution channels each threshold opens. Regional chapters cover the seven MMA regions with country-level detail on the eighteen markets surveyed. Primary research draws on a quantitative survey of 3,800 respondents across six countries and 47 expert interviews conducted in Q4 2025.
Certification cost and lead time benchmarks by standard
Botanical input exposure mapped by growing origin
Preservation stability thresholds and the channels they open
Twenty company profiles on a consistent revenue basis
Retailer exclusion list coverage across major beauty chains
Seven regional chapters with eighteen country detail tables

Built For The People Who Decide

From boardroom strategy to bench-side execution, this report is read cover-to-cover by leaders shaping the next decade of their industry, turning demand scenarios, market dynamics and valuation benchmarks into decisions.
CXOs/ Presidents/ VPs/ Managers
M&A and Corporate Development
Strategy Teams and R&D Heads
Procurement and Product Directors
Regulatory and Compliance Leaders
Investor Relations and Equity Analysts