Market Minds Advisory
Natural Antioxidant Market

Natural Antioxidant Market: Natural Antioxidant Market: protection cost, by-product supply and the applications substitution cannot reach, to 2036

Clean label conversion took the easy applications years ago and has stalled at the hard ones, because natural protection costs several times more exactly where oxidation actually threatens the product.

Lead Analyst

Lisa Gevelber

Published

September 2026

Make Smarter Decisions with Customized Research Insights

Request a free sample report and evaluate market opportunities, growth trends, and competitive dynamics relevant to your business needs.

2025 MARKET VALUE$1.6BMarket Size 2025
2036 FORECAST VALUE$3.5BBase Case , 2026 to 2036
CAGR 2026 TO 20367.2 %Bull 8.4% / Bear 6.0%
INCREMENTAL OPPORTUNITY$1.7BNet 10- year value creation
EXPANSION MULTIPLE2.00x2036 value over 2026 base
Strategic Levers
M&A Pipeline
Regional Outlook
Country Rankings
Competitive Intelligence
Segmental Deep-dive
Call-Us : 91 93563 13602

Executive Snapshot and Market Trajectory.

Natural antioxidants cost roughly 4.2 times more than synthetics per unit of oxidative protection delivered, and the gap widens precisely where oxidation does the most damage. High-temperature frying is only 19% converted after two decades of clean label pressure. That is not a slow start.
Pet food and animal feed grow at 10.8%, half again the market rate of 7.2%, because kibble fat oxidation is a real quality failure and pet owners read those labels more carefully than they read their own. North America holds 28% of value on clean label reformulation and premium pet nutrition together. Pet applications already take 21% of volume. Mainstream brands are now following the premium ones.
Five suppliers hold 36% of the market and the concentration reflects extraction capability rather than raw material control. The supply fact nobody in food formulation expects is that around 78% of natural tocopherol comes from soybean oil deodoriser distillate, so supply tracks soybean crushing volume rather than any antioxidant demand signal at all. When crush volumes fall the price spikes, and formulators neither anticipate that cycle nor hedge it. Rosemary carries a parallel exposure.
Market Definition
This report covers natural antioxidants supplied as ingredients for oxidative protection, spanning tocopherols, rosemary and other plant extracts, ascorbates of natural origin, and polyphenol concentrates, across edible oils and fats, meat and poultry processing, bakery and snacks, pet food and animal feed, nutraceuticals and supplements, and cosmetics and personal care. Value is measured at producer level on tonnage of active antioxidant supplied. Excluded are synthetic antioxidants including BHA, BHT and TBHQ, chelating agents, antimicrobial preservatives, and botanical extracts sold for flavour or colour rather than oxidative stability.
Base Year Value
$1.6B in 2025 (MMA Primary Research Dataset, August 2026)
Forecast Period
2026 to 2036, eleven discrete annual values
CAGR
7.2% base case. Bull 8.4%. Bear 6.0%.
Fastest Growth Segment
Pet Food and Animal Feed: 10.8% CAGR
Fastest Growth Country
India: 10.4% CAGR
Fastest Growth Region
South Asia and Pacific: 9.2% CAGR
Largest Region
North America: 28% of 2025 global value
Market Leaders
Kemin Industries, BASF, DSM-Firmenich, Kalsec and Archer Daniels Midland lead the market. Source: MMA Primary Research Dataset, July 2026.
Primary Survey
n=3,800 procurement and R&D decision-makers, Q4 2025, six countries
Methodology
Demand-side build-up, cross-validated against public data, 47 expert interviews

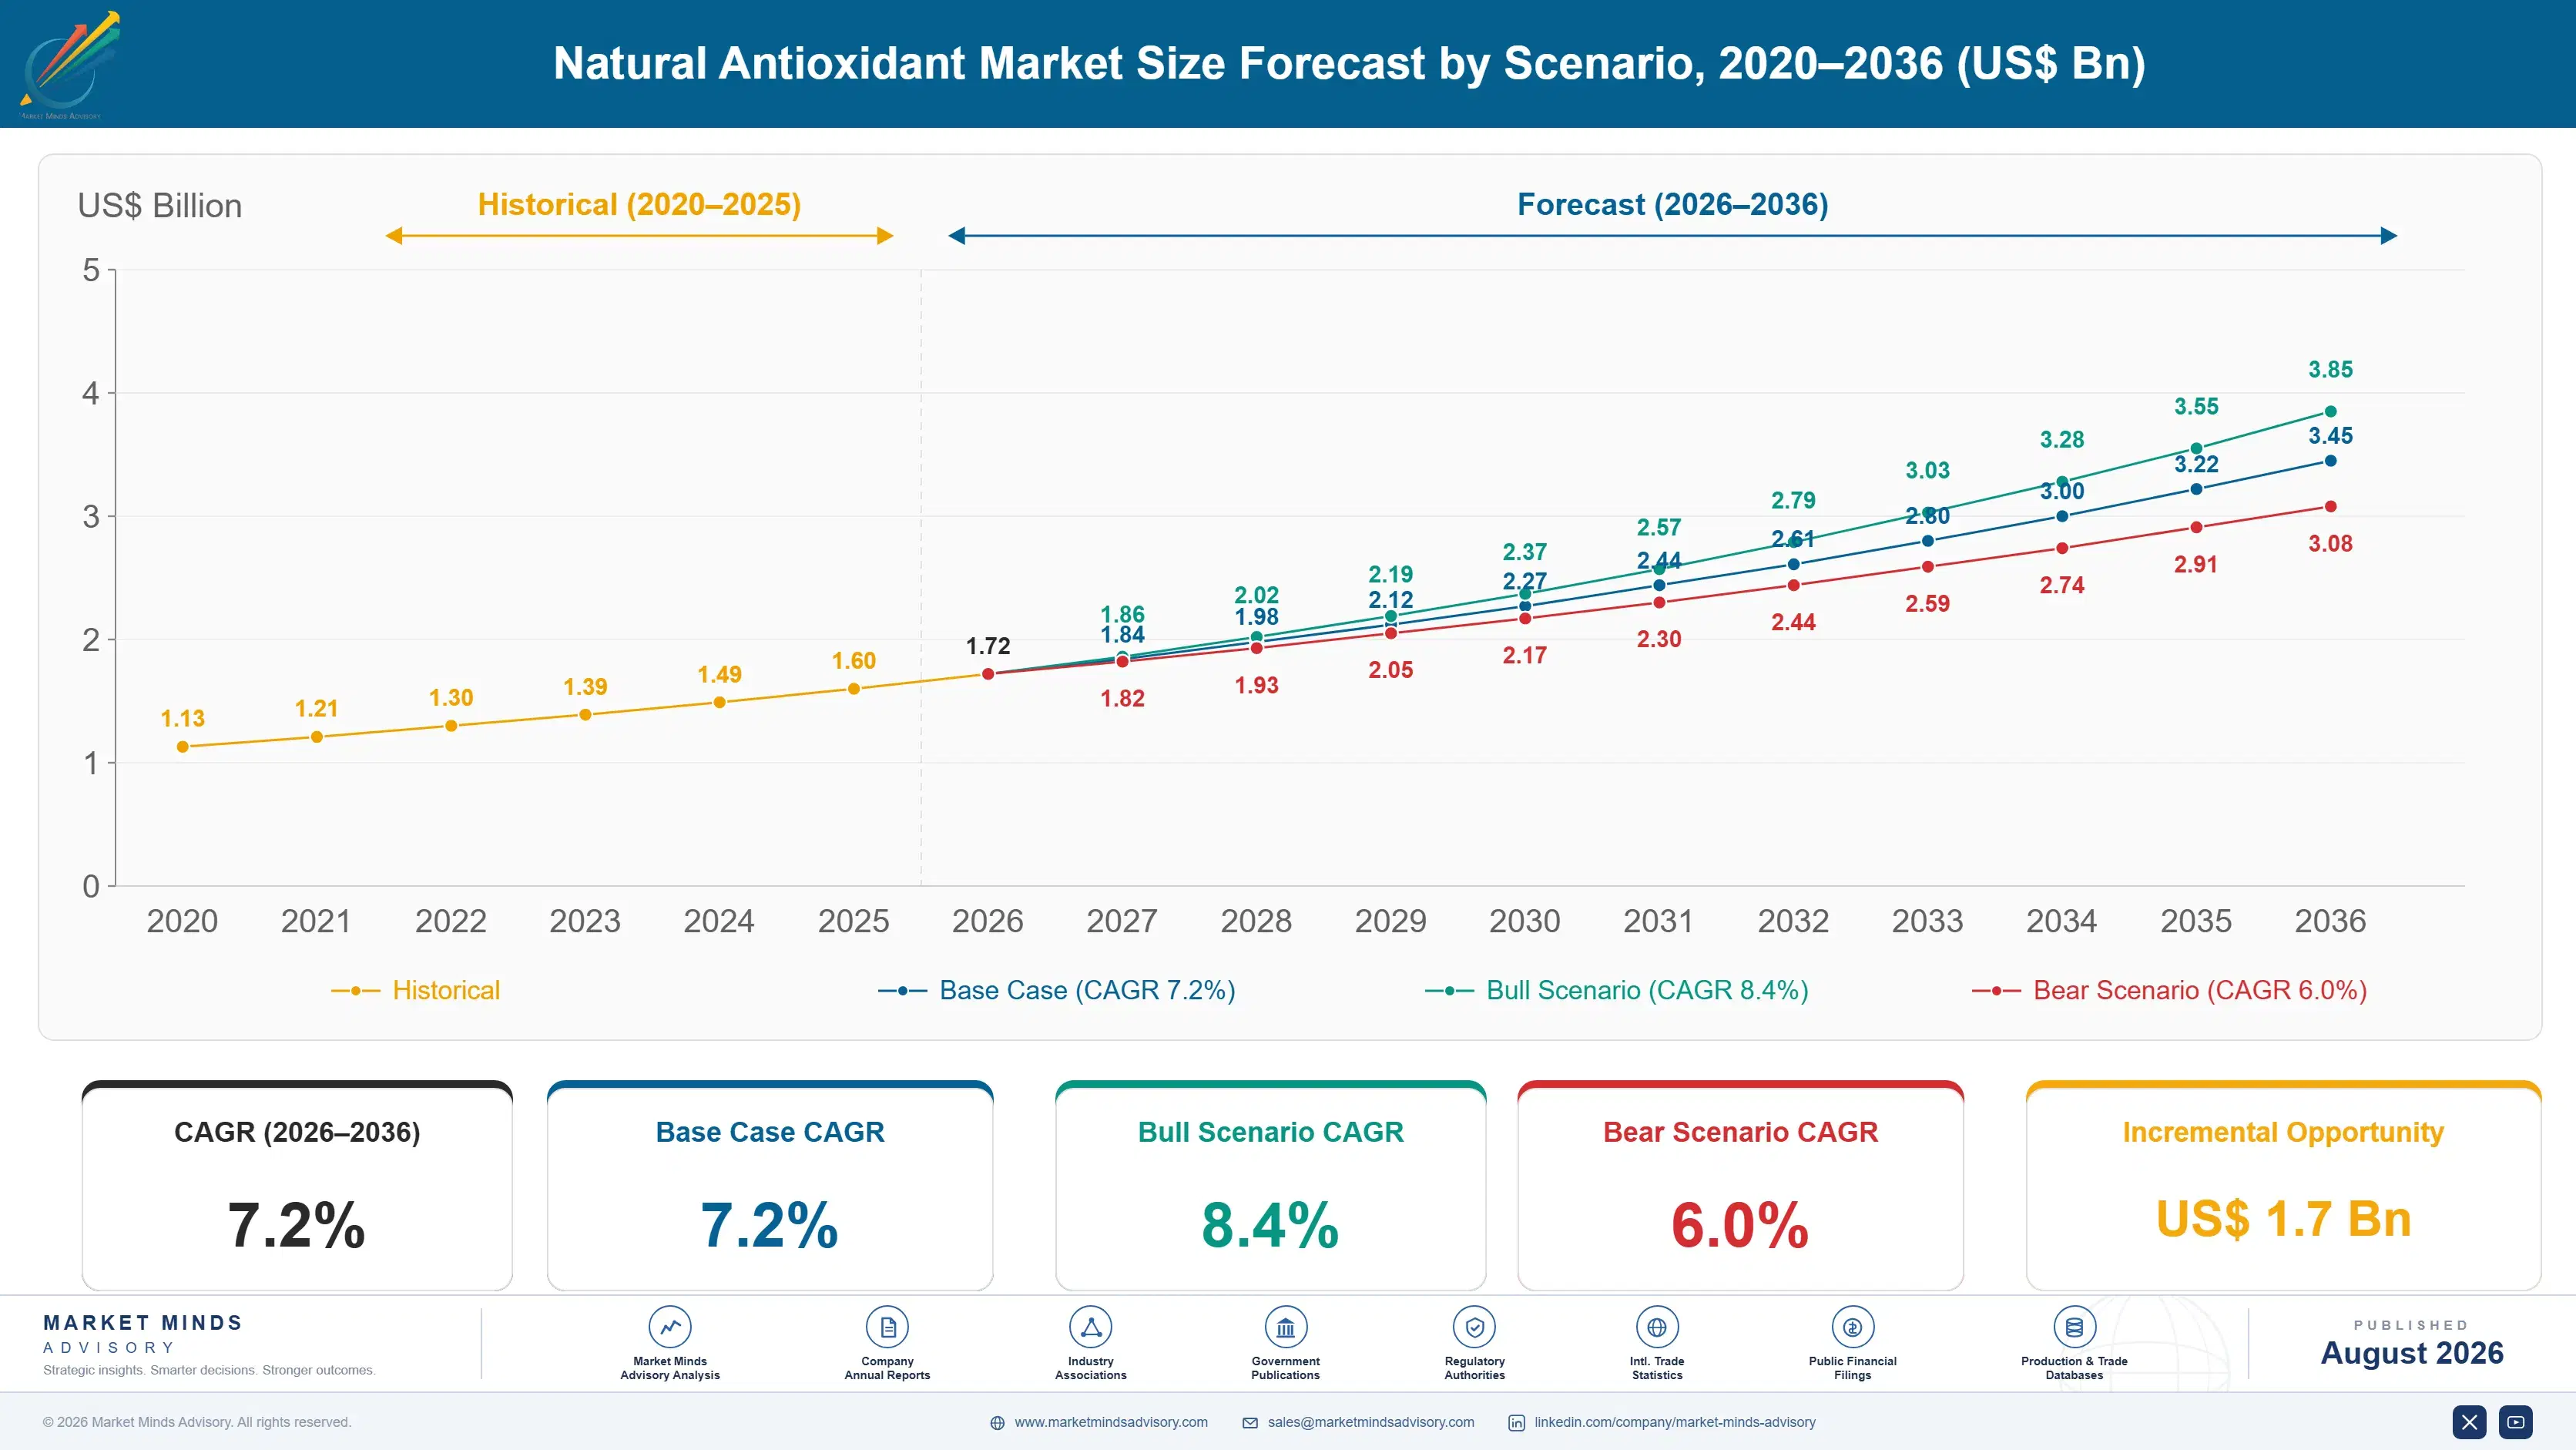
Natural Antioxidant Market Forecast Scenarios

natural-antioxidant-market-trends-size-forecast-scenario-1787555855874
Growth ran at 6.2% between 2020 and 2025 and it came almost entirely from applications where oxidation is a moderate problem rather than a severe one. Short shelf-life products, premium positioning and pet food converted readily. Frying oils, long shelf-life shelf-stable products and anything sitting warm on a shelf for a year mostly did not, and the reasons were arithmetic rather than attitudinal.
The 7.2% base case rests on three mechanisms. Pet food and animal feed at 10.8%, where fat oxidation is a genuine quality failure and label scrutiny is unusually intense. Meat and poultry processing, where colour and flavour stability sell product directly. And Asian food manufacture converting as domestic brands adopt the label positioning that Western brands established, with Indian growth at 10.4% leading every country. Local extraction capacity is developing quickly alongside that demand.
The 8.4% bull case is a plant extract combination delivering genuine frying stability at acceptable cost, which would open the 81% of high-temperature applications still using synthetics. The 6.0% bear case is a soybean crush contraction tightening tocopherol supply, since 78% of it arrives as a by-product nobody produces deliberately. Nobody grows soybeans for vitamin E, which is exactly the problem.

Where Clean Label Stopped

The clean label story in antioxidants is usually told as a substitution curve that keeps climbing. It stopped climbing in the applications that matter most, and the reason is arithmetic. Natural antioxidants deliver roughly a quarter of the oxidative protection per dollar that synthetics do, and the deficit is worst at high temperature where thermal degradation of the active is fastest. High-temperature frying sits at 19% converted after two decades of pressure. That number has barely moved in five years.
TOP-FIVE CONCENTRATION36%Combined position across supply held by the leading ingredient producers
COST PER PROTECTION UNIT4.2xPremium over synthetic alternatives per unit of oxidative protection
TOCOPHEROL BY-PRODUCT ORIGIN78%Share derived from soybean oil deodoriser distillate streams
PET FOOD APPLICATION SHARE21%Portion of volume consumed protecting fats in pet nutrition
FRYING APPLICATION PENETRATION19%Share of high temperature frying that has converted away
ROSEMARY CULTIVATION CONCENTRATION64%Portion of supply grown across a few Mediterranean countries
Where conversion did happen, it happened for reasons other than performance. Pet food went natural because owners scrutinise those labels intensely and the fat content makes oxidation visible as rancidity, which is a complaint rather than a subtle quality drift. Meat processors converted because colour and flavour stability sell directly. Premium bakery converted because the label was worth more than the ingredient cost. None of those buyers were choosing a better antioxidant.
The supply side carries a constraint food formulators rarely anticipate. Around 78% of natural tocopherol arrives as a by-product of soybean oil deodorising, so the volume available depends on how much soybean oil gets refined, not on what antioxidant buyers want.
"The industry keeps presenting conversion as inevitable and it demonstrably is not. Frying has sat at roughly a fifth converted for years because natural chemistry genuinely cannot do that job at that price. Selling into the applications that have already converted is a crowded business; solving frying would be a different one."
Director, Food Ingredients and Preservation Practice · MMA Food and Agriculture Ingredients Practice · August 2026

Market Trends

Conversion stalls in high-temperature and long-shelf-life applications

Clean label substitution moved quickly through short shelf-life and premium products and then stopped where the oxidative challenge is severest. High-temperature frying remains 19% converted because natural actives degrade thermally faster than the synthetics they replace, and overdosing to compensate introduces off-flavour before it delivers equivalent protection. Long shelf-life shelf-stable products face the same problem across time rather than temperature. Commercially this means the addressable market is considerably smaller than clean label rhetoric suggests, and suppliers presenting a linear conversion curve are mispricing their own growth prospects. Two decades of pressure has not moved that arithmetic.
Market Impact: Drives 7.0% segment growth
Pet nutrition converts faster than human food ever did

Pet food and animal feed compound at 10.8%, faster than any human food application, because kibble carries high fat content that oxidises into visible rancidity rather than subtle quality loss, and because pet owners scrutinise those ingredient panels with an intensity they rarely apply to their own groceries. Premium brands converted early and mainstream brands followed on competitive pressure. The segment already takes 21% of volume. Palatability matters more than in human food, since a dog refusing the bowl is an immediate and unambiguous product failure. Mainstream conversion is now following premium under competitive pressure.
Market Impact: Indian demand compounds at 10.4%

Market Opportunities and Growth Drivers

Meat processors convert for colour and flavour stability

Rosemary extract and acerola preparations hold meat colour and delay flavour deterioration in ways that translate directly into retail sales, since a consumer selects the redder package without any conscious reasoning about oxidation chemistry. Processors therefore treat the ingredient as a selling cost rather than a preservation cost, which changes how they price it internally. Clean label pressure from retailers reinforces the same choice. Conversion in this application ran well ahead of frying or long shelf-life products because the commercial return was immediate and measurable at shelf. Acerola and rosemary blends dominate the application entirely.
Market Impact: Costs 4.2 times synthetic protection

Asian food manufacturers adopt Western label positioning

Domestic food brands across China, India and Southeast Asia have adopted the clean label positioning Western brands established, driven by rising middle-income purchasing and by imported retail formats that display ingredient panels prominently. Indian growth at 10.4% leads every country in this market. The conversion pattern follows the same shape seen earlier elsewhere, taking premium and short shelf-life products first while frying oils continue using synthetics. Local extraction capability is developing quickly, particularly in India where botanical processing capacity already exists at genuine scale. Frying oils there remain almost entirely synthetic, for the same cost reasons that apply everywhere else.
Market Impact: Supplies 78% from by-product streams

Market Restraints and Challenges

Protection cost gap blocks the hardest applications entirely

Natural antioxidants deliver roughly a quarter of the oxidative protection per dollar that synthetics provide, and the root cause is that plant-derived actives are less thermally stable and less potent per unit mass than purpose-designed molecules. Overdosing to close the gap introduces off-flavour and colour before it reaches equivalence. Commercially this leaves frying oils and long shelf-life products largely unconverted at 19% and 24% respectively. Suppliers are pursuing synergistic blends of tocopherol, rosemary and ascorbyl palmitate that stretch performance without proportionate cost. None of that work has yet reached frying at acceptable cost anywhere.
Market Impact: Frying remains 81% unconverted

Tocopherol supply arrives as an uncontrollable by-product stream

Around 78% of natural tocopherol originates in soybean oil deodoriser distillate, meaning supply is set by how much soybean oil the world refines rather than by any antioxidant demand signal reaching a producer. The root cause is that nobody grows soybeans for vitamin E. Commercially this produces price spikes when crush volumes fall and gluts when they rise, on a cycle food formulators neither anticipate nor hedge. Producers are developing sunflower and palm distillate routes and exploring fermentation, which remains costly at scale. Feed market vitamin E demand competes for the identical stream.
Market Impact: Segment takes 21% of volume
3 additional market trends, 4 additional growth drivers, and 2 additional restraints and challenges are covered in the full report. Contact sales@marketmindsadvisory.com to access the complete intelligence.

Segment CAGR and Growth Architecture

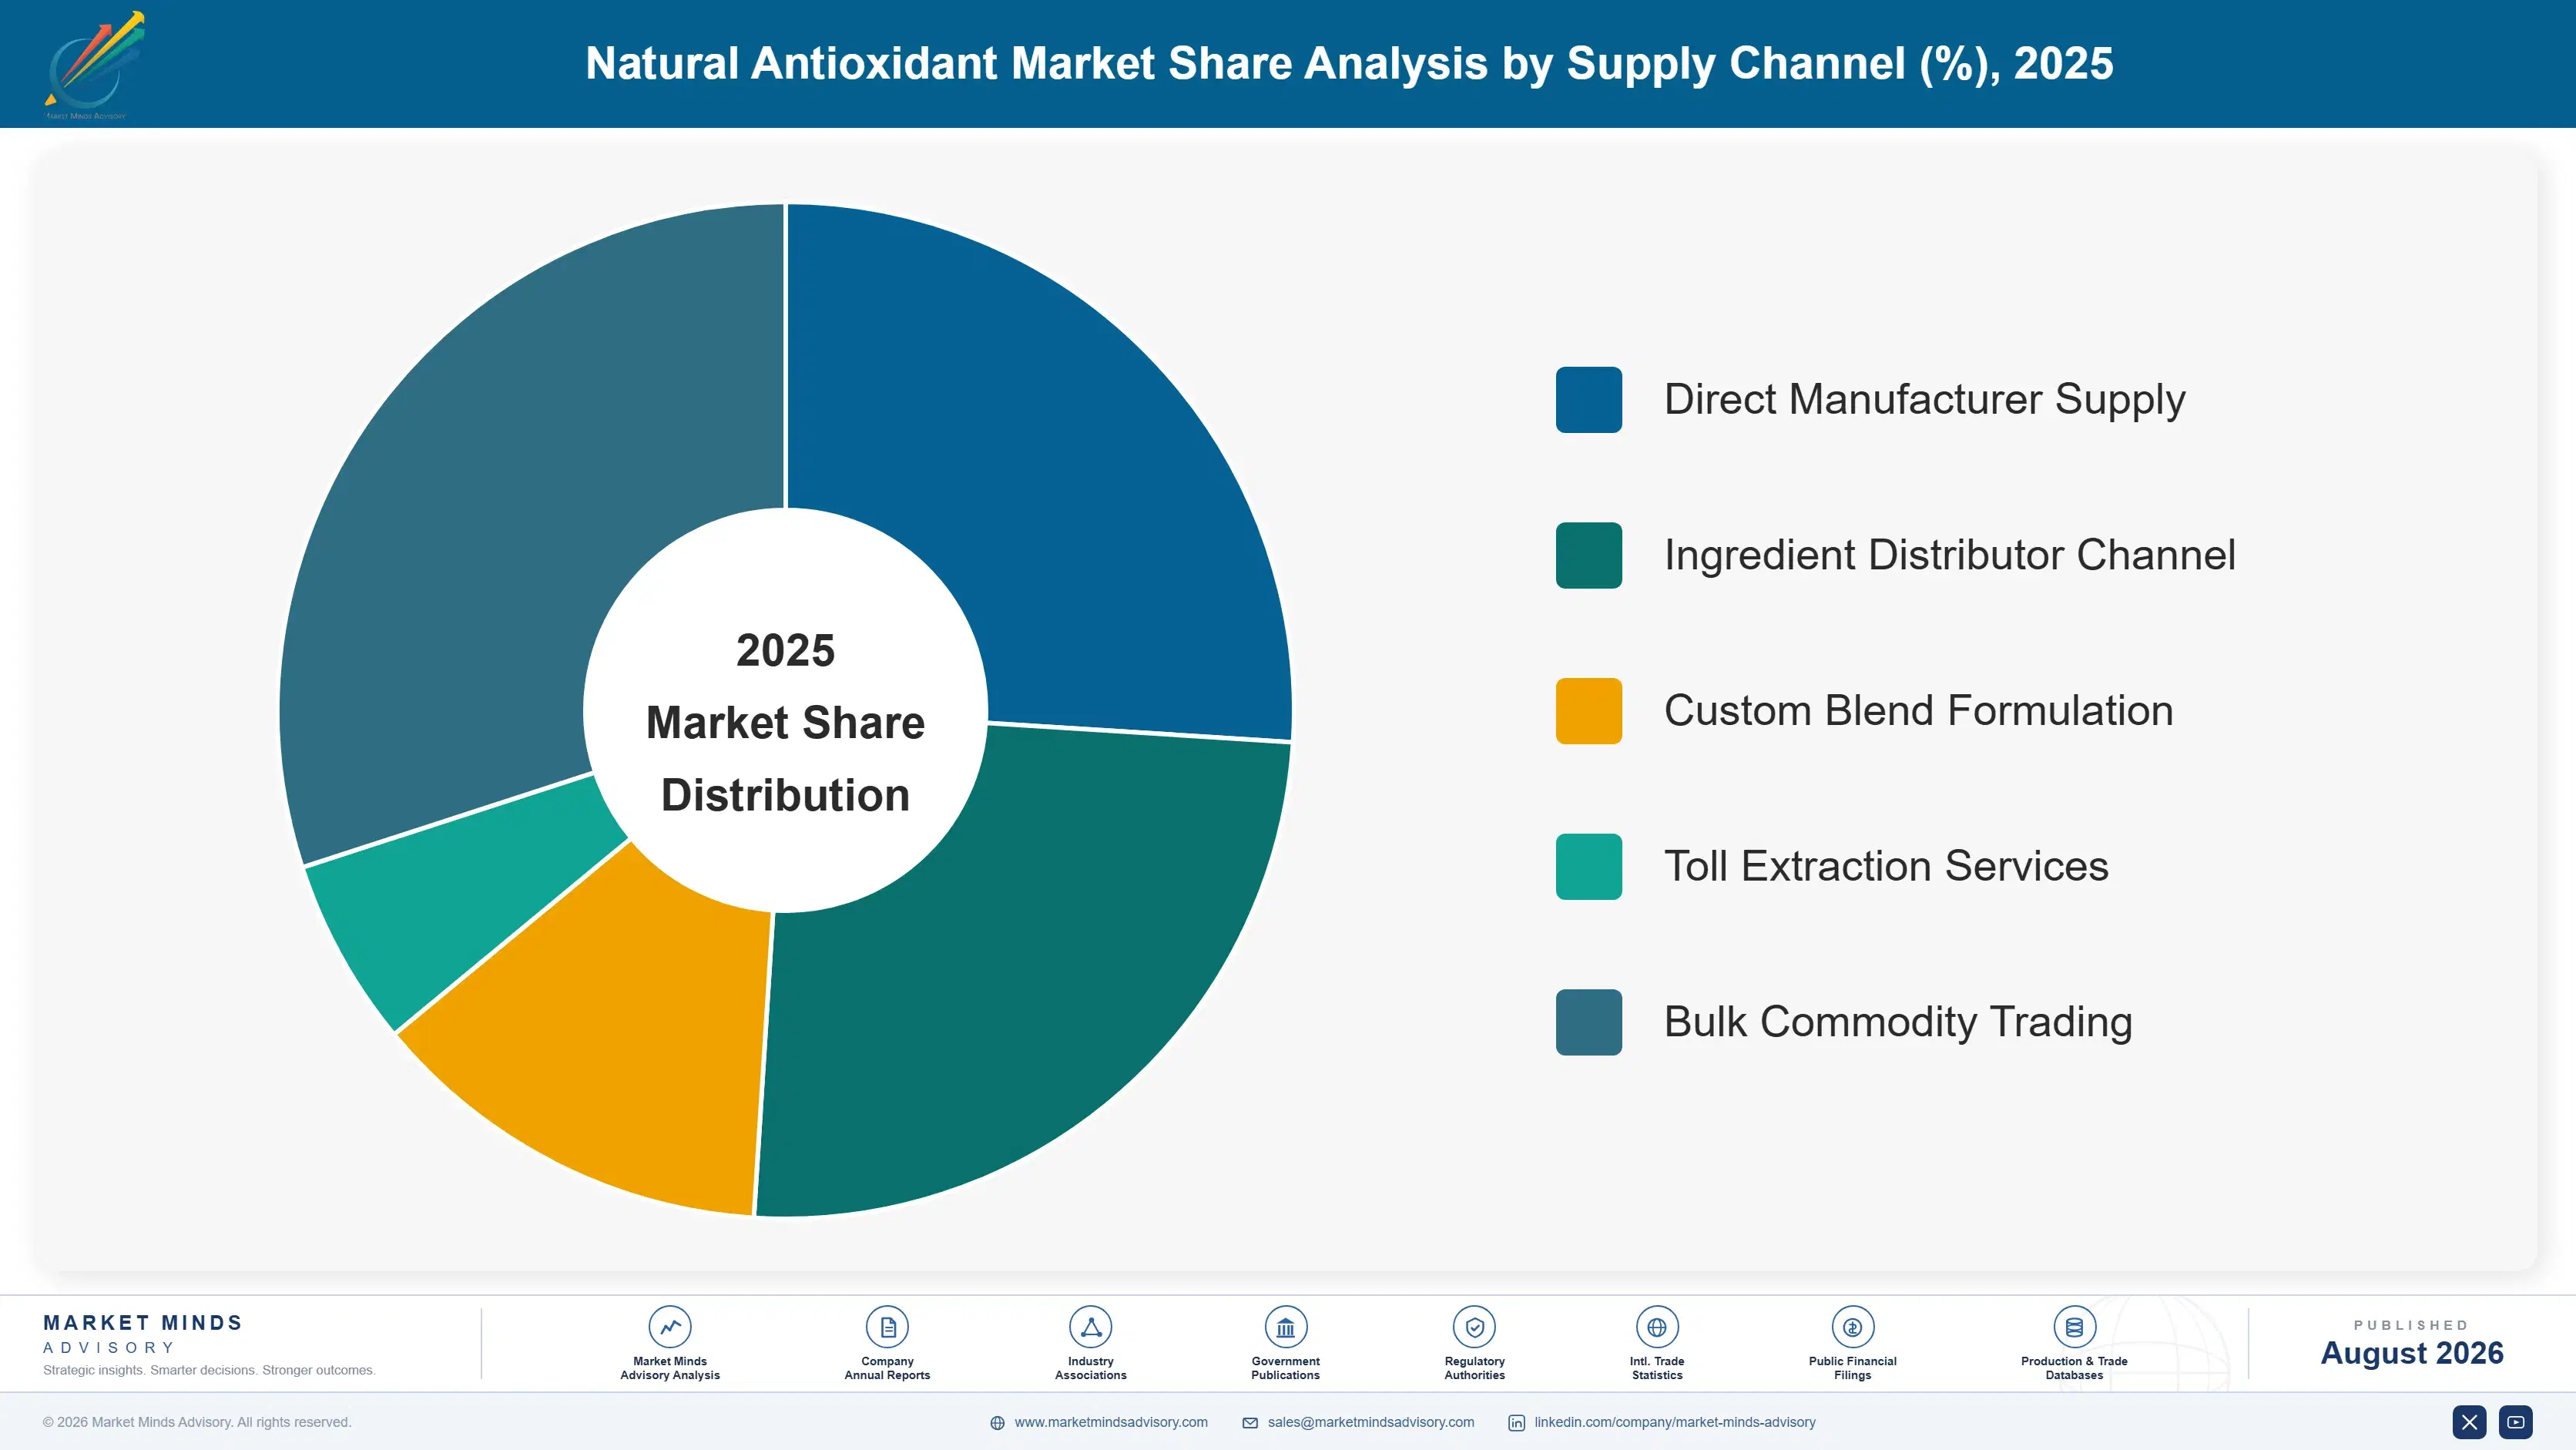
Volume is classified here by end application, since the oxidative challenge and the willingness to pay for natural protection differ enormously between a commercial fryer and a premium kibble. Antioxidant chemistry, botanical source and supply channel are each handled separately in the framework below, because most applications use blends rather than any single active.
natural-antioxidant-market-trends-market-share-analysis-1787555856408

Pet Food and Animal Feed

Growing at 10.8%, half again the market rate, this is the fastest application in the market and the reasons are unusually concrete. Kibble carries high fat content that oxidises into rancidity a consumer can smell, which makes it a complaint rather than a gradual quality drift nobody notices. Owners scrutinise pet ingredient panels with an intensity they rarely apply to their own food, so the label carries genuine commercial weight. Palatability matters more here than anywhere, since a refused bowl is an immediate and unambiguous product failure. Premium brands converted first and mainstream brands followed under competitive pressure rather than any regulation. Feed applications add volume where livestock fat stability matters commercially.
CAGR 10.8%

Nutraceuticals and Supplements

Supplement formulations carry oils, botanicals and lipid-soluble actives that oxidise readily, and the entire category is positioned on natural credentials that a synthetic antioxidant on the panel would visibly contradict. Growth at 8.6% follows category expansion rather than any conversion, since almost nothing here ever used synthetics in the first place. Softgel and gummy formats carry particular oxidative exposure through their oil phases and through processing heat. Ingredient cost tolerance is high because the finished product carries substantial margin, which makes this among the least price-sensitive applications any antioxidant supplier serves anywhere. Certification status and botanical origin documentation matter more here than in any food application, since the finished product is sold explicitly on natural credentials.
CAGR 8.6%
Full segment breakdown across 6 segments available in the complete report.

Regional Architecture and Country Demand Map

North America holds 28% of value on clean label reformulation and premium pet nutrition together, which is where conversion went furthest and fastest of anywhere. East Asia follows at 25% on sheer food manufacturing scale and on rapidly rising label expectations across its domestic brands.

North America

Clean label reformulation went furthest here, driven by retailer ingredient policies and by consumer pressure rather than by any regulation banning synthetic antioxidants. Premium pet nutrition is the single strongest demand pocket anywhere in this market, with owners scrutinising panels intensely and brands competing directly on ingredient credentials. Meat and poultry processing converted early for colour stability that sells at shelf. Frying applications remain largely unconverted on cost, exactly as elsewhere. Growth at 6.8% sits below the market rate because the easy conversion here is already substantially complete. Canadian and Mexican food manufacture follows the same retailer ingredient policies through cross-border supply relationships. Bakery and snack conversion is partial and concentrated in premium ranges.
Share: 28% | CAGR: 6.8% (2026 to 2036)

East Asia

Chinese food manufacturing operates at a scale that makes even modest conversion rates commercially significant, and domestic brands have adopted clean label positioning as middle-income purchasing rises. China is also a major producer of natural tocopherol through Zhejiang Medicine, NHU and Wilmar, which gives the region unusual supply depth alongside its demand. Japanese and Korean manufacturers converted earlier and now buy on quality consistency rather than price. Growth at 8.2% reflects domestic brand reformulation more than any regulatory requirement, and it continues accelerating in packaged categories. Taiwanese and Korean pet food manufacture is a growing demand pocket. Frying applications across the region remain almost entirely synthetic, on identical cost grounds to everywhere else.
Share: 25% | CAGR: 8.2% (2026 to 2036)
Regional intelligence for 5 additional markets available in the complete report: Western Europe, South Asia and Pacific, Latin America, Middle East and Africa, Eastern Europe. Contact sales@marketmindsadvisory.com.
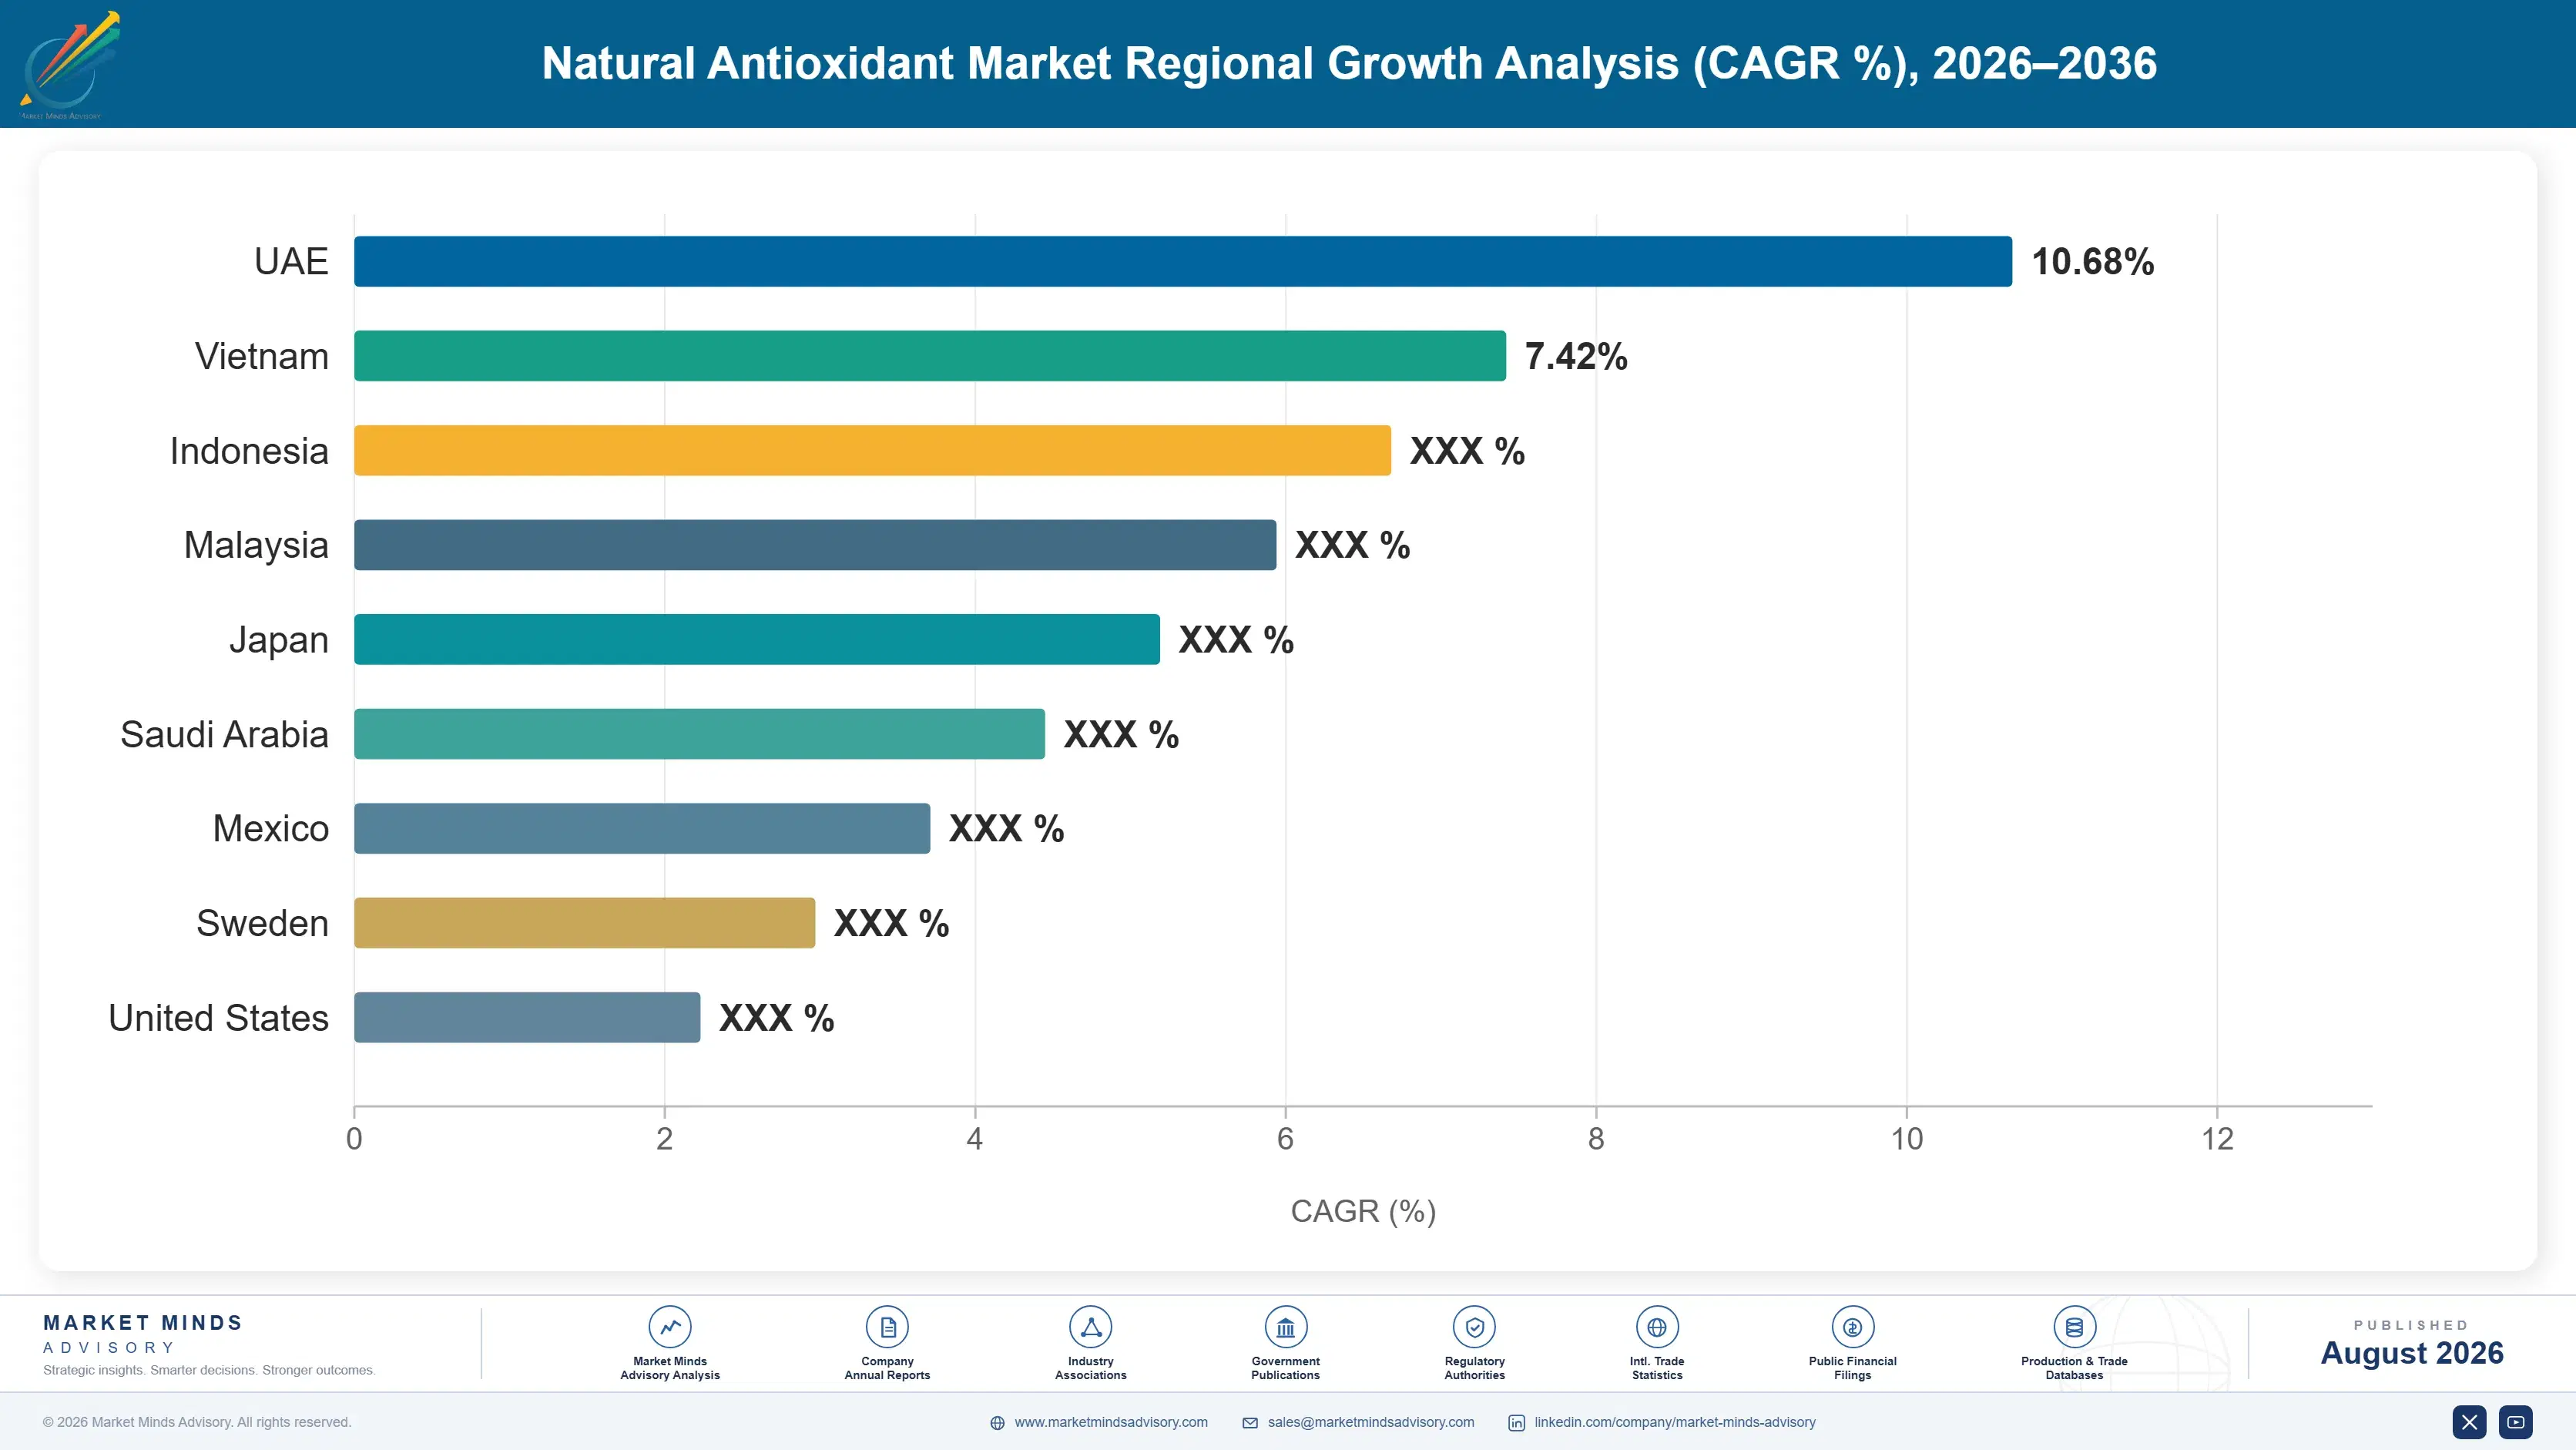
natural-antioxidant-market-trends-country-cagr-analysis-1787555856921

Where Antioxidant Margin Actually Concentrates

Four moves matter in a market where conversion has already taken every easy application and the remaining ones resist for arithmetic reasons rather than out of habit. Two concern serving converted demand properly, one concerns the supply constraint nobody hedges against, and the fourth concerns the applications that remain genuinely open to anybody who solves them.

Build blends that stretch protection per dollar

Tocopherol, rosemary extract and ascorbyl palmitate work synergistically, and a properly designed blend delivers meaningfully more oxidative protection per dollar than any single active does alone. That matters because the natural option currently costs roughly 4.2 times synthetic protection, and closing even part of that gap opens applications currently priced out entirely. Formulation capability rather than extraction capacity is what differentiates suppliers here. Sellers offering single actives against a blend specialist are competing on price for a commodity position. Blend design is also considerably harder to copy than an extract specification, which makes the position more defensible over time.
Market Impact: Attacks a 4.2 times synthetic cost premium directly

Serve pet nutrition as its own commercial discipline

Pet food and feed compound at 10.8% and already take 21% of volume, and the buying criteria differ genuinely from human food. Palatability is decisive because a refused bowl is immediate product failure, fat content makes oxidation visible as rancidity, and owners audit ingredient panels closely. Suppliers treating this as a variant of food ingredient selling miss the palatability testing and the label positioning support that pet brands actually want. It is the fastest growth available in this market. Feeding trial support is what pet brands ask for and rarely receive.
Market Impact: Serves 21% of volume now growing at 10.8%

Diversify tocopherol feedstock beyond soybean distillate

Around 78% of natural tocopherol comes from soybean oil deodoriser distillate, which means supply responds to global soybean crushing rather than to any demand signal, producing spikes and gluts that formulators neither predict nor hedge. Sunflower and palm distillate routes plus fermentation development reduce that exposure meaningfully. Suppliers who can offer supply continuity through a crush contraction win contracts on reliability rather than price, and those contracts persist long after the disruption has passed. Sunflower and palm distillate carry different tocopherol profiles requiring separate qualification, so the work has to be finished before anybody needs it.
Market Impact: Reduces reliance on a single 78% feedstock stream

Target frying with thermal stability, not marketing

High-temperature frying remains 81% unconverted because natural actives degrade thermally faster than synthetics and overdosing produces off-flavour before it produces equivalence. This is a genuine chemistry problem and no amount of clean label positioning solves it. A supplier delivering demonstrated frying stability at tolerable cost would open the largest unconverted application in the market. Suppliers currently selling frying products on label appeal rather than measured oxidative stability are setting up disappointed customers and lost repeat business. The commercial prize is the largest single unconverted application anywhere in this market, and nobody has yet claimed it.
Market Impact: Addresses the 81% of frying still unconverted today

Who Controls the Margin Pool

Five suppliers hold 36% of the market, measured on tonnage of active antioxidant supplied, the basis used throughout this section. That concentration reflects extraction and formulation capability rather than any control over raw material, since rosemary is an agricultural crop and tocopherol arrives as a by-product neither producer nor buyer controls. Application knowledge is what actually separates the leaders from everyone else.
Competition runs on four dimensions. Blend formulation skill, which decides protection delivered per dollar and therefore which applications are commercially reachable at all. Application testing support, since a food manufacturer needs oxidative stability data generated on its own product rather than a generic datasheet. Supply continuity through distillate volatility. And regulatory approval status by jurisdiction, which varies considerably for plant extracts and constrains where a product can be sold.

Rankings shift toward suppliers with genuine pet nutrition capability and toward those offering formulated blends rather than single actives. Indian and Chinese extractors are moving up from raw material supply into formulated products, which compresses the premium application support has historically commanded. Anyone solving frying thermal stability would reorder this table entirely, and several suppliers are actively trying.
natural-antioxidant-market-trends-company-positioning-matrix-1787555857443

Competitive Moat and Risk Dimensions

KEMIN INDUSTRIES

Moat: Application testing and blends

The company built its position on oxidative stability testing conducted on the customer's actual product rather than on generic data, which is what a food or pet food manufacturer needs before reformulating anything. Blend formulation across tocopherol, rosemary and supporting actives delivers more protection per dollar than single ingredients, and pet nutrition capability is genuinely deep.
KEMIN INDUSTRIES

Risk: Limited raw material control

Neither rosemary cultivation nor soybean distillate supply is controllable, and around 78% of tocopherol arrives from a by-product stream that responds to crush volumes rather than demand. Backward-integrated extractors in India and China are moving into formulated products. Supply continuity through a distillate contraction is where that exposure becomes commercially visible.
KALSEC

Moat: Rosemary extraction and colour

Deep capability in rosemary and spice extraction combines antioxidant function with the colour and flavour stability that meat processors buy for directly, which lets the company sell into a commercial return rather than a preservation cost. Long-standing meat industry relationships and application data supporting them are difficult for a newer entrant to replicate quickly.
KALSEC

Risk: Mediterranean cultivation concentration exposure

Roughly 64% of rosemary supply grows across a handful of Mediterranean countries, where drought and harvest variability move both availability and carnosic acid content year to year. Larger diversified suppliers absorb that variation across a wider portfolio. Cultivation expansion elsewhere takes several seasons to reach commercial yield and quality consistency.

Players Tracked

Prominent Players

Kemin Industries
BASF
DSM-Firmenich
Kalsec
Archer Daniels Midland

Other Key Players

Givaudan
Cargill
Barentz
Vitablend
Camlin Fine Sciences
Zhejiang Medicine
Zhejiang NHU
Wilmar International
International Flavors and Fragrances
Prinova
Synthite Industries
Plant Lipids
Indena
Layn Natural Ingredients
Corbion

Recent Developments

APRIL 2025

A supplier launched a blend targeting frying oil stability

An ingredient supplier introduced a synergistic tocopherol and plant extract blend positioned specifically for high-temperature frying, supported by accelerated oxidative stability data on commercial frying oils. This was a product launch rather than any acquisition, joint venture or partnership arrangement. Frying oil trials ran across several commercial formats.
Signal: Frying is the largest unconverted application, and suppliers are attacking it with chemistry rather than with label positioning
JULY 2025

An Indian extractor expanded formulated antioxidant blend capacity

An Indian botanical extraction company commissioned capacity for formulated antioxidant blends rather than raw extracts, moving up the value chain toward the application support that Western suppliers have historically provided. This was organic capital investment rather than any transaction with another company. Application laboratory capability was added alongside it.
Signal: Backward-integrated extractors are moving into formulation, which compresses the margin premium that application support has long commanded
NOVEMBER 2025

A pet food producer converted a mainstream range to natural preservation

A large pet food manufacturer completed conversion of a mainstream brand range from synthetic to natural antioxidant systems, following palatability and shelf-life validation across multiple kibble formats. This was a reformulation decision rather than any commercial transaction between the companies involved. Mainstream price points absorbed the ingredient cost increase.
Signal: Mainstream pet brands now follow premium conversion under competitive pressure, which extends the fastest segment considerably further

What Sets Ingredient Cost

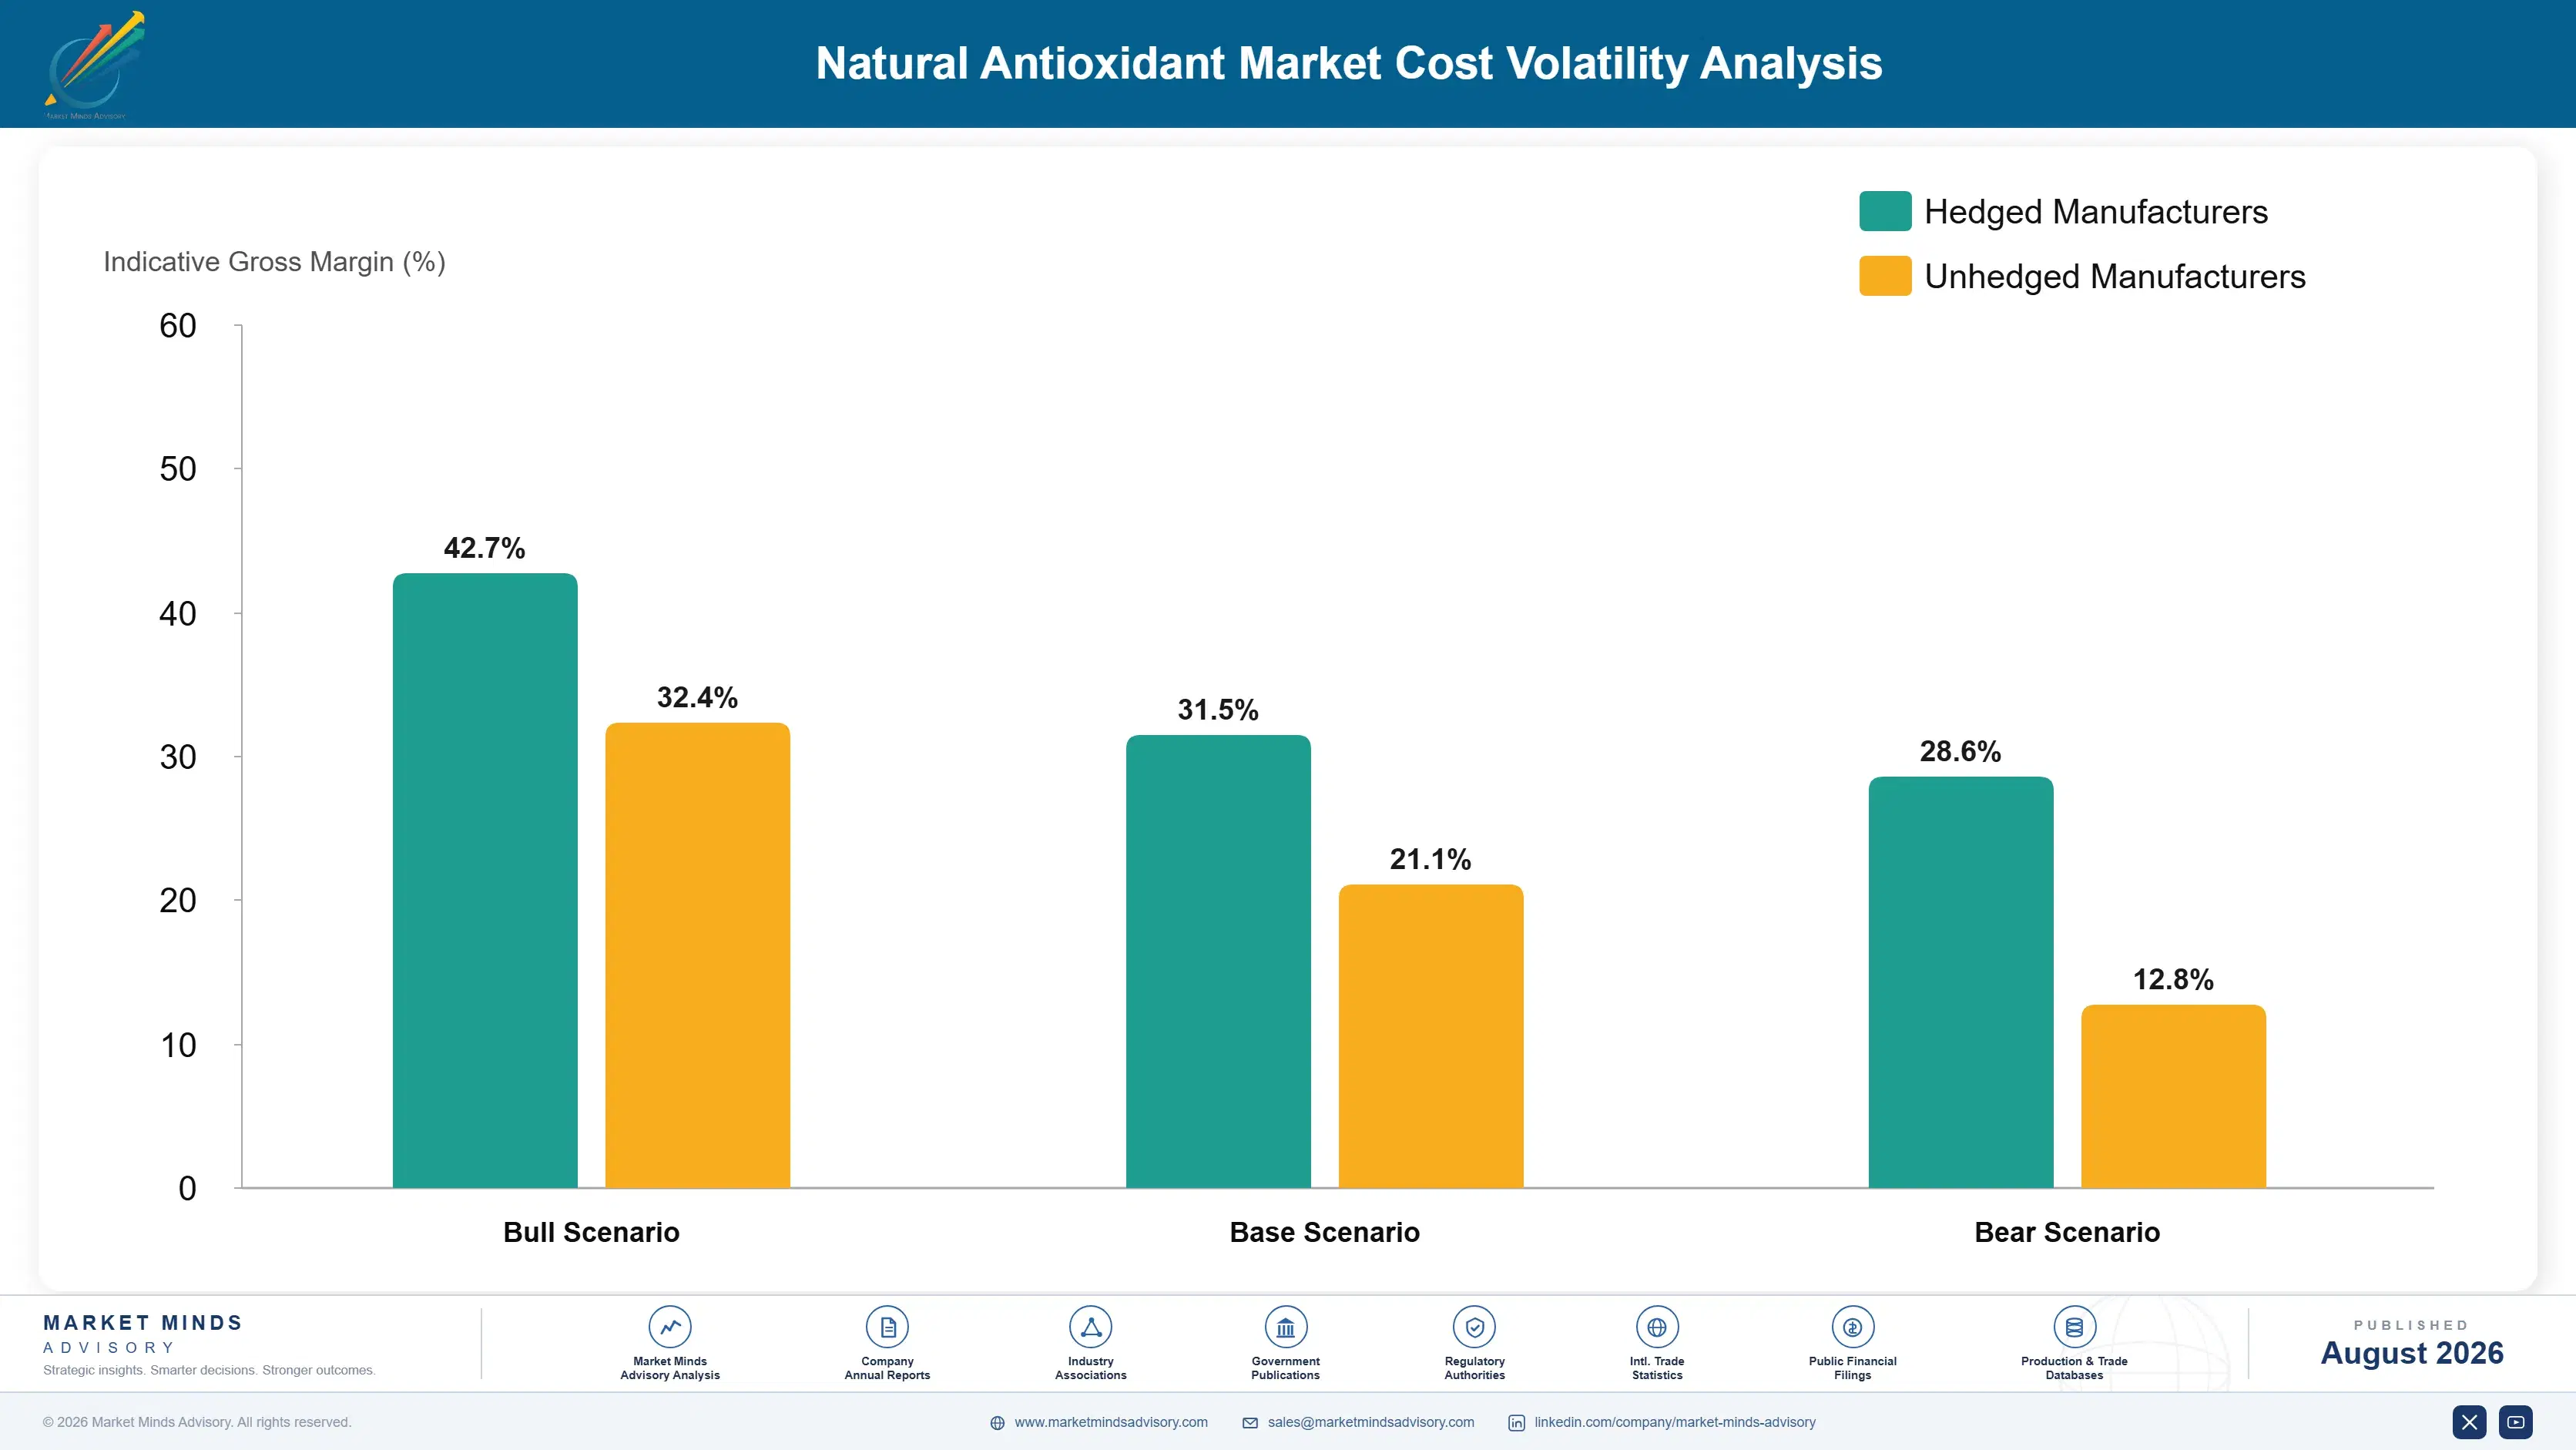
Raw material dominates producer cost at roughly 62%, split between soybean and other oil deodoriser distillate for tocopherol and cultivated rosemary and botanical material for extracts. Extraction energy and solvent recovery add around 14%. Neither input responds to antioxidant demand: distillate volume follows oil refining, and rosemary follows planting and weather. That combination leaves producers with very little ability to secure supply when demand moves.
Tocopherol prices moved sharply during 2021 and 2022 as soybean crush patterns shifted and vitamin E demand from feed markets competed for the same distillate stream. Archer Daniels Midland noted commodity and logistics cost pressure across its nutrition operations in its Annual Report 2022. Formulators holding annual price agreements absorbed the movement, and several reverted to synthetics in applications where the label mattered least to them.

The competitive disadvantage falls on suppliers without feedstock diversity, and it appears as availability rather than price. A supplier drawing solely on soybean distillate cannot serve customers through a crush contraction at any price, while one with sunflower and palm routes can. Smaller regional extractors face this most acutely, since they lack the purchasing scale to secure allocation when distillate tightens.
natural-antioxidant-market-trends-cost-volatility-analysis-1787555857638

Qualify sunflower and palm distillate alongside soybean feedstock

Around 78% of tocopherol supply comes from soybean deodoriser distillate, which tracks crush volume rather than antioxidant demand and tightens without warning. Sunflower and palm distillate carry different tocopherol profiles requiring separate qualification, so the work must be done before it is needed. Suppliers holding qualified alternatives serve customers through contractions that competitors simply cannot.

Contract rosemary cultivation directly with growing regions

Roughly 64% of rosemary grows across a handful of Mediterranean countries where drought moves both yield and carnosic acid content between seasons. Buying on spot exposes an extractor to both at once. Multi-season grower contracts with agronomic support stabilise the active content that actually determines how much extract a formulation requires. Agronomic support improves both yield and consistency.

Sell blends priced on protection delivered, not weight

Raw material at 62% of cost passes volatility straight through when products are priced per kilogramme. Pricing on measured oxidative protection delivered lets a supplier reformulate the blend as input costs move while holding the customer's outcome constant. Food manufacturers accept this where shelf-life data supports it, and resist it where it does not.

Portfolio Architecture for Margin Defence

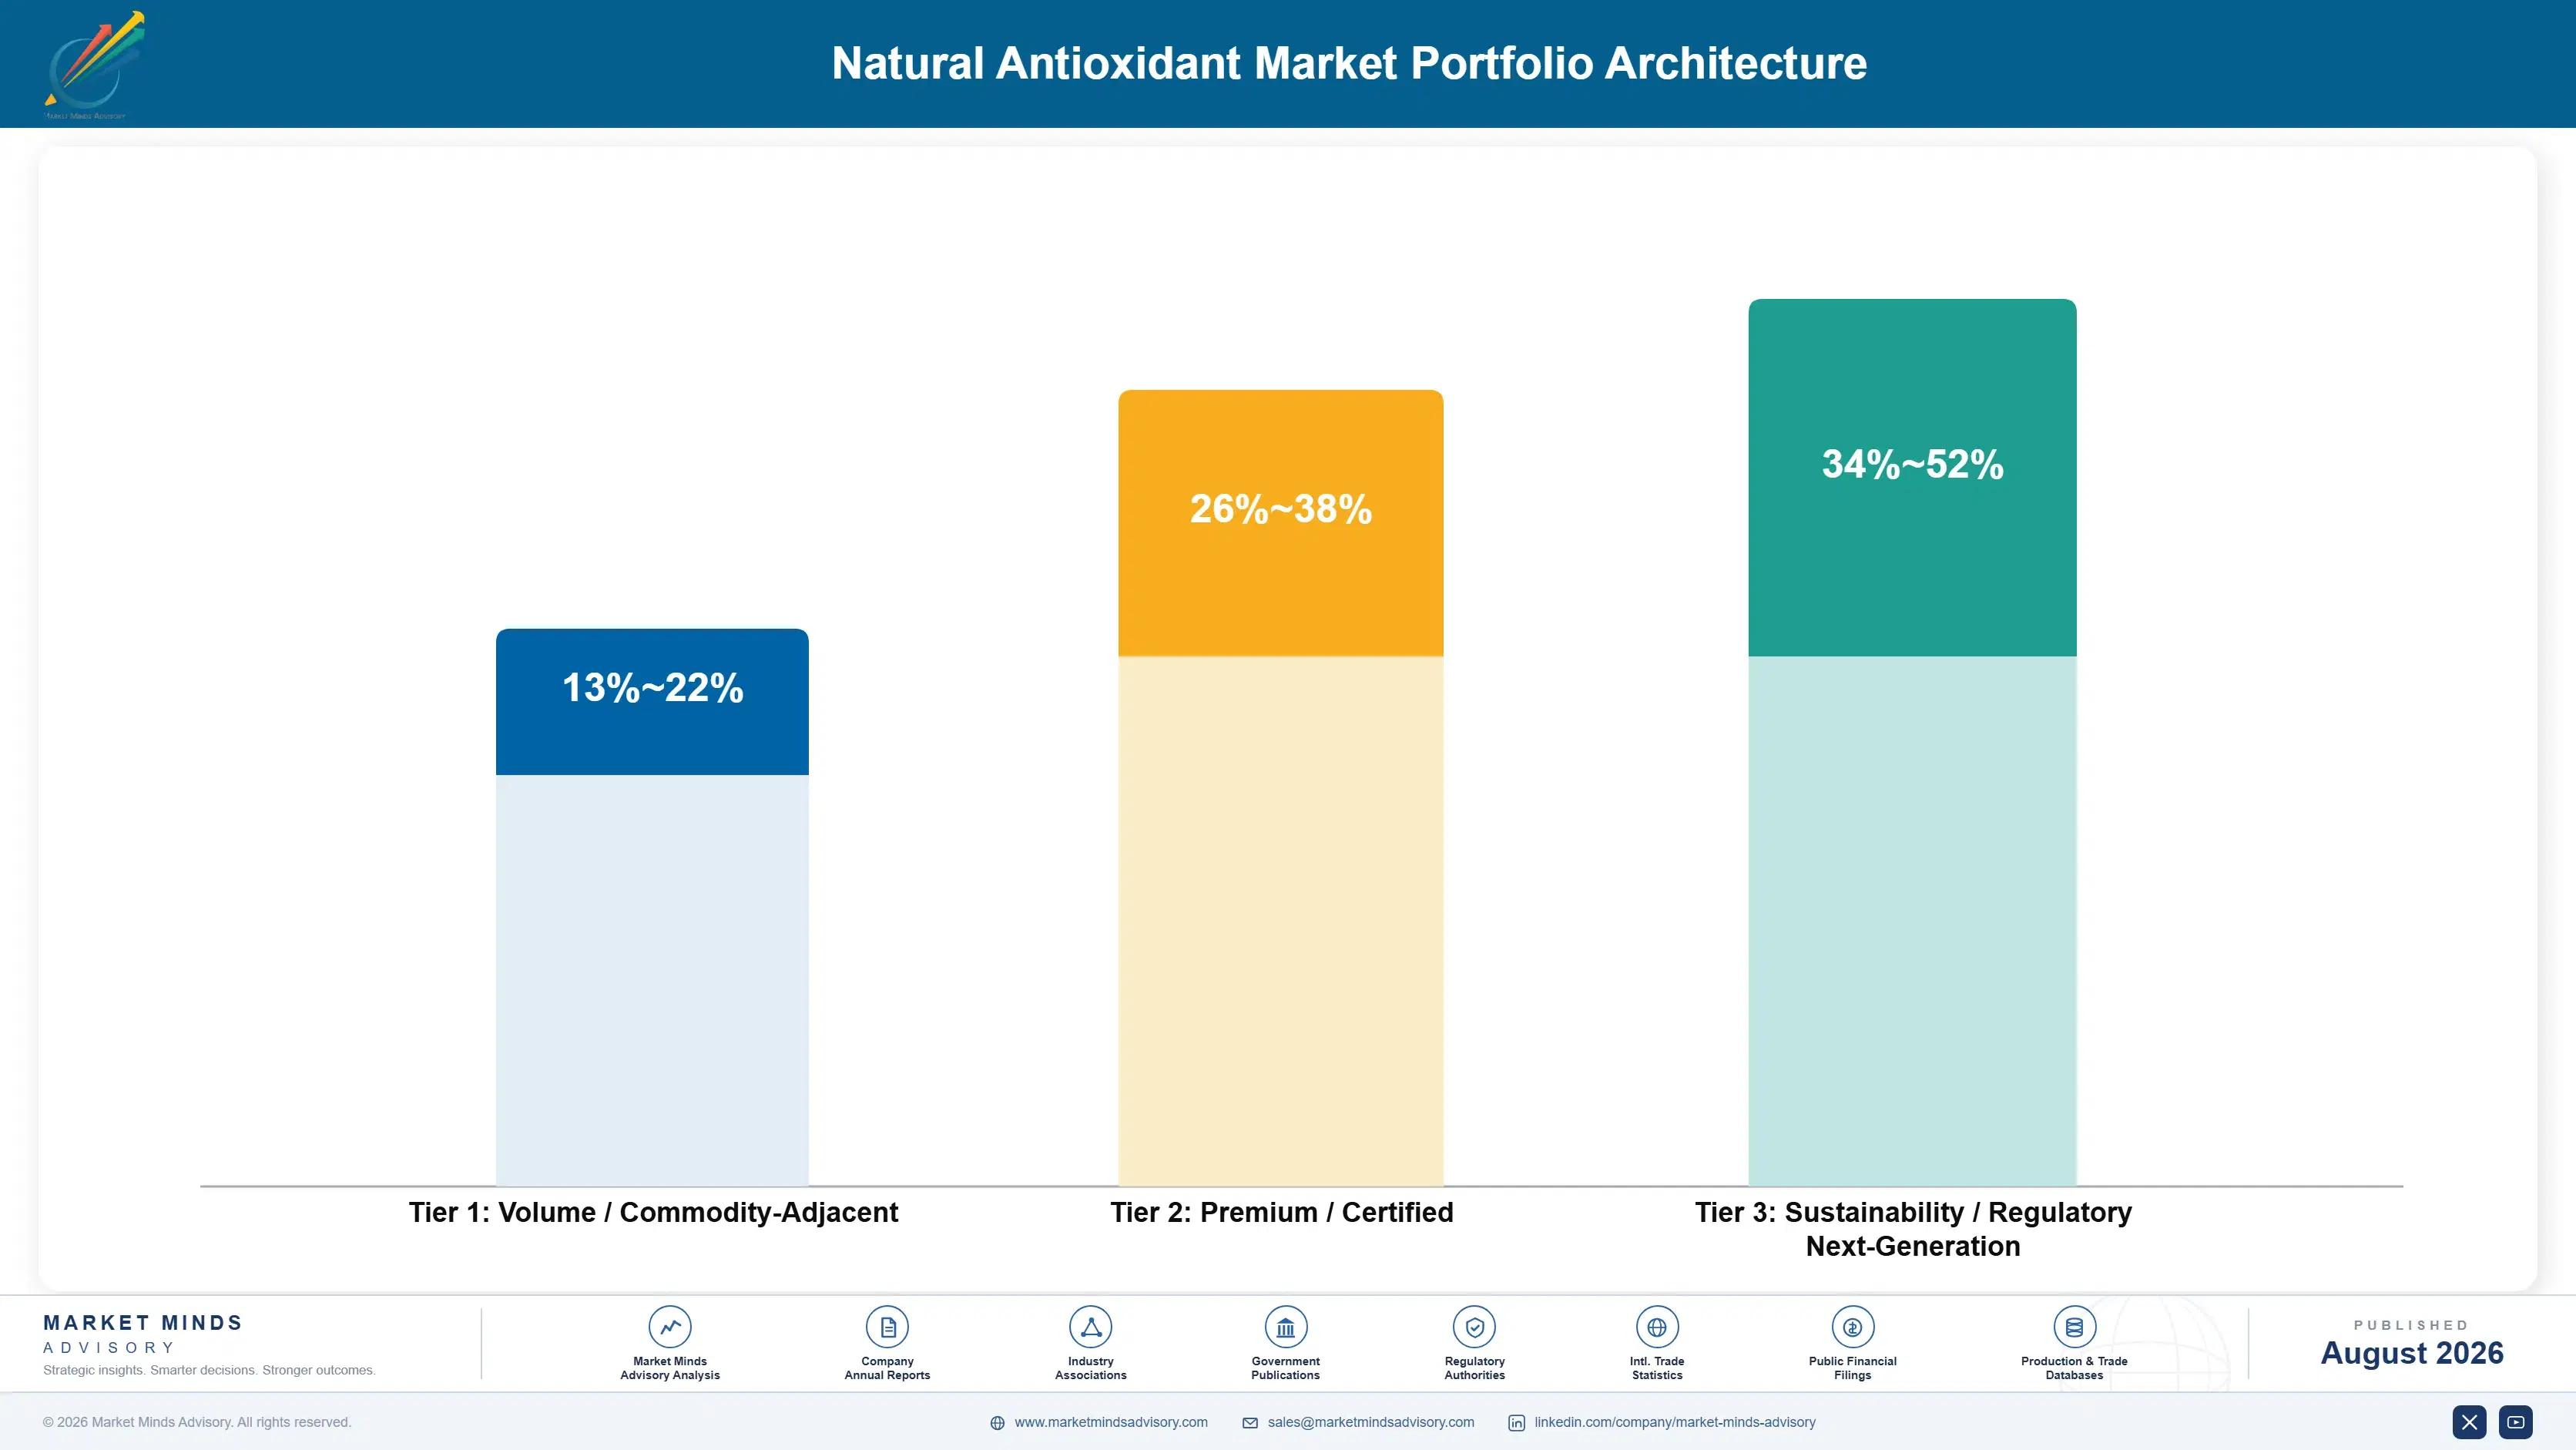
Margin tracks formulation and application support rather than extraction, because extraction is increasingly available from Indian and Chinese suppliers at costs Western producers cannot match. Bulk tocopherol and single-active extracts run at gross margins in the mid teens against that competition. Formulated blends with application data run considerably better. Pet nutrition systems with palatability support and nutraceutical grades run higher still, because the buyer is purchasing an outcome and a label rather than a kilogramme of anything. Certification adds another layer above that again.
The tension is that volume sits in bulk actives while margin sits in formulation, and moving between them requires application laboratories and shelf-life testing capability rather than any extraction investment. Suppliers weighted toward bulk face extractor competition that will not weaken. Building application capability from bulk margins is slow, and several have found extraction volume absorbing the investment attention that formulation required.

High-value pools sit in pet nutrition systems, nutraceutical grades and any blend that genuinely narrows the protection cost gap. Bulk active supply is where Indian and Chinese extractors are competing hardest and winning steadily. That competition is not going to weaken, and pricing there reflects it already.

Volume / Commodity-Adjacent

Bulk tocopherol and single-active plant extracts sold on specification against Indian and Chinese extractors. The nine-point range separates suppliers with feedstock diversity and scale purchasing from those buying distillate entirely on spot terms.
Gross Margin: 13%-22%

Premium / Certified

Formulated blends supported by oxidative stability data generated on the customer's own product. The twelve-point spread reflects how much application laboratory work a supplier actually performs rather than any difference in the underlying actives.
Gross Margin: 26%-38%

Sustainability / Regulatory / Next-Generation

Pet nutrition systems with palatability support, nutraceutical grades and organic-certified extracts. The eighteen-point range is wide because certification, palatability validation and regulatory approval status vary enormously and buyers pay for each separately.
Gross Margin: 34%-52%
natural-antioxidant-market-trends-portfolio-architecture-1787555858139

High-value Sub-segments and Strategic Watch-out

Pet Nutrition Systems

Compounding at 10.8% and already 21% of volume, where palatability validation and label positioning matter as much as oxidative performance. A refused bowl is immediate product failure, which raises the technical bar considerably above human food. Feeding trial support is what those brands actually want most.
Gross Margin: 36%-52%

Nutraceutical Grade Actives

Growing at 8.6% on category expansion rather than conversion, since almost nothing here used synthetics anyway. Finished product margin is high enough that ingredient cost tolerance exceeds anything else in this market by a wide margin. Certification and origin documentation matter more here than anywhere.
Gross Margin: 34%-48%

Bulk Tocopherol Supply

The volume base, exposed to soybean distillate availability and to Indian and Chinese extractors competing hard on cost. Manage this for feedstock diversity and purchasing scale rather than for any margin improvement. Availability rather than price is the real exposure during a crush contraction. Scale purchasing decides who holds allocation.
Gross Margin: 13%-22%

Frying Stability Systems

Roughly 81% of high-temperature frying still runs on synthetics because natural actives degrade thermally. The wide range reflects that nobody has yet demonstrated a solution at tolerable cost, and the prize is correspondingly large. Overdosing produces off-flavour before it produces equivalence, the whole technical difficulty facing suppliers here.
Gross Margin: 20%-44%

How Antioxidant Demand Persists

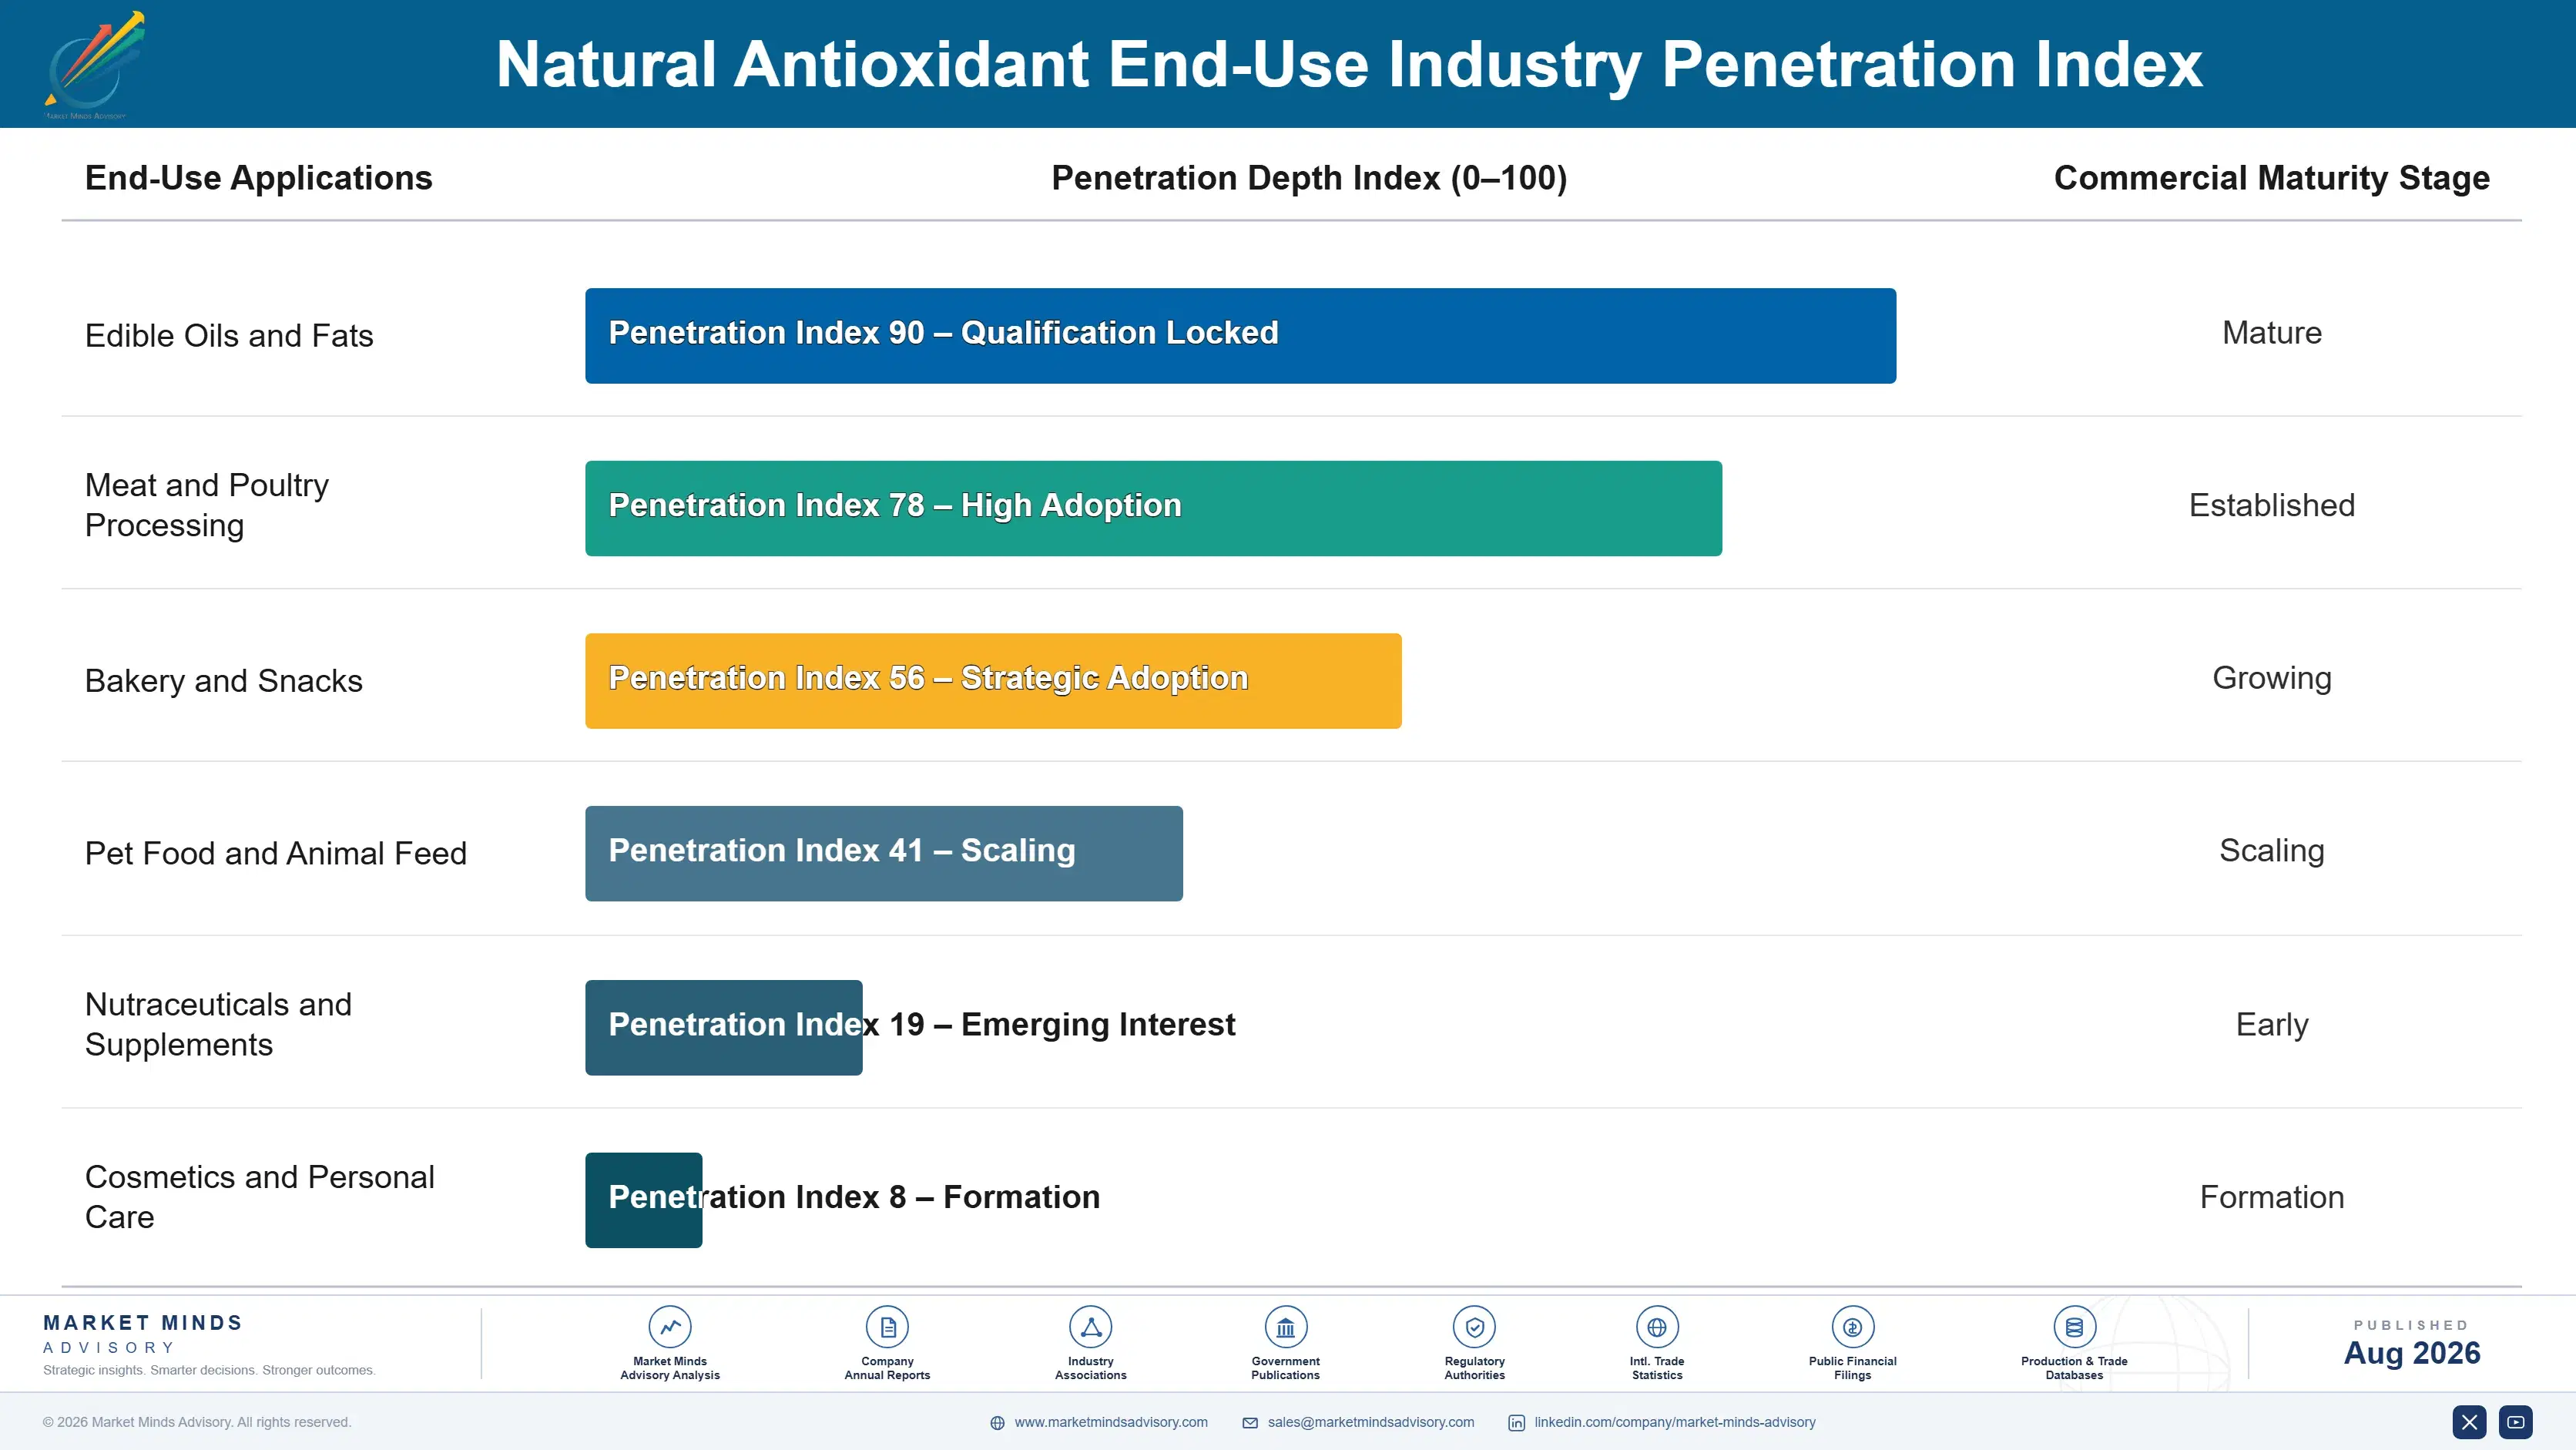
Demand here is annuity in the strictest sense, because an antioxidant is consumed in every batch and reordered continuously for as long as the product stays in the range. A reformulation decision made once generates purchasing for years without further deliberation. That makes conversion wins extraordinarily valuable and conversion losses correspondingly permanent, since nobody revisits a working formulation without a reason to.
Adoption depth varies sharply by vertical and it tracks how visible oxidation is to the end consumer. Pet food converted deepest because rancidity is smelled rather than inferred. Meat converted next because colour is seen at shelf. Bakery and snacks converted partially, in premium ranges. Frying and long shelf-life products converted least, since the oxidation happens slowly and the cost of preventing it naturally is highest exactly there.

The buyer has shifted from procurement toward brand and regulatory affairs in the converted categories. Antioxidant selection was once a purchasing decision made on delivered cost per kilogramme. In pet food and premium human food it now involves people who care about the ingredient panel and consult a laboratory before they consult a price list.
natural-antioxidant-market-trends-end-use-penetration-index-1787555858626

Where To Place The Bet

These are among the four positions where our research anticipates prominent divergence between winners and laggards over the coming forecast period. Each is grounded in the demand model, the regulatory perimeter, and the announced capacity pipeline.
01 / PROTECTION COST ENGINEERING

Compete on protection per dollar, not per kilogramme

Natural antioxidants currently deliver roughly a quarter of the oxidative protection per dollar that synthetics provide, and that single ratio determines which applications are commercially reachable and which remain permanently closed to the category. Synergistic blends of tocopherol, rosemary extract and ascorbyl palmitate narrow the gap in ways that no single active can achieve alone. A supplier selling kilogrammes competes on a commodity basis against Indian and Chinese extractors, while one selling measured protection delivered competes on formulation skill instead, which is far harder to copy.
02 / PET NUTRITION SPECIALISATION

Treat pet food as a distinct commercial business

Pet food and animal feed compound at 10.8% and already absorb 21% of volume, and the buying criteria genuinely differ from human food in ways that suppliers repeatedly underestimate when they extend an existing sales approach. Palatability is decisive because a refused bowl is immediate and unambiguous product failure rather than a gradual quality complaint. Owners audit those ingredient panels far more closely than their own groceries, which gives label positioning a commercial weight that human food categories rarely match anywhere at all.
03 / FEEDSTOCK CONTINUITY PLANNING

Qualify alternative distillate routes before supply tightens

Around 78% of natural tocopherol arrives as a by-product of soybean oil deodorising, which means available volume follows global crush patterns rather than anything an antioxidant buyer or seller does or wants. Sunflower and palm distillate carry different tocopherol profiles that require separate qualification work, and that work cannot be compressed once a contraction has already started. Suppliers who can hold supply through a genuinely tight period win contracts on reliability rather than price, and those contracts persist long after the disruption has passed entirely.
04 / FRYING CHEMISTRY INVESTMENT

Solve thermal stability or leave frying alone

High-temperature frying remains roughly 81% unconverted after two decades of clean label pressure, because natural actives degrade thermally faster than synthetics and overdosing produces off-flavour well before it produces equivalent protection. This is fundamentally a chemistry problem, and no amount of clean label positioning has ever moved it. Suppliers selling frying products on clean label appeal rather than on demonstrated oxidative stability data create disappointed customers, lost repeat business and lasting reputational damage across a category that talks to itself constantly.

Engagement Snapshot From the Field

A live engagement with an industry participant carrying material or product regulatory and market exposure ahead of a defining policy shift, showing how our research translates into a defensible multi-year portfolio strategy.
MARKET MINDS ADVISORY · CLIENT ENGAGEMENT SUMMARY
Natural Antioxidant Producer Strategic Portfolio Review and Transition Roadmap 2026·Investment Scenario on Natural Antioxidant Exposure Evaluation 2025-26
CLIENT PROFILE
A pet food manufacturer with annual revenue around USD 1.4 billion (client-reported, unverified by MMA), operating premium and mainstream kibble brands across North American and European markets. Premium ranges had converted to natural antioxidant systems three years earlier. Mainstream ranges still used synthetics on cost grounds, and competitive pressure was building steadily. Retailer policies were tightening simultaneously.
STRATEGIC CHALLENGE
Retailer ingredient policies and competitor conversions were making synthetic preservation a shelf liability in mainstream ranges, but the ingredient cost increase looked unaffordable at mainstream price points. Nobody had tested whether blend reformulation could deliver acceptable protection at a materially lower cost than the premium system used. The premium specification had never been revisited.
MMA APPROACH
MMA benchmarked delivered protection per dollar across single actives and blended systems from eight suppliers, using accelerated oxidative stability testing on the client's own kibble formats rather than generic data. Palatability implications were assessed separately. Feedstock exposure for each supplier was mapped against soybean distillate dependence and rosemary cultivation concentration.
KEY FINDINGS
  1. A synergistic blend delivered equivalent shelf life to the premium system at roughly 30% lower ingredient cost, because the premium system had been specified with substantial and unnecessary safety margin built in.
  2. Palatability differences between candidate systems were larger than oxidative performance differences, and two otherwise acceptable options failed on that criterion during feeding trials.
  3. Three of the eight suppliers drew tocopherol entirely from soybean distillate, leaving them unable to guarantee continuity through the kind of crush contraction seen recently.
  4. Retailer ingredient policies at two major accounts were scheduled to exclude synthetic antioxidants within eighteen months, which converted the decision from optional to time-limited.
CLIENT PROFILE
A pet food manufacturer with annual revenue around USD 1.4 billion (client-reported, unverified by MMA), operating premium and mainstream kibble brands across North American and European markets. Premium ranges had converted to natural antioxidant systems three years earlier. Mainstream ranges still used synthetics on cost grounds, and competitive pressure was building steadily. Retailer policies were tightening simultaneously.
STRATEGIC CHALLENGE
Retailer ingredient policies and competitor conversions were making synthetic preservation a shelf liability in mainstream ranges, but the ingredient cost increase looked unaffordable at mainstream price points. Nobody had tested whether blend reformulation could deliver acceptable protection at a materially lower cost than the premium system used. The premium specification had never been revisited.
MMA APPROACH
MMA benchmarked delivered protection per dollar across single actives and blended systems from eight suppliers, using accelerated oxidative stability testing on the client's own kibble formats rather than generic data. Palatability implications were assessed separately. Feedstock exposure for each supplier was mapped against soybean distillate dependence and rosemary cultivation concentration.
KEY FINDINGS
  1. A synergistic blend delivered equivalent shelf life to the premium system at roughly 30% lower ingredient cost, because the premium system had been specified with substantial and unnecessary safety margin built in.
  2. Palatability differences between candidate systems were larger than oxidative performance differences, and two otherwise acceptable options failed on that criterion during feeding trials.
  3. Three of the eight suppliers drew tocopherol entirely from soybean distillate, leaving them unable to guarantee continuity through the kind of crush contraction seen recently.
  4. Retailer ingredient policies at two major accounts were scheduled to exclude synthetic antioxidants within eighteen months, which converted the decision from optional to time-limited.
RECOMMENDED STRATEGY
Phase 1: Phase one: requalify the premium system against measured shelf life requirements rather than inherited specification, since the safety margin was funding cost nobody needed. Phase 2: Phase two: convert mainstream ranges using the blended system, sequencing by retailer policy deadlines rather than by internal manufacturing convenience or preference. Phase 3: Phase three: dual-source tocopherol across suppliers with genuinely different feedstock routes, accepting a modest continuity premium over the cheapest available option.
OUTCOME
Premium requalification released cost that funded most of the mainstream conversion. Both mainstream ranges converted ahead of retailer deadlines with palatability maintained through feeding trials. Dual sourcing is in place, and the client reports total antioxidant cost broadly unchanged across a considerably larger converted volume (client-reported, unverified by MMA).

Frequently Asked Questions

Foundational context covering the market sizes, CAGR, scope, country, region and competition that inform every finding below. This section is provided to cover basics and most often pre-purchase conversations, answered from the MMA Primary Research Dataset.

What is the current size of the Natural Antioxidant Market?

The market was valued at USD 1.62 billion in 2025, rising to an estimated USD 1.74 billion in 2026. North America holds the largest regional share at 28% of value.

How large will the Natural Antioxidant Market be by 2036?

MMA forecasts USD 3.48 billion by 2036 under the base case, an expansion multiple of 2.00 times the 2026 value. That represents USD 1.74 billion of incremental value.

What is the CAGR for the Natural Antioxidant Market 2026 to 2036?

The base case runs at 7.2% compound annual growth between 2026 and 2036, with a bull case at 8.4% and a bear case at 6.0%. Historical growth from 2020 to 2025 was 6.2%.

Which segment is growing fastest?

Pet food and animal feed lead at 10.8%, half again the market rate, because kibble fat oxidises into visible rancidity and owners scrutinise those panels. Nutraceuticals follow at 8.6%.

Who are the major companies in the Natural Antioxidant Market?

Kemin Industries, BASF, DSM-Firmenich, Kalsec and Archer Daniels Midland hold 36% of supply. Formulation and application testing rather than raw material control sustain those positions.

Which country is growing fastest?

India leads at 10.4%, driven by packaged food expansion, domestic brands adopting clean label positioning, and botanical extraction capacity that already exists at commercial scale.

Report Segmentation Architecture

The full report scope spans multiple orthogonal segmentation dimensions, with cross-tabulated demand data provided for each dimension pair. Coverage extends further to regional breakdowns, trend trajectories, and the competitive detail needed to support segment-level decision-making.

By Antioxidant Type

  • Natural Tocopherols
  • Rosemary and Herb Extracts
  • Ascorbates of Natural Origin
  • Polyphenol Concentrates
  • Carotenoid Antioxidants
  • Formulated Synergistic Blends

By End-Use Industry

  • Edible Oils and Fats
  • Meat and Poultry Processing
  • Bakery and Snacks
  • Pet Food and Animal Feed
  • Nutraceuticals and Supplements
  • Cosmetics and Personal Care

By Supply Channel

  • Direct Manufacturer Supply
  • Ingredient Distributor Channel
  • Custom Blend Formulation
  • Toll Extraction Services
  • Bulk Commodity Trading

By Region

  • North America
  • Western Europe
  • East Asia
  • South Asia and Pacific
  • Latin America
  • Middle East and Africa
  • Eastern Europe

Scope, Methodology, and Coverage

Every figure in this report is reproducible from documented input assumptions. The scope below maps the historical period, the forecast horizon, the segmentation dimensions, and the countries covered, alongside the underlying primary and qualitative methodology.
Historical Period
2020 to 2025
Forecast Period
2026 to 2036
Base Year
2025 (USD billions; MMA Primary Research Dataset, August 2026)
Market Definition
The market comprises natural antioxidants supplied as ingredients for oxidative protection, including natural tocopherols, rosemary and herb extracts, ascorbates of natural origin, polyphenol concentrates, carotenoid antioxidants and formulated synergistic blends, across edible oils and fats, meat and poultry processing, bakery and snacks, pet food and animal feed, nutraceuticals and supplements, and cosmetics and personal care. Value is measured at producer level on tonnage of active antioxidant supplied. Synthetic antioxidants including BHA, BHT and TBHQ, chelating agents, antimicrobial preservatives, and botanical extracts sold for flavour or colour purposes fall outside scope.
Quantitative Units
USD billions (current prices); tonnes of active antioxidant; USD per kilogramme by grade and application
Segmentation Dimensions
By Antioxidant Type; By End-Use Industry; By Supply Channel; By Region
Regions Covered
North America, Western Europe, East Asia, South Asia and Pacific, Latin America, Middle East and Africa, Eastern Europe
Countries Covered
United States, Canada, Mexico, Brazil, Argentina, Chile, Colombia, Germany, France, Netherlands, Spain, Italy, United Kingdom, Denmark, Poland, Romania, Hungary, Czechia, China, Japan, South Korea, Taiwan, India, Indonesia, Thailand, Vietnam, Australia, Saudi Arabia, Egypt, South Africa
Key Companies Profiled
Kemin Industries, BASF, DSM-Firmenich, Kalsec, Archer Daniels Midland, Givaudan, Cargill, Barentz, Vitablend, Camlin Fine Sciences, Zhejiang Medicine, Zhejiang NHU, Wilmar International, International Flavors and Fragrances, Prinova, Synthite Industries, Plant Lipids, Indena, Layn Natural Ingredients, Corbion
Quantitative Methodology
Primary survey, n=3,800 respondents, Q4 2025, six countries; demand-side model with trade association cross-validation
Qualitative Methodology
47 expert interviews, Q4 2025; applied to validate demand model assumptions, identify emerging dynamics, and assess competitive positioning
Report Format
PDF and XLSX data workbook (Word format preview document)
Publisher
Market Minds Advisory
Report Code
MMA-2026-AGR-126
Published
August 2026
Contact
sales@marketmindsadvisory.com | www.marketmindsadvisory.com

Purchase the full Natural Antioxidant Market Report (2026 to 2036).

The full report sizes the global natural antioxidant market to 2036 across six applications and seven regions, measured on tonnage of active antioxidant supplied. It quantifies conversion penetration application by application rather than assuming a linear clean label substitution curve, and models the protection cost gap that keeps frying and long shelf-life products on synthetics. Competitive analysis covers 20 participants on one consistent basis, with moat and risk assessment for the two leaders. Tocopherol feedstock exposure is mapped against global oilseed crush patterns. Four quantified revenue levers close the analysis.
Six-application segment sizing with individual growth rates
Conversion penetration quantified separately for each end application
Protection cost gap modelled against synthetic antioxidant alternatives
Tocopherol feedstock exposure mapped to oilseed crush patterns
Twenty-participant competitive map on one consistent tonnage basis
Four quantified revenue levers with commercial impact ranges

Built For The People Who Decide

From boardroom strategy to bench-side execution, this report is read cover-to-cover by leaders shaping the next decade of their industry, turning demand scenarios, market dynamics and valuation benchmarks into decisions.
CXOs/ Presidents/ VPs/ Managers
M&A and Corporate Development
Strategy Teams and R&D Heads
Procurement and Product Directors
Regulatory and Compliance Leaders
Investor Relations and Equity Analysts