Market Minds Advisory
Native Video Advertising Market

Native Video Advertising Market: Native Video Advertising Market. In-Feed, Connected TV, and Publisher Video Ad Formats, 2026 to 2036

Advertisers chasing attention in feeds where users actively skip anything that looks like an ad are pushing video formats to blend so naturally into content that regulators are starting to ask hard questions.

Lead Analyst

Published

September 2026

Make Smarter Decisions with Customized Research Insights

Request a free sample report and evaluate market opportunities, growth trends, and competitive dynamics relevant to your business needs.

2025 MARKET VALUE$32.5BMarket Size 2025
2036 FORECAST VALUE$102.5BBase Case , 2026 to 2036
CAGR 2026 TO 203611.0 %Bull 12.3% / Bear 9.7%
INCREMENTAL OPPORTUNITY$66.4BNet 10- year value creation
EXPANSION MULTIPLE2.84x2036 value over 2026 base
Strategic Levers
M&A Pipeline
Regional Outlook
Country Rankings
Competitive Intelligence
Segmental Deep-dive
Call-Us : 91 93563 13602

Executive Snapshot and Market Trajectory.

Native video advertising has become the default format for reaching audiences who have trained themselves to ignore banner ads entirely, since video that mimics the surrounding feed content genuinely earns attention that display formats simply cannot command anymore across nearly every major digital platform and screen device category today.
Connected TV native video advertising is growing fastest as ad-supported streaming tiers expand rapidly and advertisers shift budget away from traditional linear television toward formats blending naturally into on-demand content menus and recommendation rows across major platforms, connected devices, and living-room screens found worldwide today. North America leads regional demand given its concentration of major streaming platforms and the largest advertiser budgets pursuing premium video inventory at scale nationwide and beyond.
Competitive character increasingly centers on measurement transparency and brand safety controls rather than raw reach alone, since advertisers burned by fraud and misplacement incidents now demand verified viewability data before committing meaningful budget, and platforms offering genuine third-party verification integration are winning larger shares of premium advertiser spend across every major agency holding company relationship and formal procurement process conducted each year across the industry.
Market Definition
The Native Video Advertising Market covers video ad formats designed to visually and contextually match the surrounding content experience across in-feed social media, connected TV, publisher editorial, and in-app mobile placements. It excludes traditional pre-roll and mid-roll display banner advertising, direct mail, and non-video native content marketing formats like sponsored articles.
Base Year Value
$32.5B in 2025 (MMA Primary Research Dataset, September 2026)
Forecast Period
2026 to 2036, eleven discrete annual values
CAGR
11.0% base case. Bull 12.3%. Bear 9.7%.
Fastest Growth Segment
Connected TV (CTV) Native Video Advertising: 15.0% CAGR
Fastest Growth Country
Indonesia: 15.5% CAGR
Fastest Growth Region
South Asia and Pacific: 13.4% CAGR
Largest Region
North America: 31% of 2025 global value
Market Leaders
Leading platforms: Meta, Google (YouTube), ByteDance (TikTok), Amazon, Roku. Source: MMA Primary Research Dataset, July 2026.
Primary Survey
n=3,800 procurement and R&D decision-makers, Q4 2025, six countries
Methodology
Demand-side build-up, cross-validated against public data, 47 expert interviews

Native Video Advertising Market Forecast Scenarios

native-video-advertising-market-size-forecast-scenario-1789993142095
Growth through 2020 to 2025 was strong as social media platforms expanded in-feed video advertising inventory aggressively and mobile video consumption habits shifted decisively away from traditional television viewing patterns across most younger demographic segments worldwide, accelerating further as pandemic-era screen time habits proved genuinely durable rather than temporary, reshaping advertiser budget allocation permanently across the industry.
Base case growth through 2036 rests on three commercial mechanisms: expanding ad-supported streaming subscriber tiers creating fresh connected TV inventory across nearly every major platform and content library available today across the world, growing advertiser preference for native formats that resist ad-blocking software widely deployed on desktop and mobile browsers, and improving measurement standardization that finally lets advertisers compare native video performance directly against traditional television buys using shared industry metrics.
A bull scenario turns on faster advertiser budget migration from linear television toward connected TV native formats as measurement standards mature and brand safety concerns ease considerably across the industry. The bear risk is that regulatory scrutiny over native advertising disclosure requirements intensifies enough to force format changes that reduce the very effectiveness that makes native video genuinely valuable to advertisers.

Blending Into the Feed Without Losing the Metrics

Native video advertising exists precisely because audiences have gotten remarkably good at ignoring anything that visually announces itself as an advertisement, forcing platforms and advertisers to build video content that earns attention by genuinely matching the surrounding feed rather than interrupting it entirely, a shift that has reshaped creative production budgets meaningfully across every major agency and in-house marketing team involved today.
MARKET CONCENTRATIONCR5: 55%Top five platforms hold over half of total spend
COST PER VIEW$0.08Typical price advertisers pay per completed video view
TOP SPENDING COUNTRY SHAREUSA: 32%Reflects concentration of largest global advertiser marketing budgets
MOBILE SPEND SHARE68% of spendShare of native video budget delivered on mobile devices
AVERAGE COMPLETION RATE72%Typical share of viewers watching a native video fully
CAMPAIGN SETUP LEAD TIME2 to 4 weeksTypical time from creative approval to campaign launch
Platforms compete less on raw inventory volume today and more on measurement credibility, since brand safety incidents and viewability fraud scandals have made advertisers considerably more skeptical of self-reported performance metrics that cannot be independently verified by trusted third-party measurement partners before annual budget renewal decisions get finalized each quarter across the industry and its many demanding stakeholders and brand safety councils.
Connected TV inventory has become the single most contested growth frontier as ad-supported streaming subscriber counts climb and advertisers finally get access to television-quality reach with the targeting precision that digital advertising buyers have long expected from every other channel in their media plan, pulling budget away from traditional linear broadcast contracts steadily each year and quarter across every advertiser category.
"The platforms still reporting their own viewability numbers without independent verification are going to lose the biggest budgets first. Trust is the actual product being sold here, not the video inventory."
Practice Lead, Digital Media and Advertising Technology Research · MMA Technology Practice · September 2026

Market Trends

Ad-Supported Streaming Tiers Expand Connected TV Inventory

Major streaming platforms have launched or expanded ad-supported subscription tiers over the past two years, creating a genuinely new and sizable pool of connected TV inventory that did not previously exist at this scale, since many of these platforms operated purely on subscription revenue without any advertising component whatsoever before this particular shift occurred across the industry. Several major platforms have reported ad-tier subscriber counts growing consistently each quarter since launch, and advertisers have responded by shifting meaningful budget away from linear television toward these new connected TV inventory pools specifically.
Market Impact: Mobile video: over 60% of time
Third-Party Measurement Verification Becomes Standard Requirement

Enterprise advertisers increasingly require independent third-party measurement verification before committing meaningful budget to any native video platform, a requirement that barely existed as a standard procurement criterion five years ago but now appears in the majority of large advertiser request-for-proposal documents reviewed across the industry and its many agency holding companies and internal procurement teams worldwide. Several platforms have integrated dedicated third-party measurement partnerships specifically to meet this growing requirement to date, and agency holding companies increasingly treat verified measurement as a baseline procurement requirement rather than an optional premium feature.
Market Impact: Ad-blocking affects over 40% of browsers

Market Opportunities and Growth Drivers

Mobile Video Consumption Continues Rising Steadily

Global mobile video consumption has continued rising steadily as smartphone screen quality improves and mobile data costs fall across most major markets worldwide, expanding the total addressable audience for in-feed and in-app native video advertising formats specifically designed for vertical, mobile-first viewing experiences across every major platform and app category. Several major social platforms have publicly disclosed that video now represents a majority share of total time spent on their applications, directly expanding the advertising inventory available for native video placement across every major content category served to users daily.
Market Impact: Disclosure compliance adds 5% cost

Ad-Blocking Software Adoption Pushes Advertisers Toward Native Formats

Ad-blocking software adoption has continued climbing steadily across desktop and mobile browsers worldwide, rendering traditional display banner advertising increasingly ineffective at reaching a meaningful share of the intended audience regardless of targeting sophistication or creative quality invested in any given campaign at all. Native video formats, embedded directly within platform feeds and content streams rather than served through blockable third-party ad servers, largely escape this blocking technology, giving advertisers a genuinely durable overall reach advantage that has meaningfully accelerated budget migration toward native formats specifically over the past several years.
Market Impact: Incidents cost platforms 8% of accounts

Market Restraints and Challenges

Regulatory Scrutiny Over Ad Disclosure Requirements Intensifies

Regulators in multiple jurisdictions have increasingly scrutinized whether native video advertising sufficiently discloses its sponsored nature to viewers, and the root cause is that the format's core commercial appeal, blending naturally into surrounding content, inherently sits in tension with consumer protection disclosure principles that predate digital video advertising entirely by many decades. Platforms are mitigating this by adding standardized sponsored content labeling that satisfies regulatory requirements while attempting to preserve the format's core effectiveness, and industry trade bodies have published voluntary disclosure guidelines specifically to get ahead of stricter mandatory regulation.
Market Impact: Ad-tier subscribers grow 20%+ quarterly

Brand Safety Incidents Erode Advertiser Trust Periodically

High-profile incidents involving native video advertisements appearing alongside inappropriate or brand-damaging content have periodically damaged advertiser trust in specific platforms, and the underlying cause is that automated content matching and placement systems cannot always reliably distinguish appropriate contextual adjacency at the scale and speed required for real-time inventory delivery across billions of daily impressions served worldwide. Platforms are mitigating this by investing heavily in improved content classification technology and offering advertisers granular exclusion controls, and several platforms now offer financial guarantees specifically covering brand safety incidents to rebuild advertiser confidence.
Market Impact: Verification required in 70% of RFPs
3 additional market trends, 2 additional growth drivers, and 4 additional restraints and challenges are covered in the full report. Contact sales@marketmindsadvisory.com to access the complete intelligence.

Segment CAGR and Growth Architecture

The market divides into five segments by placement format, spanning connected TV native video advertising, in-feed social media native video advertising, in-app mobile native video advertising, publisher and editorial native video advertising, and programmatic native video ad exchanges, each addressing a distinct content environment, buyer relationship, and measurement standard used across the industry today.
native-video-advertising-market-market-share-analysis-1789993142682

Connected TV (CTV) Native Video Advertising

Connected TV native video advertising is growing fastest as ad-supported streaming subscriber tiers expand rapidly and advertisers finally get access to television-quality reach combined with the digital targeting precision that has long defined performance advertising on every other channel available today across the entire global advertising industry and its many agency stakeholders worldwide. This segment increasingly captures the largest share of new advertiser budget migration away from traditional linear television, since connected TV inventory offers measurement capability and audience targeting that linear broadcast simply cannot match, pushing legacy television-focused agencies to rapidly build dedicated connected TV planning and buying capability they historically lacked entirely and now scramble to develop internally.
CAGR 15.0%

In-Feed Social Media Native Video Advertising

In-feed social media native video advertising remains the second-fastest-growing segment as major platforms continue expanding video-first feed formats and algorithmic recommendation systems that surface advertising content alongside organic posts users actually want to see and engage with directly every single day across every device, browser, and platform category imaginable found worldwide today and tomorrow. This segment increasingly determines vendor selection at performance-focused advertisers, since in-feed placement delivers measurable engagement and conversion outcomes that brand-focused connected TV inventory cannot always demonstrate as directly, keeping this segment central to advertiser budget allocation even as connected TV captures a growing share of overall spend industry-wide and globally each and every passing fiscal year.
CAGR 12.5%
Full segment breakdown across 5 segments available in the complete report.

Regional Architecture and Country Demand Map

North America leads demand given its concentration of major streaming platforms and the largest advertiser budgets pursuing premium video inventory nationwide, while East Asia and Western Europe follow closely with substantial spend from social media and publisher native video advertising across their own domestic markets.

North America

American advertisers spend more on native video than any other region, driven by the sheer concentration of Fortune 500 marketing budgets and the fact that most major connected TV streaming platforms are headquartered in the country and launch new ad-supported inventory there first each product cycle. Agency holding companies based in New York and Chicago manage the bulk of large-scale native video campaigns for global clients, giving American media planning practices outsized influence over how the format is bought and measured worldwide across every major market. Canadian advertisers contribute a smaller but steady secondary demand pool, often following campaign strategies developed for their much larger American counterparts and shared platform relationships across the border.
Share: 31% | CAGR: 11.9% (2026 to 2036)

Western Europe

German and British advertisers drive the bulk of Western European demand, with London serving as a genuine regional hub for global brand marketing decisions given its concentration of major advertising agency headquarters and international brand marketing teams operating across the continent. French and Italian advertisers have adopted native video more cautiously, often citing stricter data privacy regulation affecting audience targeting precision compared with less-regulated markets elsewhere around the world. Growth trails North America and East Asia given generally smaller connected TV ad-supported subscriber bases across the region and continued strong consumer preference for traditional public broadcast television funded through licensing fees rather than direct paid advertising across most member countries and public networks.
Share: 20% | CAGR: 9.7% (2026 to 2036)
Regional intelligence for 5 additional markets available in the complete report: East Asia, South Asia and Pacific, Latin America, Middle East and Africa, Eastern Europe. Contact sales@marketmindsadvisory.com.
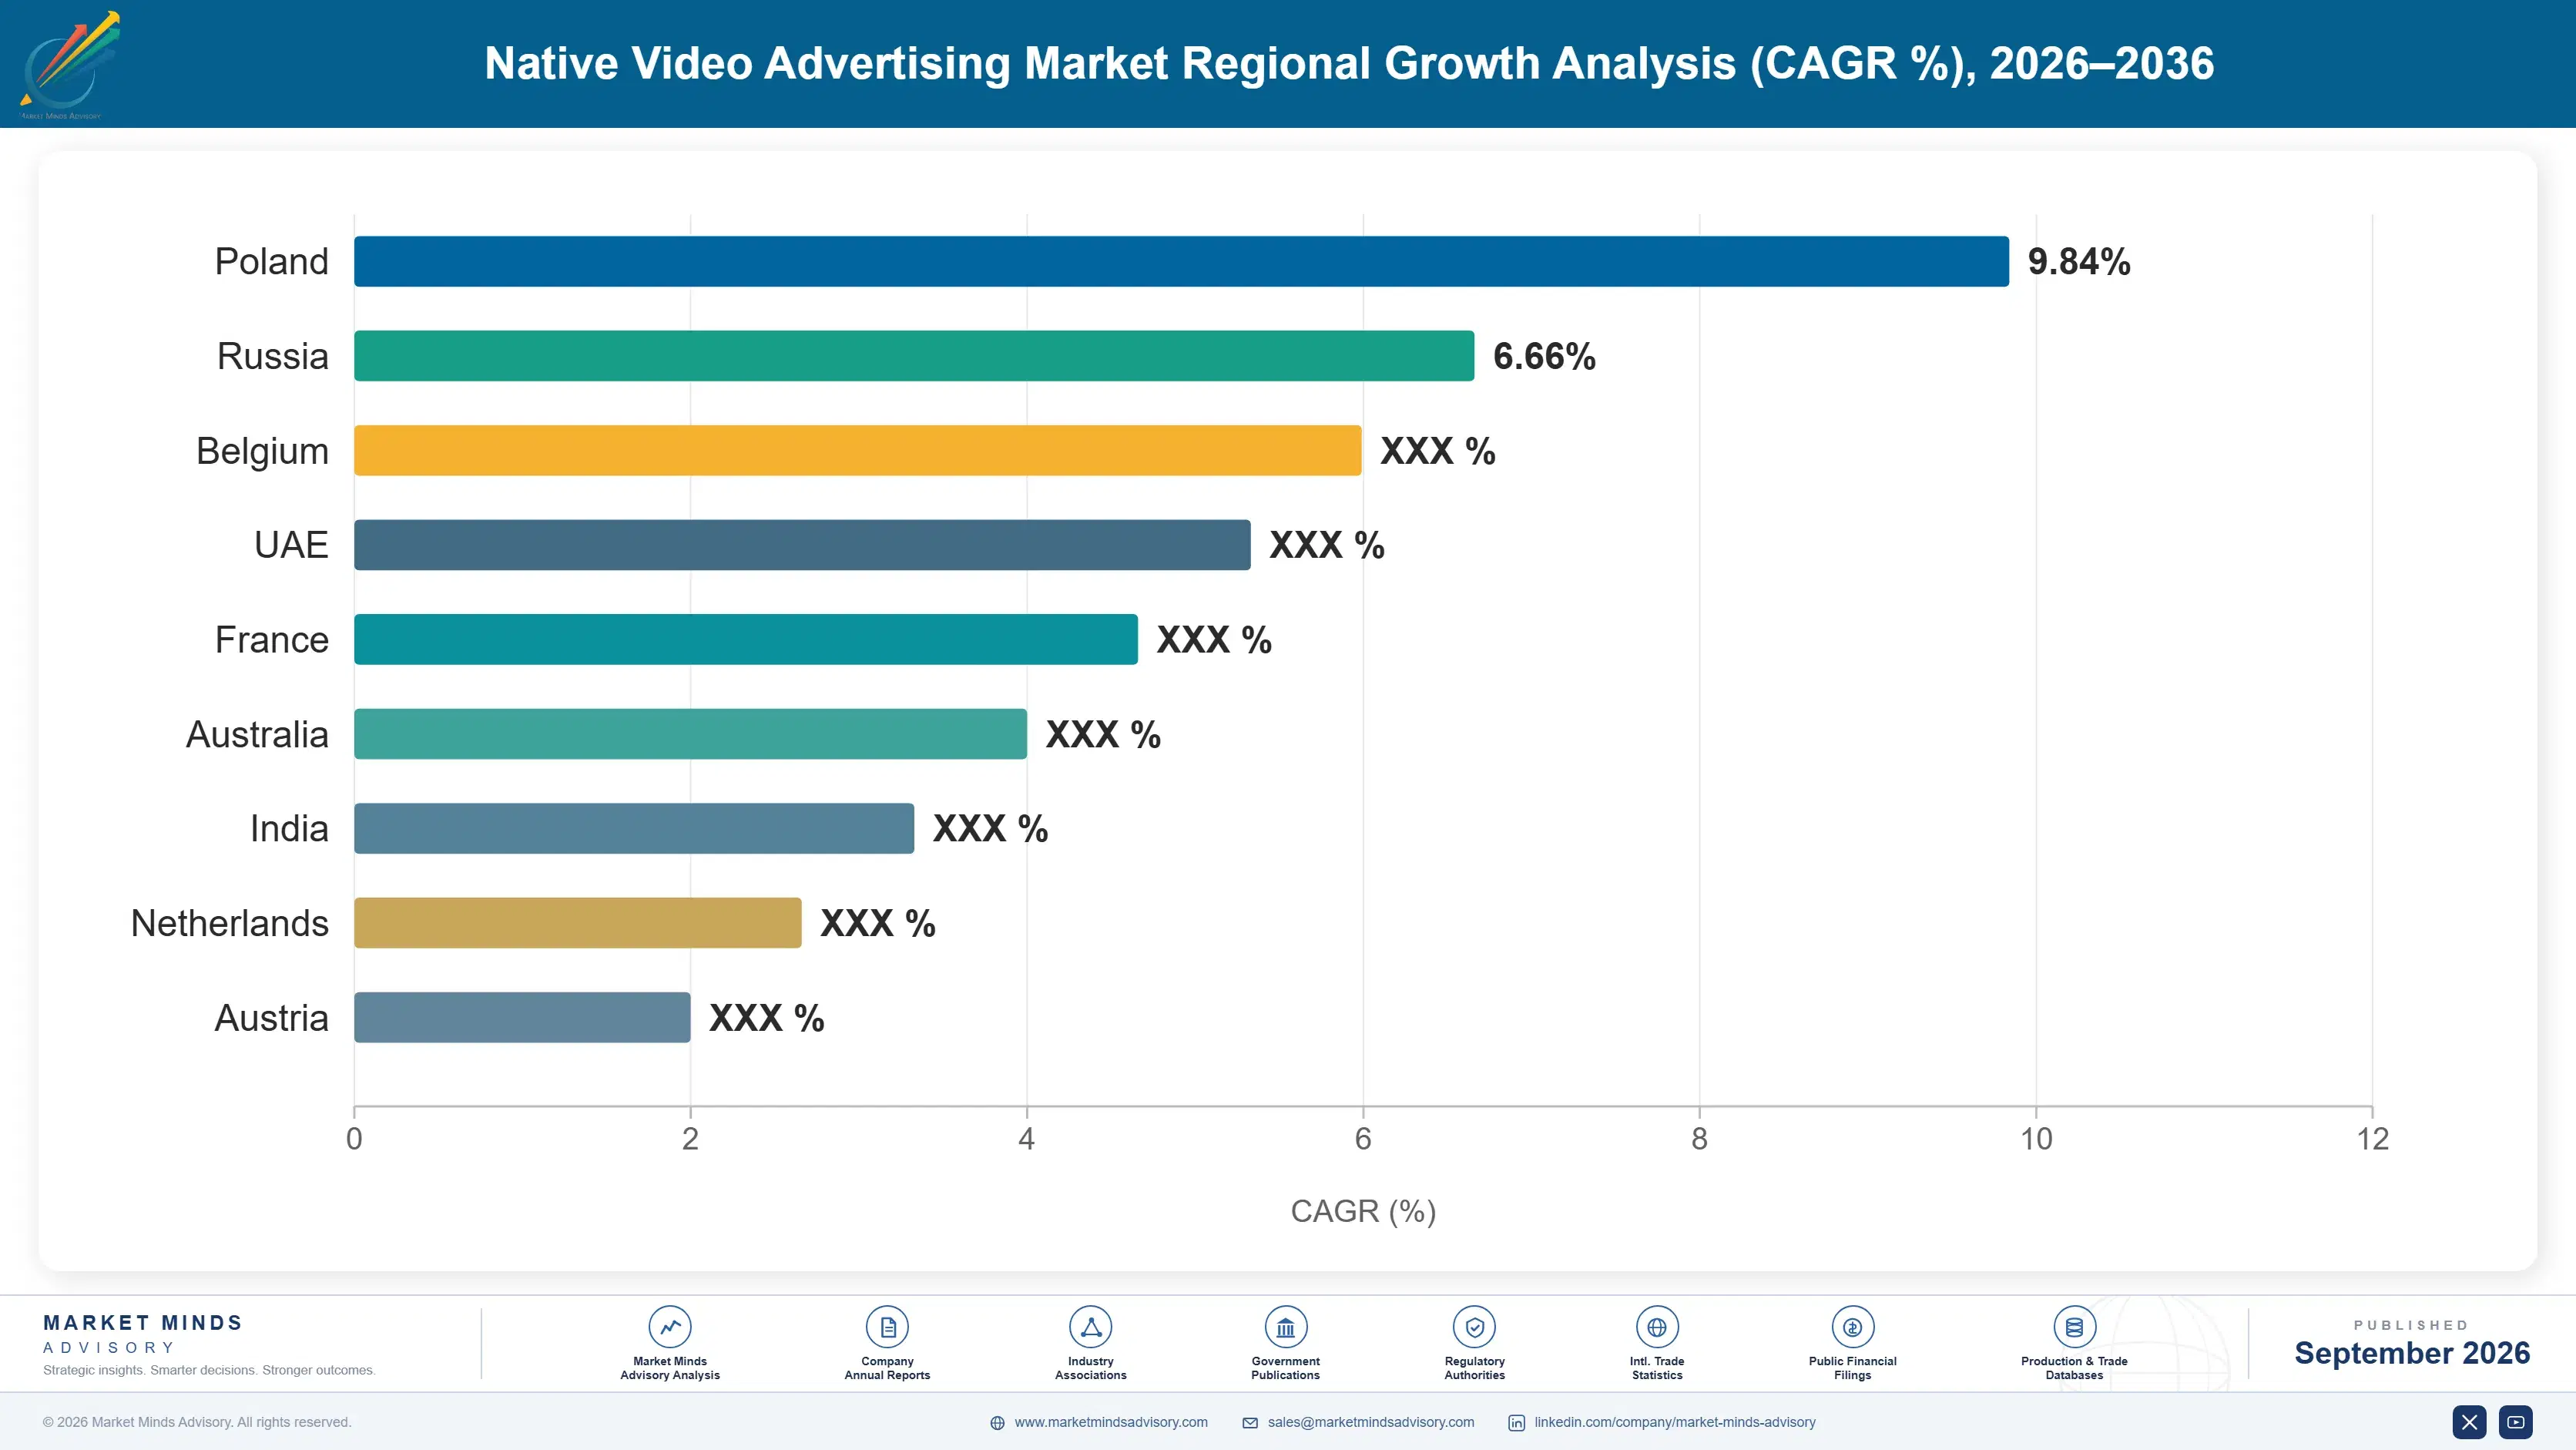
native-video-advertising-market-country-cagr-analysis-1789993143198

Where Platforms Actually Grow Margin

Beyond raw inventory volume, four distinct commercial mechanisms determine which platforms actually expand margin rather than simply chasing impression count each fiscal quarter, calendar year, and contract renewal cycle across the board: connected TV upselling, verified measurement premium pricing, vertical-specific ad format development, and managed campaign services layered on top of self-serve platform tools.

Upselling Advertisers Into Connected TV Inventory

Platforms that convert existing social feed advertisers into connected TV native video buyers capture meaningfully higher revenue per account, since connected TV inventory commands premium pricing justified by larger screen presence and household-level rather than individual targeting precision that advertisers increasingly value across every campaign and quarter of the year. Several leading platforms report connected TV upsell conversion rates exceeding 25% among their largest existing feed advertisers within the first year of connected TV inventory availability, turning an already-established relationship into the fastest-growing revenue line without requiring new advertiser acquisition.
Market Impact: CTV upsell conversion exceeds 25% in year 1

Charging Genuine Premium Rates for Verified Measurement

Platforms that integrate independent third-party measurement verification and charge a premium for this capability capture meaningfully higher revenue per impression than platforms relying solely on self-reported metrics that increasingly skeptical advertisers discount heavily during budget negotiations each renewal cycle and every contract term negotiated carefully in advance. Enterprise advertisers today report willingness to pay premium rates of 15% to 20% above standard pricing for verified inventory, making measurement investment a genuinely favorable margin strategy for platforms serving the largest, most sophisticated advertiser accounts across the industry and every vertical served.
Market Impact: Verified inventory commands a 15 to 20% premium

Building Deep Vertical-Specific Ad Format Templates

Platforms that build pre-configured native video templates tailored to specific verticals, such as automotive configurators or retail product showcases, win larger advertiser commitments and command premium pricing over generic configurable formats requiring lengthy creative customization before any campaign can actually launch to consumers waiting to see it appear on screen at long last. Vertical-specific templates overall reduce campaign setup time meaningfully, and several platforms report verticalized sales motions produce renewal rates roughly 20% higher than horizontal sales approaches targeting any advertiser regardless of industry or overall company size served today.
Market Impact: Vertical templates lift renewal rates fully by 20%

Bundling Deep Managed Campaign Optimization Services

Platforms increasingly bundle managed campaign optimization, creative testing, and performance reporting services on top of the base advertising platform, capturing revenue that would otherwise flow to independent media buying agencies hired separately by the advertiser to manage campaign performance and creative iteration cycles throughout the entire fiscal year and beyond. Services attach revenue now represents a meaningful share of total account value at several leading platforms, sometimes exceeding 18% of total advertiser spend, and this bundling also deepens advertiser relationships since switching means rebuilding an entirely new campaign optimization history.
Market Impact: Services attach reaches well over 18% of spend

Who Controls the Margin Pool

Competitive concentration sits at a substantial CR5 near 55%, evaluated on annual advertising revenue across the category, reflecting the sheer scale advantage major platforms hold through owned audience reach that smaller independent players simply cannot replicate. Meta and Google hold the largest revenue bases through their combined social feed and video platform dominance, and the gap to smaller independent native video networks remains vast given the audience scale required to compete.
Current competitive activity centers on connected TV inventory expansion and measurement credibility rather than raw reach alone, which most established platforms already possess in abundance. Several platforms have pursued acquisitions of smaller measurement verification and brand safety technology companies over the past two years specifically to build in-house capability rather than relying entirely on third-party partnerships, while others have doubled down on connected TV ad tech infrastructure competitors lack.

Rankings are most likely to shift as connected TV-focused platforms like Roku continue gaining share against social-first incumbents whose core feed inventory growth has genuinely matured in developed markets. Consolidation among mid-tier programmatic native video exchanges appears increasingly likely, and private equity interest in measurement and verification technology has picked up as buyers recognize trust-based competitive advantages.
native-video-advertising-market-company-positioning-matrix-1789993143730

Competitive Moat and Risk Dimensions

META

Moat: Massive Owned Audience Scale

Meta's billions of daily active users across Facebook and Instagram give it an audience scale and first-party data depth that smaller native video platforms simply cannot replicate, letting advertisers reach precisely targeted audiences at a scale unmatched by any independent competitor operating in this category.
META

Risk: Regulatory Scrutiny Over Targeting

Meta faces sustained regulatory scrutiny over data collection and ad targeting practices across multiple major jurisdictions worldwide, and any significant new privacy restriction could meaningfully constrain the granular targeting capability that has historically justified premium advertiser pricing on its platforms and across its entire product suite.
GOOGLE

Moat: YouTube's Unmatched Video Library

Google's YouTube platform commands an unmatched library of long-form and short-form video content that keeps viewers engaged for extended viewing sessions, creating substantially more native video advertising inventory and contextual placement opportunity than any competing platform can currently offer advertisers at comparable scale and reach.
GOOGLE

Risk: Antitrust Pressure Across Markets

Google faces ongoing antitrust litigation and regulatory pressure across multiple jurisdictions specifically targeting its advertising technology stack, and any forced structural separation of ad serving and exchange businesses could meaningfully disrupt how efficiently the company currently monetizes its entire video inventory across every product line.

Players Tracked

Prominent Players

Meta
Google
ByteDance
Amazon
Roku

Other Key Players

Snap Inc
Pinterest
X
LinkedIn
Taboola
Outbrain
Teads
Nativo
Sharethrough
Yahoo
Magnite
PubMatic
The Trade Desk
Criteo
Integral Ad Science

Recent Developments

MARCH 2026

Roku Expands Native Video Ad Inventory Significantly

Roku announced a significant expansion of native video advertising inventory across its home screen and content discovery surfaces in March 2026, adding dedicated placement formats specifically designed for connected TV brand advertisers seeking premium screen presence. The expansion reflects continued growth in Roku's ad-supported user base and viewing hours.
Signal: Signals connected TV platforms racing hard to expand native inventory ahead of every major competing platform
MAY 2026

Meta Acquires Brand Safety Verification Startup

Meta acquired a smaller brand safety and content classification technology startup in May 2026, adding specialized machine learning capability for identifying inappropriate content adjacency that had previously required a slower internal development timeline. The deal closed for an undisclosed amount and integrated quickly into existing systems.
Signal: Signals platforms increasingly bringing measurement and content safety capability fully in-house rather than fully outsourcing it
JANUARY 2026

Amazon Signs Data Partnership With Retail Media Network

Amazon signed a multi-year data partnership agreement with a major retail media network in January 2026, expanding native video targeting capability by combining purchase behavior data with content viewing patterns across connected devices and platforms. The partnership strengthens Amazon's competitive position against social feed incumbents.
Signal: Signals retail media purchase data increasingly combining directly with native video advertising audience targeting capability today

Content Delivery and Talent Costs Shape Margins

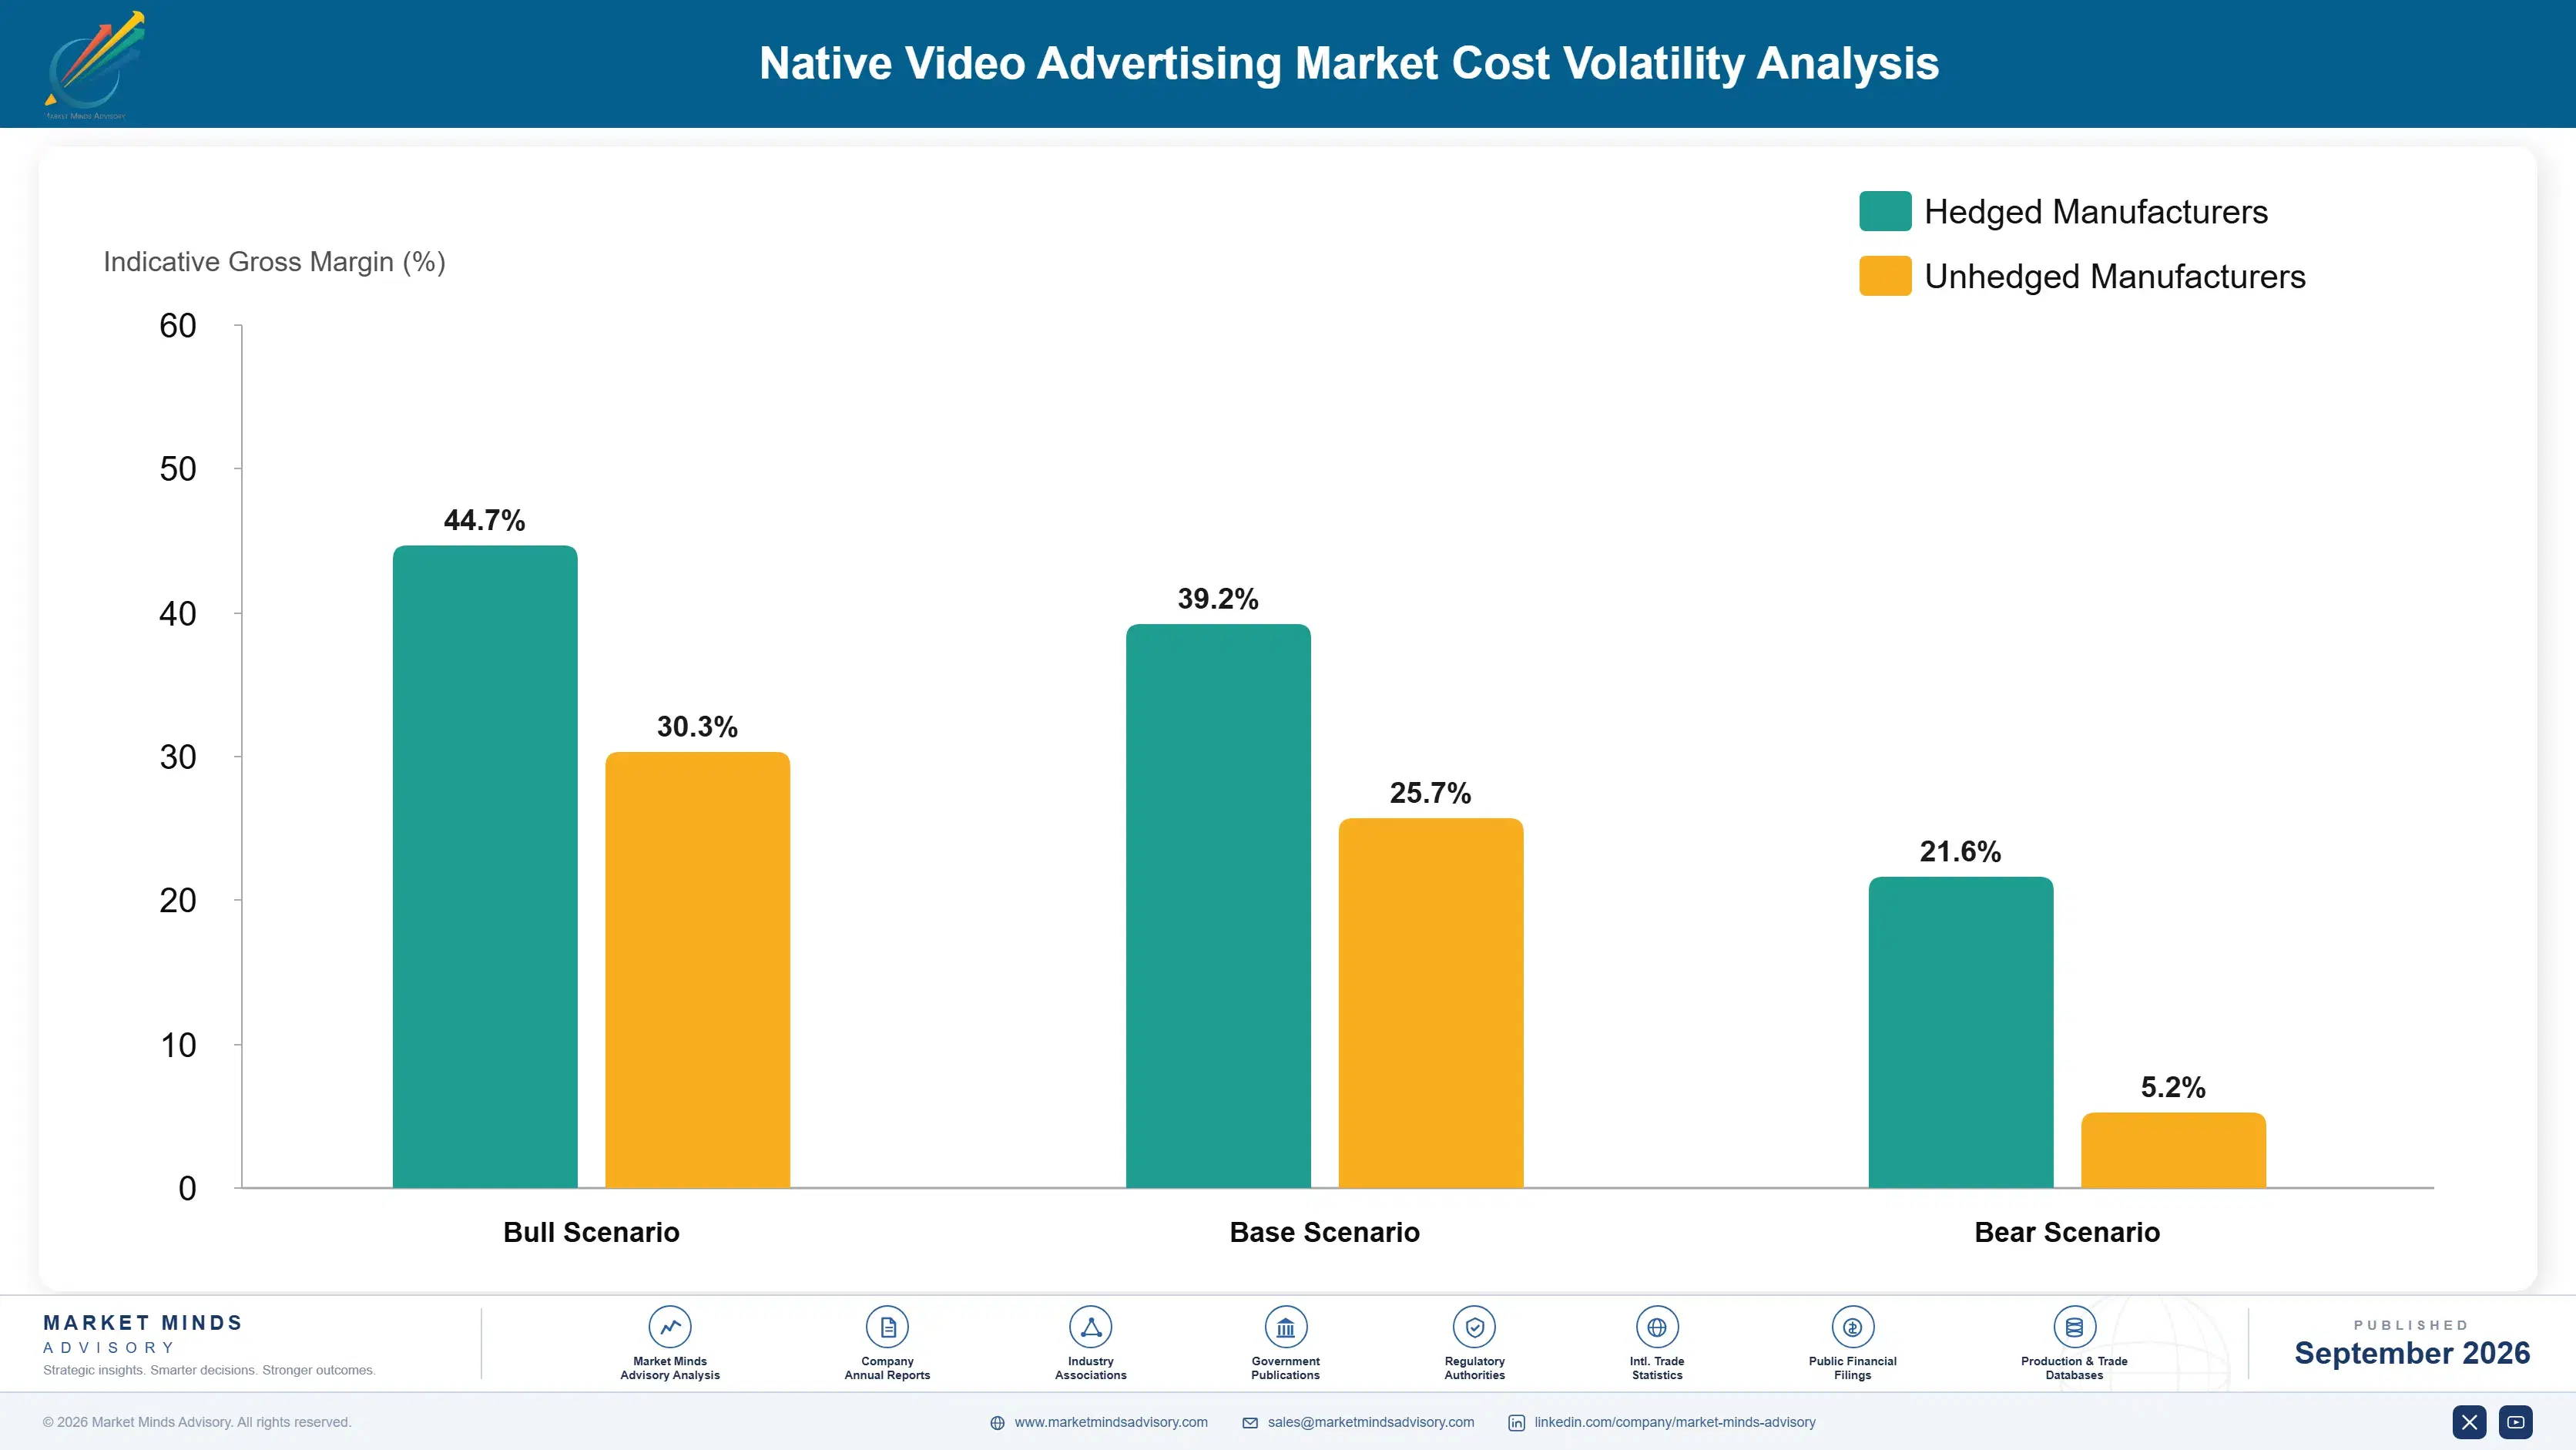
Content delivery network bandwidth and cloud video processing infrastructure represent the largest cost input for native video platforms, running roughly 30% of cost of goods sold, sourced primarily through hyperscale cloud providers and specialized video CDN vendors serving global audiences. Engineering and content moderation talent costs add a substantial secondary cost line for most platforms operating at scale.
A meaningful bandwidth cost spike hit the category in 2025 as video resolution standards increased across most major platforms simultaneously, requiring substantially more data transfer per view than previous years across nearly every device type, an event documented in multiple company annual reports and referenced in IEA reporting on data center energy demand growth tied to video streaming infrastructure. Several platforms renegotiated CDN contracts to manage rising delivery costs.

Platforms without significant scale face a real cost disadvantage against Meta and Google, both of which can spread fixed content delivery and moderation infrastructure costs across a considerably larger user base than smaller independent native video networks managing comparable video volume. This exposure varies by geography too, since platforms serving audiences in regions with less developed local CDN infrastructure face meaningfully higher per-view delivery costs.
native-video-advertising-market-cost-volatility-analysis-1789993143925

Optimizing Video Compression to Reduce Bandwidth

Platforms are increasingly deploying advanced video compression codecs that reduce file size substantially while maintaining acceptable visual quality, cutting bandwidth costs meaningfully without degrading the viewer experience that advertisers and audiences both depend upon across every device, connection type, and geographic region served worldwide today and every single day going forward from this point.

Diversifying CDN Provider Relationships Across Regions

Leading platforms increasingly maintain relationships with multiple content delivery network providers across different regions rather than depending entirely on a single vendor for their entire delivery infrastructure and traffic routing needs across every market, reducing exposure to any one provider's pricing changes or capacity constraints during periods of unusually high video traffic demand globally.

Negotiating Multi-Year Committed Bandwidth Agreements

Platforms are negotiating multi-year committed bandwidth agreements with key CDN and cloud infrastructure providers that lock in discounted delivery pricing in exchange for guaranteed minimum traffic commitments made well in advance of actual future need, trading some short-term flexibility for meaningfully more predictable margin as video traffic continues scaling rapidly worldwide each and every year.

Portfolio Architecture for Margin Defence

The market splits between commodity-adjacent programmatic exchange inventory priced accessibly with thinner margins, and premium connected TV and verified brand-safe placements carrying meaningfully higher gross margins because measurement transparency, brand safety controls, and household-level targeting precision justify substantially higher pricing at larger enterprise advertiser accounts running complex, multi-market campaigns across every major geographic region and product category.
Tension between programmatic volume and premium placement plays out in how platforms allocate investment, since exchange-traded inventory requires ongoing cost competitiveness while premium connected TV development demands continuous measurement and brand safety investment that smaller platforms rarely fund adequately given their limited engineering and sales resources. Most successful platforms treat programmatic inventory as an audience acquisition funnel rather than a standalone profit center, funding premium development from that steadier baseline revenue instead.

The highest-value margin pools concentrate around connected TV and verified premium placements serving large enterprise advertisers willing to pay premium rates for measurable brand outcomes and household-level reach, a customer set that increasingly determines which platforms capture the fastest-growing and most profitable share of the entire market going forward, leaving pure programmatic exchanges competing on thinner and thinner margins with each passing quarter and year.

Volume / Commodity-Adjacent

Programmatic exchange-traded native video inventory priced accessibly for performance-focused advertisers running high-volume campaigns without dedicated brand safety or premium placement requirements across their standard buying process and annual budget cycle.
Gross Margin: 20-30%

Premium / Certified

Verified in-feed social and publisher native video placements with third-party measurement integration serving mid-market and larger brand advertisers requiring reliable, ongoing performance reporting and dedicated account support services throughout the contract.
Gross Margin: 40-50%

Sustainability / Regulatory / Next-Generation

Connected TV native video advertising with household-level targeting and full brand safety guarantees serving the largest enterprise accounts willing to pay significant premium rates consistently across every single campaign launched.
Gross Margin: 48-58%
native-video-advertising-market-portfolio-architecture-1789993144433

High-value Sub-segments and Strategic Watch-out

Connected TV (CTV) Native Video Advertising

High-value and high-growth, this segment commands premium pricing from enterprises willing to pay for household-level reach and measurable brand outcomes, and its growth rate outpaces every other segment currently by a wide and widening margin as ad-supported streaming adoption accelerates broadly across every demographic and region.
Gross Margin: 48-58%

In-Feed Social Media Native Video Advertising

High-value with moderate growth, performance-focused advertisers pay steadily for measurable engagement outcomes, though adoption has matured enough at larger platforms that growth has settled into a much steadier overall pace than the considerably faster-growing connected TV segment described earlier in this same overview section above.
Gross Margin: 38-48%

Programmatic Native Video Ad Exchanges

The volume core of the market, this segment generates the bulk of impression count and recurring exchange revenue across thousands of smaller advertiser accounts worldwide, even though per-impression margins run well below the premium tiers described above and show little sign of expanding meaningfully over time.
Gross Margin: 20-30%

Publisher and Editorial Native Video

A strategic watch-out segment: shrinking publisher advertising budgets and consolidation among digital media companies continue pressuring this segment quite hard, and platforms must watch this decline closely as it threatens a historically important distribution channel for premium brand advertising campaigns and long-standing relationships going forward.
Gross Margin: 22-32%

Renewal Cycles Built Around Proven Performance

Native video advertising revenue runs largely on quarterly and annual budget commitments rather than one-time campaigns, since large advertisers renegotiate agency and platform relationships around fiscal budget cycles rather than individual campaign flights that come and go throughout the year. Platform renewal rates consistently exceed 75% once a measurement and reporting relationship becomes established with an advertiser's marketing and data analytics teams, reflecting how embedded these platforms become in ongoing planning.
Adoption depth varies meaningfully by advertiser category: performance-focused direct-to-consumer brands integrate native video so deeply into daily bidding and optimization workflows that switching platforms risks disrupting active revenue-generating campaigns across every channel they run. Brand-focused advertisers, by contrast, treat platform selection more strategically and switch less frequently but with considerably more deliberation before making any change, given the reputational stakes tied to brand safety and adjacency.

Buyer profiles have shifted generationally as media buying increasingly runs through data and analytics teams rather than traditional creative-focused marketing departments acting alone, bringing more rigorous measurement evaluation criteria and longer platform vetting cycles but also stickier, better-integrated advertising relationships once a platform finally proves out its performance and measurement credibility to internal stakeholders.
native-video-advertising-market-end-use-penetration-index-1789993144929

Priorities for the Coming Decade

These are among the four positions where our research anticipates prominent divergence between winners and laggards over the coming forecast period. Each is grounded in the demand model, the regulatory perimeter, and the announced capacity pipeline.
01 / CONNECTED TV INVESTMENT

Connected TV inventory now determines which platforms win the largest enterprise deals

Connected TV native video advertising has become the single most important growth driver in this category today, well ahead of any other placement format platforms can offer. Platforms still lacking meaningful connected TV inventory are losing the largest enterprise brand deals to competitors who can deliver television-quality reach with digital-grade measurement and targeting precision. Building connected TV capability now, rather than treating it as a future roadmap item, positions a platform to capture the fastest-growing segment of new advertiser spending.
02 / MEASUREMENT CREDIBILITY PRIORITY

Independent verification is now a required rather than optional platform capability

Advertisers increasingly refuse to commit meaningful budget to platforms that rely solely on self-reported performance metrics without independent third-party verification of viewability and completion data across every single campaign they run each quarter. Platforms that integrate genuine third-party measurement partnerships close larger deals faster and retain advertiser relationships longer through smoother annual renewal conversations built on shared trust and transparency. Ignoring this shift risks losing enterprise advertiser budget to competitors who built measurement credibility correctly from the very outset of the relationship.
03 / BRAND SAFETY INVESTMENT

Content classification technology protects advertiser trust and long-term retention

Brand safety incidents involving inappropriate content adjacency have periodically damaged advertiser trust across the entire native video category, not just the specific platform involved in any single incident that made headlines and drew scrutiny. Platforms that invest proactively in improved content classification technology and offer granular exclusion controls differentiate themselves meaningfully from competitors still relying on reactive incident response after damage has already occurred and trust has eroded. This investment increasingly determines which platforms retain the largest, most risk-averse enterprise advertiser accounts over time.
04 / REGULATORY DISCLOSURE READINESS

Proactive disclosure compliance protects the format from stricter future regulation

Regulatory scrutiny over native advertising disclosure requirements continues intensifying across multiple major jurisdictions simultaneously, and platforms that wait for mandatory regulation before acting risk disruptive last-minute format changes imposed on short notice without warning. Building standardized, clear sponsored content labeling now, rather than treating disclosure as a legal afterthought, preserves more of the format's core effectiveness than being forced into reactive compliance later under pressure and time constraints. Platforms that get ahead of this trend protect their competitive position for years to come.

Engagement Snapshot From the Field

A live engagement with an industry participant carrying material or product regulatory and market exposure ahead of a defining policy shift, showing how our research translates into a defensible multi-year portfolio strategy.
MARKET MINDS ADVISORY · CLIENT ENGAGEMENT SUMMARY
Native Video Advertising Producer Strategic Portfolio Review and Transition Roadmap 2026·Investment Scenario on Native Video Advertising Exposure Evaluation 2025-26
CLIENT PROFILE
The client was a mid-size direct-to-consumer apparel retailer generating approximately $210 million in annual revenue (client-reported, unverified by MMA), selling primarily through its own e-commerce site and a growing wholesale retail partnership network spanning several regional department store chains. The brand had relied heavily on in-feed social media video advertising for customer acquisition since its founding.
STRATEGIC CHALLENGE
Customer acquisition costs through in-feed social media video had risen steadily over the past two years as competition for the same target audience intensified across nearly every major platform, and management wanted to evaluate whether connected TV native video advertising could diversify acquisition channels while improving overall marketing efficiency and long-term customer lifetime value.
MMA APPROACH
MMA conducted a structured channel evaluation benchmarking connected TV native video against the client's existing social media video mix, incorporating primary interviews with the brand's marketing and finance leadership. The analysis modeled projected customer acquisition cost and incremental reach across several connected TV platform options using MMA's proprietary benchmarking dataset covering comparable direct-to-consumer brand deployments.
KEY FINDINGS
  1. Connected TV pilot campaigns projected customer acquisition cost reductions of 15 to 22 percentage points (client-reported, unverified by MMA) versus social media alone.
  2. Audience overlap between connected TV and existing social media channels measured only 18%, indicating meaningful incremental reach potential for the brand overall.
  3. Creative production costs for connected TV format campaigns overall ran roughly 40% higher than standard social media video creative development budgets required.
  4. Marketing leadership ranked measurable incremental reach as their single highest-priority evaluation criterion, well above raw impression volume generally considered by other teams.
CLIENT PROFILE
The client was a mid-size direct-to-consumer apparel retailer generating approximately $210 million in annual revenue (client-reported, unverified by MMA), selling primarily through its own e-commerce site and a growing wholesale retail partnership network spanning several regional department store chains. The brand had relied heavily on in-feed social media video advertising for customer acquisition since its founding.
STRATEGIC CHALLENGE
Customer acquisition costs through in-feed social media video had risen steadily over the past two years as competition for the same target audience intensified across nearly every major platform, and management wanted to evaluate whether connected TV native video advertising could diversify acquisition channels while improving overall marketing efficiency and long-term customer lifetime value.
MMA APPROACH
MMA conducted a structured channel evaluation benchmarking connected TV native video against the client's existing social media video mix, incorporating primary interviews with the brand's marketing and finance leadership. The analysis modeled projected customer acquisition cost and incremental reach across several connected TV platform options using MMA's proprietary benchmarking dataset covering comparable direct-to-consumer brand deployments.
KEY FINDINGS
  1. Connected TV pilot campaigns projected customer acquisition cost reductions of 15 to 22 percentage points (client-reported, unverified by MMA) versus social media alone.
  2. Audience overlap between connected TV and existing social media channels measured only 18%, indicating meaningful incremental reach potential for the brand overall.
  3. Creative production costs for connected TV format campaigns overall ran roughly 40% higher than standard social media video creative development budgets required.
  4. Marketing leadership ranked measurable incremental reach as their single highest-priority evaluation criterion, well above raw impression volume generally considered by other teams.
RECOMMENDED STRATEGY
Phase 1: Phase 1 (Months 1 to 2): Complete a full structured channel evaluation and incremental reach modeling across every platform option. Phase 2: Phase 2 (Months 3 to 6): Launch pilot connected TV campaigns carefully alongside existing social media video spend already running. Phase 3: Phase 3 (Months 7 to 10): Scale connected TV investment based on validated pilot performance and carefully measured final results.
OUTCOME
The brand launched and scaled connected TV native video advertising within ten months, reporting an 18 percentage point customer acquisition cost improvement (client-reported, unverified by MMA) across its blended media mix. Overall marketing efficiency improved measurably as the brand diversified beyond its historical single-channel dependency.

Frequently Asked Questions

Foundational context covering the market sizes, CAGR, scope, country, region and competition that inform every finding below. This section is provided to cover basics and most often pre-purchase conversations, answered from the MMA Primary Research Dataset.

What is the current size of the Native Video Advertising Market?

The Native Video Advertising Market was valued at $32.5 billion in 2025, the base year for this report. Growth has accelerated as ad-supported streaming tiers create fresh connected TV inventory.

How large will the Native Video Advertising Market be by 2036?

MMA projects the market will reach $102.45 billion by 2036, up from $36.08 billion in 2026. That represents a 2.84x expansion over the ten-year forecast period.

What is the CAGR for the Native Video Advertising Market 2026 to 2036?

The market is projected to grow at an 11.0% CAGR between 2026 and 2036, with a bull case of 12.3% and a bear case of 9.7% depending on measurement standardization.

Which segment is growing fastest?

Connected TV native video advertising is growing fastest at a 15.0% CAGR, roughly 1.36 times the overall market rate, as ad-supported streaming tiers rapidly expand.

Who are the major companies in the Native Video Advertising Market?

Leading platforms today include Meta, Google, ByteDance, Amazon, and Roku, evaluated on annual advertising revenue. Combined, the top five hold roughly 55% of the market.

Which country is growing fastest?

Indonesia is growing fastest at a 15.5% CAGR, reflecting its enormous, young, mobile-first population increasingly spending time daily on video-centric social media applications and platforms.

Report Segmentation Architecture

The full report scope spans multiple orthogonal segmentation dimensions, with cross-tabulated demand data provided for each dimension pair. Coverage extends further to regional breakdowns, trend trajectories, and the competitive detail needed to support segment-level decision-making.

By Placement Format

  • Connected TV (CTV) Native Video Advertising
  • In-Feed Social Media Native Video Advertising
  • In-App Mobile Native Video Advertising
  • Publisher and Editorial Native Video Advertising
  • Programmatic Native Video Ad Exchanges
  • Branded Content Video Advertising

By End-Use Industry

  • Retail and E-Commerce
  • Consumer Packaged Goods
  • Automotive
  • Financial Services and Insurance
  • Travel and Hospitality

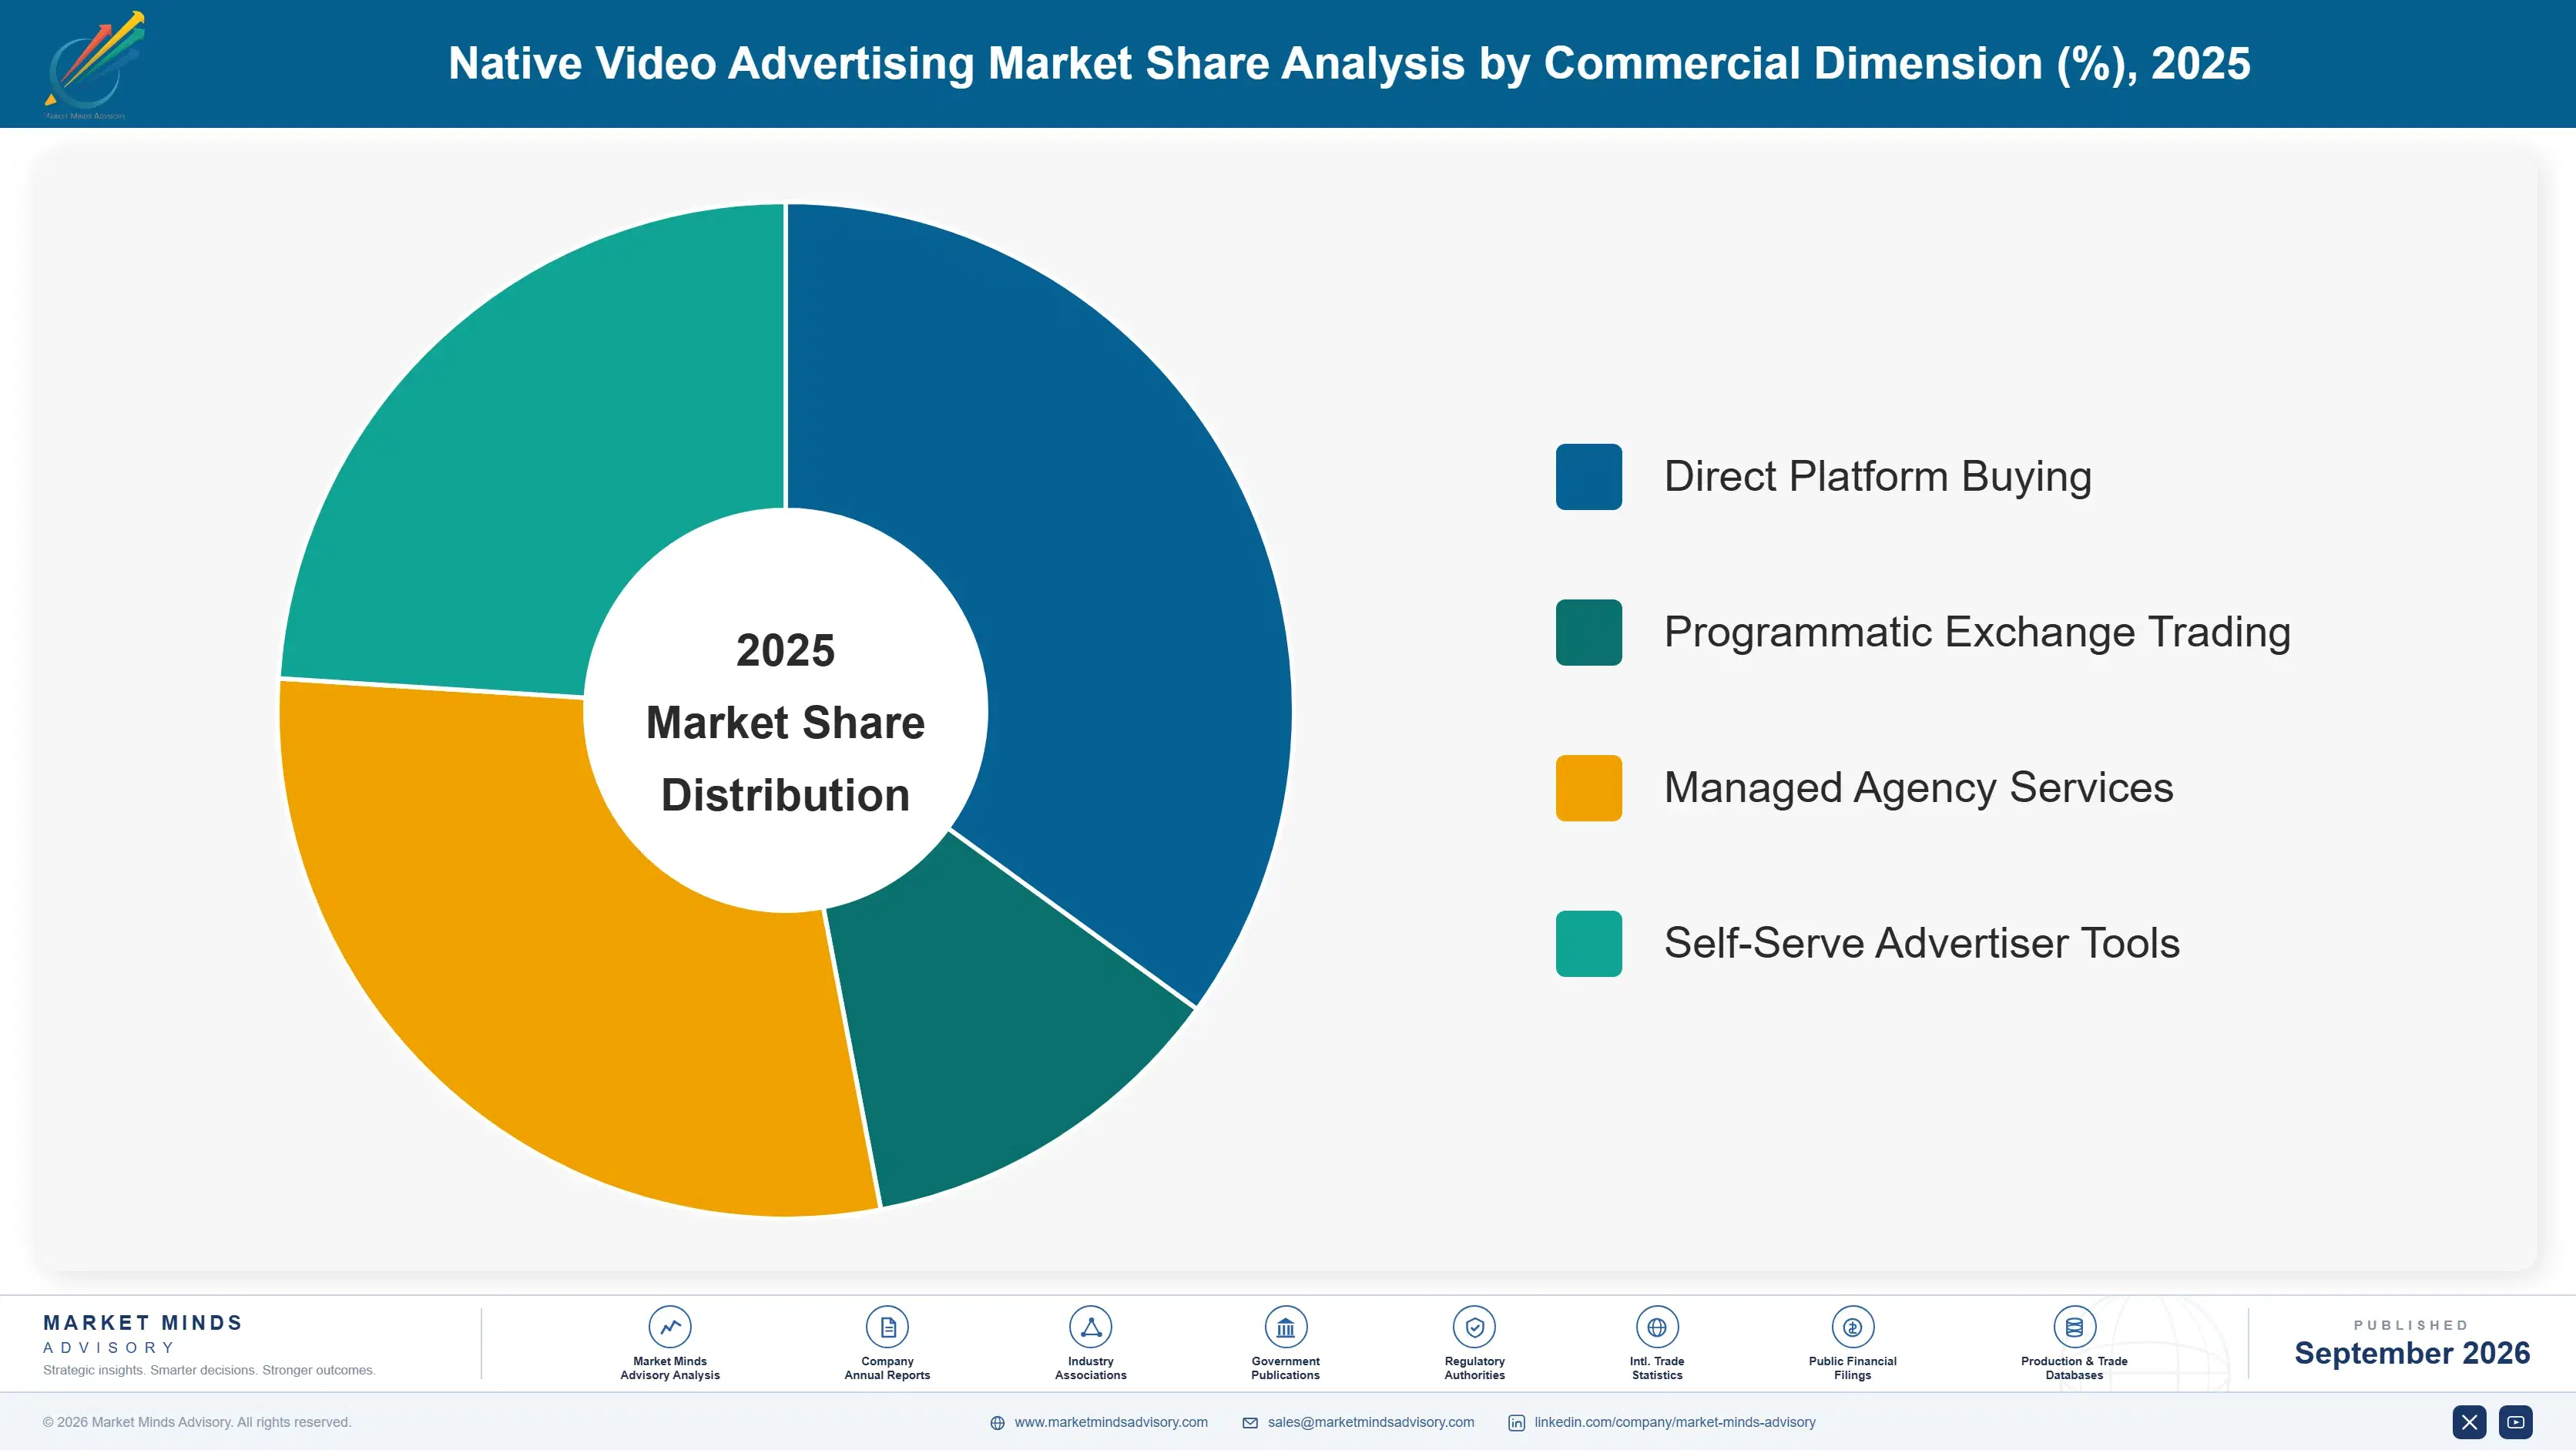
By Commercial Dimension

  • Direct Platform Buying
  • Programmatic Exchange Trading
  • Managed Agency Services
  • Self-Serve Advertiser Tools

By Region

  • North America
  • Western Europe
  • East Asia
  • South Asia and Pacific
  • Latin America
  • Middle East and Africa
  • Eastern Europe

Scope, Methodology, and Coverage

Every figure in this report is reproducible from documented input assumptions. The scope below maps the historical period, the forecast horizon, the segmentation dimensions, and the countries covered, alongside the underlying primary and qualitative methodology.
Historical Period
2020 to 2025
Forecast Period
2026 to 2036
Base Year
2025 (USD billions; MMA Primary Research Dataset, September 2026)
Market Definition
The Native Video Advertising Market covers video ad formats designed to visually and contextually match the surrounding content experience across in-feed social media, connected TV, publisher editorial, and in-app mobile placements. It excludes traditional pre-roll and mid-roll display banner advertising, direct mail, and non-video native content marketing formats like sponsored articles.
Quantitative Units
USD billions (current prices); impression count; CAGR percentage; regional share percentage
Segmentation Dimensions
By Placement Format; By End-Use Industry; By Commercial Dimension; By Region
Regions Covered
North America, Western Europe, East Asia, South Asia and Pacific, Latin America, Middle East and Africa, Eastern Europe
Countries Covered
USA, China, Germany, France, UK, Japan, South Korea, India, Australia, Canada, Brazil, Mexico, Indonesia, Vietnam, Philippines, Singapore, UAE, Saudi Arabia, South Africa, Nigeria, Poland, Italy, Spain, Sweden, Switzerland, Netherlands, Argentina, Turkey, Thailand, and additional markets relevant to this sector
Key Companies Profiled
Meta, Google, ByteDance, Amazon, Roku, Snap Inc, Pinterest, X, LinkedIn, Taboola, Outbrain, Teads, Nativo, Sharethrough, Yahoo, Magnite, PubMatic, The Trade Desk, Criteo, Integral Ad Science
Quantitative Methodology
Primary survey, n=3,800 respondents, Q4 2025, six countries; demand-side model with trade association cross-validation
Qualitative Methodology
47 expert interviews, Q4 2025; applied to validate demand model assumptions, identify emerging dynamics, and assess competitive positioning
Report Format
PDF and XLSX data workbook (Word format preview document)
Publisher
Market Minds Advisory
Report Code
MMA-2026-TEC-205
Published
September 2026
Contact
sales@marketmindsadvisory.com | www.marketmindsadvisory.com

Purchase the full Native Video Advertising Market Report (2026 to 2036).

This report provides a comprehensive assessment of the global Native Video Advertising Market through 2036, covering placement format segmentation, regional demand patterns, and competitive positioning across social feed, connected TV, publisher, and programmatic exchange platforms. It quantifies market sizing, growth scenarios, and pricing dynamics shaped by expanding ad-supported streaming inventory and rising advertiser demand for verified measurement. Analysis extends to input cost exposure, portfolio margin architecture, and demand stickiness by advertiser category. The report closes with forward-looking strategic recommendations for platforms and investors evaluating this category.
Ten-year market sizing and forecast model
Full placement format and segmentation analysis
Full seven-region demand and growth breakdown
Competitive benchmarking of top twenty platforms
Input cost exposure and mitigation strategy review
Strategic verdict and revenue lever recommendations

Built For The People Who Decide

From boardroom strategy to bench-side execution, this report is read cover-to-cover by leaders shaping the next decade of their industry, turning demand scenarios, market dynamics and valuation benchmarks into decisions.
CXOs/ Presidents/ VPs/ Managers
M&A and Corporate Development
Strategy Teams and R&D Heads
Procurement and Product Directors
Regulatory and Compliance Leaders
Investor Relations and Equity Analysts