Market Minds Advisory
Native Starch Market

Native Starch Market: Clean Label Substitution, Botanical Source Economics and Feedstock Pass-Through, 2026 to 2036

Food brands removing the words modified starch from an ingredient list have handed native starch a growth story that its own functional limitations should never have allowed it to have.

Lead Analyst

Lisa Gevelber

Published

September 2026

Make Smarter Decisions with Customized Research Insights

Request a free sample report and evaluate market opportunities, growth trends, and competitive dynamics relevant to your business needs.

2025 MARKET VALUE$42.0BMarket Size 2025
2036 FORECAST VALUE$68.9BBase Case , 2026 to 2036
CAGR 2026 TO 20364.6 %Bull 5.8% / Bear 3.4%
INCREMENTAL OPPORTUNITY$24.9BNet 10- year value creation
EXPANSION MULTIPLE1.57x2036 value over 2026 base
Strategic Levers
M&A Pipeline
Regional Outlook
Country Rankings
Competitive Intelligence
Segmental Deep-dive
Call-Us : 91 93563 13602

Executive Snapshot and Market Trajectory

Label wording is doing considerably more for this market than any technical development ever has. Food brands reformulating to remove the phrase modified starch from ingredient declarations have pushed volume back toward native starch, and they are accepting functional compromises they resisted for thirty years.
Tapioca and cassava starch grows at 6.9%, a full 1.50 times the market rate, because it is naturally bland, allergen-free and non-genetically-modified, which answers three separate reformulation objections at once. East Asia holds 30% of global value on Chinese corn wet milling capacity, while South Asia and Pacific takes an unusually large 14% of the total, because Thai, Vietnamese and Indonesian cassava processing between them supply most of the world's tapioca starch.
Concentration is low at 34% for the top five, which is normal in agricultural processing, where feedstock catchment rather than technology decides where a plant can sit. Grain and tuber cost is 62% of goods sold, and that single number governs the industry: processors selling into annual food contracts against a feedstock that reprices with every harvest carry a mismatch that no amount of commercial skill fully resolves.
Market Definition
The market covers native starch, meaning starch extracted from grain, tuber or pulse feedstock and dried without chemical derivatisation, spanning corn, wheat, potato, tapioca, rice and pulse sources. It includes physically treated starches that retain native labelling status. It excludes chemically modified and derivatised starches, glucose and fructose syrups, maltodextrins, polyols, starch-based bioplastics, vital wheat gluten and other co-products, and fermentation products made from starch.
Base Year Value
$42.0B in 2025 (MMA Primary Research Dataset, August 2026)
Forecast Period
2026 to 2036, eleven discrete annual values
CAGR
4.6% base case. Bull 5.8%. Bear 3.4%.
Fastest Growth Segment
Tapioca and Cassava Starch: 6.9% CAGR
Fastest Growth Country
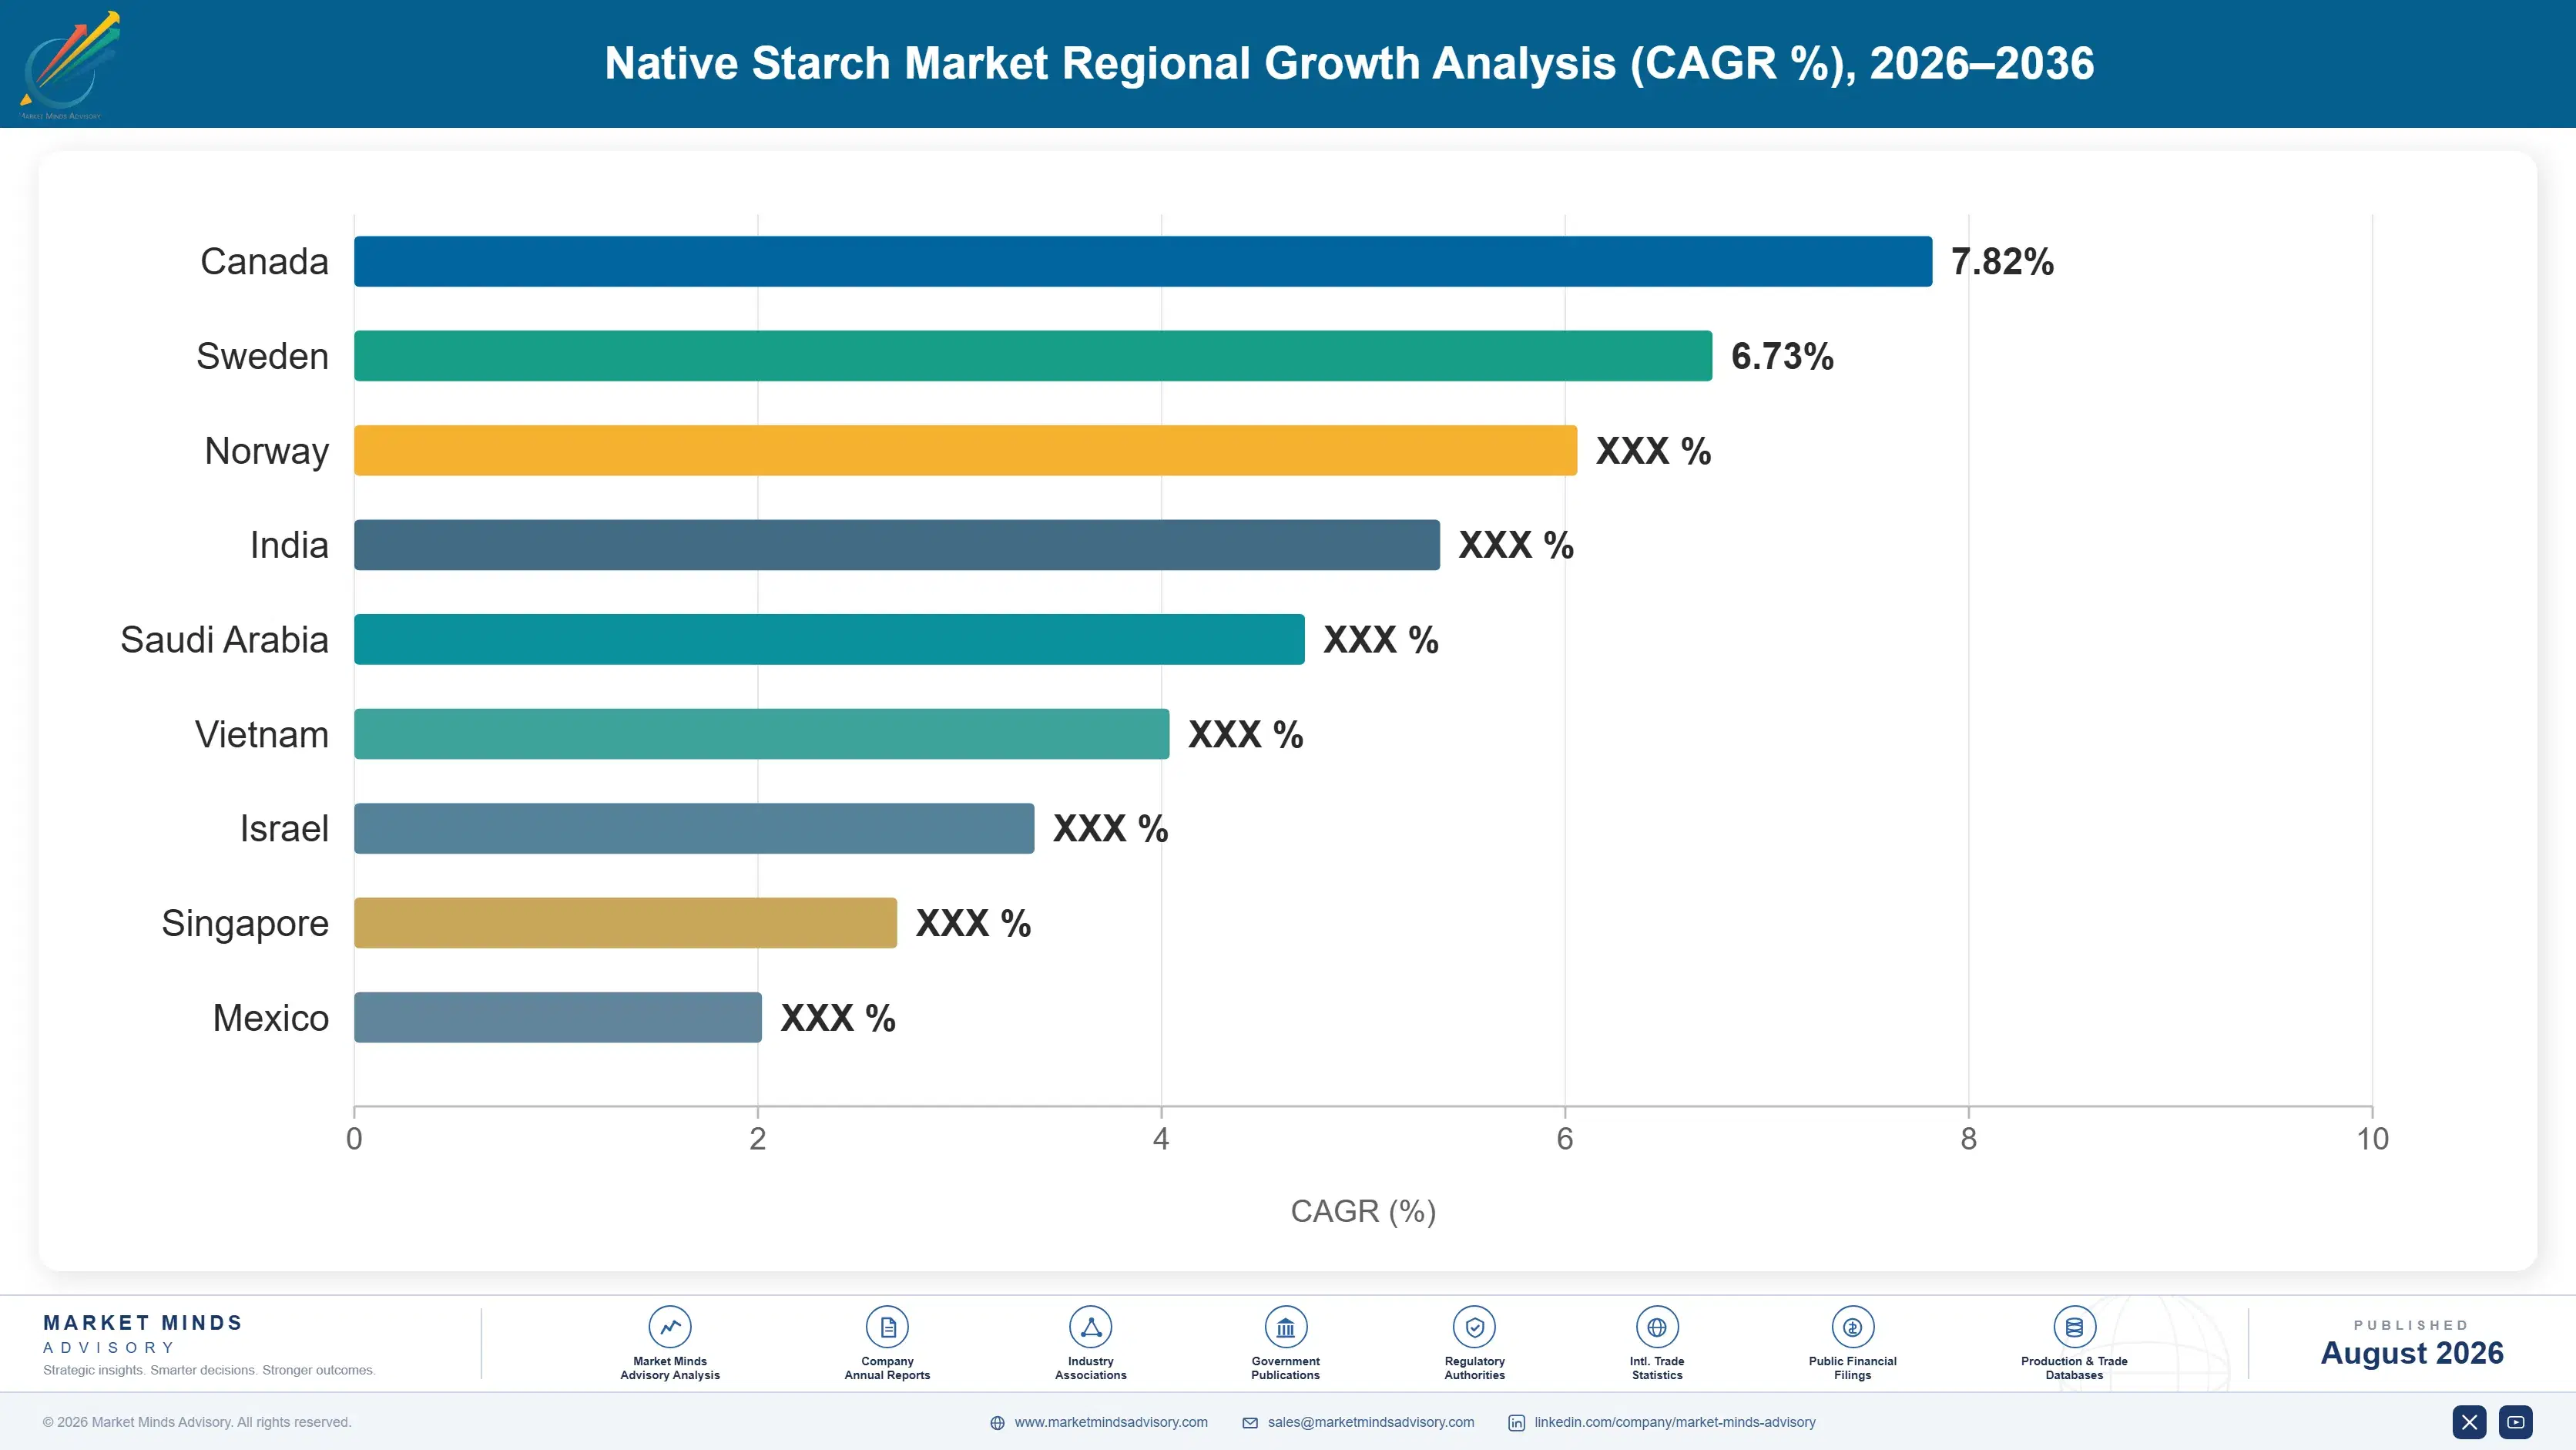
India: 7.4% CAGR
Fastest Growth Region
South Asia and Pacific: 6.9% CAGR
Largest Region
East Asia: 30% of 2025 global value
Market Leaders
Cargill, Ingredion, Archer Daniels Midland, Roquette, Tereos. Source: MMA Primary Research Dataset, July 2026.
Primary Survey
n=3,800 procurement and R&D decision-makers, Q4 2025, six countries
Methodology
Demand-side build-up, cross-validated against public data, 47 expert interviews

Native Starch Market Forecast Scenarios

native-starch-market-trends-forecast-size-forecast-scenario-1787311669947
The market compounded at 3.7% between 2020 and 2025, and feedstock prices rather than demand set the value pattern. Volumes were steady throughout while grain costs swung violently: maize and wheat prices spiked through 2022 on the Black Sea disruption, and processors holding annual food contracts absorbed most of that movement. Clean label reformulation grew consistently across the whole period.
The 4.6% base case rests on three separate commercial mechanisms. First, clean label reformulation keeps moving volume from modified to native starch across sauces, dairy, bakery and prepared meals. Second, botanical mix shifts toward tapioca and rice, which command premiums over corn for allergen and label reasons rather than functional ones. Third, Asian food processing growth adds genuine incremental volume as packaged food penetration continues rising across India and Southeast Asia.
The bull case at 5.8% assumes clean label requirements tighten across private label ranges while packaged food penetration accelerates across South Asia. The bear case at 3.4% turns on two risks together: cassava mosaic disease constraining Southeast Asian tapioca supply, and a period of low grain prices that improves modified starch cost competitiveness enough to slow the reformulation shift that currently drives most of the mix improvement.

Why Feedstock Catchment Decides Plant Economics

Starch processing is an agricultural business wearing industrial clothes. A wet milling plant sits where the grain is, runs on margins measured in tens of dollars per tonne, and lives or dies on whether it can pass feedstock movement through to customers who have annual price agreements.
TOP FIVE CONCENTRATION34%Combined position of the five largest starch processing companies
AVERAGE SELLING PRICE$620 per tonneTypical realised price across botanical sources and grades
TOP PRODUCING COUNTRY SHARE31%Chinese share of global native starch production capacity
GRAIN INPUT SHARE62% of COGSFeedstock grain and tuber share of delivered production cost
CAPACITY UTILISATION77%Average operating rate across installed wet milling plants
CLEAN LABEL DEMAND SHARE26%Portion of output sold into clean label reformulated food products
That mismatch is the central commercial fact. Maize, wheat and cassava reprice with every harvest and with every currency movement, while food manufacturers negotiate ingredient pricing yearly and resist mid-term increases as policy. Processors carry the gap. The 2022 grain spike showed how damaging that is: several European operators reported that annual contracts signed before the movement destroyed a full year of margin, and a few curtailed production entirely.
Clean label has given the industry something it lacked, which is a reason for customers to pay more for the same molecule. Native starch does less than modified starch functionally, particularly under retort processing and freeze-thaw cycling, and that limited it to undemanding applications for decades. Brands now accept shorter shelf life, thicker formulations and occasional texture compromise to shorten an ingredient list, and they pay for it. That is a marketing outcome rather than a technical one, which makes it durable differently.
"Native starch spent forty years losing to modified starch on every functional measure that food technologists care about, and then won a large chunk of it back because consumers learned to read ingredient lists. Nobody in this industry planned for that, and most processors still describe the shift as a fashion. It has now lasted longer than most fashions do."
Principal Analyst, Food Ingredients and Agro-Processing Practice · MMA Agricultu

Market Trends

Clean Label Reformulation Reverses Four Decades Of Substitution

Food brands have spent the past decade shortening ingredient declarations, and the phrase modified starch is among the terms consumer research identifies most negatively. That has pushed volume back toward native starch across sauces, soups, dairy desserts, bakery fillings and prepared meals. Roughly 26% of native starch output now goes into products reformulated specifically for label reasons, against about 14% five years earlier. Brands accept genuine functional compromise to achieve it, which reverses a substitution trend that ran steadily the other way from the 1980s onward. Private label ranges have adopted it fastest of all.
Market Impact: Grows packaged volumes 8% annually
Physical Treatment Extends Native Functionality Without Losing Status

Heat-moisture treatment, annealing and other purely physical processes improve starch stability under heat and shear while retaining native labelling status in most jurisdictions, since no chemical derivatisation occurs. That has become the industry's main technical answer to the clean label functionality gap. Physically treated grades realise roughly 30% above standard native starch and are growing considerably faster. The regulatory position varies by jurisdiction and remains the commercial risk, since any reclassification of these processes would remove the labelling advantage that justifies the whole premium. No major market has reclassified them yet.
Market Impact: Covers roughly 40 labelling framewo

Market Opportunities and Growth Drivers

Asian Packaged Food Penetration Adds Genuine Volume

Packaged and processed food consumption is rising quickly across India, Indonesia, Vietnam and the Philippines as urbanisation, cold chain build-out and organised retail all expand together at once. Starch is used in almost every processed food category, so that growth translates fairly directly into starch volume. Packaged food volumes across South and Southeast Asia have grown at around 8% annually since 2021. The demand favours locally sourced botanicals, which is exactly why tapioca and rice starch positions across the region are strengthening considerably faster than any imported corn starch position is.
Market Impact: Exposes 62% of production cost

Gluten-Free And Allergen Labelling Favours Specific Botanicals

Gluten-free product ranges and allergen declaration requirements have moved formulation away from wheat starch and toward tapioca, rice, potato and pulse sources in a widening set of applications. The driver is regulatory declaration rather than any clinical prevalence, since a manufacturer must declare wheat derivation on the label whether or not any gluten survives processing. Gluten-free packaged food ranges have now expanded across roughly 40 national markets operating formal labelling frameworks. That mechanism steadily reallocates volume between botanicals without changing total starch demand at all, which single-source processors consistently underestimate.
Market Impact: Excludes 40% of starch applications

Market Restraints and Challenges

Feedstock Cost Cannot Be Passed Through Fast Enough

Grain and tuber feedstock is 62% of cost of goods and reprices with each harvest, while food manufacturers negotiate ingredient pricing annually and resist mid-term increases as policy. The root cause here is contract convention rather than any genuine market failure. Commercially this means a bad harvest destroys processor margin regardless of operational quality, as 2022 demonstrated across European operators. Participants are addressing it through indexation clauses that larger food companies now accept, through forward grain purchasing matched to contract terms, and by diversifying botanical sources across separate crop geographies entirely.
Market Impact: Reaches 26% of native starch output

Functional Limits Cap How Far Clean Label Substitution Goes

Native starch loses viscosity under retort sterilisation, separates through freeze-thaw cycling and tolerates acid poorly, which rules it out of a substantial set of applications where modified starch performs reliably. The root cause is molecular: without cross-linking, the granule simply cannot withstand those conditions. Commercially this caps the whole reformulation opportunity well short of the total starch market. Participants are extending the boundary through physical treatment, through blends with hydrocolloids, and through reformulating the surrounding recipe rather than only the starch itself, which requires applications laboratory capability most processors lack.
Market Impact: Realises 30% above standard native
3 additional market trends, 4 additional growth drivers, and 2 additional restraints and challenges are covered in the full report. Contact sales@marketmindsadvisory.com to access the complete intelligence.

Segment CAGR and Growth Architecture

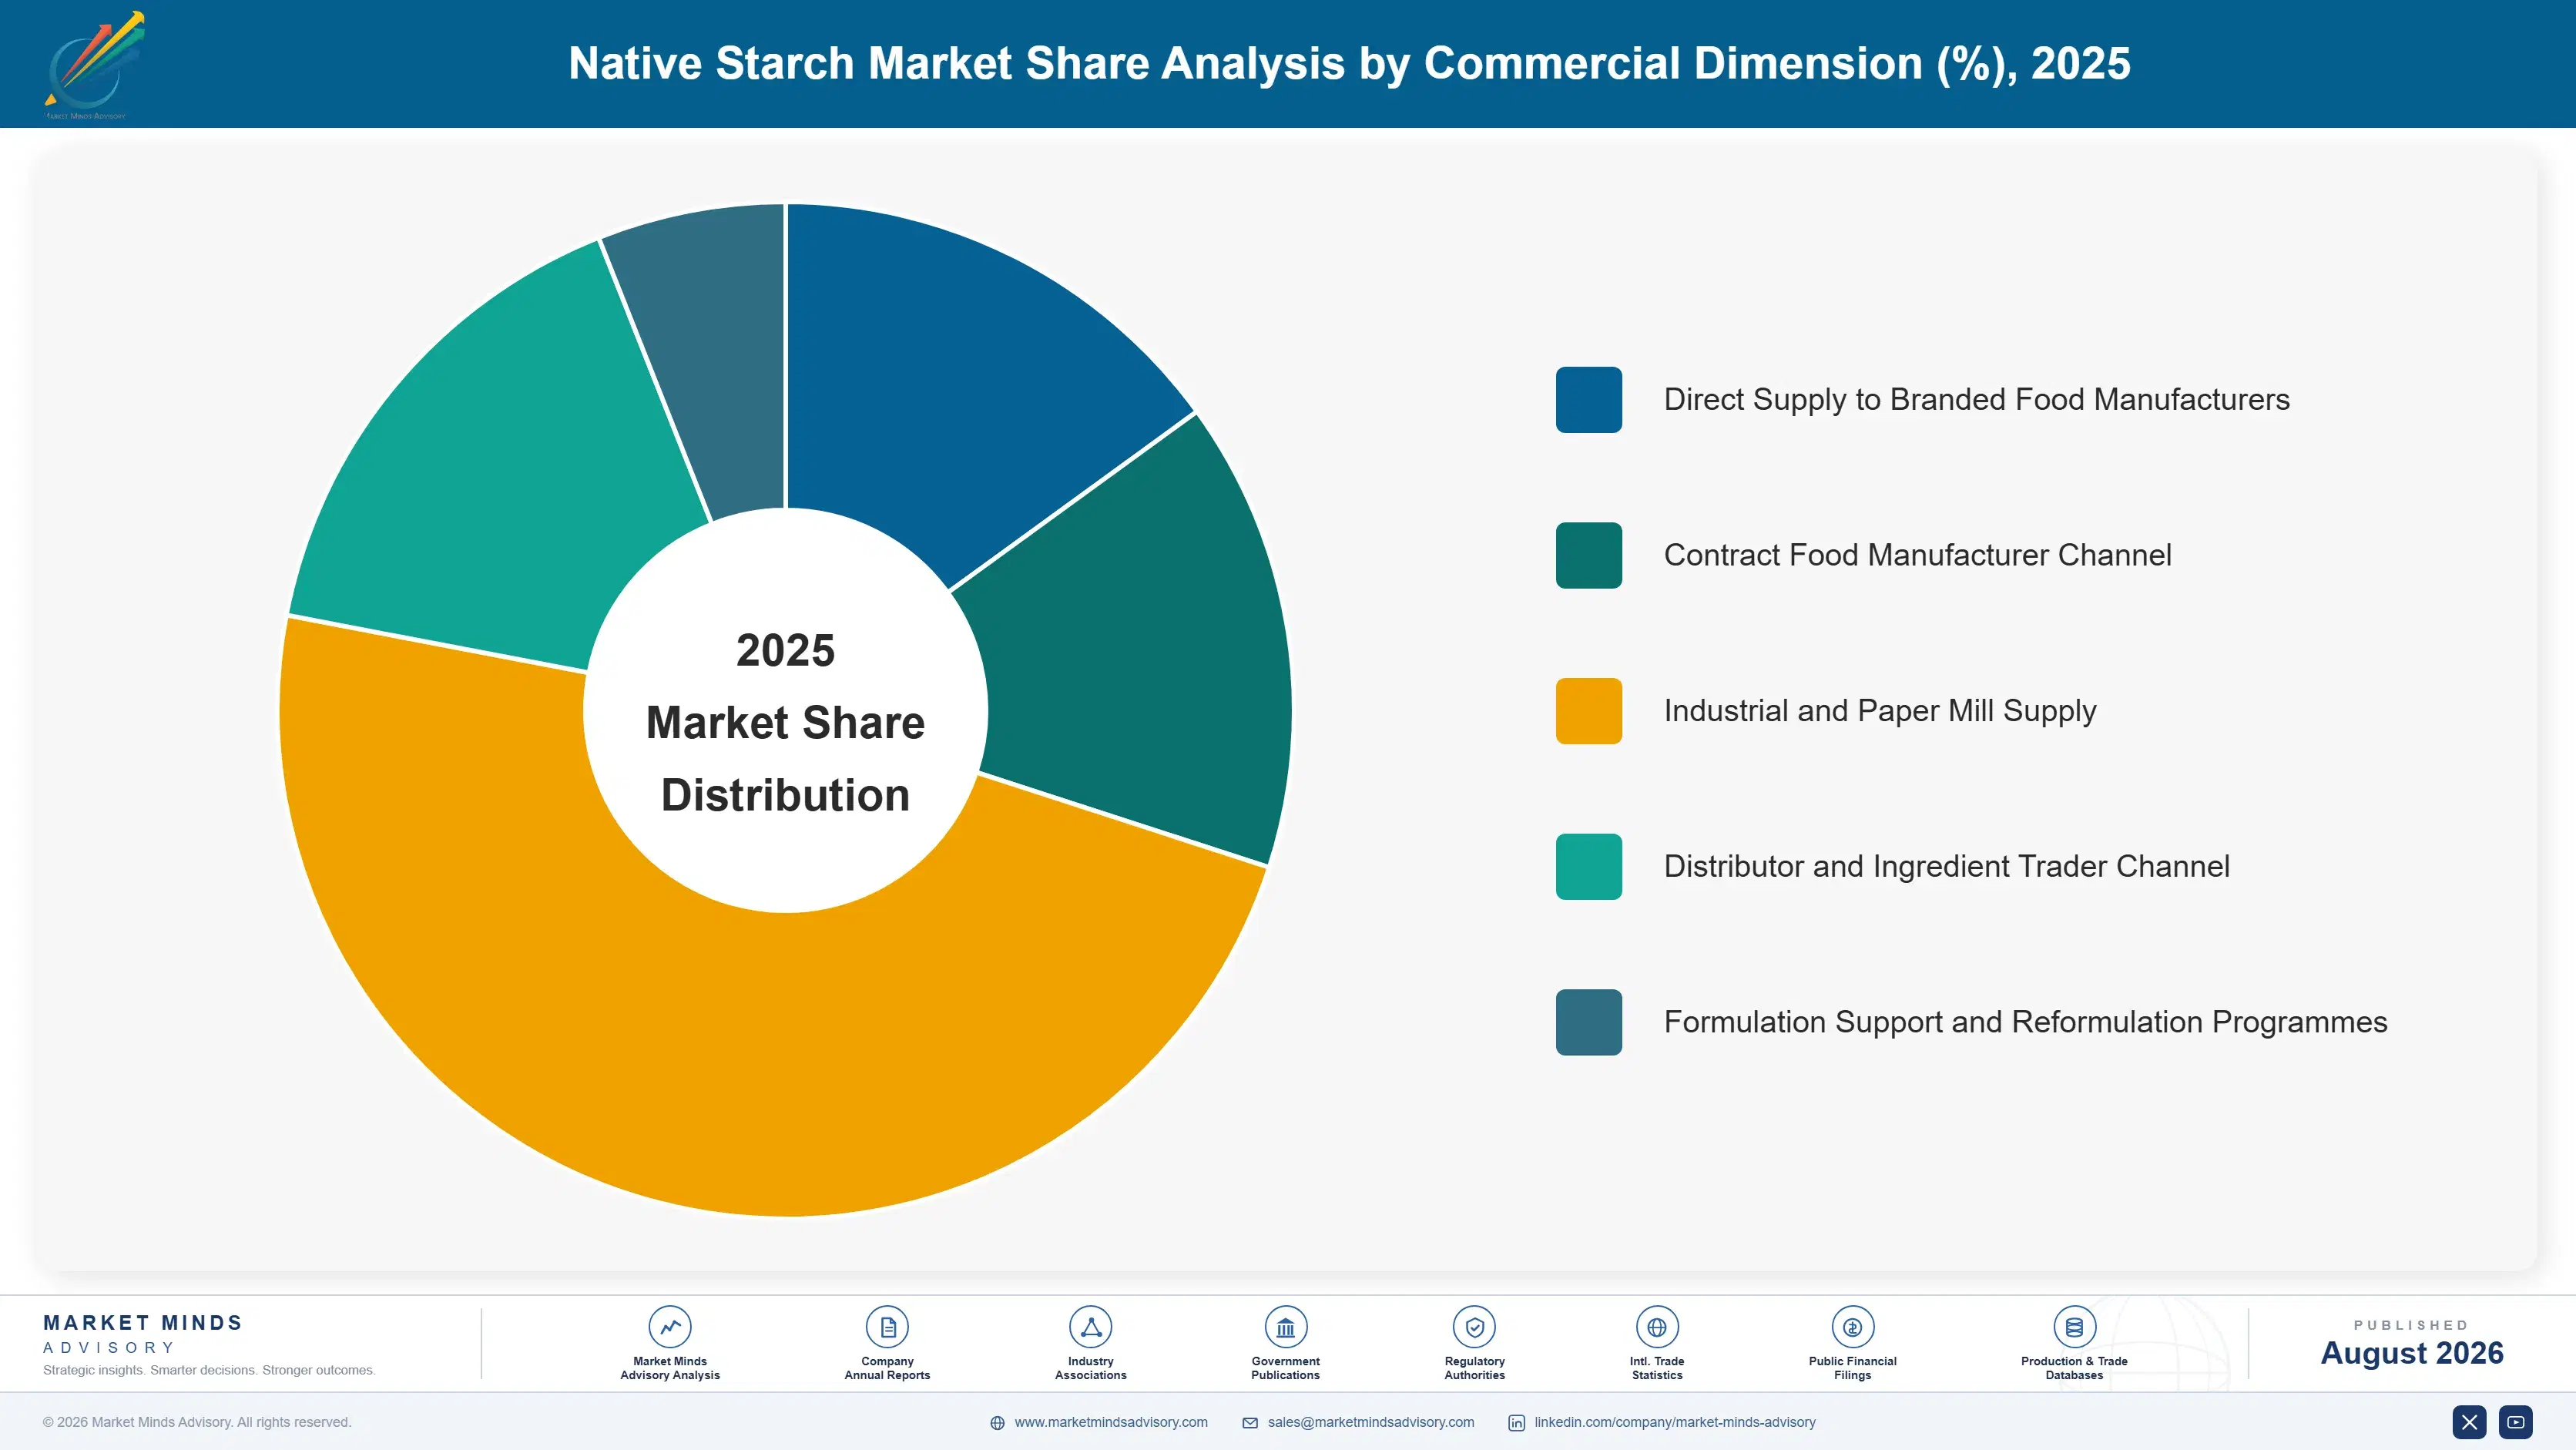
Segmentation here follows botanical source, meaning simply the crop from which the starch is extracted. That single dimension determines granule size, gelatinisation behaviour, allergen declaration, labelling position, achievable pricing and the feedstock catchment geography required, and it is precisely how food formulators and processors alike genuinely organise their thinking about this whole market in practice.
native-starch-market-trends-forecast-market-share-analysis-1787311670480

Tapioca and Cassava Starch

The fastest segment at 6.9%, a full 1.50 times the market rate, covering the starch extracted from cassava root, principally across Thailand, Vietnam and Indonesia, and increasingly in Cambodia and Nigeria as well. It answers three quite separate reformulation objections simultaneously: the flavour is genuinely neutral, it carries no major allergen declaration at all, and no commercially grown genetically modified cassava exists anywhere. Realised pricing runs well above corn starch on those attributes alone rather than on any functional advantage. Cassava mosaic disease across Southeast Asian growing areas is the material supply risk, and it has already reduced yields enough to tighten global availability across individual seasons, which buyers now watch closely.
CAGR 6.9%

Rice Starch

Growing at 5.8% annually on starch extracted from broken rice and other rice milling fractions, valued for its exceptionally small granule size, bland flavour and hypoallergenic positioning in infant nutrition and sensitive-skin cosmetic applications. The exceptionally small granule size gives a smooth mouthfeel that no other botanical matches, which matters in dairy desserts and infant cereals specifically. The feedstock here is a milling by-product rather than a primary crop in its own right, so supply follows rice processing volumes rather than any planting decision. Extraction yields are lower than corn or cassava, which keeps unit costs high and confines the segment to those applications that genuinely value its particular attributes rather than merely tolerating them.
CAGR 5.8%
Full segment breakdown across 6 segments available in the complete report.

Regional Architecture and Country Demand Map

East Asia leads on Chinese corn wet milling capacity and domestic food processing demand together. South Asia and Pacific takes an outsized share because Southeast Asian cassava processing supplies most global tapioca starch. Western Europe holds the highest-value specialty positions and the strictest labelling rules.

East Asia

Thirty percent of global value sits here, resting on Chinese corn wet milling capacity that covers roughly 31% of world output alongside very large domestic food processing demand. Chinese processors are concentrated in Shandong, Jilin and Heilongjiang where maize catchment supports scale, and consolidation has reduced the producer count considerably since 2018. Japanese and Korean demand is smaller but weighted toward high-specification food and industrial applications. Growth of 5.8% reflects packaged food expansion alongside clean label reformulation reaching Chinese domestic brands. Feedstock policy, including state maize reserve management, affects processor margins more than any commercial factor here. Clean label adoption is now accelerating quickly among domestic Chinese food brands. Consolidation continues among smaller processors.
Share: 30% | CAGR: 5.8% (2026 to 2036)

North America

Twenty-four percent of global value, dominated by corn wet milling across the Midwest at a scale no other region matches on a single botanical. Native starch is a modest share of what those plants produce, since sweetener and ethanol co-products carry much of the economics, and that integration gives processors flexibility that single-product operations lack entirely. Growth of 4.0% tracks packaged food volumes and clean label reformulation, which is furthest advanced in this region. Genetically modified maize is the standing commercial complication, since it closes several export markets and some domestic label positions to corn starch entirely. Clean label formulation support has become the principal commercial differentiator across this region.
Share: 24% | CAGR: 4.0% (2026 to 2036)
Regional intelligence for 5 additional markets available in the complete report: Western Europe, South Asia and Pacific, Latin America, Middle East and Africa, Eastern Europe. Contact sales@marketmindsadvisory.com.
native-starch-market-trends-forecast-country-cagr-analysis-1787311670993

Where Processing Margin Actually Accumulates

Four commercial moves separate the processors earning genuine ingredient margins from those merely clearing tonnage at grain-plus economics. Each one depends on holding something a food manufacturer cannot simply obtain by switching supplier: indexation discipline, physical treatment capability, genuine botanical breadth across separate geographies, or the co-product integration that quietly carries the whole plant economics.

Index Food Contracts To Published Grain Benchmarks

Feedstock is 62% of cost of goods and reprices every harvest while food contracts run annually, which is where essentially all margin volatility in this industry originates. Processors who moved their customers onto indexation referencing published maize, wheat and cassava benchmarks now hold margin through the harvest movements that destroyed competitors in 2022. Larger food companies now accept those terms readily, having watched several suppliers fail outright. The commercial work involved is contractual rather than operational, which makes it comfortably the cheapest and highest-return move available anywhere in this industry.
Market Impact: Protects 62% of cost from harvest p

Install Physical Treatment To Close Functional Gaps

Heat-moisture treatment and annealing improve heat and shear stability while retaining native labelling status, which is precisely the functional gap that currently limits clean label substitution. Physically treated grades realise roughly 30% above standard native starch and they grow considerably faster too. Equipment costs $12 million to $25 million on an existing wet milling site, which is modest against the pricing improvement across a large volume base. The regulatory position varies by jurisdiction and needs continuous monitoring, though no reclassification of these processes has yet occurred in any major market.
Market Impact: Realises roughly 30% above standard

Hold Botanical Breadth Across Separate Geographies

Allergen labelling, genetic modification status and clean label positioning all reallocate volume between botanicals without changing total starch demand at all, so a processor holding only corn simply watches business move across to tapioca and rice regardless of how well it performs itself. Multi-botanical suppliers retain roughly 85% of their volume through reformulation cycles, against under 60% for single-source processors facing the same customers. Building that breadth means separate plants in separate crop catchments rather than any product line extension, which is precisely why so few processors genuinely hold it today.
Market Impact: Retains roughly 85% of volume throu

Use Co-Product Integration To Carry Plant Economics

Wet milling generates gluten, fibre, germ, oil and protein alongside the starch, and those co-products frequently carry more of the plant margin than the starch itself does. Processors optimising co-product realisation rather than starch yield alone report plant returns 4 to 7 percentage points higher on exactly the same grain throughput. Vital wheat gluten and corn protein have both repriced favourably in recent years as feed and food protein demand grew steadily. The discipline required is sustained commercial attention to streams that starch-focused organisations habitually treat as a disposal problem instead.
Market Impact: Lifts plant returns by 7 percentage

Who Controls the Margin Pool

Concentration is low at 34% for the five largest processors, measured on native starch revenue across all participants, and fragmentation persists because feedstock catchment rather than technology decides where a plant can economically sit. Cargill leads on multi-botanical breadth across geographies, and the gap to the second tier is widest in botanical range rather than in total milling capacity.
Competition runs on three dimensions. Botanical breadth matters most as clean label and allergen labelling reallocate volume between crops, since a single-source processor cannot follow its customer. Contract structure decides who survives a bad harvest, and indexation discipline separates processors far more reliably than operational efficiency does. Price competition is fiercest in commodity corn starch sold into industrial paper and textile use, where the product is entirely interchangeable.

Two pressures are building. Southeast Asian tapioca processors are moving from bulk export toward specification-grade supply with clean label documentation, which attacks the premium Western processors charge on the same attributes. Meanwhile physical treatment capability is spreading, which will erode the pricing premium that early adopters currently enjoy. Rankings shift where botanical breadth meets indexation discipline, since holding one without the other still leaves a processor exposed.
native-starch-market-trends-forecast-company-positioning-matrix-1787311671515

Competitive Moat and Risk Dimensions

CARGILL

Moat: Broadest multi-botanical geographic footprint

Processing positions across corn, wheat, tapioca and potato in separate crop catchments let the company follow a customer as allergen labelling or clean label positioning reallocates volume between botanicals. Single-source processors lose that business regardless of their own performance, and building comparable breadth means separate plants rather than product extensions.
CARGILL

Risk: Starch diluted within vast portfolio

Native starch sits inside an agricultural trading and processing business of enormous scale, competing internally for capital against operations many times its size. Investment in physical treatment capability or specialty botanical capacity that a focused competitor would fund quickly can move slowly. In a market where reformulation windows are measured in seasons, that pace carries real cost.
INGREDION

Moat: Deepest food formulation support capability

Applications laboratories and formulation support across clean label reformulation projects place the company inside customer development work rather than merely supplying against a specification. Brands reformulating away from modified starch need help managing the functional compromise, and that help converts into specification positions competitors selling on price cannot easily attack.
INGREDION

Risk: Exposure to clean label durability

A meaningful share of growth and the formulation support business behind it depends on clean label reformulation continuing to reallocate volume from modified to native starch. That shift is a marketing rather than a technical outcome, and consumer priorities could move on. The applications investment would then support a market growing at underlying food volumes alone.

Players Tracked

Prominent Players

Cargill
Ingredion
Archer Daniels Midland
Roquette
Tereos

Other Key Players

Tate and Lyle
Agrana
Avebe
Grain Processing Corporation
Global Bio-chem Technology
Zhucheng Xingmao Corn Developing
Sanstar
Gujarat Ambuja Exports
Thai Wah
Vedan Enterprise
Emsland Group
Manildra Group
SPAC Starch Products
Sonish Starch Technology
Angel Starch and Food

Recent Developments

FEBRUARY 2025

Ingredion expands physically treated clean label starch capacity

Additional heat-moisture treatment capacity entered commercial service at an existing wet milling site, aimed at the food manufacturers now reformulating away from modified starch and who require the heat and shear stability that standard native grades simply cannot deliver under retort or high-shear processing conditions.
Signal: Physical treatment is now becoming the tec
JUNE 2025

Thai Wah expands specification-grade tapioca starch capability

Investment in specification-grade tapioca starch processing capability and the full clean label documentation package was completed during the period, moving the company away from bulk export supply and toward the documented specialty positions that Western processors have historically charged substantial premiums for on identical attributes.
Signal: Southeast Asian processors are now attacki
OCTOBER 2025

Roquette concludes indexed multi-year food ingredient agreements

Several multi-year ingredient supply agreements referencing published grain benchmarks were concluded with several of the largest European food manufacturers, reflecting how the 2022 harvest movement had finally persuaded these large buyers to accept indexation terms that they had previously refused as a matter of standing policy.
Signal: Indexation is now accepted by large food b

What Drives Delivered Starch Cost

Grain and tuber feedstock accounts for roughly 62% of cost of goods, the highest share of any major food ingredient category, and it reprices with every harvest. Energy for drying and evaporation contributes 13%, which is high because starch must be dried from slurry to under fourteen percent moisture. Labour adds 7% and freight 9%, the latter rising sharply for tapioca shipped intercontinentally.
The 2022 grain episode was the defining recent event. Black Sea disruption pushed maize and wheat pricing to multi-year highs within months, and European processors holding annual food contracts absorbed almost all of it. Tereos annual reporting for the period documented substantial raw material cost pressure across its starch operations, and several European operators curtailed production rather than process at negative margin. Indexation adoption accelerated sharply afterwards across the industry.

The competitive disadvantage mechanism runs through contract structure, not purchasing skill. A processor on annual fixed food contracts carries a whole harvest movement with no recovery mechanism, while one on indexed terms passes most of it through in a quarter. Co-product integration compounds it, since gluten and protein realisations move with grain. Single-product processors on fixed contracts are the industry's most exposed position, and 2022 removed several.
native-starch-market-trends-forecast-cost-volatility-analysis-1787311671710

Match forward grain cover to contract duration

Buying grain on a different horizon from the contracts it supplies creates exposure that no market view resolves. Processors now match forward purchase cover to committed contract duration rather than to a price opinion, which removes the mismatch entirely, at the cost of surrendering whatever upside a favourable harvest movement might otherwise have delivered.

Optimise co-product realisation alongside starch yield

Gluten, germ, fibre and protein streams frequently carry more plant margin than the starch itself, yet starch-focused organisations habitually treat them as disposal problems. Commercial attention to those streams lifts plant returns by four to seven percentage points on identical grain throughput, and it also provides a partial natural hedge against the feedstock movement that damages everything else.

Recover evaporator and dryer heat across the plant

Drying starch from slurry to shipping moisture dominates plant energy use and most of that heat currently leaves as vapour. Mechanical vapour recompression and heat recovery cost roughly $18 million per plant and cut energy cost of goods by around four percentage points, with payback under five years at European industrial power prices and considerably faster wherever carbon costs apply.

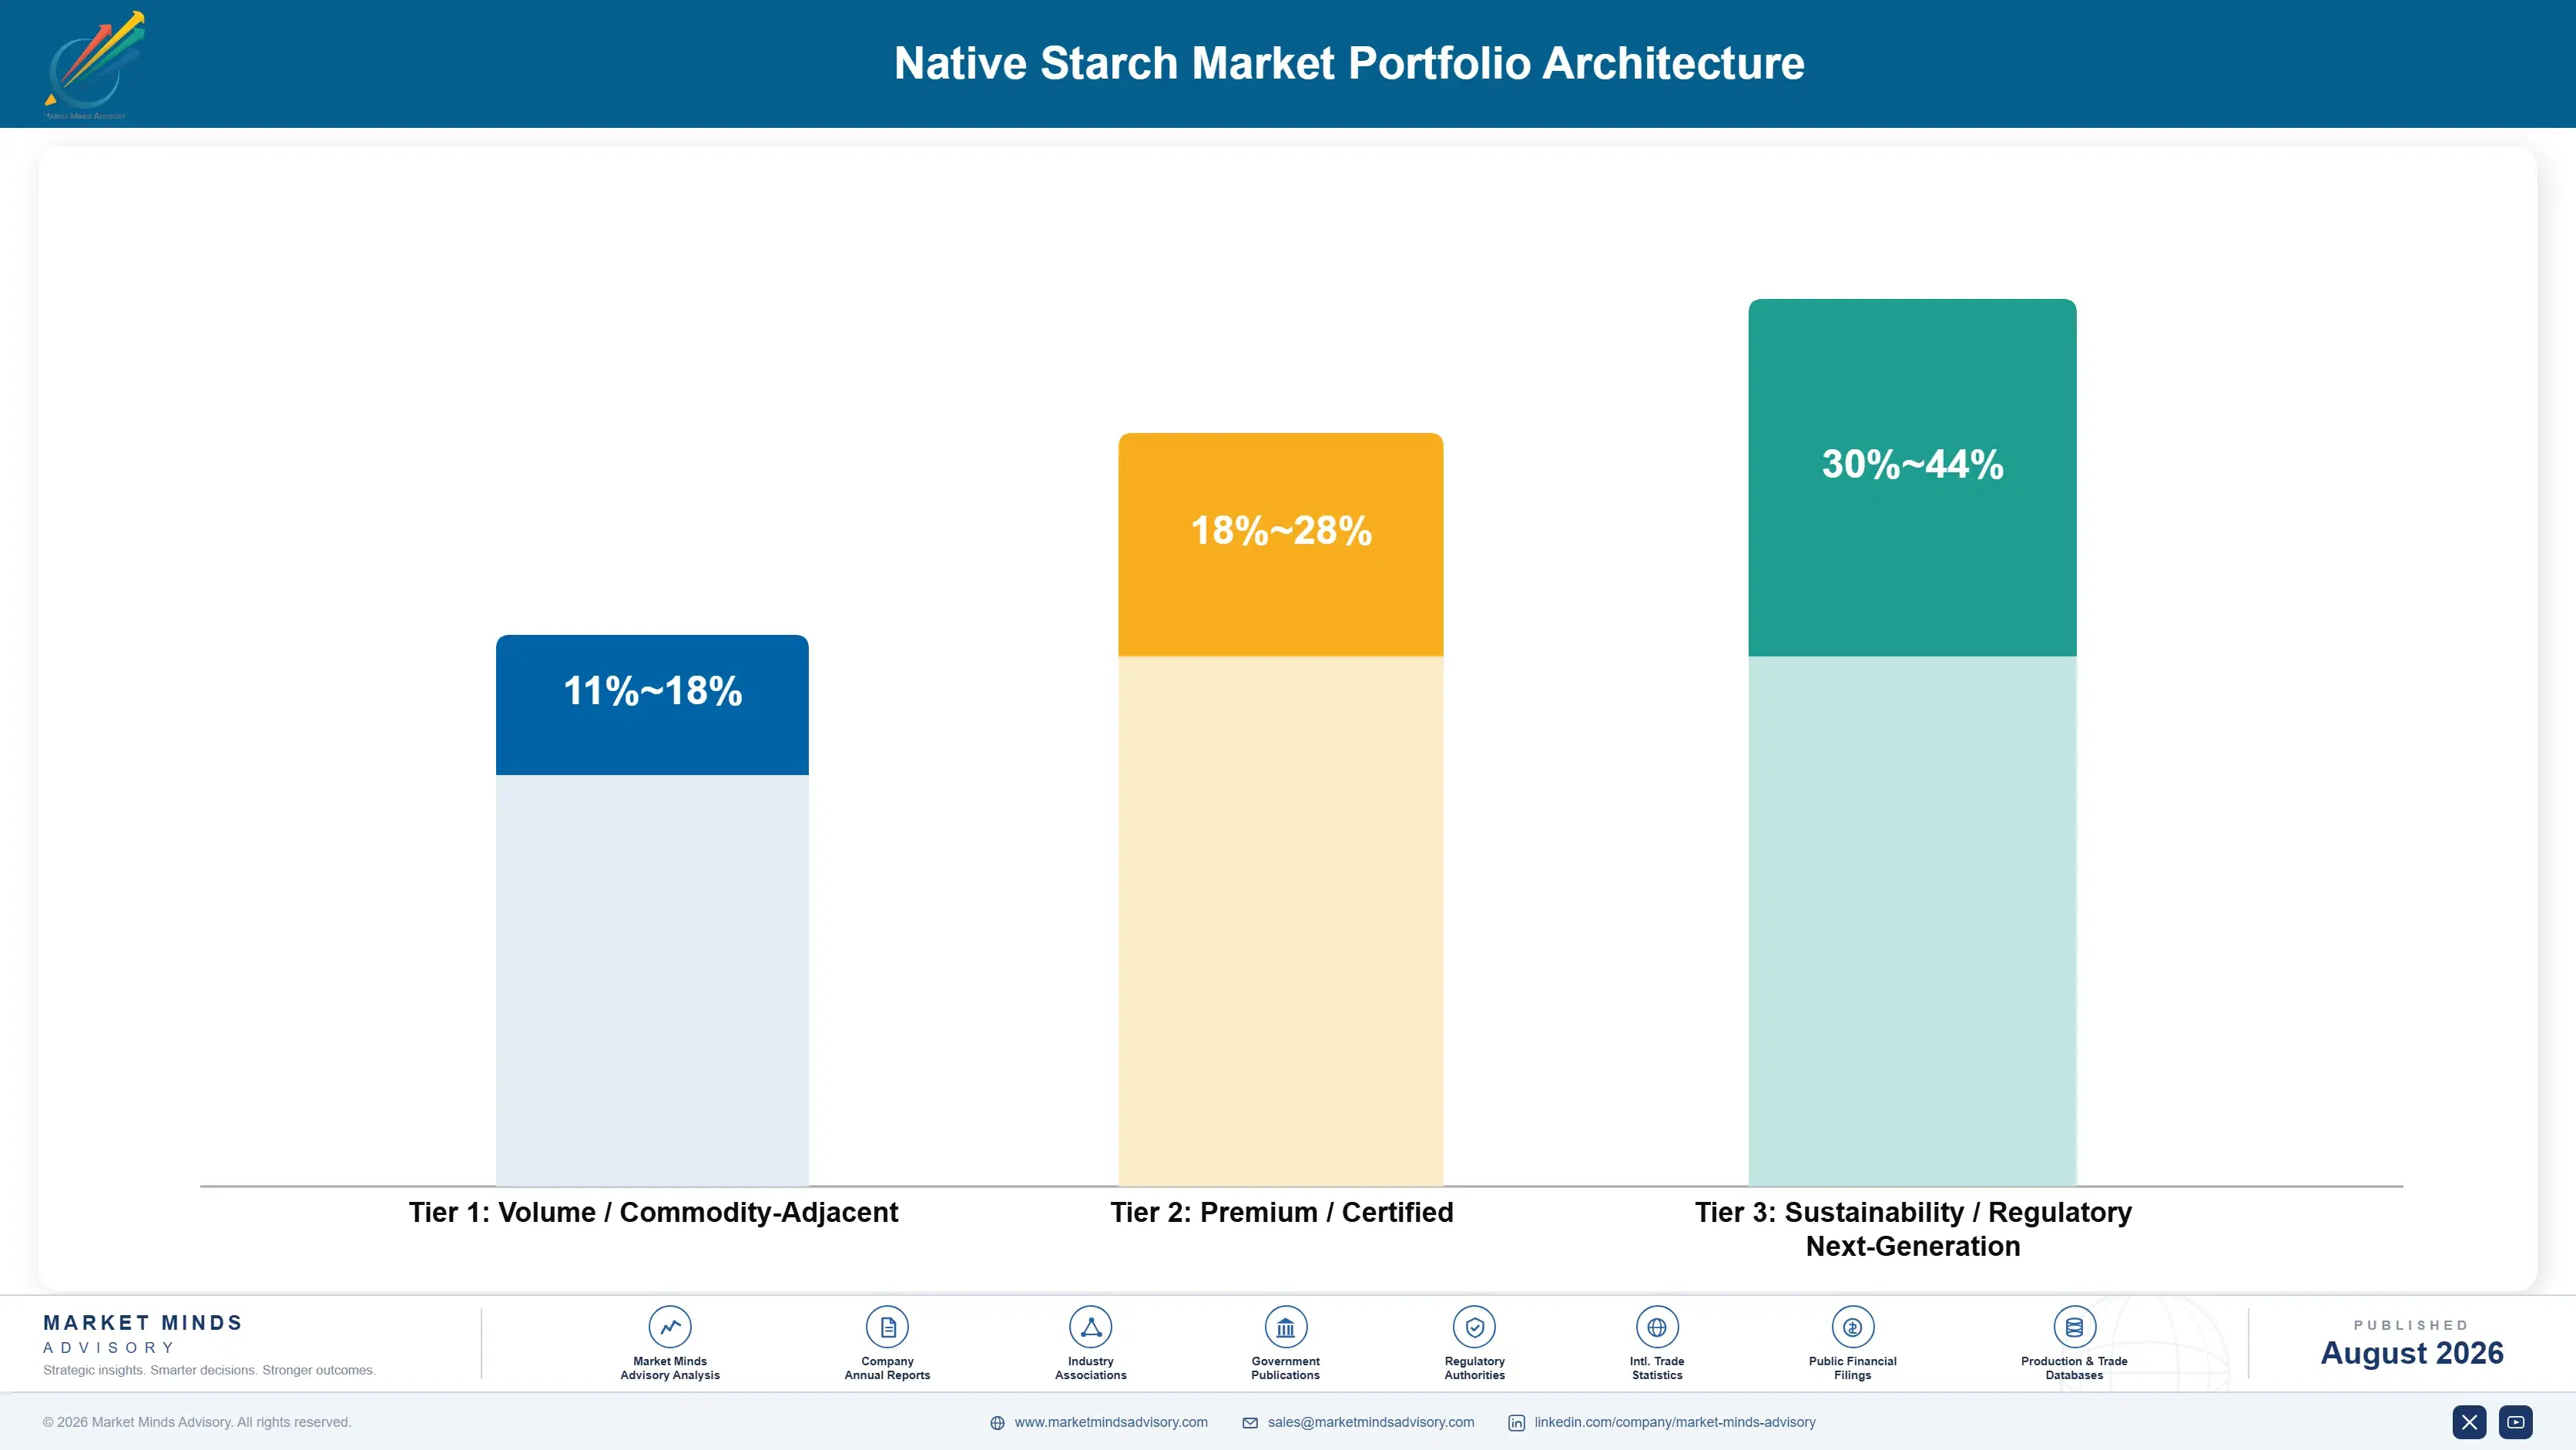
Portfolio Architecture for Margin Defence

Margin architecture tracks labelling position and formulation support rather than any property of the starch. Commodity corn starch sold into paper, textile and industrial adhesive use runs at gross margins in the low teens, competing on delivered cost against every wet milling plant in freight range. Clean label specialty grades earn three times that.
The volume-versus-premium tension is unavoidable because wet milling plants cannot be run partially. A mill processes a grain stream continuously, and the industrial and commodity outlets are what absorb the tonnage that food specialty applications cannot use. A processor refusing that work has nowhere to put the material and no way to load the plant. The commodity business is therefore a physical necessity rather than a commercial choice.

Value concentrates where a food brand needs help rather than a molecule. Clean label specialty grades supplied with formulation support sit at the top, because the brand is buying assistance with a functional compromise it has chosen to accept. Physically treated grades sit alongside on labelling status logic. Industrial and commodity starch sits at the other extreme, where a viscosity figure is the whole basis of comparison and pricing compresses toward grain cost plus milling.

Volume / Commodity-Adjacent

Commodity corn and wheat starch supplied into paper coating, corrugating adhesive, textile sizing and industrial use. Specifications are simple, every mill within freight range can supply, and delivered cost decides. This tonnage exists because a wet milling plant cannot run partially loaded.
Gross Margin: 11-18%

Premium / Certified

Food grade native starch supplied to mainstream processed food manufacture across sauces, bakery, dairy and prepared meals. Food safety certification, consistency and supply reliability support pricing above industrial grades. Range reflects the spread between contract manufacture and branded food customers.
Gross Margin: 18-28%

Sustainability / Regulatory / Next-Generation

Clean label and allergen-positioned specialty grades including tapioca, rice, pulse and physically treated starches, supplied with formulation support. Labelling status and applications assistance rather than functional performance justify the pricing achieved in this tier.
Gross Margin: 30-44%
native-starch-market-trends-forecast-portfolio-architecture-1787311672211

High-value Sub-segments and Strategic Watch-out

Clean Label Specialty Grades

High value on genuinely high growth, and the only pool where a food brand pays for assistance rather than for a molecule. Formulation support keeps competitors out more effectively than any processing capability does, and switching supplier means reopening a reformulation project the brand has already completed and signed off.
Gross Margin: 32-44%

Physically Treated Native Starch

Strong margins on genuinely rapid growth, closing the functional gap that limits clean label substitution while retaining native labelling status. The commercial risk is regulatory rather than competitive, since any reclassification of these physical processes would remove the labelling advantage that justifies the premium entirely.
Gross Margin: 30-40%

Commodity Industrial Starch

The physical necessity of every wet milling plant, absorbing tonnage that food applications cannot use and earning gross margins in the low teens. No commercial decision improves that position, because the product is entirely interchangeable within any given freight radius and every mill can make it.
Gross Margin: 11-18%

Tapioca Specialty Supply

The strategic watch-out sitting squarely in this portfolio. Growth and realised pricing are both excellent here, but cassava mosaic disease across the Southeast Asian growing areas has already tightened availability across individual seasons, and a genuinely severe outbreak would disrupt the fastest-growing botanical in this market entirely.
Gross Margin: 28-40%

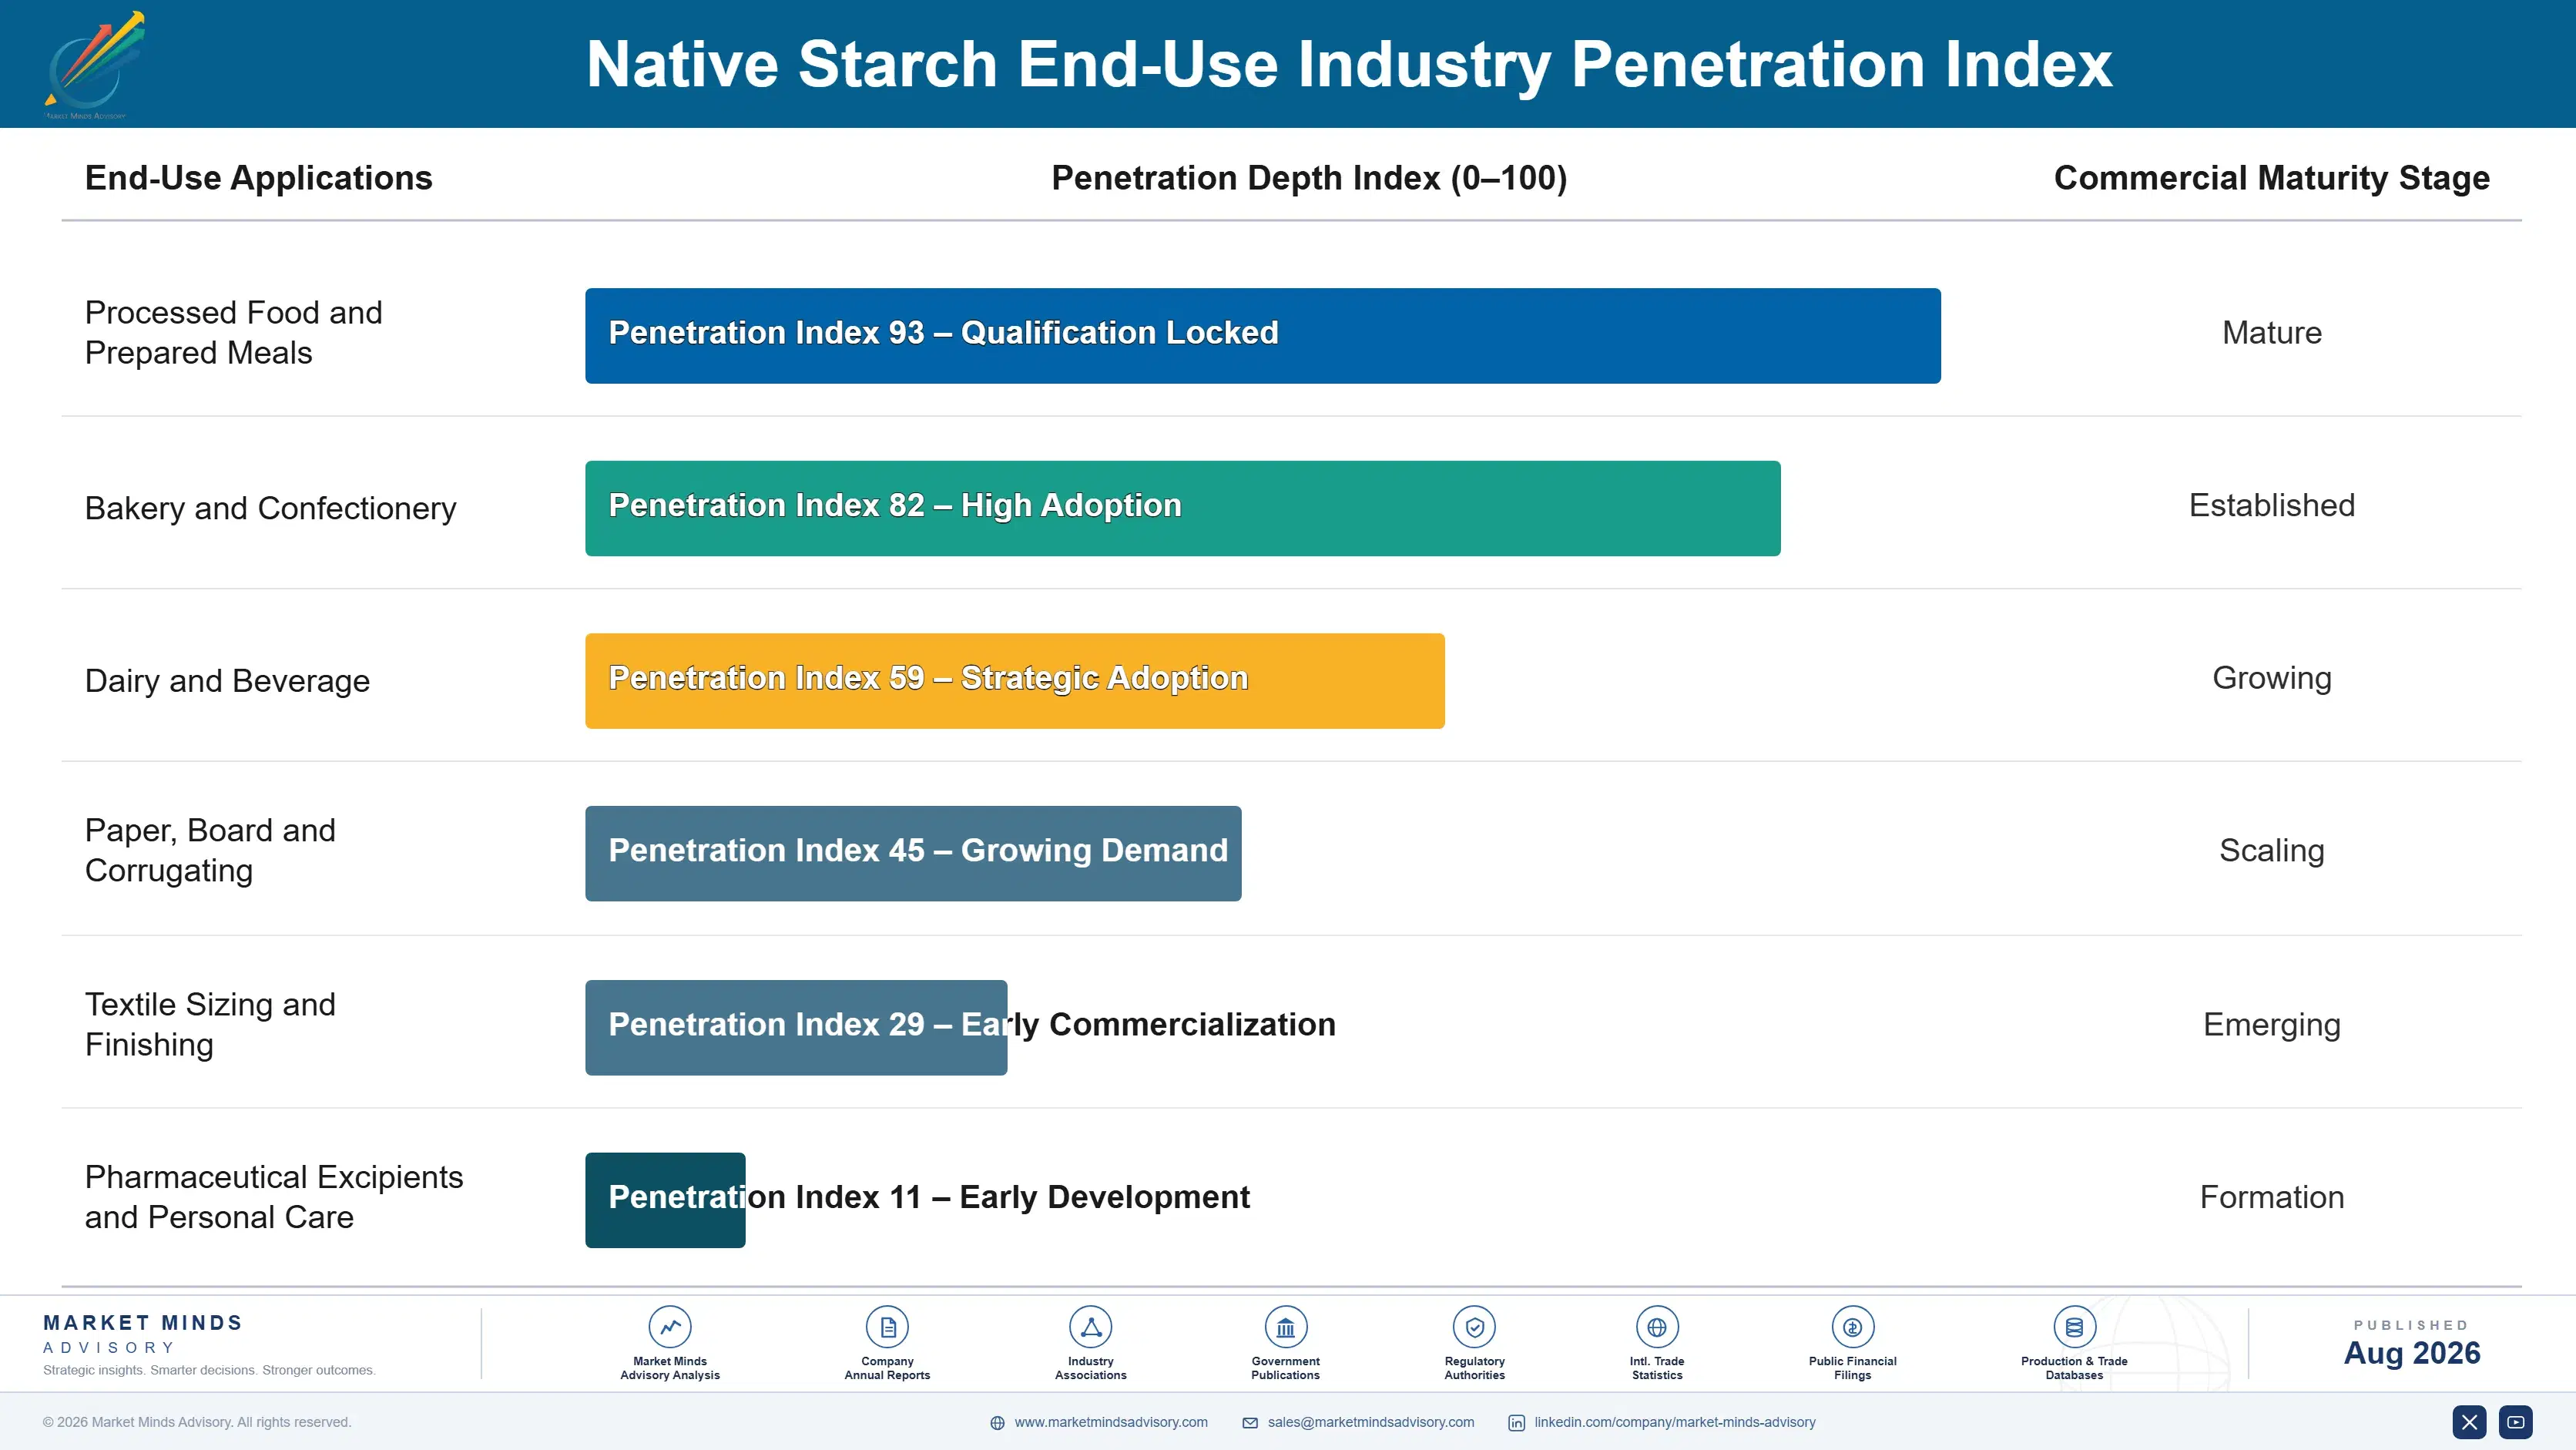
How This Demand Actually Repeats

Food ingredient demand behaves as an annuity attached to a formulation rather than to a purchasing relationship. Once a starch is designed into a recipe, it ships against every production run for years, because changing it means reopening a formulation, retesting shelf life and often revalidating the label declaration too.
Stickiness varies considerably by application. Clean label reformulated products are the tightest, since the brand has already absorbed a functional compromise tuned to a specific starch and nobody reopens that work voluntarily. Mainstream processed food is moderately sticky, with manufacturers holding approved suppliers but reviewing them annually. Industrial paper and textile use is barely sticky at all, with buyers switching on delivered price whenever grain arbitrage or freight shifts the arithmetic.

Buyer profiles have shifted noticeably. Purchasing once sat with food technologists comparing viscosity curves and price per tonne. It now frequently involves brand marketing, regulatory affairs and sustainability functions asking about label declaration, allergen status, genetic modification origin and crop provenance. Processors whose commercial approach still leads with technical data sheets find themselves talking to buyers for whom the functionality question was settled before the conversation started.
native-starch-market-trends-forecast-end-use-penetration-index-1787311672697

Where To Place Capital

These are among the four positions where our research anticipates prominent divergence between winners and laggards over the coming forecast period. Each is grounded in the demand model, the regulatory perimeter, and the announced capacity pipeline.
01 / CONTRACT INDEXATION DISCIPLINE

Indexation matters more than any operating improvement

Feedstock represents 62% of cost of goods and reprices with every harvest while food contracts run annually, which is where essentially all of the margin volatility in this industry actually originates. Processors on indexed terms passed most of the 2022 movement through within a single quarter, while those on fixed annual contracts lost a full year of margin outright. Large food buyers now accept indexation readily, having watched suppliers fail, and the work involved is contractual rather than operational in any respect.
02 / PHYSICAL TREATMENT INVESTMENT

Close the functional gap without losing the label

Heat-moisture treatment and annealing both improve heat and shear stability while retaining native labelling status, which addresses exactly the one limitation that currently caps clean label substitution everywhere. Physically treated grades realise roughly 30% above standard native starch and they grow considerably faster than the base market does. Equipment costs between $12 million and $25 million to install on an existing wet milling site, which is modest indeed against the pricing improvement it delivers across a large existing volume base.
03 / BOTANICAL PORTFOLIO BREADTH

Single-source processors cannot follow their customers

Allergen labelling, genetic modification status and clean label positioning all reallocate volume between botanicals without changing total starch demand in any way, so a corn-only processor simply loses business regardless of how well it actually performs commercially. Multi-botanical suppliers retain roughly 85% of their volume through reformulation cycles, against under 60% for single-source operators. Building that breadth means separate plants in separate crop catchments, which is expensive to build and precisely why so very few processors genuinely hold it today.
04 / CO-PRODUCT REALISATION FOCUS

The side streams often carry the plant

Wet milling produces gluten, germ, fibre, oil and protein alongside the starch, and those side streams frequently contribute considerably more plant margin than the starch itself ever does. Processors who optimise co-product realisation rather than starch yield alone report plant returns four to seven percentage points higher on exactly the same grain throughput. Co-product pricing also tends to move with grain, providing a partial natural hedge that starch-focused organisations routinely fail either to recognise or to exploit properly at all.

Engagement Snapshot From the Field

A live engagement with an industry participant carrying material or product regulatory and market exposure ahead of a defining policy shift, showing how our research translates into a defensible multi-year portfolio strategy.
MARKET MINDS ADVISORY · CLIENT ENGAGEMENT SUMMARY
Native Starch Producer Strategic Portfolio Review and Transition Roadmap 2026·Investment Scenario on Native Starch Exposure Evaluation 2025-26
CLIENT PROFILE
A European starch processor with annual revenue near $480 million (client-reported, unverified by MMA), operating wheat and potato wet milling across three sites and supplying food manufacturers, paper mills and industrial customers regionally. Roughly 78% of food volume was sold on annual fixed-price agreements, and the botanical portfolio held no tapioca, rice or pulse position of any kind.
STRATEGIC CHALLENGE
The 2022 harvest movement had destroyed a full year of margin under fixed annual contracts, and clean label reformulation was steadily moving customer volume toward tapioca and rice starches the company could not supply. The board needed to establish which problem to address first and whether entering new botanicals was realistic without acquiring plants in distant crop catchments.
MMA APPROACH
MMA quantified the margin effect of indexation across the existing contract book, sized the volume already lost to botanicals outside the portfolio, and assessed sourcing and toll processing routes into tapioca and rice against building capacity. Findings were tested against 47 expert interviews covering food manufacturer purchasing practice, indexation acceptance and Southeast Asian tapioca supply arrangements.
KEY FINDINGS
  1. Indexation across the existing contract book would have recovered an estimated 71% of the 2022 margin loss (client-reported, unverified by MMA), requiring no capital investment whatsoever.
  2. Roughly 9% of food volume had already moved to tapioca or rice starches the company could not supply, and the trend was continuing at a similar annual rate.
  3. Building tapioca capacity in Southeast Asia was uneconomic at the client's scale, while sourcing agreements with Thai processors offered the same customer retention benefit immediately.
  4. Physical treatment capability at approximately $16 million would address the functional objections raised in four of the six reformulation projects the company had recently lost.
CLIENT PROFILE
A European starch processor with annual revenue near $480 million (client-reported, unverified by MMA), operating wheat and potato wet milling across three sites and supplying food manufacturers, paper mills and industrial customers regionally. Roughly 78% of food volume was sold on annual fixed-price agreements, and the botanical portfolio held no tapioca, rice or pulse position of any kind.
STRATEGIC CHALLENGE
The 2022 harvest movement had destroyed a full year of margin under fixed annual contracts, and clean label reformulation was steadily moving customer volume toward tapioca and rice starches the company could not supply. The board needed to establish which problem to address first and whether entering new botanicals was realistic without acquiring plants in distant crop catchments.
MMA APPROACH
MMA quantified the margin effect of indexation across the existing contract book, sized the volume already lost to botanicals outside the portfolio, and assessed sourcing and toll processing routes into tapioca and rice against building capacity. Findings were tested against 47 expert interviews covering food manufacturer purchasing practice, indexation acceptance and Southeast Asian tapioca supply arrangements.
KEY FINDINGS
  1. Indexation across the existing contract book would have recovered an estimated 71% of the 2022 margin loss (client-reported, unverified by MMA), requiring no capital investment whatsoever.
  2. Roughly 9% of food volume had already moved to tapioca or rice starches the company could not supply, and the trend was continuing at a similar annual rate.
  3. Building tapioca capacity in Southeast Asia was uneconomic at the client's scale, while sourcing agreements with Thai processors offered the same customer retention benefit immediately.
  4. Physical treatment capability at approximately $16 million would address the functional objections raised in four of the six reformulation projects the company had recently lost.
RECOMMENDED STRATEGY
Phase 1: Phase one: move the food contract book onto grain benchmark indexation before any capital request, since it recovers most of the margin exposure at no investment cost. Phase 2: Phase two: secure tapioca and rice sourcing agreements with Southeast Asian processors rather than building capacity, retaining customers the portfolio gap was losing. Phase 3: Phase three: install physical treatment capability on the wheat line, targeting the reformulation projects that functional limitations had recently cost the company.
OUTCOME
The client moved 64% of food contract value onto indexed terms within eight months and concluded tapioca sourcing agreements the following quarter, reporting margin stability through a subsequent grain movement that competitors absorbed in full (client-reported, unverified by MMA). Physical treatment capital was approved, and two previously lost reformulation projects were recovered.

Frequently Asked Questions

Foundational context covering the market sizes, CAGR, scope, country, region and competition that inform every finding below. This section is provided to cover basics and most often pre-purchase conversations, answered from the MMA Primary Research Dataset.

What is the current size of the Native Starch Market?

The market was worth $42.0 billion in 2025 and is forecast to reach $43.93 billion in 2026. This covers unmodified starch across all botanical sources rather than derivatised products.

How large will the Native Starch Market be by 2036?

MMA forecasts $68.88 billion by 2036, an expansion multiple of 1.57 times the 2026 base. That represents $24.95 billion of incremental value across the forecast period.

What is the CAGR for the Native Starch Market 2026 to 2036?

The base case compound annual growth rate is 4.6%, with a bull case of 5.8% and a bear case of 3.4%. Historical growth from 2020 to 2025 ran at 3.7%.

Which segment is growing fastest?

Tapioca and cassava starch at 6.9%, a full 1.50 times the market rate. Neutral flavour, allergen-free status and non-genetically-modified origin answer three reformulation objections together.

Who are the major companies in the Native Starch Market?

Cargill, Ingredion, Archer Daniels Midland, Roquette and Tereos lead, holding 34% of revenue between them. Fifteen further processors hold meaningful botanical or regional positions across the market.

Which country is growing fastest?

India at 7.4%, pulled by packaged food penetration rising with urbanisation and organised retail expansion. The country also holds substantial maize and tapioca processing capacity domestically.

Report Segmentation Architecture

The full report scope spans multiple orthogonal segmentation dimensions, with cross-tabulated demand data provided for each dimension pair. Coverage extends further to regional breakdowns, trend trajectories, and the competitive detail needed to support segment-level decision-making.

By Botanical Source

  • Tapioca and Cassava Starch
  • Rice Starch
  • Pea and Pulse Starch
  • Potato Starch
  • Wheat Starch
  • Corn and Maize Starch

By End-Use Industry

  • Processed Food and Prepared Meals
  • Bakery and Confectionery
  • Dairy and Beverage
  • Paper, Board and Corrugating
  • Textile Sizing and Finishing
  • Pharmaceutical Excipients and Personal Care

By Commercial Dimension

  • Direct Supply to Branded Food Manufacturers
  • Contract Food Manufacturer Channel
  • Industrial and Paper Mill Supply
  • Distributor and Ingredient Trader Channel
  • Formulation Support and Reformulation Programmes

By Region

  • North America
  • Western Europe
  • East Asia
  • South Asia and Pacific
  • Latin America
  • Middle East and Africa
  • Eastern Europe

Scope, Methodology, and Coverage

Every figure in this report is reproducible from documented input assumptions. The scope below maps the historical period, the forecast horizon, the segmentation dimensions, and the countries covered, alongside the underlying primary and qualitative methodology.
Historical Period
2020 to 2025
Forecast Period
2026 to 2036
Base Year
2025 (USD billions; MMA Primary Research Dataset, August 2026)
Market Definition
This report covers native starch, meaning starch extracted from grain, tuber or pulse feedstock and dried without any chemical derivatisation, spanning corn, wheat, potato, tapioca, rice and pulse botanical sources. Coverage includes physically treated starches such as heat-moisture treated and annealed grades that retain native labelling status, together with the formulation support supplied alongside them. Chemically modified and derivatised starches, glucose and fructose syrups, maltodextrins, polyols, starch-based bioplastics, vital wheat gluten and other co-products, and fermentation products made from starch are excluded from scope.
Quantitative Units
USD billions at processor realised prices; volume in million tonnes; gross margin percentages and plant utilisation by tier.
Segmentation Dimensions
Botanical source, end-use industry, commercial dimension, region.
Regions Covered
North America, Western Europe, East Asia, South Asia and Pacific, Latin America, Middle East and Africa, Eastern Europe
Countries Covered
China, Japan, South Korea, India, Thailand, Vietnam, Indonesia, Australia, United States, Canada, Mexico, Germany, Netherlands, France, Denmark, Brazil, Argentina, Poland, Ukraine, South Africa.
Key Companies Profiled
Cargill, Ingredion, Archer Daniels Midland, Roquette, Tereos, Tate and Lyle, Agrana, Avebe, Thai Wah, Gujarat Ambuja Exports, and ten further processors.
Quantitative Methodology
Primary survey, n=3,800 respondents, Q4 2025, six countries; demand-side model with trade association cross-validation
Qualitative Methodology
47 expert interviews, Q4 2025; applied to validate demand model assumptions, identify emerging dynamics, and assess competitive positioning
Report Format
PDF and XLSX data workbook (Word format preview document)
Publisher
Market Minds Advisory
Report Code
MMA-2026-AGR-781
Published
August 2026
Contact
sales@marketmindsadvisory.com | www.marketmindsadvisory.com

Purchase the full Native Starch Market Report (2026 to 2036).

The full report sets out ten-year forecasts for native starch by botanical source, end-use industry and commercial model across seven regions. It quantifies clean label reformulation volume application by application and tracks how allergen labelling reallocates demand between botanicals. Competitive assessment covers twenty processors on a consistent revenue basis, mapping botanical breadth and physical treatment capability separately from milling capacity. Feedstock pass-through is modelled across contract structures, isolating the margin effect of indexation through historical harvest movements. Findings draw on a quantitative survey of 3,800 respondents across six countries and 47 expert interviews conducted during the fourth quarter of 2025.
Ten-year forecasts by botanical source and region
Clean label reformulation quantified application by application
Feedstock pass-through modelled across contract structures
Twenty-processor assessment on consistent revenue basis
Physical treatment capability mapped by named processor
Margin architecture across three commercial portfolio tiers

Built For The People Who Decide

From boardroom strategy to bench-side execution, this report is read cover-to-cover by leaders shaping the next decade of their industry, turning demand scenarios, market dynamics and valuation benchmarks into decisions.
CXOs/ Presidents/ VPs/ Managers
M&A and Corporate Development
Strategy Teams and R&D Heads
Procurement and Product Directors
Regulatory and Compliance Leaders
Investor Relations and Equity Analysts