Market Minds Advisory
Nata de Coco Market

Nata de Coco Market: Trends and Forecast 2026 to 2036

Global bubble tea expansion is pulling nata de coco into beverage inclusion formats beyond its traditional dessert applications, even as Philippine coconut supply constraints and fermentation capacity limits threaten to cap export growth for producers.

Lead Analyst

Lisa Gevelber

Published

September 2026

Make Smarter Decisions with Customized Research Insights

Request a free sample report and evaluate market opportunities, growth trends, and competitive dynamics relevant to your business needs.

2025 MARKET VALUE$0.7BMarket Size 2025
2036 FORECAST VALUE$1.4BBase Case , 2026 to 2036
CAGR 2026 TO 20366.5 %Bull 7.7% / Bear 5.3%
INCREMENTAL OPPORTUNITY$0.7BNet 10- year value creation
EXPANSION MULTIPLE1.88x2036 value over 2026 base
Strategic Levers
M&A Pipeline
Regional Outlook
Country Rankings
Competitive Intelligence
Segmental Deep-dive
Call-Us : 91 93563 13602

Executive Snapshot and Market Trajectory

Nata de coco demand is shifting from traditional canned fruit cocktail applications toward bubble tea and beverage inclusion formats as global bubble tea chains expand into new international markets, reshaping ingredient sourcing patterns and formal quality specifications across the food and beverage manufacturing supply chain worldwide today.
Commercial pressure now concentrates on production scale and export logistics, since bubble tea and yogurt manufacturers increasingly specify large-volume suppliers capable of consistent texture and cube-size uniformity over smaller artisanal fermentation operations. Bubble tea and beverage inclusions are the fastest-growing application, driven by chain expansion across new markets and rising per-capita consumption. South Asia and Pacific and East Asia together account for the largest share of global demand, reflecting concentrated production near coconut-growing regions.
Competitive intensity concentrates among a handful of large-scale Philippine and Indonesian producers holding established fermentation capacity and export certification, leaving smaller regional producers more fragmented across local retail markets and distribution channels nationwide. Coconut water feedstock availability adds further complexity, since fermentation capacity expansion requires consistent coconut supply that smallholder farming structures in producing countries cannot always guarantee reliably across every single harvest season.
Market Definition
The Nata de Coco Market covers fermented coconut water gel cubes and sheets used as an ingredient in beverages, desserts, dairy products, and confectionery applications. It excludes coconut water sold as a standalone beverage, coconut milk, and other coconut-derived food products not produced through bacterial cellulose fermentation.
Base Year Value
$0.7B in 2025 (MMA Primary Research Dataset, August 2026)
Forecast Period
2026 to 2036, eleven discrete annual values
CAGR
6.5% base case. Bull 7.7%. Bear 5.3%.
Fastest Growth Segment
Bubble Tea and Beverage Inclusions: 9.0% CAGR
Fastest Growth Country
Vietnam: 9.5% CAGR
Fastest Growth Region
South Asia and Pacific: 8.5% CAGR
Largest Region
South Asia and Pacific: 28% of 2025 global value
Market Leaders
Leading participants include Axelum Resources Corp, Peter Paul Philippine Corporation, PT Niramas Utama, Franklin Baker Philippines, and Century Pacific Food. Source: MMA Primary Research Dataset, July 2026.
Primary Survey
n=3,800 procurement and R&D decision-makers, Q4 2025, six countries
Methodology
Demand-side build-up, cross-validated against public data, 47 expert interviews

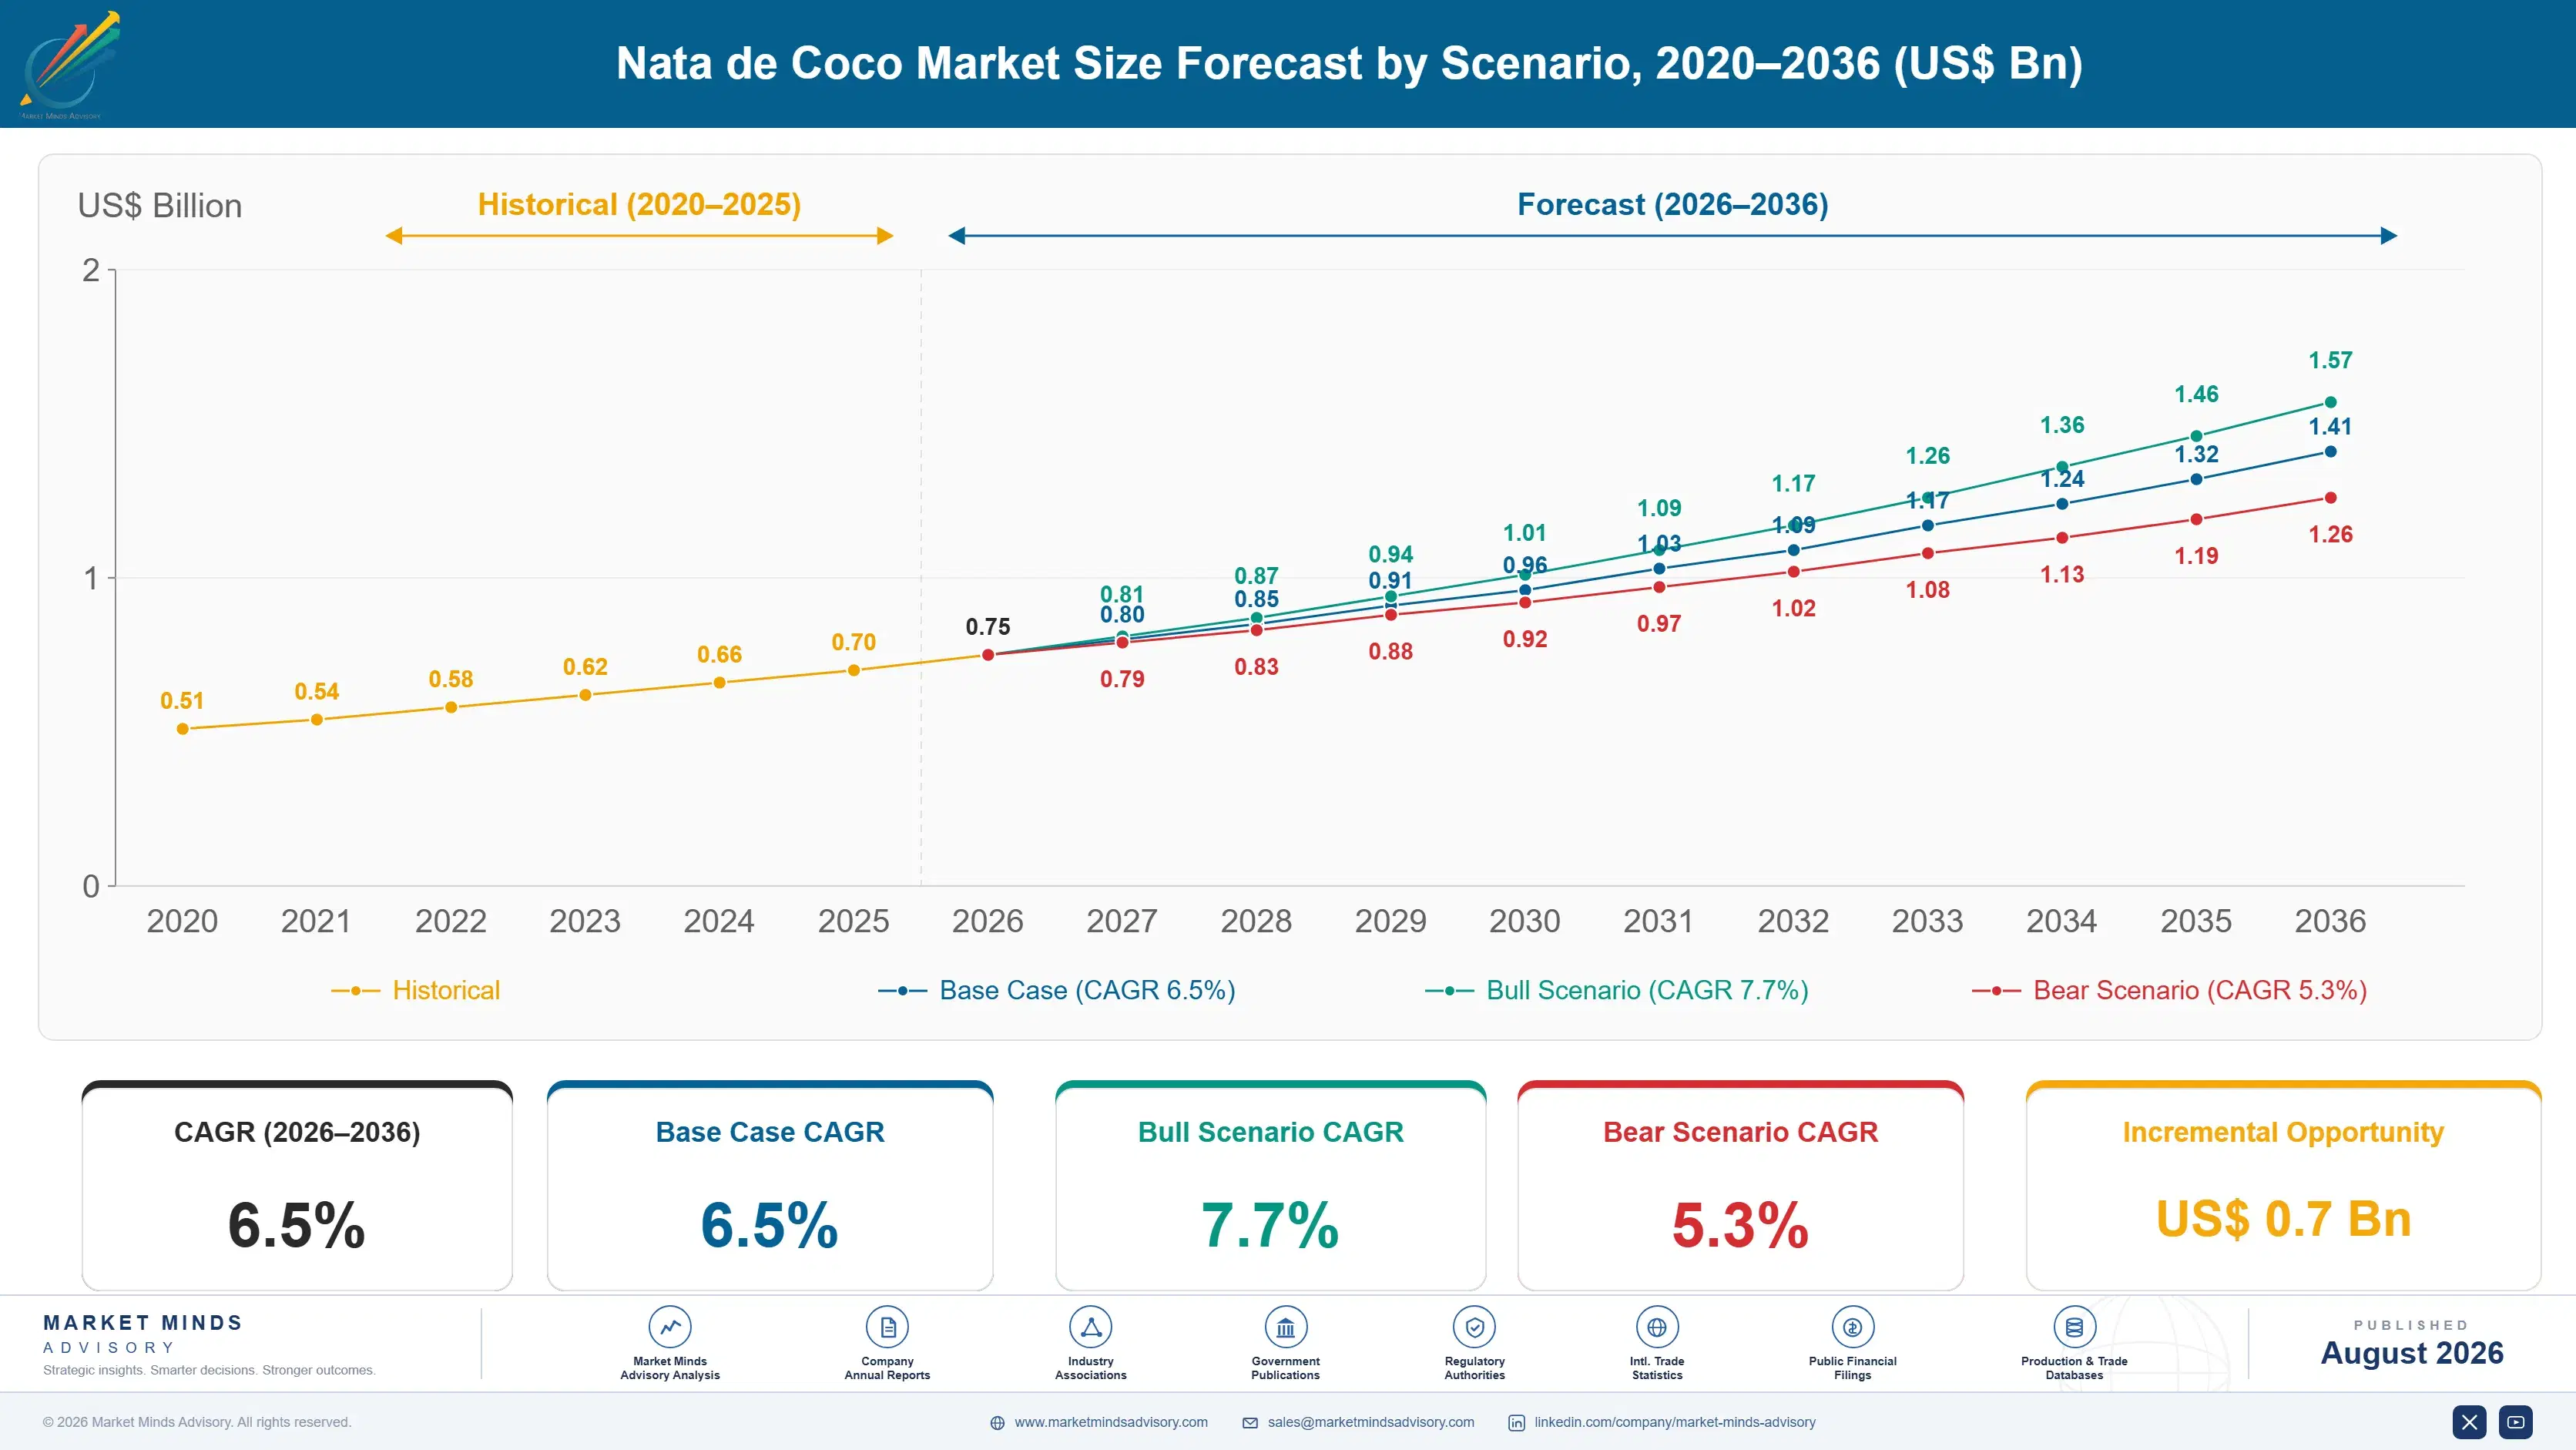
Nata de Coco Market Forecast Scenarios

nata-de-coco-market-trends-forecast-size-forecast-scenario-1787555032990
Between 2020 and 2025 the market grew at an estimated 5.6% annual pace, held back by pandemic-related food service closures and disrupted coconut water collection logistics in the Philippines during 2020 and 2021. Canned fruit cocktail applications dominated the period, since bubble tea chain expansion into new international markets remained limited by pandemic-related travel and retail restrictions across most regions.
The base case assumes 6.5% annual growth to 2036, driven by three mechanisms: bubble tea chain expansion into new international markets pulling nata de coco into beverage inclusion formats beyond traditional dessert applications, yogurt and dairy manufacturers adding textural inclusions to differentiate premium product lines, and rising middle-class consumption in coconut-producing Southeast Asian countries themselves. Canned fruit cocktail applications retain steady demand in established markets, but their share of total nata de coco consumption is declining as beverage inclusion formats expand faster.
The bull case centers on bubble tea chain international expansion accelerating faster than current store opening pipelines suggest, pushing growth toward 7.7%. The bear risk is coconut water feedstock supply constraints in the Philippines limiting fermentation capacity expansion, which would cap production growth below rising demand, holding growth closer to 5.3% through the forecast window.

Coconut Feedstock Availability Shapes Production Scale

The Nata de Coco Market sits downstream of coconut water availability, where fermentation capacity and cube-size consistency follow raw material collection logistics more than raw production volume alone. Bubble tea chains and yogurt manufacturers together represent the fastest-growing buyer categories, each imposing increasingly specific texture and consistency requirements as they scale procurement volumes globally.
MARKET CONCENTRATION28%Share held by five largest producers combined currently
AVERAGE SELLING PRICE$1.60 per kgTypical cost manufacturers pay per kilogram of product
TOP PRODUCING COUNTRY42%Current share of global output from the Philippines
CAPACITY UTILIZATION68%Average operating rate across large-scale fermentation facilities annually
FEEDSTOCK COST SHARE35%Portion of production cost from coconut water inputs
TRADE INTENSITY55%Share of global output moving across international borders
Standard canned fruit cocktail applications remain the largest volume category, prized for low unit cost and established retail distribution across mature consumer markets worldwide today. Bubble tea and premium yogurt inclusion formats carry a meaningful price premium, yet manufacturers in these categories are specifying uniform cube sizing and texture consistency fast enough that producers are investing in automated cutting and sorting equipment ahead of confirmed long-term volume commitments from major beverage chains.
Producer concentration remains low, with a handful of large-scale Philippine and Indonesian producers holding export certification and consistent supply capacity that smaller artisanal fermentation operations cannot easily replicate at comparable scale or quality. Capacity utilization runs tighter during peak coconut harvest seasons than during off-season periods, reflecting the seasonal nature of coconut water collection across the primary producing regions.
"People assume nata de coco is just a garnish, but bubble tea chains now write cube-size tolerance into supplier contracts the same way automakers specify machined parts."
Senior Analyst, Food Ingredients and Agricultural Products Practice · MMA Agriculture Practice · August 2026

Market Trends

Bubble Tea Chain Expansion Drives Beverage Inclusion Format Growth

International bubble tea chains are expanding rapidly into new markets across North America, Europe, and the Middle East, and each new store opening adds nata de coco to its beverage inclusion ingredient list alongside tapioca pearls and fruit jellies. Producers report beverage inclusion format orders growing meaningfully faster than orders tied to traditional canned fruit cocktail applications, since bubble tea's younger consumer base treats nata de coco as a novel texture ingredient rather than a legacy dessert component. The shift is concentrated among large-scale producers with automated cutting capable of meeting bubble tea chain specifications.
Market Impact: Bubble tea expansion adds 14% growth
Premium Yogurt Manufacturers Adopt Textural Inclusion Differentiation

Dairy manufacturers are increasingly adding nata de coco cubes to premium yogurt product lines to differentiate against plain yogurt competitors, capitalizing on consumer interest in textural variety and novel ingredient experiences within otherwise commoditized dairy categories across most retail channels. These inclusion formulations command a meaningful price premium over standard nata de coco given the smaller cube sizing and quality consistency required for dairy processing equipment compatibility. Adoption is concentrated among premium and organic yogurt brands targeting younger consumers, while mass-market yogurt manufacturers continue focusing on simpler flavor differentiation instead of textural inclusions.
Market Impact: Domestic consumption adds 6% annual growth

Market Opportunities and Growth Drivers

Global Bubble Tea Market Expansion Drives Ingredient Demand

Bubble tea consumption continues expanding rapidly across markets where it was previously a niche product, including North America, Europe, and the Middle East, and each new market entry requires nata de coco supply alongside other beverage inclusion ingredients to replicate the bubble tea product experience consumers expect. This directly increases demand for consistently sized, food-safety-certified nata de coco capable of meeting international food safety import requirements that domestic Southeast Asian consumption historically did not require. Producers unable to meet these export certification standards risk losing access to the fastest-growing international demand segment entirely.
Market Impact: Seasonal shortfalls cut off-season output 20%

Rising Middle-Class Consumption in Producing Countries Sustains Growth

Rising disposable income across Southeast Asian coconut-producing countries themselves is sustaining domestic nata de coco consumption growth even as export demand accelerates, since nata de coco remains a familiar and culturally established dessert and snack ingredient across the region and its diaspora communities abroad. This domestic demand growth gives producers a stable revenue base that reduces dependence on volatile export market conditions and bubble tea chain expansion timing. Producers serving both domestic and export markets benefit from this demand diversification, since domestic sales help smooth the seasonal production cycles tied to coconut harvest timing.
Market Impact: Smallholder structure adds 12% collection cost

Market Restraints and Challenges

Coconut Water Feedstock Seasonality Limits Production Consistency

Coconut water availability follows seasonal harvest patterns in the Philippines and Indonesia, creating production capacity constraints during off-season periods that limit producers' ability to meet consistent year-round supply commitments to bubble tea chains and yogurt manufacturers requiring steady delivery schedules. For producers serving international customers with strict delivery timeline requirements, this seasonality creates real commercial risk when off-season production shortfalls coincide with peak demand periods in export markets. Some producers are addressing this by building coconut water storage and preservation capacity to smooth seasonal supply variation, though this requires meaningful capital investment beyond fermentation equipment alone.
Market Impact: Beverage inclusion orders gain 8 points

Smallholder Farming Structure Constrains Feedstock Scale Expansion

Coconut production in the Philippines and Indonesia remains dominated by smallholder farms rather than large commercial plantations, creating fragmented feedstock collection logistics that limit how quickly producers can scale coconut water sourcing to match rising fermentation capacity demand across their expanding operations and processing facilities. This fragmentation increases collection and logistics costs compared to feedstock sourcing from consolidated plantation operations common in other agricultural commodity supply chains. Industry associations are exploring cooperative aggregation models to improve smallholder collection efficiency, though progress remains slow given the dispersed geography of coconut farming.
Market Impact: Yogurt inclusion orders grow 10% annually
3 additional market trends, 4 additional growth drivers, and 2 additional restraints and challenges are covered in the full report. Contact sales@marketmindsadvisory.com to access the complete intelligence.

Segment CAGR and Growth Architecture

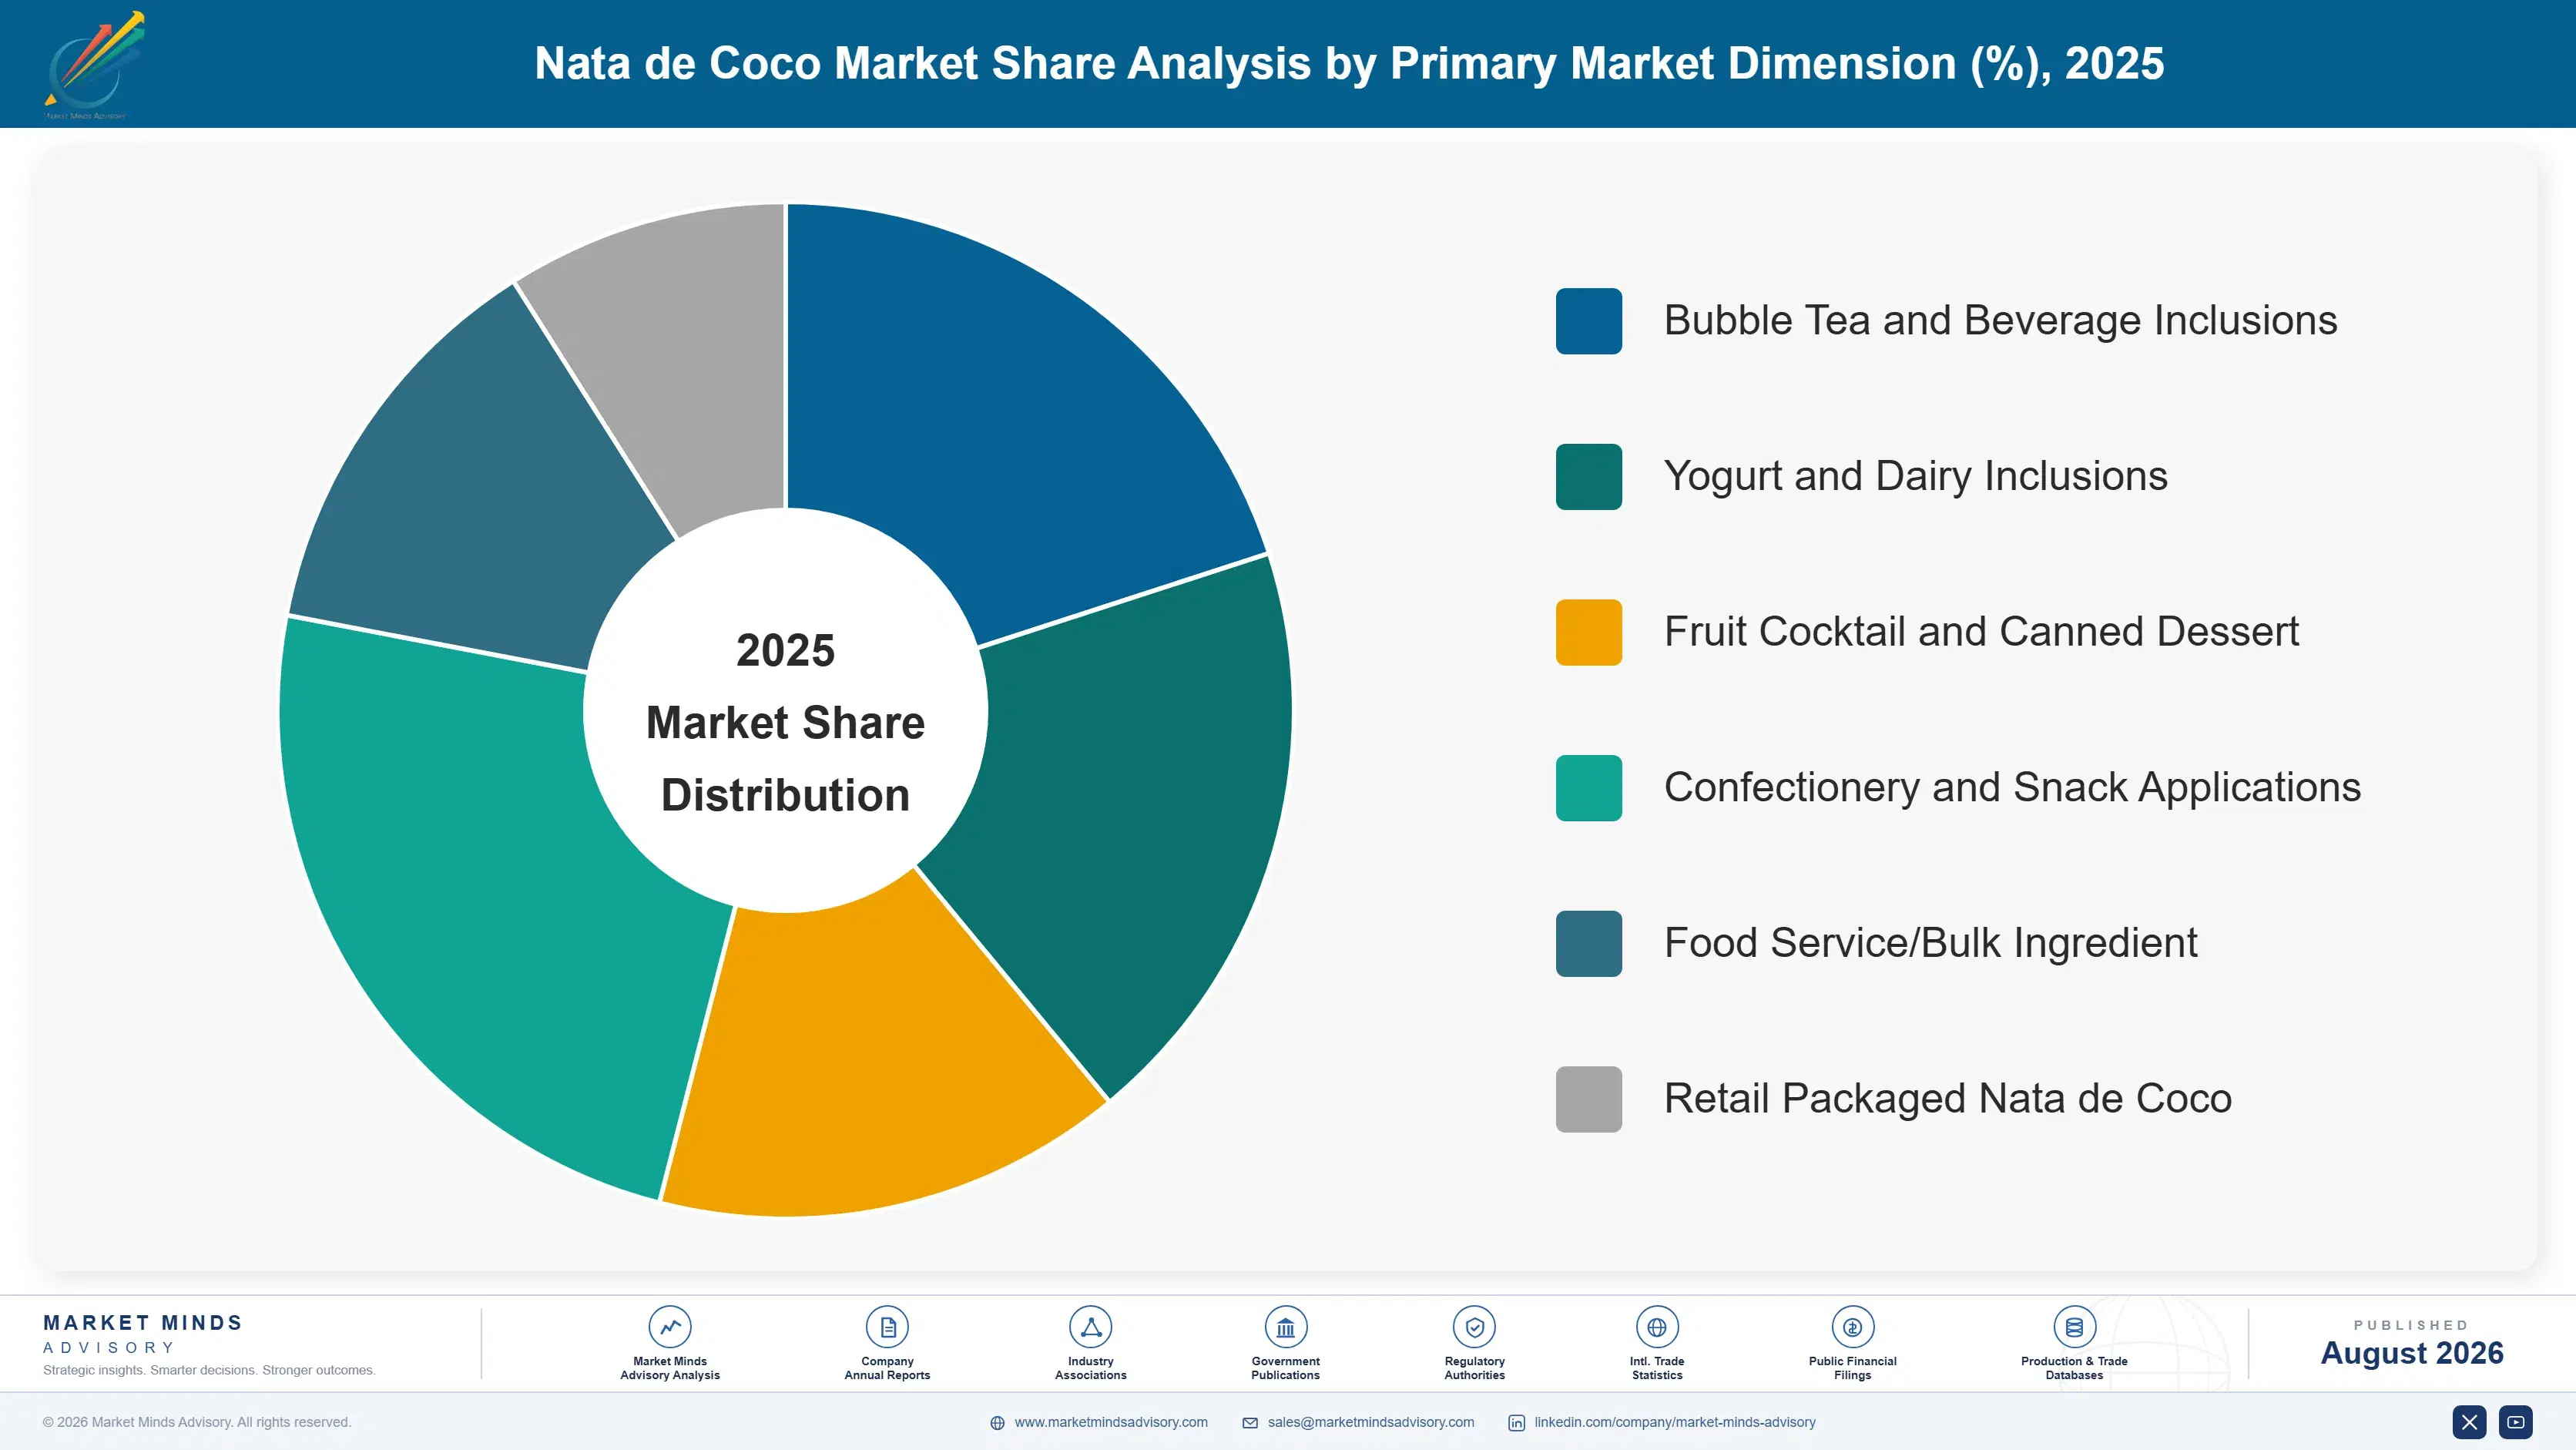
The market divides into six application-based segments spanning beverage, dairy, dessert, and confectionery uses across global consumer markets. Bubble tea and beverage inclusions and yogurt and dairy inclusions serve premium growth-oriented demand, while fruit cocktail, confectionery, food service, and retail packaged formats serve broader traditional consumer applications across established Southeast Asian and export markets worldwide today.
nata-de-coco-market-trends-forecast-market-share-analysis-1787555033520

Bubble Tea and Beverage Inclusions

Bubble tea and beverage inclusions are converting fastest as international bubble tea chains expand into new markets requiring nata de coco alongside tapioca pearls and fruit jellies as standard menu ingredients across their expanding store networks worldwide. This format demands smaller, uniformly sized cubes and consistent texture that traditional canned fruit cocktail production processes were not originally engineered to deliver at the scale beverage chains require. Producer investment in automated cutting and sizing equipment has accelerated well ahead of confirmed long-term volume commitments, reflecting expectations that bubble tea chain international expansion into North America, Europe, and the Middle East will pull demand significantly higher across the coming decade and beyond.
CAGR 9.0%

Yogurt and Dairy Inclusions

Yogurt and dairy inclusions are the second-fastest-growing segment, driven by premium and organic yogurt brands seeking textural differentiation against increasingly commoditized plain yogurt competitors targeting younger, experience-seeking consumers across major retail channels worldwide today and quite consistently. These inclusion formulations require smaller cube sizing and stricter quality consistency than beverage or dessert applications, given dairy processing equipment tolerances and the need to avoid texture inconsistency that could undermine consumer perception of product quality. Cost sensitivity limits dairy inclusion penetration into mass-market yogurt brands, but premium manufacturers are increasingly specifying nata de coco inclusions as a standard differentiation strategy across their expanding premium product portfolios and international markets and distribution channels.
CAGR 7.5%
Full segment breakdown across 6 segments available in the complete report.

Regional Architecture and Country Demand Map

Regional demand tracks coconut water feedstock availability and Southeast Asian production concentration rather than population or income levels alone. South Asia and Pacific dominates given the Philippines and Indonesia's outsized production and consumption base, while East Asia and North America sustain demand through bubble tea and beverage inclusion applications.

North America

United States bubble tea chain expansion, particularly across major metropolitan markets, drives the largest share of regional demand as international chains bring nata de coco to new store openings nationwide and across suburban markets increasingly and quite consistently. Canada's growing bubble tea sector, concentrated in major cities with large Asian immigrant populations, contributes secondary regional demand tied to similar chain expansion patterns and consumer preferences. Mexico's smaller but growing bubble tea and Asian food retail sector adds modest additional volume tied to urban consumer trends and demographic shifts nationwide. Import dependence on Philippine and Indonesian producers keeps regional pricing tied closely to Southeast Asian export costs and logistics timing considerations.
Share: 22% | CAGR: 6.0% (2026 to 2036)

Western Europe

The United Kingdom and Germany's expanding bubble tea chain presence anchors Western European demand, with major cities seeing rapid store count growth mirroring patterns already established in North America and Asia over recent years and continuing steadily forward today. France and the Netherlands contribute secondary demand tied to both bubble tea retail expansion and growing interest in Asian dessert and confectionery products among younger consumers and food enthusiasts nationwide. Import logistics from Southeast Asian producers create longer supply chains than in Asian markets, adding cost and lead-time considerations that regional distributors increasingly manage through consolidated shipping arrangements and warehousing. Premium yogurt inclusion adoption remains earlier-stage here than in North America.
Share: 18% | CAGR: 5.0% (2026 to 2036)
Regional intelligence for 5 additional markets available in the complete report: East Asia, South Asia and Pacific, Latin America, Middle East and Africa, Eastern Europe. Contact sales@marketmindsadvisory.com.
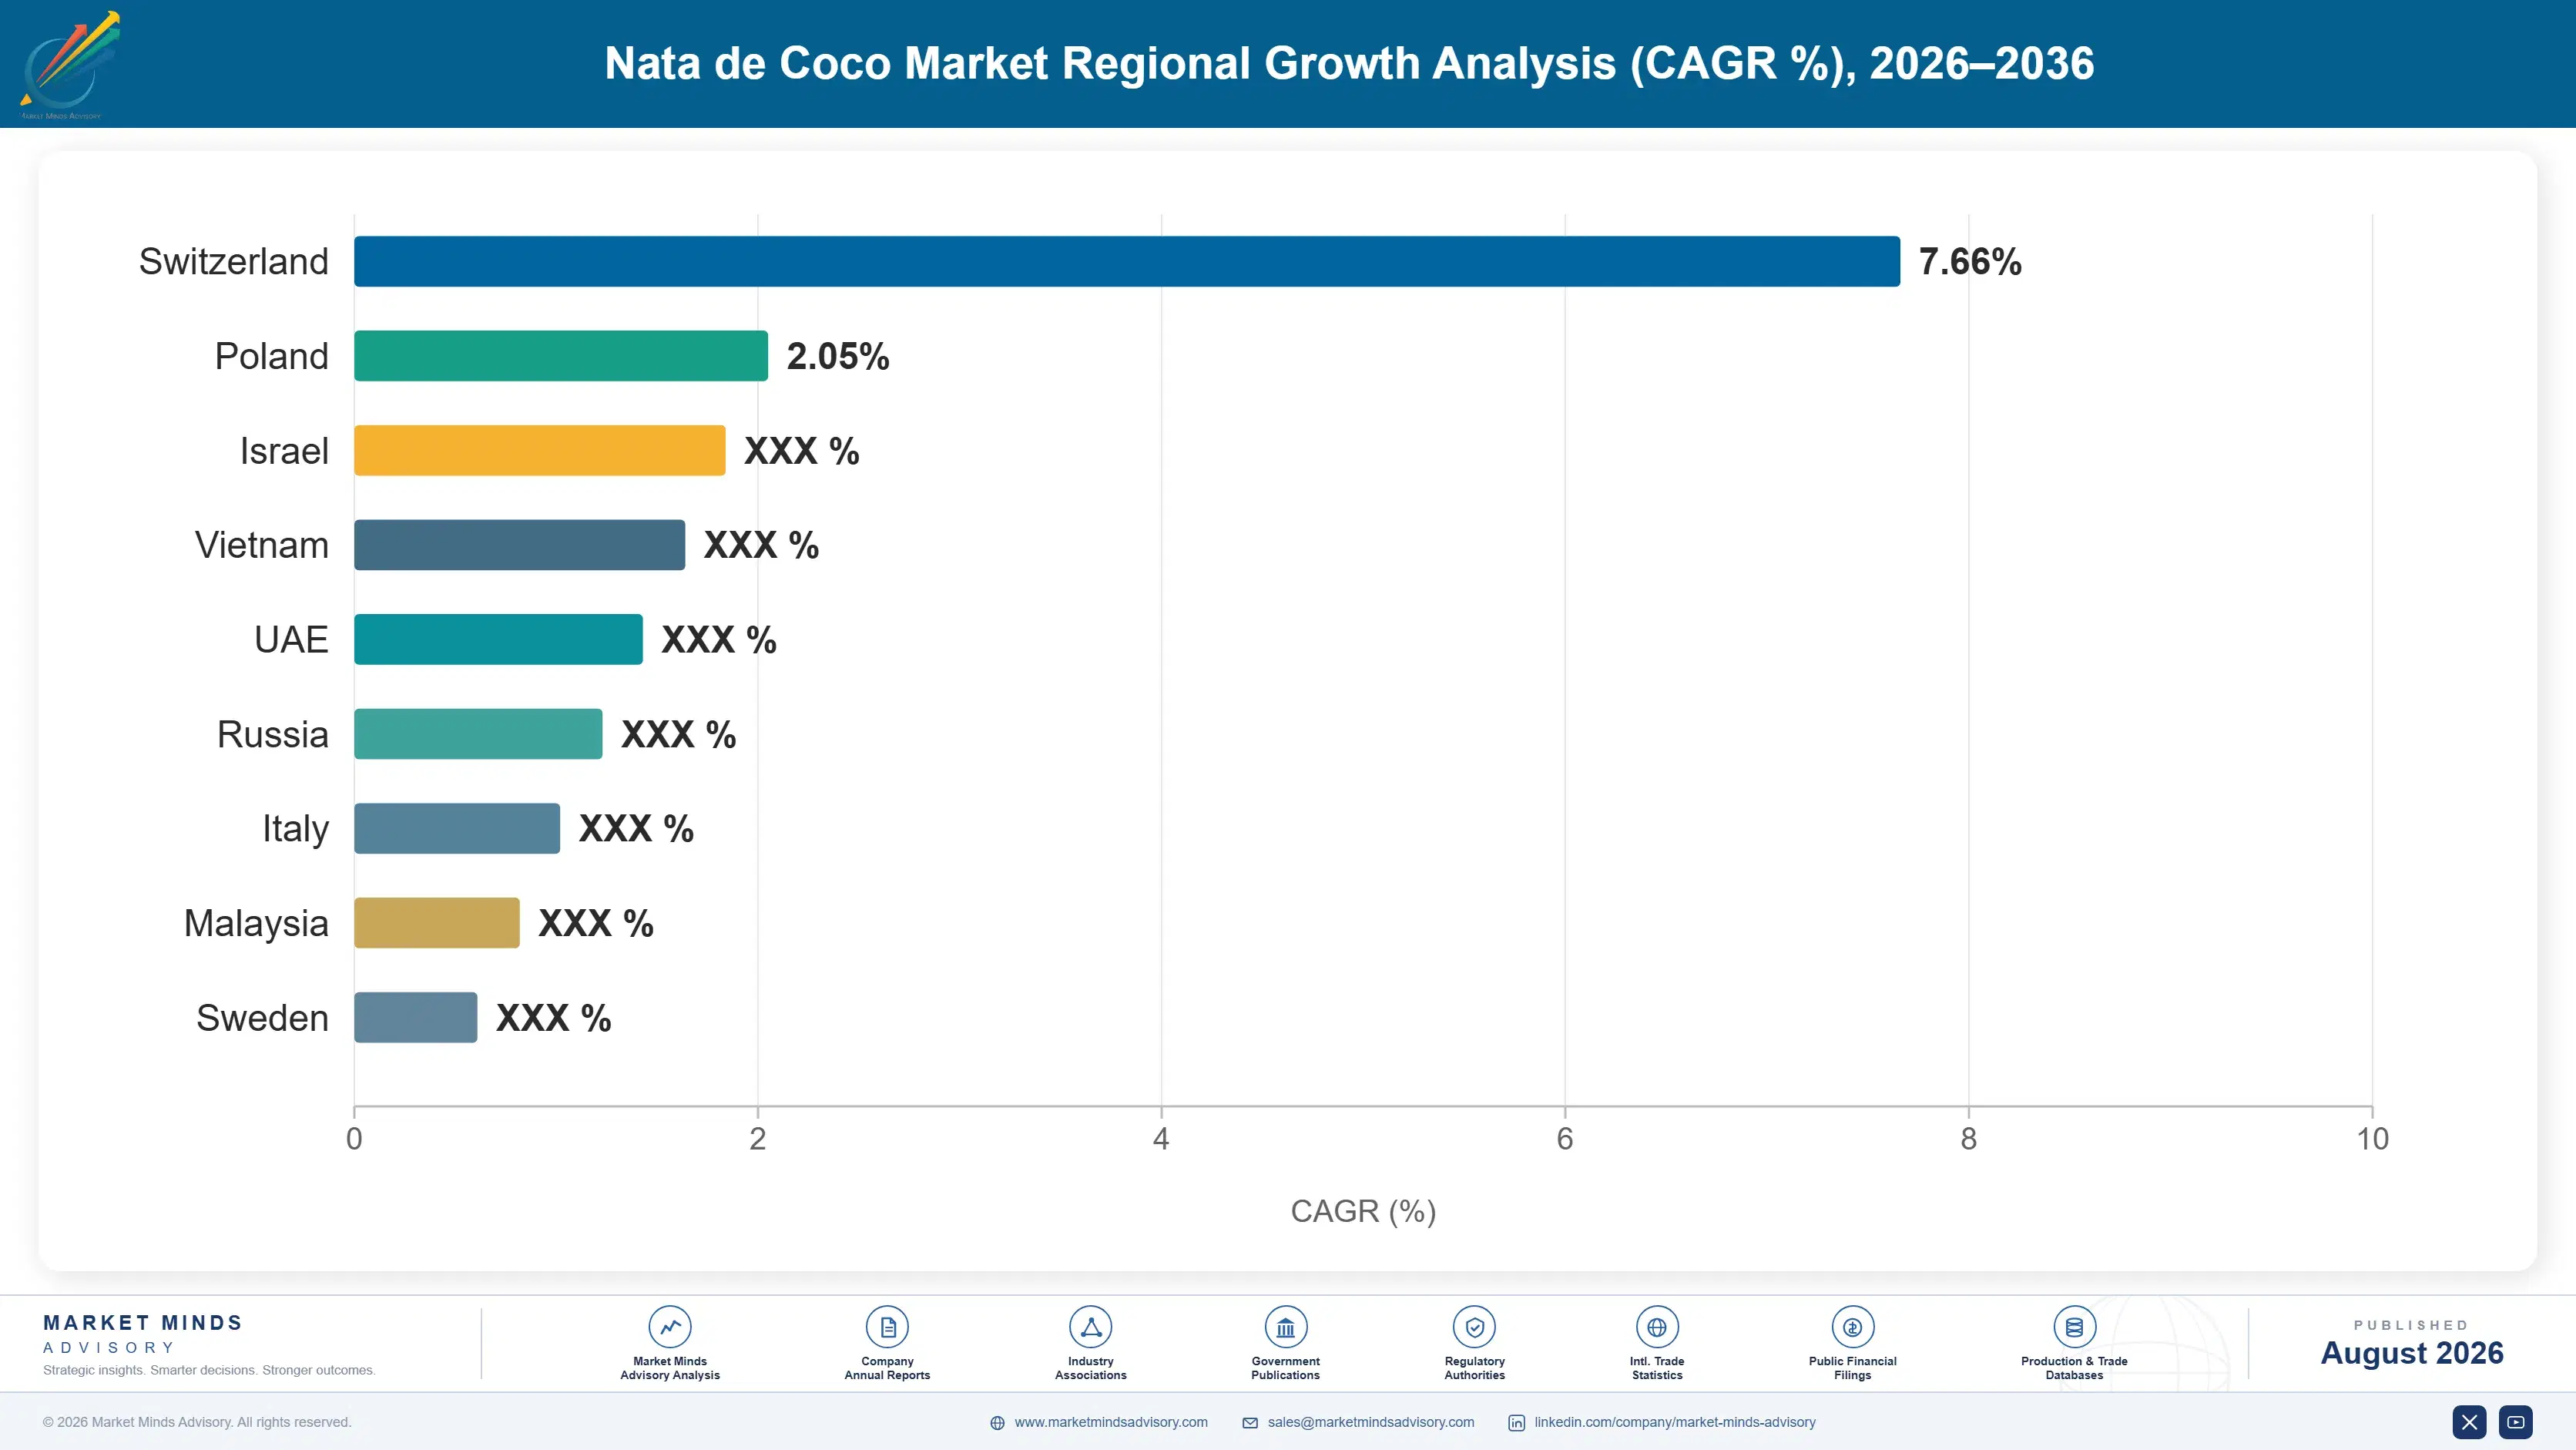
nata-de-coco-market-trends-forecast-country-cagr-analysis-1787555034042

Where Producers Can Capture Premium Margin

Producers face a widening gap between generic canned nata de coco pricing and the sizing precision, export certification, and supply consistency capabilities that bubble tea chains and premium yogurt manufacturers now demand. Four levers stand out for capturing margin above baseline fermentation economics: automated cube sizing, export certification, seasonal supply stabilization, and direct beverage chain contract structuring.

Automated Cube Sizing and Sorting Equipment

Producers investing in automated cube sizing and sorting equipment can charge a premium averaging 20 to 28% above generic hand-cut nata de coco, since bubble tea chains and yogurt manufacturers require uniform cube dimensions that manual cutting cannot reliably deliver at commercial scale. Building this capability requires meaningful capital investment in specialized cutting machinery, typically twelve to eighteen months to install and calibrate, but producers who achieve it capture disproportionate share of large beverage chain contracts. Producers lacking sizing precision increasingly compete only on price for less demanding traditional retail applications, ceding the highest-margin beverage chain business entirely.
Market Impact: Sizing precision adds 20 to 28% pricing power

Export Certification and Food Safety Compliance

Producers holding international food safety export certification can capture a premium averaging 15 to 22% above domestically focused producers, since bubble tea chains expanding into regulated markets in North America and Europe require documented compliance with import food safety standards their domestic Southeast Asian sales historically did not require. This capability requires sustained investment in quality management systems and testing infrastructure, but producers who build it gain access to the fastest-growing export markets largely inaccessible to uncertified competitors. Producers without export certification are effectively excluded from this expanding international segment.
Market Impact: Export certification adds 15 to 22% pricing power

Seasonal Supply Stabilization Through Storage Investment

Producers investing in coconut water storage and preservation capacity can smooth seasonal production variation and capture an estimated 10 to 15% premium for guaranteed year-round supply, since bubble tea chains and yogurt manufacturers increasingly require consistent delivery schedules that seasonal fermentation capacity alone cannot reliably provide across every calendar month. This bundled reliability model reduces customer risk of supply interruption during off-season periods, creating a genuine competitive advantage for producers who invest in storage infrastructure and preservation technology. Deepening this relationship also raises switching costs substantially for beverage chains dependent on continuous supply.
Market Impact: Storage investment adds 10 to 15% pricing power

Direct Beverage Chain Contract Structuring and Negotiation

Producers negotiating multi-year direct contracts with major bubble tea chains, bypassing distributors entirely, can improve gross margin by roughly 8 to 12 percentage points by eliminating distributor markup while offering chains price stability and firm supply continuity guarantees over the full multi-year contract term itself and quite consistently. These direct arrangements typically require minimum volume commitments spanning two to three years, favoring larger producers with the balance sheet capacity to guarantee uninterrupted supply that smaller regional competitors cannot credibly match given more limited production capacity, working capital, and financial reserves.
Market Impact: Direct contracts improve margin by 8 to 12 points

Who Controls the Margin Pool

Concentration remains low: the top five producers hold 28% combined share on a revenue basis, evaluated consistently across producers regardless of whether they compete primarily in traditional canned formats or premium beverage inclusion chemistry. Axelum Resources Corp leads on scale and export certification breadth, followed by Century Pacific Food, whose diversified food manufacturing base gives it distribution relationships that smaller specialized producers cannot easily replicate.
Competitive activity currently centers on automated cube sizing investment, as producers race to meet bubble tea chain specifications ahead of continued international store expansion. Several mid-tier producers have announced new export certification programmes, while others are pursuing coconut water storage capacity instead, betting that year-round supply reliability will prove more durable than sizing precision alone as a differentiator.

Emerging pressure comes from Vietnamese and Thai producers who have scaled coconut processing capacity rapidly and are now underpricing established Philippine competitors on generic retail applications. Rankings could shift meaningfully if major bubble tea chains standardize sourcing around a smaller set of approved suppliers, since that would commoditize a capability several mid-tier producers currently treat as differentiated, accelerating consolidation among producers lacking sufficient export scale.
nata-de-coco-market-trends-forecast-company-positioning-matrix-1787555034555

Competitive Moat and Risk Dimensions

AXELUM RESOURCES CORP

Moat: Broadest Export Certification Coverage

Axelum Resources Corp holds food safety export certification across more international markets than most competitors, letting it serve bubble tea chains expanding into newly regulated regions without the delays smaller producers face qualifying for each new market. This certification breadth also gives Axelum a first-mover advantage in emerging bubble tea markets that competitors take over a year to match.
AXELUM RESOURCES CORP

Risk: Concentrated Philippine Production Footprint

Axelum's production remains concentrated in the Philippines, exposing it to weather disruption and coconut harvest seasonality risks that geographically diversified competitors sourcing from multiple countries can better absorb. A severe typhoon season or coconut disease outbreak could disrupt Axelum's supply more significantly than competitors with production facilities spread across Indonesia, Vietnam, and Thailand as well as the Philippines.
CENTURY PACIFIC FOOD

Moat: Diversified Food Manufacturing Distribution Network

Century Pacific Food's broader food manufacturing business, spanning canned goods and dairy alongside nata de coco, gives it established retail and food service distribution relationships that dedicated producers must build separately through focused sales efforts. This integration lets Century Pacific cross-sell nata de coco into existing relationships, a distribution advantage competitors selling only nata de coco cannot easily replicate.
CENTURY PACIFIC FOOD

Risk: Diluted Focus Relative to Specialists

Century Pacific's diversification across many food categories means nata de coco receives a smaller share of corporate investment and management attention than at dedicated specialists like Axelum focused entirely on coconut fermentation products. This could allow specialized competitors to out-innovate Century Pacific on cube sizing precision and export certification if resource allocation continues favoring the company's larger canned goods business.

Players Tracked

Prominent Players

Axelum Resources Corp
Peter Paul Philippine Corporation
PT Niramas Utama
Franklin Baker Philippines
Century Pacific Food

Other Key Players

Kara Group
PT Sekar Bumi
Profood International Corporation
Universal Robina Corporation
Del Monte Philippines
NutriAsia
Monde Nissin Corporation
PT Indofood Sukses Makmur
Zest-O Corporation
Thai Coconut Public Company Limited
Theppadungporn Coconut Co
San Miguel Pure Foods
Wilmar International
Musim Mas
Sime Darby Plantation

Recent Developments

MARCH 2025

Axelum Resources Corp commissioned an expanded automated cube sizing facility in the Philippines, adding dedicated capacity for uniform beverage inclusion formats meeting international bubble tea chain specifications. The expansion responds to rising qualification requests from chains expanding into North American and European markets requiring consistent cube dimensions.
Signal: Signals accelerating producer investment in sizing precision well ahead of confirmed international chain expansion volume growth.
AUGUST 2025

Century Pacific Food signed a multi-year supply agreement with a major international bubble tea chain to provide beverage inclusion nata de coco across its rapidly expanding North American store network, securing volume commitments that support continued sizing equipment investment through the chain's ongoing expansion pipeline.
Signal: Confirms bubble tea chains locking in supply well ahead of continued international store expansion timelines nationwide.
NOVEMBER 2025

PT Niramas Utama expanded its coconut water storage and preservation capacity in Indonesia to reduce seasonal production variation, addressing customer concerns about year-round supply consistency for premium yogurt inclusion applications requiring steady, predictable delivery schedules across multiple production facilities and broader regional distribution centers nationwide.
Signal: Shows producers investing in seasonal supply stabilization to meet dairy manufacturer reliability requirements much more consistently.

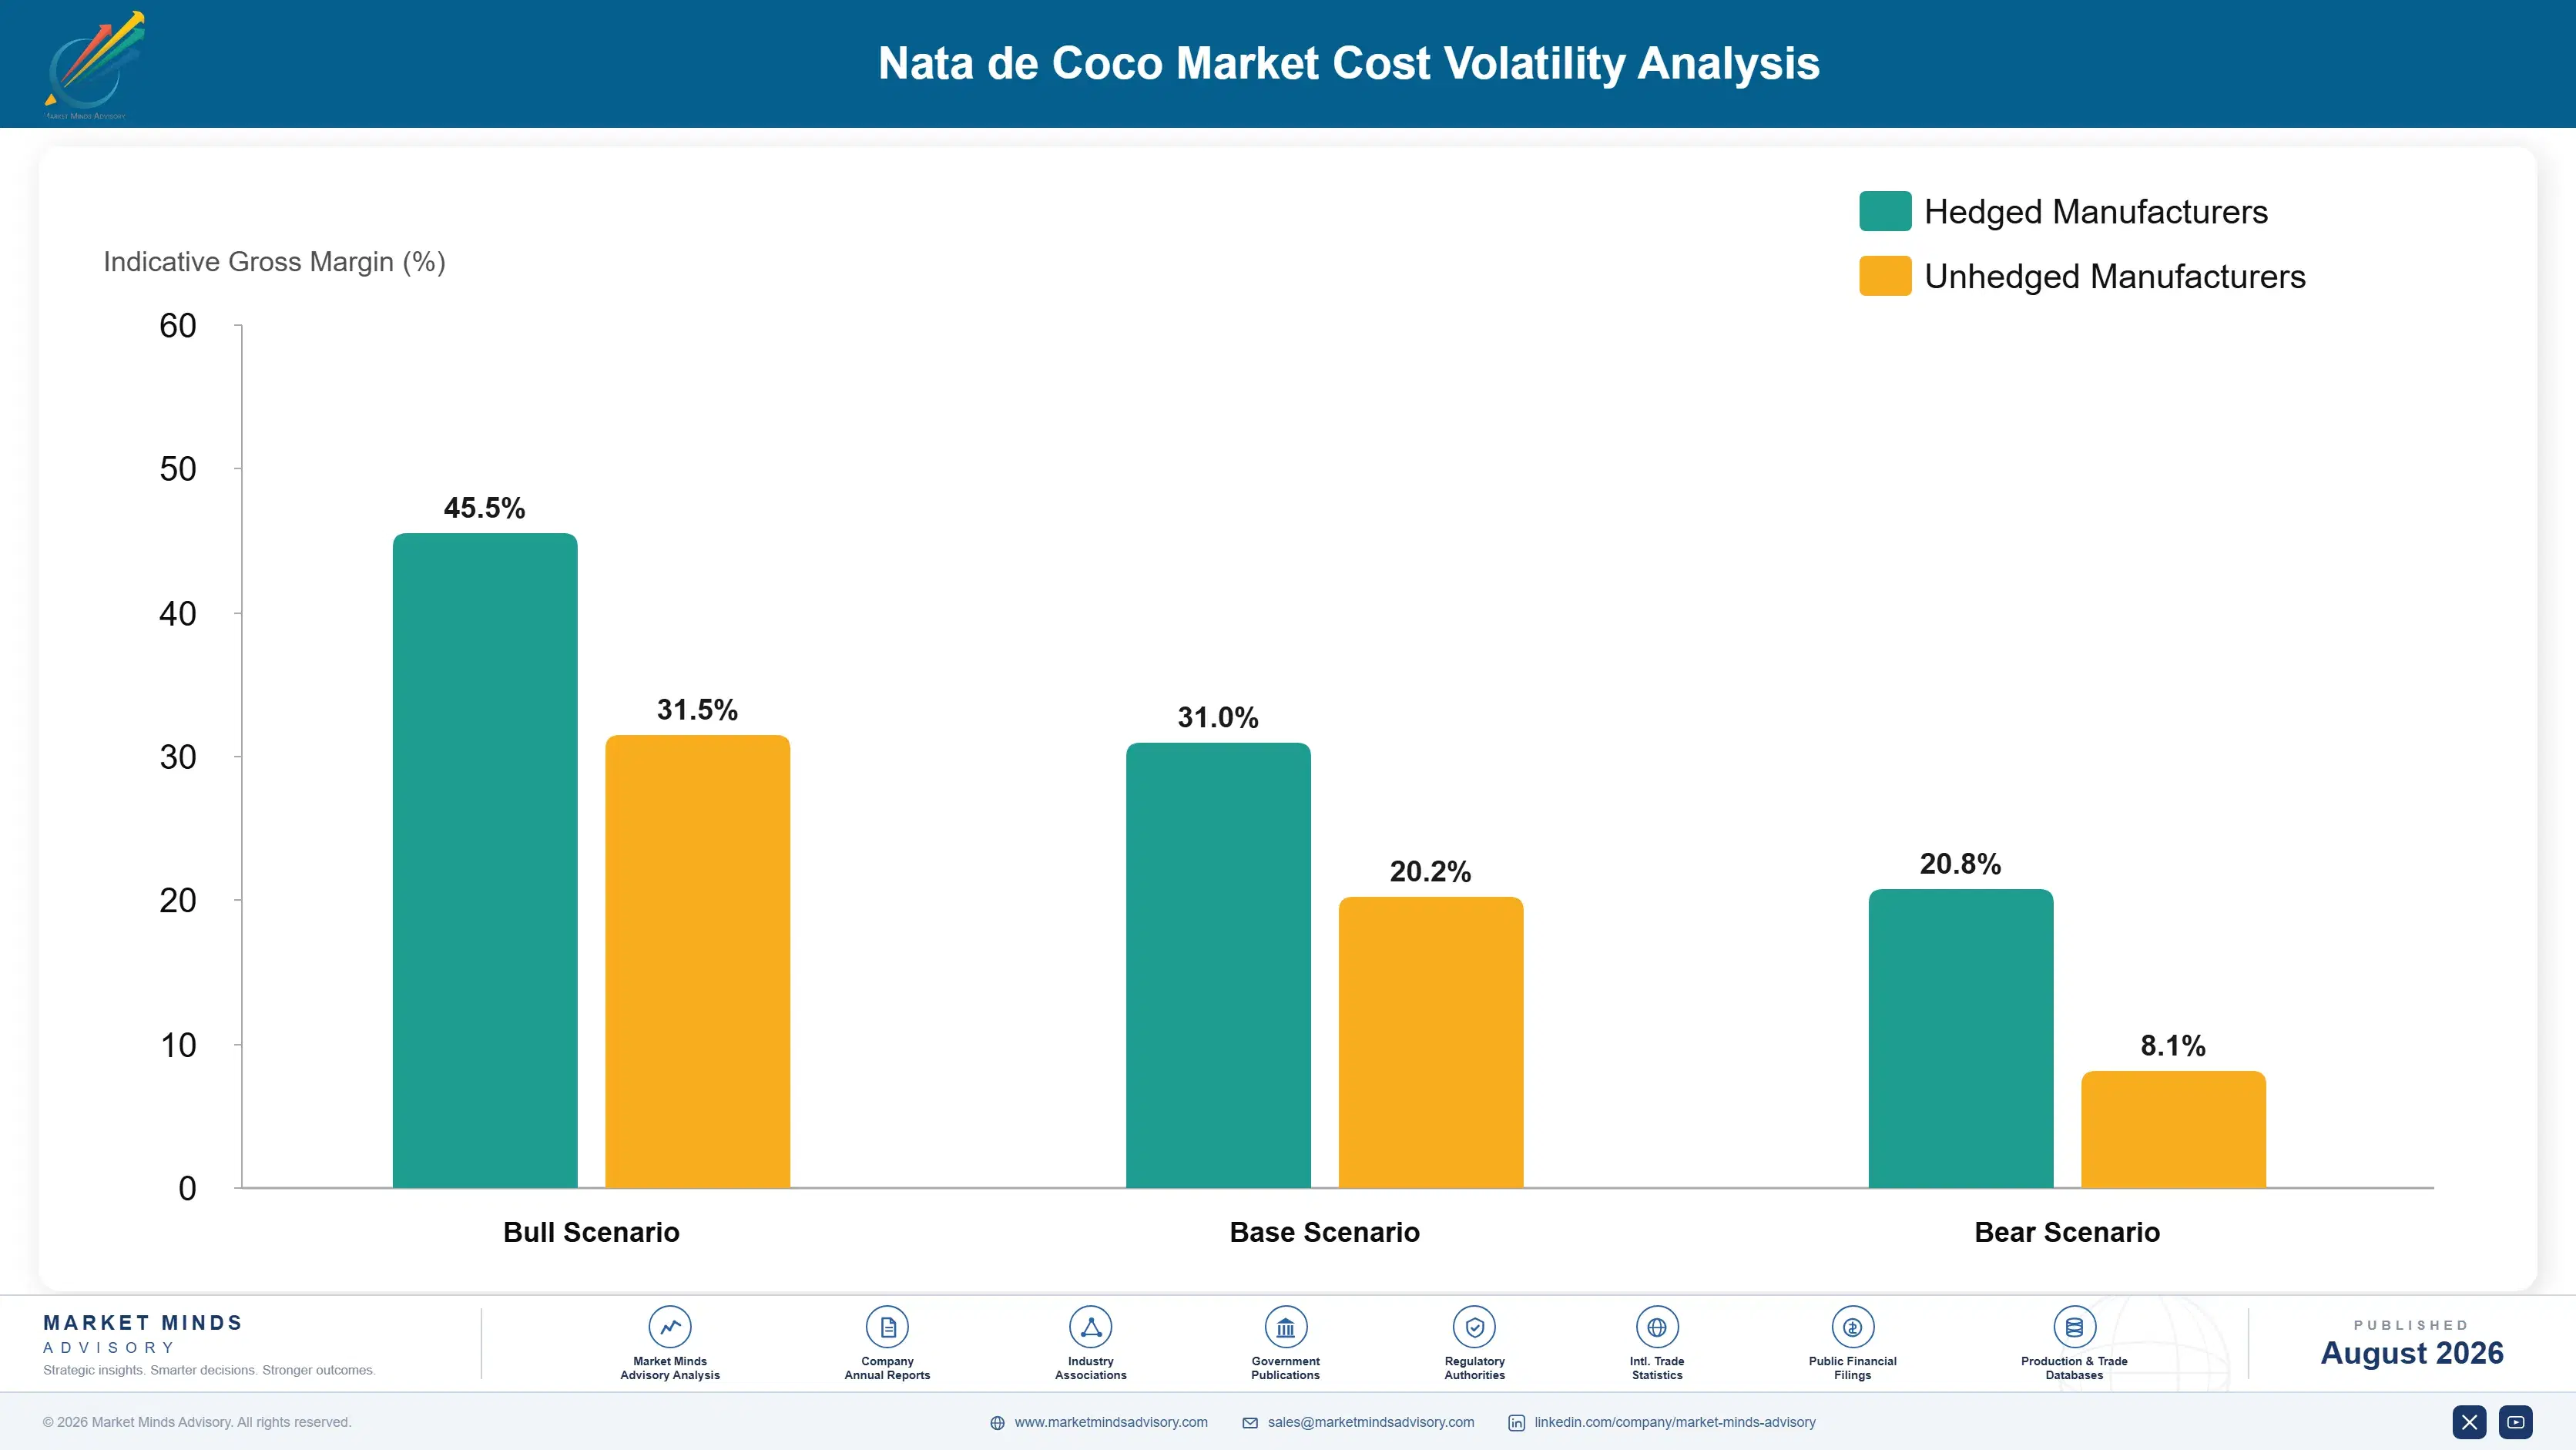
Coconut Water Feedstock Cost Exposure

Coconut water accounts for roughly 35% of production cost across nata de coco formulations, sourced primarily from smallholder coconut farms in the Philippines and Indonesia through collection networks that aggregate output from thousands of individual growers. Sugar and starter culture inputs carry a smaller cost share but add meaningful processing complexity given fermentation consistency requirements.
Coconut water collection costs spiked notably during 2022 as fuel price increases raised transportation costs for aggregating feedstock from dispersed smallholder farms across the Philippine archipelago, a volatility event documented in Philippine Statistics Authority agricultural reports. Producers without established collection networks absorbed cost increases directly, while those holding long-term farmer relationships passed through smaller increases to customers, illustrating how supply chain structure shapes margin resilience during feedstock cost shocks across the fermentation industry.

Smaller regional producers lacking scale to build efficient coconut water collection networks face a real competitive disadvantage against integrated players like Axelum, who maintain established farmer relationships across multiple provinces. This exposure varies by geography too: Indonesian producers face different collection logistics challenges than Philippine competitors given the archipelago's dispersed island geography and varying transportation infrastructure quality.
nata-de-coco-market-trends-forecast-cost-volatility-analysis-1787555034752

Long-Term Farmer Collection Agreements With Fixed Pricing

Producers increasingly negotiate multi-year collection agreements with smallholder farmer cooperatives that include fixed collection fees, reducing exposure to fuel price volatility that would otherwise increase aggregation costs unpredictably across every harvest cycle. This reduces earnings volatility for producers lacking the balance sheet to absorb sudden cost increases without passing them through to customers immediately.

Diversifying Coconut Water Sourcing Across Regions

Several producers are expanding collection networks into additional provinces and secondary producing countries including Vietnam, reducing dependence on any single region facing weather disruption or transportation cost spikes tied to fuel price volatility. This diversification lowers single-source risk and improves negotiating position during periodic collection fee renewal cycles across multiple farming regions and countries.

Cooperative Aggregation Models to Reduce Collection Costs

Producers are partnering with farmer cooperatives to consolidate coconut water collection logistics across dispersed smallholder farms, reducing per-unit transportation costs compared to individual farm-by-farm collection arrangements common in less organized regional agricultural supply chains and distribution networks. This approach also strengthens farmer relationships that support more stable long-term feedstock supply agreements and pricing consistency.

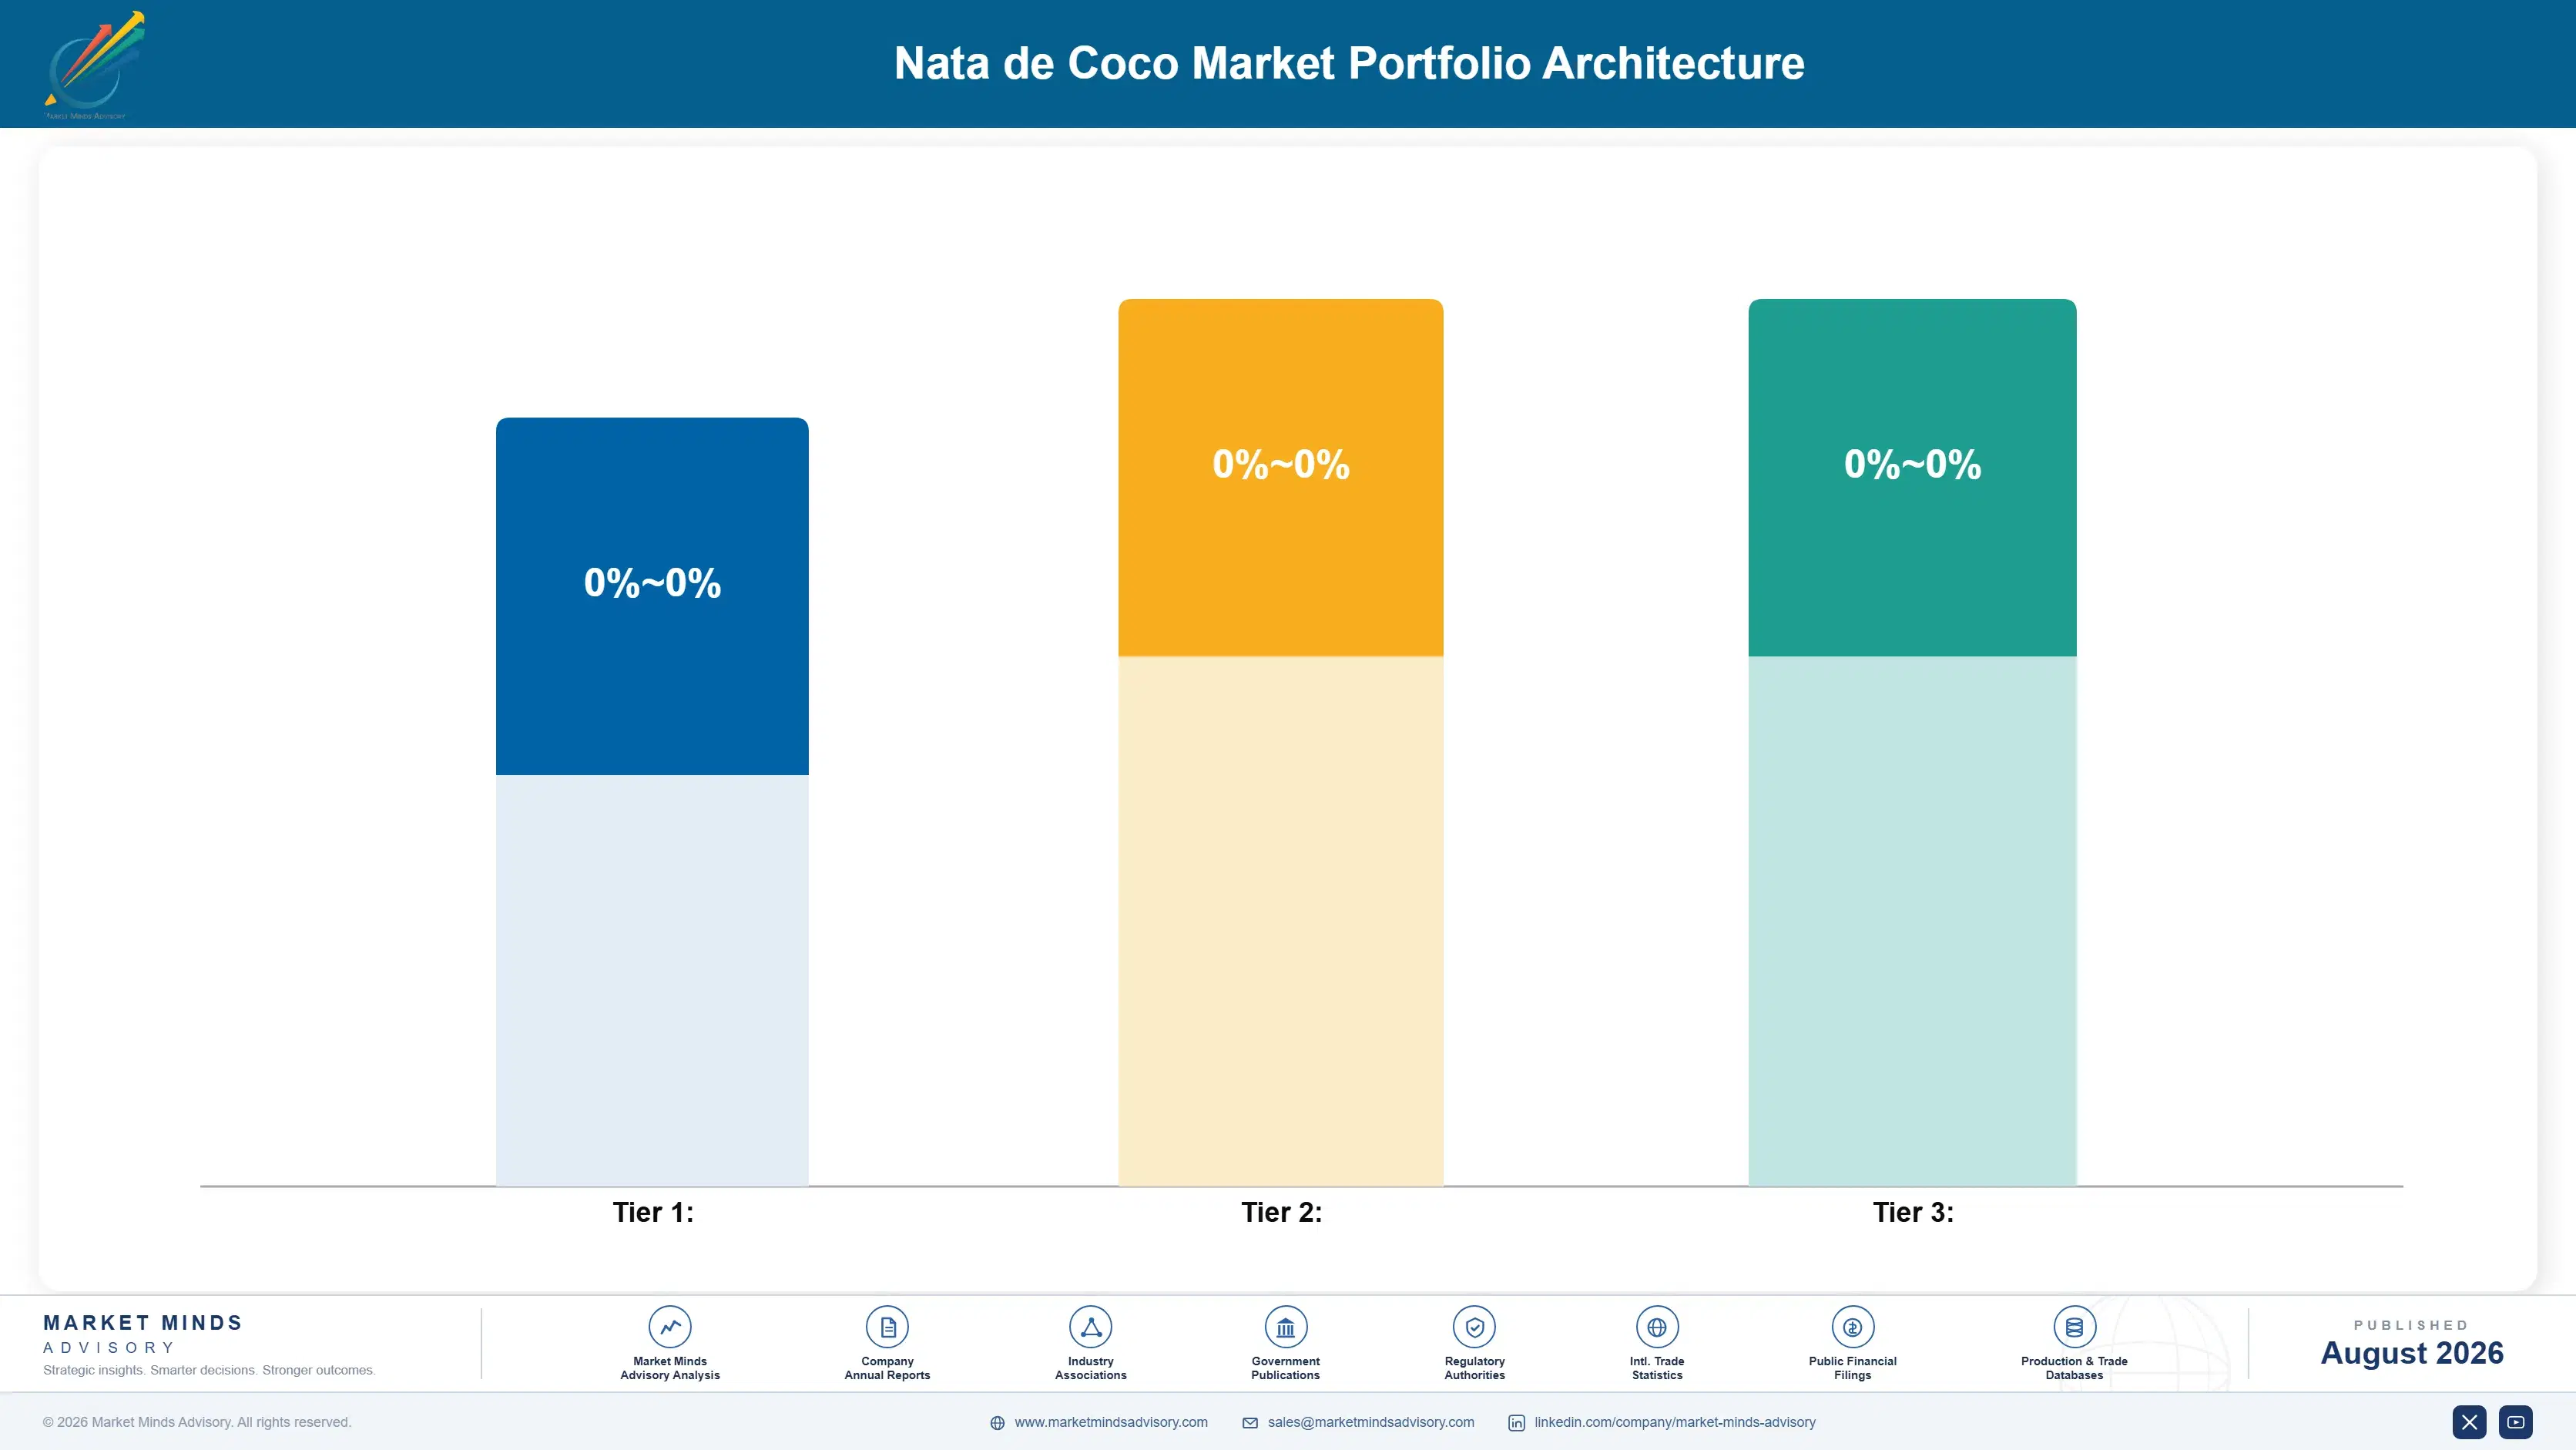
Portfolio Architecture for Margin Defence

Portfolio economics split sharply along a generic-versus-premium axis across the industry. Standard canned fruit cocktail applications compete almost entirely on unit cost, with gross margins compressed by coconut water collection cost volatility and thin differentiation among regional producers. Beverage inclusion and premium dairy inclusion formats carry meaningfully higher margins, reflecting sizing precision investment, export certification, and the qualification-required status these formats now hold among bubble tea chains and yogurt manufacturers.
The tension between generic and premium formats is intensifying as bubble tea chain expansion and yogurt manufacturer differentiation pull demand toward specialized formats faster than sizing and certification capacity can scale industry-wide across most producer networks. Producers over-indexed on standard canned formats face margin erosion as that segment shrinks toward a smaller, price-sensitive core, while those who invested early in automated sizing and export certification are capturing a disproportionate share of the industry's expanding premium revenue pool relative to overall production volume.

High-value margin pools concentrate in beverage inclusions serving international bubble tea chains and dairy inclusions serving premium yogurt manufacturers, where sizing precision and export certification limit competitive entry from smaller regional producers. A second, smaller pool sits in seasonal supply stabilization services serving customers seeking year-round delivery reliability.

Standard canned fruit cocktail nata de coco sold primarily on unit cost to traditional retail and food service customers, where thin margins reflect limited differentiation and intense price competition among regional producers serving cost-sensitive accounts.
Gross Margin

Beverage inclusion and premium dairy formats commanding qualification-required status among bubble tea chains and yogurt manufacturers, where sizing precision investment and export certification support meaningfully higher margins than standard canned alternatives.
Gross Margin

Emerging seasonal supply stabilization technologies and next-generation cube sizing automation still scaling commercially, commanding the highest margins as producers price in scarcity value ahead of broader industry-wide adoption and formal qualification.
Gross Margin
nata-de-coco-market-trends-forecast-portfolio-architecture-1787555035246

High-value Sub-segments and Strategic Watch-out

Beverage Inclusions for International Bubble Tea Chains

Beverage inclusions serving international bubble tea chains combine the fastest segment growth with the highest margins in the portfolio, driven by qualification-required status limiting new entrant competition industry-wide. Producers holding early sizing capability are best positioned to capture this expanding high-value pool consistently and reliably over time.

Dairy Inclusions for Premium Yogurt Manufacturers

Dairy inclusions serving premium yogurt manufacturers combine strong growth with above-average margins tied to sustained sizing precision and quality consistency investment over time. This segment benefits from rising consumer interest in textural variety expanding faster than dairy-grade production capacity across most producing regions currently and consistently.

Standard Canned Fruit Cocktail Applications

Standard canned fruit cocktail applications remain the volume core of the market, serving cost-sensitive traditional retail customers not yet driving premium format demand. Growth is slow and margins are thin, but the segment still represents the largest single share of total unit volume shipped across the industry currently.

Confectionery and Snack Applications

Confectionery and snack applications serve a specialized niche within broader food manufacturing, facing steady but modest demand growth tied to regional snack food trends. Producers should monitor whether this format retains relevance as bubble tea and dairy inclusion formats capture growing consumer attention and manufacturer investment.

Recurring Demand From Chain Supply Contracts

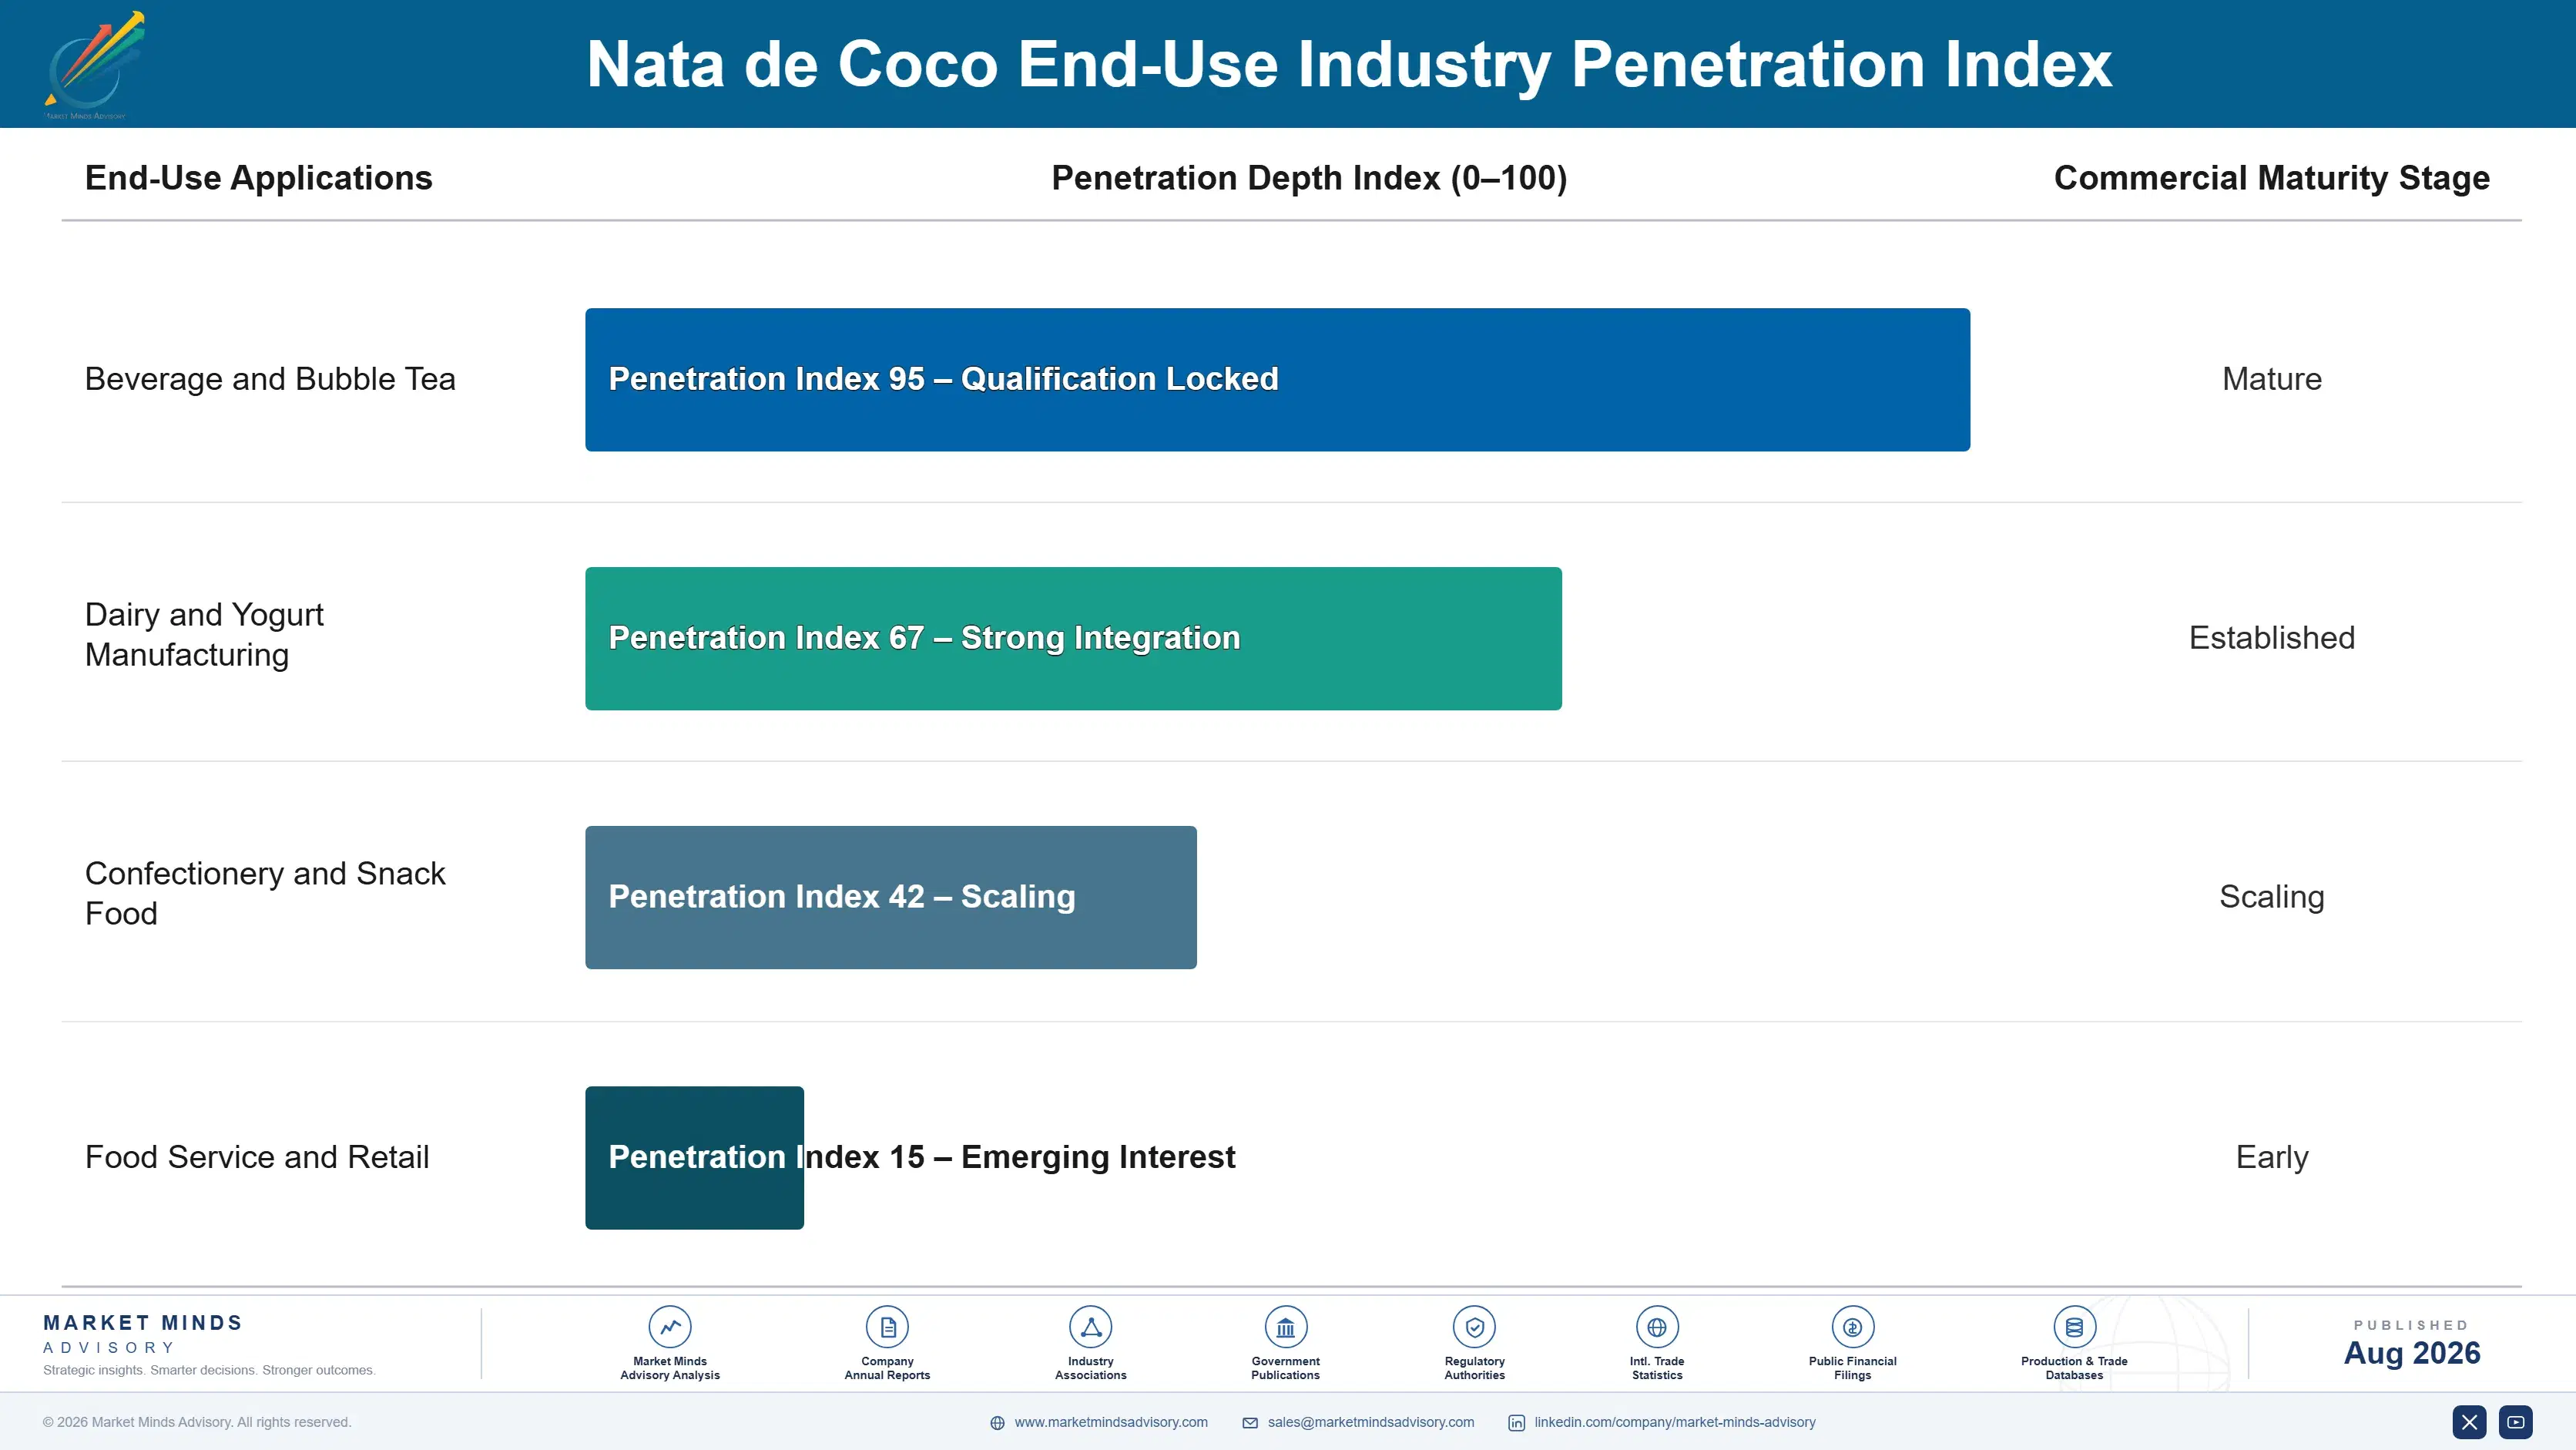
Nata de coco demand behaves like an annuity for producers holding qualified supplier status with major bubble tea chains, since chains rarely requalify ingredient suppliers once a sizing and quality standard is validated across their store network. Multi-year supply agreements, once established, tend to persist through a chain's expansion cycle into new markets, giving incumbent producers durable, recurring revenue streams across their qualified customer base.
Stickiness varies meaningfully by end-use vertical: large international bubble tea chains rarely switch suppliers mid-expansion given the extensive requalification testing required, while smaller independent cafes switch more readily based on price and availability. Yogurt manufacturers sit between these extremes, valuing consistency but willing to test new suppliers when new premium product lines require different cube sizing specifications across their broader product portfolio.

Buyer profiles are shifting generationally as procurement decisions move from purchasing agents focused purely on unit cost toward quality assurance officers weighing sizing consistency and export certification alongside price. This generational shift favors producers who can speak credibly to automated sizing capability and food safety compliance rather than cost alone, reshaping which sales relationships and technical capabilities matter most in winning and retaining large beverage chain accounts.
nata-de-coco-market-trends-forecast-end-use-penetration-index-1787555035727

MMA Verdict on Producer Strategy

These are among the four positions where our research anticipates prominent divergence between winners and laggards over the coming forecast period. Each is grounded in the demand model, the regulatory perimeter, and the announced capacity pipeline.
01 / SIZING AUTOMATION INVESTMENT

Invest in Automated Sizing Before Chain Deadlines Bind

Producers without automated cube sizing equipment are losing large bubble tea chain contracts to competitors who invested early, not in some future qualification cycle several years away from today's chain expansion reality. The premium sizing-capable producers command, averaging 20 to 28% above generic hand-cut nata de coco, will only widen as bubble tea chains continue international expansion through 2030 and beyond. Delaying sizing equipment investment past 2027 risks permanent exclusion from the fastest-growing and highest-margin segment of the entire market for years to come.
02 / EXPORT CERTIFICATION PRIORITY

Secure Export Certification Ahead of International Chain Expansion

Producers without international food safety export certification are ceding the fastest-growing bubble tea chain segment to competitors who invested in certification ahead of confirmed international demand growth across North America and Europe and other emerging markets. This capability commands a premium averaging 15 to 22% above domestically focused producers, rewarding producers who build certification capability ahead of chain expansion into newly regulated markets. Producers who invest now will capture volume that uncertified competitors cannot economically match going forward into the next decade.
03 / SEASONAL STABILIZATION EXPANSION

Build Storage Capacity to Guarantee Year-Round Supply

Bubble tea chains and yogurt manufacturers increasingly require consistent delivery schedules that seasonal coconut water availability alone cannot reliably support, and producers who invest in storage and preservation capacity are capturing meaningful pricing premiums while raising switching costs for existing customer accounts substantially. This capability gap is currently underexploited by all but the largest producers serving this fragmented and still-consolidating industry landscape today, leaving real margin on the table. Building dedicated storage infrastructure now positions producers ahead of competitors still exposed to seasonal supply shortfalls.
04 / VIETNAMESE CAPACITY POSITIONING

Expand Processing Capacity in Vietnam Ahead of Demand Growth

Vietnam represents the fastest-growing national market as domestic bubble tea consumption rises alongside expanding coconut processing infrastructure, and producers without meaningful regional presence are ceding share to competitors positioned closer to this emerging demand base and its growing consumer population. Early movers securing processing capacity and customer relationships in Vietnam now will hold a durable cost and lead-time advantage over competitors entering once regional capacity consolidation is further along and better established. This window will likely close within several years.

Engagement Snapshot From the Field

A live engagement with an industry participant carrying material or product regulatory and market exposure ahead of a defining policy shift, showing how our research translates into a defensible multi-year portfolio strategy.
MARKET MINDS ADVISORY · CLIENT ENGAGEMENT SUMMARY
Nata de Coco Producer Strategic Portfolio Review and Transition Roadmap 2026·Investment Scenario on Nata de Coco Exposure Evaluation 2025-26
CLIENT PROFILE
The client is an international bubble tea chain operating over 400 stores across twelve countries, sourcing nata de coco and other beverage inclusion ingredients centrally to maintain consistent product quality across its global store network. Facing rapid expansion into North American and European markets, the chain's procurement team needed an independent assessment of certified supplier capacity and cost impact ahead of a major market entry decision.
STRATEGIC CHALLENGE
The chain faced a choice between continuing to source from a single established Philippine supplier or diversifying across multiple certified producers to reduce supply concentration risk as store count expansion accelerated. Internal operations and procurement teams disagreed on timing, and the chain lacked independent data comparing producer capabilities and true multi-year cost and reliability impact.
MMA APPROACH
MMA conducted producer capability benchmarking across six certified nata de coco suppliers, modeled three-year cost and supply reliability scenarios under different expansion pace assumptions, and interviewed quality assurance officers at two comparable bubble tea chains regarding their own sourcing diversification experience. The engagement combined primary survey data with direct producer interviews to produce a supplier diversification framework.
KEY FINDINGS
  1. Diversifying across three certified producers would add an estimated 8% to blended procurement cost initially, expected to narrow within two years (client-reported, unverified by MMA).
  2. Two of six benchmarked producers already held export certification across all target expansion markets, while four would require six to nine months of additional testing.
  3. Supply concentration modeling showed a meaningful reliability risk emerging within eighteen months if the chain delayed diversification past its current expansion decision timeline.
  4. Quality assurance officers at both interviewed comparable chains indicated diversification reduced supply disruption incidents meaningfully during their own multi-year expansion periods and store openings.
CLIENT PROFILE
The client is an international bubble tea chain operating over 400 stores across twelve countries, sourcing nata de coco and other beverage inclusion ingredients centrally to maintain consistent product quality across its global store network. Facing rapid expansion into North American and European markets, the chain's procurement team needed an independent assessment of certified supplier capacity and cost impact ahead of a major market entry decision.
STRATEGIC CHALLENGE
The chain faced a choice between continuing to source from a single established Philippine supplier or diversifying across multiple certified producers to reduce supply concentration risk as store count expansion accelerated. Internal operations and procurement teams disagreed on timing, and the chain lacked independent data comparing producer capabilities and true multi-year cost and reliability impact.
MMA APPROACH
MMA conducted producer capability benchmarking across six certified nata de coco suppliers, modeled three-year cost and supply reliability scenarios under different expansion pace assumptions, and interviewed quality assurance officers at two comparable bubble tea chains regarding their own sourcing diversification experience. The engagement combined primary survey data with direct producer interviews to produce a supplier diversification framework.
KEY FINDINGS
  1. Diversifying across three certified producers would add an estimated 8% to blended procurement cost initially, expected to narrow within two years (client-reported, unverified by MMA).
  2. Two of six benchmarked producers already held export certification across all target expansion markets, while four would require six to nine months of additional testing.
  3. Supply concentration modeling showed a meaningful reliability risk emerging within eighteen months if the chain delayed diversification past its current expansion decision timeline.
  4. Quality assurance officers at both interviewed comparable chains indicated diversification reduced supply disruption incidents meaningfully during their own multi-year expansion periods and store openings.
RECOMMENDED STRATEGY
Phase 1: Phase one: qualify two additional certified producers within nine months, prioritizing suppliers with proven capacity in North American and European markets. Phase 2: Phase two: shift 40% of procurement volume to the newly qualified producers within eighteen months, reducing overall single-supplier concentration risk substantially. Phase 3: Phase three: renegotiate all supplier contracts at twelve months to capture competitive pricing as diversified sourcing strengthens the chain's negotiating position.
OUTCOME
The client diversified across three certified producers within sixteen months, ahead of its original expansion timeline, and reported a lower-than-expected 5% blended cost increase as producer competition intensified across the newly qualified supplier base spanning multiple producing countries and geographic regions (client-reported, unverified by MMA).

Frequently Asked Questions

Foundational context covering the market sizes, CAGR, scope, country, region and competition that inform every finding below. This section is provided to cover basics and most often pre-purchase conversations, answered from the MMA Primary Research Dataset.

What is the current size of the Nata de Coco Market?

The Nata de Coco Market is valued at $0.72 billion in 2025. This figure reflects global demand across beverage inclusion, dairy inclusion, and traditional canned dessert applications.

How large will the Nata de Coco Market be by 2036?

The market is projected to reach $1.44 billion by 2036. Growth is driven primarily by international bubble tea chain expansion pulling nata de coco into new beverage markets.

What is the CAGR for the Nata de Coco Market 2026 to 2036?

The market is forecast to grow at a 6.5% compound annual growth rate between 2026 and 2036. Bull and bear scenarios range from 7.7% to 5.3% depending on chain expansion pacing.

Which segment is growing fastest?

Bubble tea and beverage inclusions are the fastest-growing segment, expanding at a 9.0% CAGR, well above the overall market rate. International bubble tea chain expansion is the primary driver.

Who are the major companies in the Nata de Coco Market?

Leading participants include Axelum Resources Corp, Peter Paul Philippine Corporation, PT Niramas Utama, Franklin Baker Philippines, and Century Pacific Food. Together these five producers hold approximately 28% of global share.

Which country is growing fastest?

Vietnam is the fastest-growing country market, expanding at a 9.5% CAGR. Rising domestic bubble tea consumption and steadily expanding coconut processing infrastructure are accelerating demand.

Report Segmentation Architecture

The full report scope spans multiple orthogonal segmentation dimensions, with cross-tabulated demand data provided for each dimension pair. Coverage extends further to regional breakdowns, trend trajectories, and the competitive detail needed to support segment-level decision-making.

By Primary Market Dimension

  • Bubble Tea and Beverage Inclusions
  • Yogurt and Dairy Inclusions
  • Fruit Cocktail and Canned Dessert
  • Confectionery and Snack Applications
  • Food Service/Bulk Ingredient
  • Retail Packaged Nata de Coco

By End-Use Industry

  • Beverage and Bubble Tea
  • Dairy and Yogurt Manufacturing
  • Confectionery and Snack Food
  • Food Service and Retail

By Commercial Dimension

  • Direct Chain Manufacturer Contracts
  • Distributor and Wholesale Channel
  • Export Certification Consulting Bundled Services

By Region

  • North America
  • Western Europe
  • East Asia
  • South Asia and Pacific
  • Latin America
  • Middle East and Africa
  • Eastern Europe

Scope, Methodology, and Coverage

Every figure in this report is reproducible from documented input assumptions. The scope below maps the historical period, the forecast horizon, the segmentation dimensions, and the countries covered, alongside the underlying primary and qualitative methodology.
Historical Period
2020 to 2025
Forecast Period
2026 to 2036
Base Year
2025 (USD billions; MMA Primary Research Dataset, August 2026)
Market Definition
The Nata de Coco Market covers fermented coconut water gel cubes and sheets used as an ingredient in beverages, desserts, dairy products, and confectionery applications. It excludes coconut water sold as a standalone beverage, coconut milk, and other coconut-derived food products not produced through bacterial cellulose fermentation.
Quantitative Units
USD billions (current prices); metric tons for volume-referenced segment discussion where applicable
Segmentation Dimensions
By Primary Market Dimension; By End-Use Industry; By Commercial Dimension; By Region
Regions Covered
North America, Western Europe, East Asia, South Asia and Pacific, Latin America, Middle East and Africa, Eastern Europe
Countries Covered
USA, Canada, Mexico, UK, Germany, France, Netherlands, China, Japan, South Korea, Philippines, Indonesia, Vietnam, Thailand, Australia, Brazil, Argentina, Colombia, UAE, Saudi Arabia, South Africa, Poland, Czech Republic, Hungary, Romania, Russia, and additional markets relevant to this sector
Key Companies Profiled
Axelum Resources Corp, Peter Paul Philippine Corporation, PT Niramas Utama, Franklin Baker Philippines, Century Pacific Food, Kara Group, PT Sekar Bumi, Profood International Corporation, Universal Robina Corporation, Del Monte Philippines, NutriAsia, Monde Nissin Corporation, PT Indofood Sukses Makmur, Zest-O Corporation, Thai Coconut Public Company Limited, Theppadungporn Coconut Co, San Miguel Pure Foods, Wilmar International, Musim Mas, Sime Darby Plantation
Quantitative Methodology
Primary survey, n=3,800 respondents, Q4 2025, six countries; demand-side model with trade association cross-validation
Qualitative Methodology
47 expert interviews, Q4 2025; applied to validate demand model assumptions, identify emerging dynamics, and assess competitive positioning
Report Format
PDF and XLSX data workbook (Word format preview document)
Publisher
Market Minds Advisory
Report Code
MMA-2026-AGR-231
Published
August 2026
Contact
sales@marketmindsadvisory.com | www.marketmindsadvisory.com

Purchase the full Nata de Coco Market Report (2026 to 2036).

This report provides a comprehensive ten-year forecast of the global Nata de Coco Market. Coverage spans beverage inclusion, dairy inclusion, fruit cocktail, confectionery, and retail packaged formats across all seven world regions. Deliverables include segment-level and regional sizing to 2036, competitive benchmarking of twenty profiled producers on a consistent revenue basis, and feedstock cost exposure analysis. A strategic verdict identifies where producers should concentrate sizing and certification investment over the coming decade. The report draws on primary survey data, expert interviews, and company disclosures rather than secondary aggregation.
Ten-year market sizing across seven world regions
Segment-level CAGR and market share benchmarking
Competitive profiling of twenty leading producers
Export certification and food safety pathway analysis
Feedstock cost exposure and mitigation strategies
Strategic verdict on capital allocation priorities

Built For The People Who Decide

From boardroom strategy to bench-side execution, this report is read cover-to-cover by leaders shaping the next decade of their industry, turning demand scenarios, market dynamics and valuation benchmarks into decisions.
CXOs/ Presidents/ VPs/ Managers
M&A and Corporate Development
Strategy Teams and R&D Heads
Procurement and Product Directors
Regulatory and Compliance Leaders
Investor Relations and Equity Analysts