Market Minds Advisory
Nanoscale Chemicals Market

Nanoscale Chemicals Market: Application Diversification and Regional Demand to 2036

Battery makers and semiconductor fabs are scaling nanoscale material adoption faster than coatings and cosmetics ever did, while falling graphene and quantum dot production costs meet tightening nanomaterial safety disclosure rules that reshape sourcing.

Lead Analyst

Bilal Shaikh

Published

September 2026

Make Smarter Decisions with Customized Research Insights

Request a free sample report and evaluate market opportunities, growth trends, and competitive dynamics relevant to your business needs.

2025 MARKET VALUE$8.9BMarket Size 2025
2036 FORECAST VALUE$29.2BBase Case , 2026 to 2036
CAGR 2026 TO 203611.4 %Bull 12.8% / Bear 10.0%
INCREMENTAL OPPORTUNITY$19.3BNet 10- year value creation
EXPANSION MULTIPLE2.94x2036 value over 2026 base
Strategic Levers
M&A Pipeline
Regional Outlook
Country Rankings
Competitive Intelligence
Segmental Deep-dive
Call-Us : 91 93563 13602

Executive Snapshot and Market Trajectory

Nanoscale chemical adoption has expanded well beyond its original coatings and cosmetics base into batteries, semiconductors, and advanced composites, as manufacturers increasingly specify engineered nanomaterials for performance gains that bulk-scale chemistry cannot deliver at comparable cost or weight across demanding applications.
Quantum dot and nanoscale electronic materials are growing fastest as display manufacturers, battery makers, and semiconductor fabs scale production using materials engineered at the nanometer level for precise optical and electrical properties. China's dominant battery and electronics manufacturing base, combined with South Korea and Japan's semiconductor and display industries, absorbs a growing share of global nanoscale chemical demand, even as American and European specialty producers retain the deepest expertise in nanoparticle synthesis and surface functionalization built over decades of research.
Competition sits between diversified chemical majors offering broad nanomaterial portfolios across multiple end markets and specialist producers competing on purity, particle size consistency, and application-specific engineering. Tightening nanomaterial safety disclosure and exposure documentation requirements across major regulatory jurisdictions are pushing producers toward more rigorous characterization and testing infrastructure, while venture-backed startups developing novel nanomaterial synthesis routes are pressuring established chemical majors to accelerate their own innovation pipelines considerably faster than before.
Market Definition
Nanoscale chemicals are engineered materials with at least one dimension between one and one hundred nanometers, including nanoparticles, carbon nanomaterials, nanocoatings, nanocomposites, and quantum dots, used to impart specific optical, electrical, or mechanical properties. The market excludes bulk chemical formulations without engineered nanoscale structure and naturally occurring nanoscale particles.
Base Year Value
$8.9B in 2025 (MMA Primary Research Dataset, August 2026)
Forecast Period
2026 to 2036, eleven discrete annual values
CAGR
11.4% base case. Bull 12.8%. Bear 10.0%.
Fastest Growth Segment
Quantum Dots and Nanoscale Electronic Materials: 15.5% CAGR
Fastest Growth Country
China: 13.0% CAGR
Fastest Growth Region
South Asia and Pacific: 13.4% CAGR
Largest Region
East Asia: 30% of 2025 global value
Market Leaders
BASF SE, Evonik Industries, Cabot Corporation, Nanophase Technologies, and American Elements lead the field. Source: MMA Analysis based on company annual reports.
Primary Survey
n=3,800 procurement and R&D decision-makers, Q4 2025, six countries
Methodology
Demand-side build-up, cross-validated against public data, 47 expert interviews

Nanoscale Chemicals Market Forecast Scenarios

nanoscale-chemicals-market-trends-size-forecast-scenario-1787556285155
Between 2020 and 2025 nanoscale chemical demand grew at roughly 10.2 percent a year, held back early by pandemic-era research funding disruption before accelerating sharply as battery and semiconductor manufacturers scaled nanomaterial-dependent production. Graphene and carbon nanotube production costs fell substantially during this period as manufacturing processes matured, pulling several applications from research-stage into commercial-scale adoption faster than most analysts had projected at the decade's start.
The base case assumes continued growth as three mechanisms compound: battery manufacturers scaling silicon-nanoparticle and nanostructured electrode materials to improve energy density beyond what conventional chemistry allows; semiconductor and display manufacturers adopting quantum dot materials for precise optical properties in next-generation displays and sensors; and falling graphene and carbon nanotube production costs extending these materials from research applications into mainstream composite and coating formulations across automotive, aerospace, and consumer electronics manufacturing at meaningfully larger commercial scale.
The bull case turns on faster-than-expected quantum dot display adoption spreading from premium televisions into mainstream consumer electronics and automotive displays. The bear case centers on tightening nanomaterial safety regulation restricting certain nanoparticle classes pending further toxicology research, which has historically slowed commercial adoption and compressed producer margins, a pattern last seen in 2019.

Application Diversification and Nanomaterial Scale-Up Economics

Nanoscale chemicals sit at the intersection of materials science breakthrough, manufacturing scale-up economics, and expanding end-market applications well beyond the category's original coatings and cosmetics base. As battery and semiconductor manufacturers scale nanomaterial-dependent production, suppliers increasingly compete on characterization data and consistent particle-level quality rather than raw material chemistry alone, even where engineered nanomaterials carry a substantial price premium over conventional bulk chemicals.
MARKET CONCENTRATIONCR5: 28%Ownership stays fragmented across many specialty producers today
AVERAGE SELLING PRICE$3,800 per kilogramPricing varies dramatically by material type and purity
CAPACITY UTILISATION69%Production plants run moderately below full rated capacity
TOP PRODUCER SHARETop 3 countries: 56%Manufacturing concentrates near major electronics and battery hubs
TRADE INTENSITY49% cross-borderFinished nanomaterials ship globally to specialized manufacturing customers
RESEARCH INTENSITY14% of revenueProducers reinvest heavily in characterization and synthesis research
Commercially the category splits between diversified chemical majors offering broad nanomaterial portfolios across multiple end markets and specialist producers competing on purity, particle size consistency, and application-specific engineering for narrow, demanding use cases. Diversified majors compete on manufacturing scale and breadth across applications, while specialists win on deep technical expertise in specific nanomaterial classes, since battery, semiconductor, and coating applications each demand fundamentally distinct material properties and characterization.
The next decade will be shaped by continued application diversification beyond coatings and cosmetics into batteries, semiconductors, and advanced composites, falling production costs extending graphene and quantum dot materials into mainstream applications, and tightening safety disclosure requirements favoring producers with rigorous characterization infrastructure. Producers that can pair proven material performance with documented safety data stand to capture share from suppliers still selling nanomaterials without comprehensive characterization.
"Five years ago nanoscale chemicals meant sunscreen and scratch-resistant coatings; now it means the anode material in the battery in your pocket, and that shift in end use is what's actually driving the growth numbers, not novelty applications."
Director, Advanced Materials and Nanotechnology Practice · MMA Chemicals and Materials Practice · August 2026

Market Trends

Quantum Dot Adoption Expands Beyond Premium Display Applications

Quantum dot materials, engineered nanocrystals that emit precisely tunable wavelengths of light when excited, are expanding beyond premium television displays into mainstream consumer electronics, automotive displays, and next-generation lighting applications as production costs fall and manufacturing processes mature. Display manufacturers report quantum dot materials deliver measurably wider color gamut and improved energy efficiency compared with conventional display technologies, justifying continued adoption despite persistent cost premiums over established alternatives. Several major electronics manufacturers have expanded quantum dot display offerings into mid-range product tiers previously limited to premium flagship models only, and suppliers with proven manufacturing scale are winning display contracts at a faster rate than smaller specialty producers.
Market Impact: Adds 8 percent volume from EVs

Nanomaterial Safety Disclosure Requirements Tighten Across Major Markets

Regulators across the European Union, United States, and increasingly China are tightening documentation and disclosure requirements for engineered nanomaterials, requiring producers to characterize particle size distribution, surface chemistry, and exposure risk data before certain applications can proceed to commercial approval. Compliance has raised characterization and testing costs for producers by an estimated fifteen to twenty percent for affected product lines, disproportionately affecting smaller specialty producers without in-house characterization infrastructure who must now outsource testing. Producers with established characterization capability and documented safety data are capturing share from smaller regional producers unable to invest in the additional testing infrastructure the tightening requirements demand.
Market Impact: Commands 5x precision segment pricing

Market Opportunities and Growth Drivers

Battery Manufacturers Scale Nanostructured Electrode Materials

Battery manufacturers across the electric vehicle and energy storage industries are increasingly incorporating nanostructured silicon and carbon materials into anode formulations to improve energy density beyond what conventional graphite chemistry allows, and every gigawatt-hour of new battery manufacturing capacity represents substantial nanomaterial demand growth. Silicon nanoparticle anode additives can meaningfully improve battery energy density when properly engineered and stabilized against the swelling that silicon undergoes during charging cycles, a challenge nanoscale engineering has substantially addressed in recent product generations. Suppliers with proven silicon nanoparticle stabilization technology are securing multi-year battery manufacturer supply contracts as electric vehicle production continues scaling globally across most major automotive markets.
Market Impact: Adds up to 30 percent cost

Semiconductor And Display Manufacturers Demand Precision Nanomaterials

Semiconductor and display manufacturers require nanomaterials meeting exceptionally strict particle size uniformity and purity standards, since even minor variation can meaningfully affect device performance and manufacturing yield across high-value electronics production. This segment consistently commands the highest per-kilogram pricing across the entire nanoscale chemical category, reflecting the precision manufacturing and characterization infrastructure required to meet these specifications reliably at commercial scale. Rising global semiconductor manufacturing capacity investment, driven by both AI computing demand and geographic supply chain diversification, sustains steady demand growth in this premium segment independent of broader industrial nanomaterial application growth across coatings and composites more broadly.
Market Impact: Delays adoption 12 to 18 months

Market Restraints and Challenges

Production Scale-Up Challenges Limit Commercial Cost Reduction

Many nanoscale chemical production processes that work reliably at laboratory or pilot scale encounter significant technical challenges when scaled to commercial manufacturing volumes, since particle size consistency and surface chemistry control often become substantially harder to maintain as batch sizes and production rates increase. Root causes include the fundamental physics of nanoscale particle formation, which resists straightforward linear scale-up compared with conventional bulk chemical manufacturing processes that scale more predictably. When scale-up proves more difficult than anticipated, producers either accept higher unit costs or invest heavily in specialized manufacturing equipment, both outcomes delaying the cost reduction that would accelerate broader commercial adoption. Larger producers are addressing the challenge through dedicated scale-up engineering teams and staged capacity expansion.
Market Impact: Commands 4 to 6x display pricing

Regulatory Uncertainty Around Nanomaterial Toxicology Slows Adoption

Regulatory bodies across major markets continue developing nanomaterial-specific toxicology and exposure assessment frameworks, and this ongoing regulatory evolution creates uncertainty that makes some manufacturers hesitant to commit to nanomaterial-dependent product designs before regulatory pathways are fully established and predictable. The root cause is that nanoscale materials can exhibit different toxicological properties than their bulk chemical equivalents, requiring dedicated research that regulatory bodies are still actively developing standardized assessment protocols to address comprehensively. Manufacturers are managing the risk by engaging directly with regulatory bodies during framework development and prioritizing nanomaterial classes with more established safety data.
Market Impact: Adds 15 to 20 percent cost
3 additional market trends, 4 additional growth drivers, and 3 additional restraints and challenges are covered in the full report. Contact sales@marketmindsadvisory.com to access the complete intelligence.

Segment CAGR and Growth Architecture

Nanoscale chemicals segment most usefully by material type, since nanoparticles, carbon nanomaterials, nanocoatings, nanocomposites, nanocatalysts, and quantum dots carry distinct synthesis processes, characterization requirements, and application relevance. This framework mirrors how producers organise research and manufacturing teams and how end markets specify nanomaterial requirements across different demanding applications.
nanoscale-chemicals-market-trends-market-share-analysis-1787556285748

Quantum Dots and Nanoscale Electronic Materials

Quantum dots and nanoscale electronic materials are the fastest-growing segment as display manufacturers, battery makers, and semiconductor fabs scale production using materials engineered at the nanometer level for precise optical and electrical properties unavailable through conventional chemistry. These materials command a substantial premium over conventional alternatives, driven by the precision manufacturing, characterization, and quality control required to achieve consistent nanometer-scale properties reliably at commercial volume. Growth concentrates among producers with proven manufacturing scale and characterization infrastructure capable of meeting semiconductor and display industry purity and consistency requirements. Growth is fastest as production costs fall enough to extend quantum dot displays from premium flagship products into mid-range consumer electronics, expanding the addressable market substantially beyond the small premium segment where this technology originated commercially.
CAGR 15.5%

Carbon Nanomaterials

Carbon nanomaterials, including graphene, carbon nanotubes, and related structures, form the second-fastest-growing segment, benefiting from falling production costs that increasingly justify commercial adoption across battery, composite, and coating applications beyond the research settings where these materials originated decades ago. Battery manufacturers increasingly use carbon nanomaterials as conductive additives and structural components in next-generation electrode formulations, while automotive and aerospace manufacturers incorporate them into lightweight, high-strength composite materials. Growth is fastest in battery manufacturing hubs across China and South Korea, where manufacturers are qualifying carbon nanomaterial suppliers for large-scale production contracts previously limited to smaller research and specialty applications in these fast-scaling markets.
CAGR 13.2%
Full segment breakdown across 6 segments available in the complete report.

Regional Architecture and Country Demand Map

Nanoscale chemical demand concentrates where battery, semiconductor, and electronics manufacturing capacity is most developed. East Asia's dominant electronics and battery manufacturing base accounts for the largest share of global demand, while North America and Western Europe retain the deepest research infrastructure even as commercial-scale manufacturing increasingly concentrates in Asia.

East Asia

China's dominant battery and electronics manufacturing base drives the largest share of regional nanomaterial demand, and its rapidly expanding domestic nanomaterial production capacity increasingly supplies both local manufacturers and growing export volume to global customers. South Korea's semiconductor and display industries, among the world's most advanced, drive substantial demand for quantum dot and precision electronic nanomaterials specifically engineered to exacting manufacturing tolerances. Japan contributes stable demand from established electronics and specialty chemical manufacturing sectors with deep nanomaterial research traditions. Domestic Chinese producers are increasingly competing on both cost and technical sophistication, narrowing what was once a substantial technology gap with established Japanese and Western specialty makers serving premium electronic applications.
Share: 30% | CAGR: 12.5% (2026 to 2036)

North America

The United States research and development infrastructure, among the deepest globally in nanomaterial science, drives substantial demand for both commercial-scale production and continued research applications across battery, semiconductor, and defense-adjacent manufacturing sectors. Battery manufacturing capacity expansion, driven by electric vehicle production scaling domestically, increasingly requires nanostructured electrode materials sourced from both domestic and international suppliers. Regulatory scrutiny of nanomaterial safety disclosure, among the more developed frameworks globally, means regional suppliers compete partly on documented characterization data rather than price alone. Growth trails the fastest-growing regions because commercial-scale manufacturing capacity increasingly concentrates in Asia even as research leadership remains substantially domestic.
Share: 24% | CAGR: 11.9% (2026 to 2036)
Regional intelligence for 5 additional markets available in the complete report: Western Europe, South Asia and Pacific, Latin America, Middle East and Africa, Eastern Europe. Contact sales@marketmindsadvisory.com.
nanoscale-chemicals-market-trends-country-cagr-analysis-1787556286269

Application Diversification and Characterization Service Bundling

Producers can grow revenue per kilogram even where commodity nanomaterial volume growth is modest by extending proven synthesis technology into new high-value applications, bundling characterization and testing services with material sales, and securing multi-year battery and semiconductor manufacturer supply contracts. The most durable gains come from capturing premium application demand rather than commodity nanomaterial price competition.

Extending Proven Synthesis Technology Into Battery Applications

Producers with proven nanomaterial synthesis technology in one application, such as coatings or catalysts, are increasingly extending that technology into battery electrode materials, capturing premium pricing roughly 150 to 250 percent above conventional applications given battery manufacturers' substantially higher performance and characterization requirements. This extension typically requires meaningfully less incremental research investment than developing entirely new synthesis technology from scratch, since core nanoparticle formation expertise transfers across applications even as surface functionalization and characterization requirements differ substantially by end use. The approach works best for producers already serving demanding specialty applications with comparable characterization infrastructure and quality systems.
Market Impact: Commands 150 to 250 percent premium

Bundling Characterization And Safety Testing Services

Producers offering documented particle size, surface chemistry, and exposure risk characterization data bundled directly with nanomaterial sales are capturing revenue that previously went to independent testing laboratories, simplifying regulatory compliance for customers facing tightening nanomaterial disclosure requirements across major markets. This bundled approach commands meaningfully higher margins than raw material sales alone, and customers increasingly prefer suppliers who can guarantee comprehensive characterization documentation over managing separate testing relationships, particularly as regulatory scrutiny continues intensifying across battery, electronics, and consumer product applications where documentation increasingly determines market access.
Market Impact: Lifts contract margin 20 percent higher

Securing Multi-Year Battery And Semiconductor Supply Contracts

Producers winning multi-year supply contracts with battery and semiconductor manufacturers secure volume commitments that provide revenue visibility uncommon in most specialty chemical categories, since switching nanomaterial suppliers requires costly requalification and characterization validation across an entire manufacturing process. These platform relationships also create durable switching barriers, since manufacturers face substantial engineering and qualification cost changing suppliers mid-contract. Producers with established supply relationships report contract renewal rates roughly 3 times higher than spot-market nanomaterial sales, reflecting the stability multi-year manufacturer relationships provide compared with transactional commodity nanomaterial sales.
Market Impact: Lifts contract renewal 3 times higher

Scaling Production Capacity Ahead Of Application Maturation

Producers investing in commercial-scale manufacturing capacity ahead of full application maturation position themselves to capture disproportionate share as emerging applications like quantum dot displays and silicon anode materials scale from niche to mainstream adoption, capturing early-mover pricing power before competitors build comparable capacity. This early investment requires accepting lower near-term capacity utilization in exchange for established manufacturing relationships once demand scales, a trade-off that has historically rewarded producers who scaled ahead of demand by roughly 20 to 30 percent higher margins during subsequent rapid demand growth phases.
Market Impact: Captures 20 to 30 percent margin premium

Who Controls the Margin Pool

The nanoscale chemicals market is fragmented, with an estimated CR5 near 28 percent, reflecting a category where technical specialization and application-specific expertise matter more than manufacturing scale across most nanomaterial classes. BASF and Evonik lead on combined portfolio breadth and characterization infrastructure, but the gap to specialist producers is narrower on emerging nanomaterial classes than on established, mature applications.
Competitive activity centers on three fronts: application diversification extending proven synthesis technology into new high-value end markets like batteries and semiconductors, characterization and safety testing capability build-out ahead of tightening regulatory requirements, and geographic expansion of manufacturing capacity across China and South Korea to stay close to concentrated battery and electronics demand. Acquisitions of specialist nanomaterial startups with novel synthesis technology have picked up as majors seek to close innovation gaps organically.

Emerging pressure comes from venture-backed startups developing novel nanomaterial synthesis routes that could meaningfully undercut established production costs, threatening incumbent producers on the highest-growth emerging applications. Chinese domestic producers are also rapidly closing the technical sophistication gap on precision electronic nanomaterials, threatening established Japanese and Western specialty makers on price. Rankings could shift meaningfully if a novel synthesis technology achieves commercial scale-up faster than established producers can respond competitively.
nanoscale-chemicals-market-trends-company-positioning-matrix-1787556286818

Competitive Moat and Risk Dimensions

BASF SE

Moat: Broad Portfolio And Research Scale

BASF's extensive nanomaterial research infrastructure and diversified portfolio spanning coatings, catalysts, and emerging battery applications give it manufacturing scale and technical breadth that smaller specialist producers cannot easily match, particularly for customers seeking a single supplier across multiple nanomaterial classes. That integrated position lets BASF win large multi-application supply contracts where breadth matters as much as depth in any single nanomaterial category.
BASF SE

Risk: Slower Response In Emerging Niches

BASF's scale and diversified portfolio make it comparatively slower to pursue narrow, emerging nanomaterial niches than specialist startups unencumbered by existing product line considerations and organizational complexity. This has cost BASF share in fast-emerging categories like quantum dots, where nimbler specialists identified commercial opportunity earlier and built dedicated characterization and manufacturing capability well ahead of larger diversified competitors.
EVONIK INDUSTRIES

Moat: Deep Specialty Nanoparticle Expertise

Evonik's long-standing specialization in engineered nanoparticles, particularly fumed silica and specialty surface-functionalized materials, gives it deep application-specific expertise that broader diversified competitors cannot easily replicate for highly demanding customer requirements. That specialization depth supports durable, high-margin revenue from customers requiring bespoke nanoparticle properties unlikely to switch suppliers absent a serious quality or performance failure.
EVONIK INDUSTRIES

Risk: Limited Scale In Electronic Materials

Evonik's specialty nanoparticle focus limits its presence in high-growth electronic materials like quantum dots, where competitors with dedicated semiconductor industry relationships and characterization infrastructure hold a meaningful head start. Evonik has occasionally lost large electronics manufacturer contracts to competitors with more comprehensive electronic materials portfolios despite superior nanoparticle engineering expertise in its core specialty categories.

Players Tracked

Prominent Players

BASF SE
Evonik Industries
Cabot Corporation
Nanophase Technologies
American Elements

Other Key Players

Merck KGaA
DuPont
3M
Arkema
Umicore
Nanoco Group
Quantum Materials Corp
NanoXplore
Pixelligent Technologies
Nanografi Nano Technology
US Research Nanomaterials
Strem Chemicals
OCSiAl
Haydale Graphene Industries
Cima NanoTech

Recent Developments

APRIL 2026

BASF Expands Battery-Grade Nanomaterial Production Capacity In China

BASF announced expanded battery-grade nanostructured electrode material production capacity at a facility in China, aimed at directly serving the country's rapidly expanding battery manufacturing sector from local production rather than importing finished materials from European facilities, reducing lead times for Chinese battery manufacturers significantly.
Signal: Signals established Western producers prioritising local Asian manufacturing presence over exporting finished nanomaterials from Europe.
OCTOBER 2025

American Elements Launches Quantum Dot Characterization Service Platform

American Elements introduced a comprehensive quantum dot characterization and safety testing service platform bundled with material sales, providing documented particle size, optical property, and exposure risk data increasingly required by electronics manufacturers evaluating competing nanomaterial suppliers for display and sensor applications.
Signal: Confirms characterization service bundling is becoming a standard competitive requirement among specialty nanomaterial producers.
JANUARY 2026

Cabot Corporation Announces Backward Integration Into Carbon Nanotube Production

Cabot Corporation announced expanded backward integration into carbon nanotube production capacity, securing feedstock supply ahead of the open market and reducing exposure to production cost volatility that has periodically compressed margins across the specialty nanomaterial industry as this segment scales.
Signal: Marks growing producer interest in vertical integration as carbon nanomaterial applications scale toward commercial volume.

Precursor Material And Synthesis Cost Exposure

Precursor materials, including specialty metal salts, silane compounds, and carbon feedstocks, account for roughly 40 percent of cost of goods sold across most nanoscale chemical manufacturing, with energy-intensive synthesis processing and characterization costs making up most of the remainder. Precursor sourcing concentrates heavily in China, Japan, and the United States, tying production costs directly to global specialty chemical and rare earth market dynamics.
Rare earth and specialty metal precursor price volatility during 2022 and 2023 pushed costs for certain quantum dot and catalytic nanomaterial precursors up by more than 40 percent within several months, according to IEA reporting on global critical mineral supply chains, forcing producers with fixed-price customer contracts signed before the spike to absorb significant margin compression. Producers without diversified precursor sourcing agreements faced the sharpest impact, and several smaller specialty producers reported delayed deliveries while sourcing alternative precursor materials at workable prices.

Exposure varies sharply by player type: larger integrated producers like BASF, with diversified multi-country precursor sourcing agreements, weather price spikes with meaningfully less margin disruption than smaller specialty producers reliant on open-market precursor purchases. Geographic exposure also differs, since producers sourcing primarily from Chinese rare earth supply chains face different risk timing than those dependent on domestic or Japanese specialty chemical production, meaning cost impact varies considerably across the industry.
nanoscale-chemicals-market-trends-cost-volatility-analysis-1787556287020

Diversifying Precursor Sourcing Across Multiple Countries

Producers are increasingly qualifying precursor suppliers across China, Japan, and the United States simultaneously rather than relying on a single country's production, so a disruption or policy shift in one market does not halt production entirely. This diversification raises qualification complexity modestly but significantly reduces the risk of the sharp, single-origin price spikes that hit under-diversified producers hardest during recent volatility.

Securing Multi-Year Precursor Supply Agreements With Suppliers

Larger producers are signing multi-year supply agreements directly with precursor manufacturers, securing guaranteed allocation ahead of the open market and capturing pricing stability that smaller producers reliant on spot purchases cannot access. This approach requires committed volume most smaller specialty producers cannot guarantee, reinforcing a cost and availability advantage for larger, established producers.

Backward Integration Into Precursor Refining Capacity

The largest nanomaterial producers are pursuing equity stakes or long-term offtake agreements directly with precursor refiners, securing supply ahead of the open market and capturing margin that would otherwise go to feedstock intermediaries. This approach requires capital most smaller specialty producers lack, reinforcing a durable cost advantage for scale players during periods of precursor scarcity.

Portfolio Architecture for Margin Defence

Nanoscale chemicals organise into three commercial tiers running from established commodity nanoparticles through certified, characterized specialty materials to next-generation quantum dot and battery-grade electronic nanomaterials. Gross margins widen sharply moving up the tiers, since commodity nanoparticles compete largely on manufacturing cost and delivery price, while specialty and electronic-grade materials capture value from documented characterization, particle consistency, and application-specific engineering rather than raw material cost alone.
The tension between commodity volume and premium application revenue shapes producer strategy: commodity nanoparticles generate the manufacturing scale that supports precursor purchasing power, but specialty and electronic-grade materials generate the margin that justifies continued research investment. Producers overweighted toward commodity-only sales face intensifying price competition from lower-cost regional makers, while premium-forward producers carry steadier, higher-margin profitability less exposed to commodity nanomaterial price cycles.

High-value pools concentrate among quantum dot and electronic nanomaterials sold into semiconductor and display manufacturing with rigorous characterization requirements, and among battery-grade nanostructured materials sold to electric vehicle and energy storage manufacturers. Both pools reward producers who can pair documented performance with reliable manufacturing scale rather than competing purely on commodity nanoparticle price alone.

Volume / Commodity-Adjacent Tier

Standard commodity nanoparticles sold largely on manufacturing cost and delivery price, competing on proximity to coating and industrial manufacturing facilities, serving cost-sensitive commercial applications broadly.
Gross Margin: 14-20%

Premium / Certified Tier

Certified, characterized specialty materials backed by documented particle consistency testing, sold at a meaningful premium to manufacturers requiring formal quality and safety compliance documentation.
Gross Margin: 26-34%

Sustainability / Regulatory / Next-Generation Tier

Quantum dot and battery-grade electronic nanomaterials sold to semiconductor, display, and battery manufacturers requiring documented precision, priced on performance rather than raw material cost.
Gross Margin: 40-50%
nanoscale-chemicals-market-trends-portfolio-architecture-1787556287533

High-value Sub-segments and Strategic Watch-out

Quantum Dot And Precision Electronic Nanomaterials

Quantum dot and precision electronic nanomaterials sold into semiconductor and display manufacturing command the category's highest margins and fastest growth, concentrated among producers with proven manufacturing scale and characterization infrastructure meeting rigorous electronics industry consistency requirements.
Gross Margin: 44-52%

Battery-Grade Nanostructured Electrode Materials

Nanostructured silicon and carbon electrode materials sold to battery manufacturers carry strong margins tied to energy density improvement, though growth is more moderate than electronic materials since adoption depends on individual battery manufacturer qualification and validation timelines across production platforms.
Gross Margin: 32-40%

Standard Commodity Nanoparticles

Commodity nanoparticles remain the largest volume category by far, generating steady manufacturing revenue across cost-sensitive coating and industrial applications, even as growth increasingly shifts toward specialty and electronic-grade materials elsewhere in the broader portfolio.
Gross Margin: 14-19%

Regulatory Classification Uncertainty Risk

Ongoing development of nanomaterial-specific toxicology and safety classification frameworks represents a meaningful demand risk, since new restrictions on specific nanoparticle classes could disrupt established product lines that producers dependent heavily on affected categories must monitor closely across jurisdictions.
Gross Margin: n/a

Application-Locked Qualification Economics

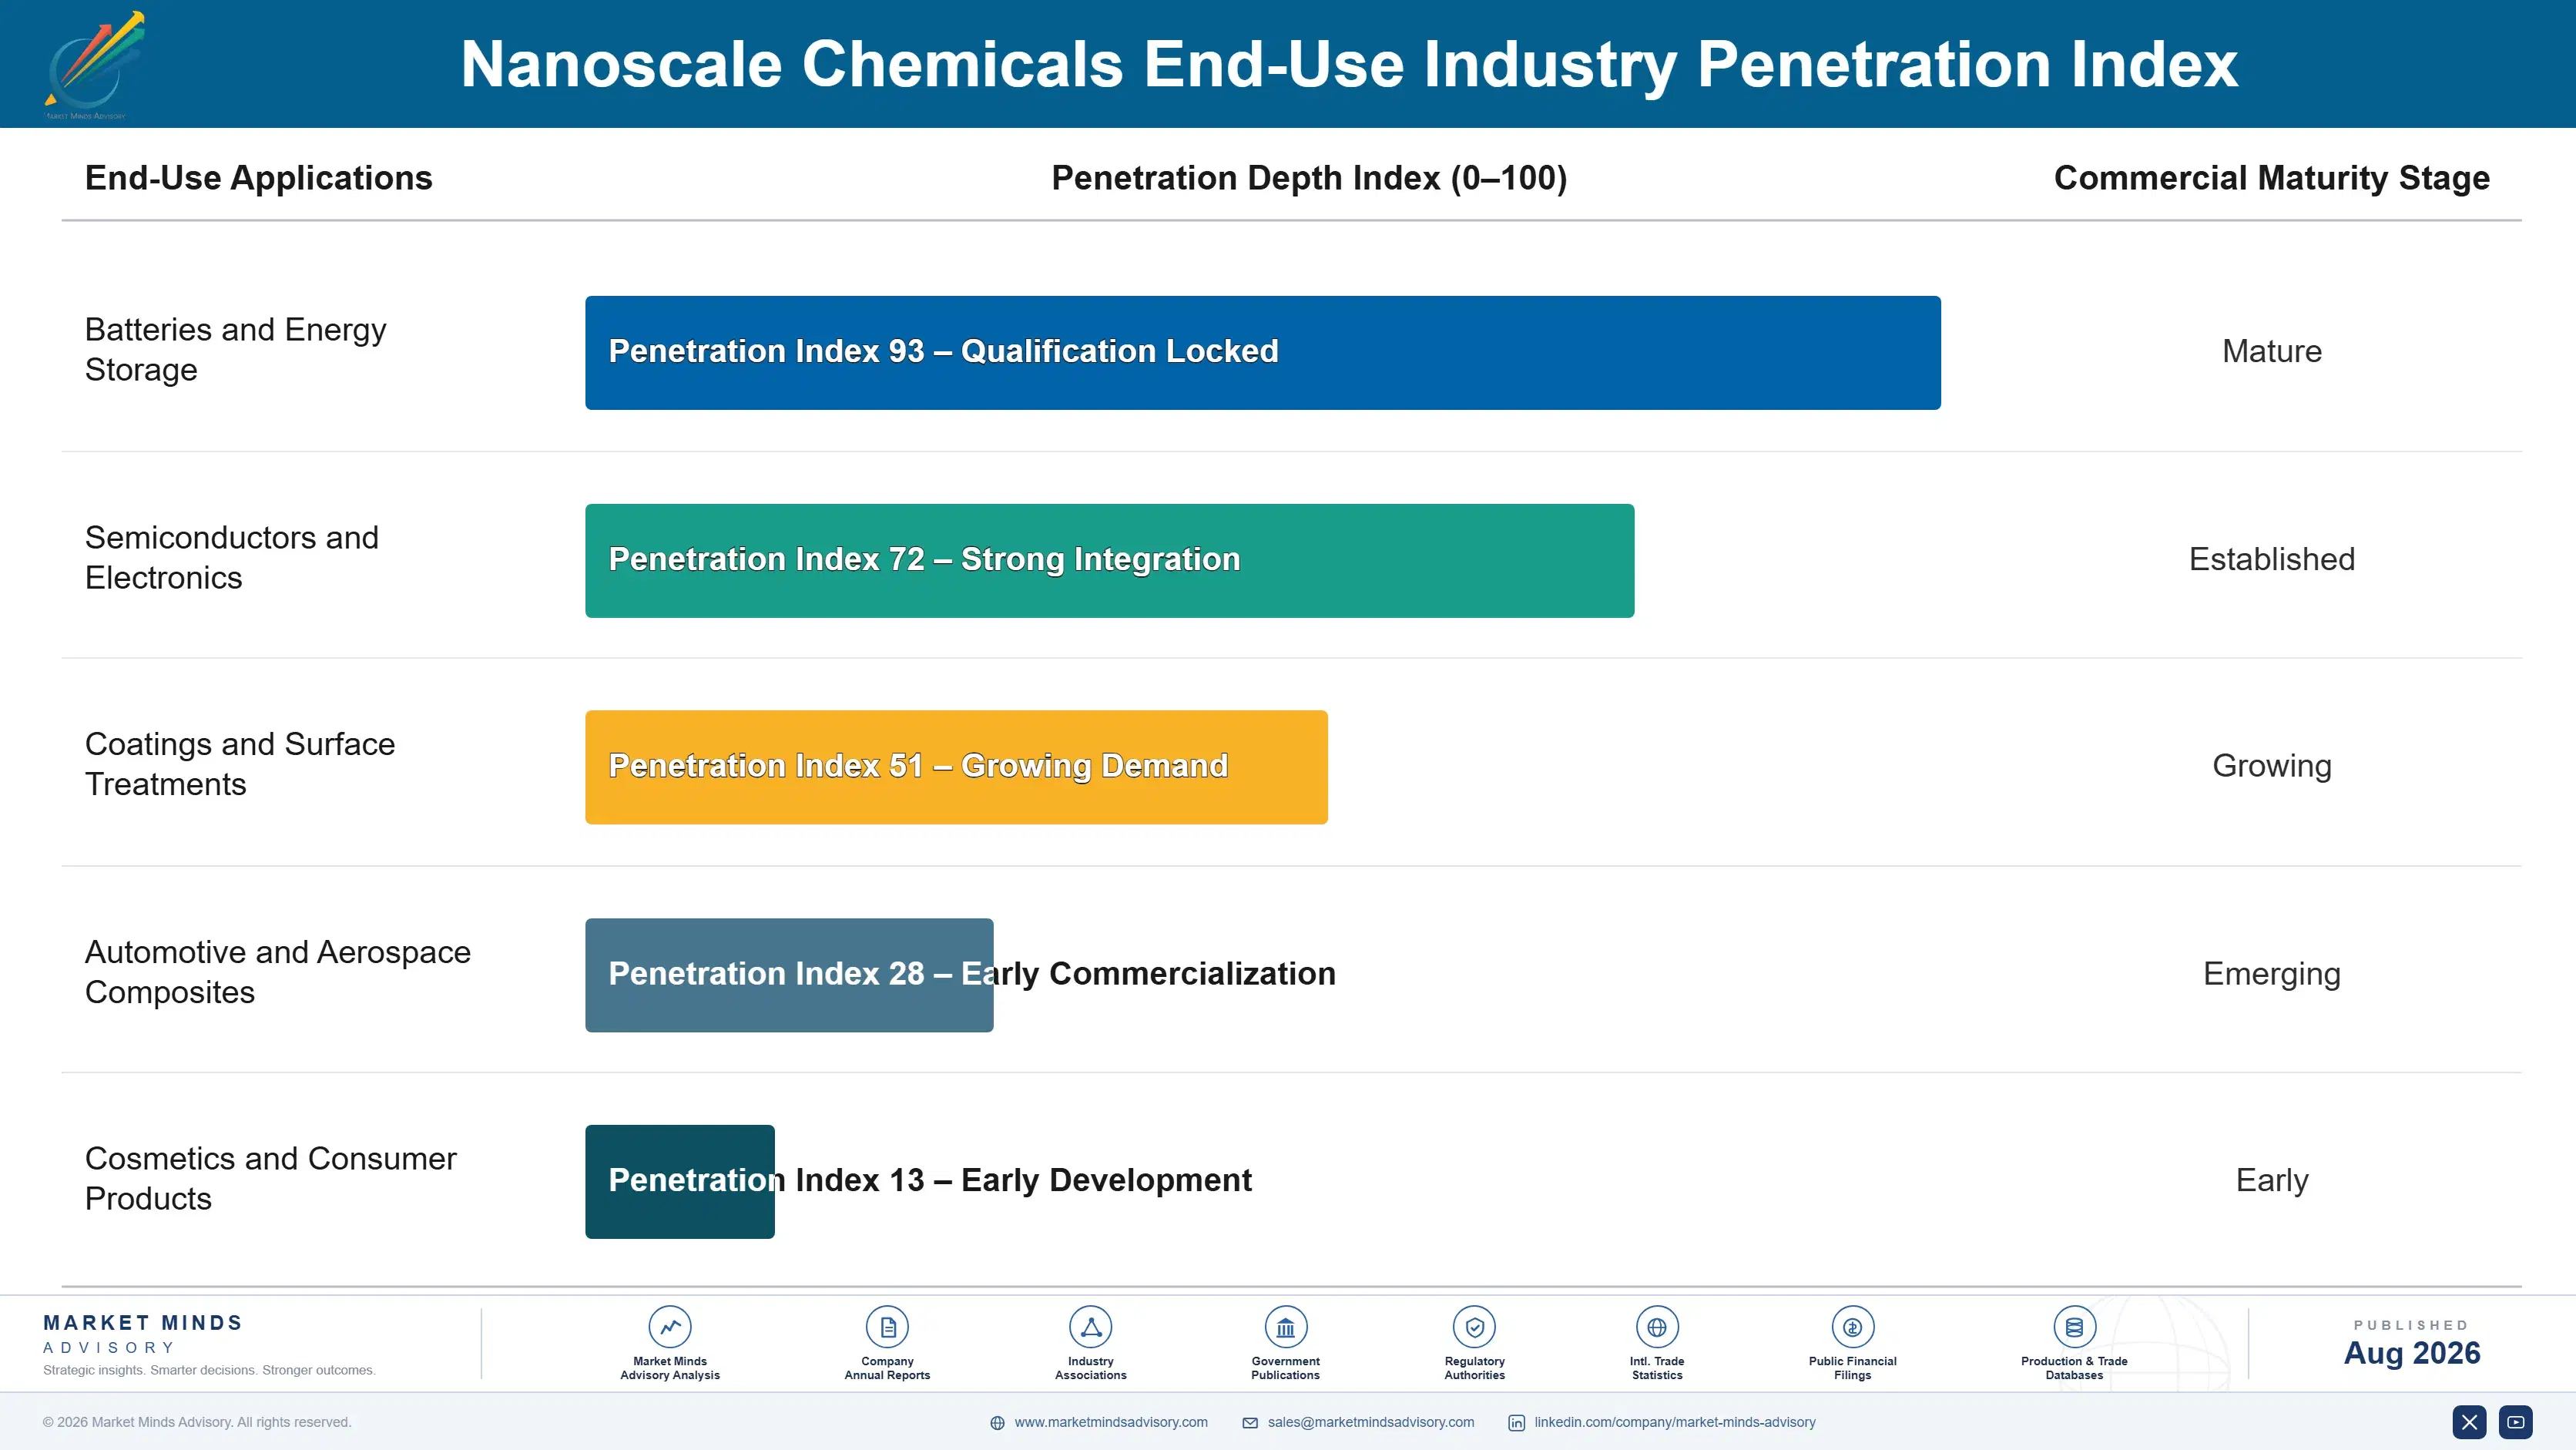
Nanoscale chemical demand behaves like an annuity once a manufacturer completes supplier qualification for a specific application, since switching nanomaterial suppliers requires costly requalification and characterization validation across an entire manufacturing process that most customers strongly prefer to avoid absent a serious quality failure. That qualification lock-in shapes how producers price and structure long-term supply relationships.
Adoption depth varies sharply by end use: battery and semiconductor manufacturers penetrate deepest into documented, characterized supply relationships, often single-sourcing a qualified supplier for years given the substantial requalification cost involved, while coating and consumer product manufacturers adopt more transactionally, switching suppliers more readily based on price. Automotive and aerospace composite applications sit between the two, balancing performance consistency against periodic competitive sourcing reviews.

A generational shift in buyer profiles is underway as younger materials scientists and procurement engineers, increasingly focused on documented performance data and sustainability credentials, demand comprehensive characterization evidence before qualifying a supplier, replacing an older generation that selected suppliers primarily on price and existing relationships. Producers slow to adapt risk losing share to characterization-forward competitors.
nanoscale-chemicals-market-trends-end-use-penetration-index-1787556288032

Where To Focus Capital Next

These are among the four positions where our research anticipates prominent divergence between winners and laggards over the coming forecast period. Each is grounded in the demand model, the regulatory perimeter, and the announced capacity pipeline.
01 / ELECTRONIC MATERIALS INVESTMENT

Prioritise Quantum Dot Capacity Over Commodity Nanoparticle Volume

Quantum dot and precision electronic nanomaterials are growing fastest and carry the category's widest margins, driven by display and semiconductor manufacturers expanding production to meet rising demand for advanced optical and electrical performance across most major electronics markets. Producers that invest in manufacturing scale and characterization infrastructure are capturing this premium demand at a faster rate than competitors still selling commodity nanoparticles without comparable technical sophistication. Capital allocated toward electronic materials manufacturing capacity and characterization systems will likely generate better returns than commodity capacity expansion over the next several years.
02 / BATTERY APPLICATION EXTENSION

Extend Proven Synthesis Technology Into Battery Electrode Materials

Battery manufacturers are scaling nanostructured electrode materials rapidly, and producers with proven nanoparticle synthesis technology in adjacent applications hold a meaningful advantage extending that expertise into battery-grade materials before competitors build comparable capability. This extension requires meaningfully less incremental research investment than developing entirely new synthesis technology from scratch for battery applications specifically. Producers that delay this extension risk ceding fast-growing battery material demand entirely to competitors already building dedicated battery-grade manufacturing capacity and customer qualification relationships.
03 / CHARACTERIZATION INFRASTRUCTURE BUILD-OUT

Build Characterization Capability Ahead Of Tightening Disclosure Rules

Tightening nanomaterial safety disclosure requirements are raising compliance costs across the industry, and producers who build comprehensive characterization infrastructure ahead of regulatory tightening capture value that would otherwise go to independent testing firms while simplifying compliance for customers under regulatory pressure. This capability is already commanding meaningfully higher margins among producers who have built it ahead of the current regulatory tightening cycle. Producers that delay building this capability risk ceding margin expansion opportunity entirely to faster-moving competitors already established with regulatory-conscious customers.
04 / MANUFACTURING SCALE-UP TIMING

Scale Manufacturing Capacity Ahead Of Application Maturation Cycles

Emerging applications like quantum dot displays and silicon anode materials are scaling from niche to mainstream adoption, and producers who invest in commercial-scale manufacturing capacity ahead of full application maturation position themselves to capture disproportionate share and pricing power before competitors build comparable capacity. Early investment requires accepting lower near-term capacity utilization in exchange for established manufacturing relationships once demand scales substantially. Producers that delay this investment risk ceding the most attractive emerging application volume entirely to competitors already positioned with early manufacturing scale and customer relationships.

Engagement Snapshot From the Field

A live engagement with an industry participant carrying material or product regulatory and market exposure ahead of a defining policy shift, showing how our research translates into a defensible multi-year portfolio strategy.
MARKET MINDS ADVISORY · CLIENT ENGAGEMENT SUMMARY
Nanoscale Chemicals Producer Strategic Portfolio Review and Transition Roadmap 2026·Investment Scenario on Nanoscale Chemicals Exposure Evaluation 2025-26
CLIENT PROFILE
The client is a mid-sized battery materials manufacturer supplying electrode materials to three electric vehicle battery producers, representing approximately 4.5 gigawatt-hours of annual battery capacity supplied (client-reported, unverified by MMA). The manufacturer sought to qualify a silicon nanoparticle anode additive supplier to improve energy density beyond its existing conventional graphite-based formulation amid intensifying competitive pressure.
STRATEGIC CHALLENGE
Engineering leadership needed to evaluate competing silicon nanoparticle suppliers against documented energy density improvement, cycling stability, and cost, but lacked internal characterization capacity to independently verify supplier performance claims against the manufacturer's specific electrode formulation requirements.
MMA APPROACH
MMA analysts benchmarked candidate suppliers against documented performance data and characterization results from comparable battery materials manufacturers, modeling expected energy density improvement and cost against qualification timeline across representative formulation scenarios. The engagement combined primary interviews with engineering staff, supplier capability comparison, and analysis against MMA's broader dataset of silicon anode qualification outcomes.
KEY FINDINGS
  1. The recommended supplier's silicon nanoparticle formulation showed documented energy density improvement of roughly 18 percent over the manufacturer's existing graphite formulation, based on published testing data (client-reported, unverified by MMA).
  2. Two of four benchmarked suppliers lacked sufficient production scale to support the manufacturer's full anticipated volume requirements within the planned qualification timeline.
  3. Formulations tested during scheduled product refresh cycles showed lower implementation cost than those requiring dedicated mid-cycle formulation changes and requalification.
  4. The recommended supplier offered technical support for electrode formulation optimization, reducing implementation risk compared with competing proposals lacking equivalent support.
CLIENT PROFILE
The client is a mid-sized battery materials manufacturer supplying electrode materials to three electric vehicle battery producers, representing approximately 4.5 gigawatt-hours of annual battery capacity supplied (client-reported, unverified by MMA). The manufacturer sought to qualify a silicon nanoparticle anode additive supplier to improve energy density beyond its existing conventional graphite-based formulation amid intensifying competitive pressure.
STRATEGIC CHALLENGE
Engineering leadership needed to evaluate competing silicon nanoparticle suppliers against documented energy density improvement, cycling stability, and cost, but lacked internal characterization capacity to independently verify supplier performance claims against the manufacturer's specific electrode formulation requirements.
MMA APPROACH
MMA analysts benchmarked candidate suppliers against documented performance data and characterization results from comparable battery materials manufacturers, modeling expected energy density improvement and cost against qualification timeline across representative formulation scenarios. The engagement combined primary interviews with engineering staff, supplier capability comparison, and analysis against MMA's broader dataset of silicon anode qualification outcomes.
KEY FINDINGS
  1. The recommended supplier's silicon nanoparticle formulation showed documented energy density improvement of roughly 18 percent over the manufacturer's existing graphite formulation, based on published testing data (client-reported, unverified by MMA).
  2. Two of four benchmarked suppliers lacked sufficient production scale to support the manufacturer's full anticipated volume requirements within the planned qualification timeline.
  3. Formulations tested during scheduled product refresh cycles showed lower implementation cost than those requiring dedicated mid-cycle formulation changes and requalification.
  4. The recommended supplier offered technical support for electrode formulation optimization, reducing implementation risk compared with competing proposals lacking equivalent support.
RECOMMENDED STRATEGY
Phase 1: Phase 1 (Months 1 to 6): Qualify the recommended supplier against the manufacturer's highest-volume electrode formulation to validate performance. Phase 2: Phase 2 (Months 7 to 14): Extend qualification to remaining formulations using validated performance data from the initial qualification phase. Phase 3: Phase 3 (Months 15 to 20): Formalise a multi-year supply agreement with pricing terms informed by qualification performance data.
OUTCOME
The manufacturer selected the recommended supplier and completed phased qualification across its electrode formulation portfolio within twenty months. Early production showed meaningful energy density improvement within the first year (client-reported, unverified by MMA), and engineering leadership credited the phased approach with building confidence before full-scale commitment.

Frequently Asked Questions

Foundational context covering the market sizes, CAGR, scope, country, region and competition that inform every finding below. This section is provided to cover basics and most often pre-purchase conversations, answered from the MMA Primary Research Dataset.

What is the current size of the Nanoscale Chemicals Market?

The global nanoscale chemicals market was valued at approximately $8.9 billion in 2025. Demand is driven by battery, semiconductor, and display manufacturing applications extending well beyond coatings and cosmetics.

How large will the Nanoscale Chemicals Market be by 2036?

MMA forecasts the market will reach approximately $29.17 billion by 2036, roughly 2.94 times its 2026 value. Growth is driven by battery electrode materials and quantum dot display adoption.

What is the CAGR for the Nanoscale Chemicals Market 2026 to 2036?

The market is projected to grow at a compound annual growth rate of 11.4 percent between 2026 and 2036. Bull and bear scenarios range from roughly 10.0 to 12.8 percent depending on application scaling pace.

Which segment is growing fastest?

Quantum dots and nanoscale electronic materials are the fastest-growing segment, expanding at approximately 15.5 percent annually, driven by display, battery, and semiconductor manufacturers scaling production.

Who are the major companies in the Nanoscale Chemicals Market?

Leading producers include BASF SE, Evonik Industries, Cabot Corporation, Nanophase Technologies, and American Elements. Competition centers on characterization infrastructure, application diversification, and manufacturing scale.

Which country is growing fastest?

China is the fastest-growing major market, driven by its dominant and rapidly scaling battery and electronics manufacturing base absorbing a growing share of global nanomaterial production and consumption.

Report Segmentation Architecture

The full report scope spans multiple orthogonal segmentation dimensions, with cross-tabulated demand data provided for each dimension pair. Coverage extends further to regional breakdowns, trend trajectories, and the competitive detail needed to support segment-level decision-making.

By Material Type

  • Nanoparticles
  • Carbon Nanomaterials
  • Nanocoatings
  • Nanocomposites
  • Nanocatalysts
  • Quantum Dots and Electronic Materials

By End-Use Industry

  • Batteries and Energy Storage
  • Semiconductors and Electronics
  • Coatings and Surface Treatments
  • Automotive and Aerospace Composites
  • Cosmetics and Consumer Products

By Commercial Dimension

  • Commodity Bulk Supply
  • Certified Specialty Supply
  • Electronic-Grade Precision Supply
  • Characterization and Testing Services

By Region

  • North America
  • Western Europe
  • East Asia
  • South Asia and Pacific
  • Latin America
  • Middle East and Africa
  • Eastern Europe

Scope, Methodology, and Coverage

Every figure in this report is reproducible from documented input assumptions. The scope below maps the historical period, the forecast horizon, the segmentation dimensions, and the countries covered, alongside the underlying primary and qualitative methodology.
Historical Period
2020 to 2025
Forecast Period
2026 to 2036
Base Year
2025 (USD billions; MMA Primary Research Dataset, August 2026)
Market Definition
The nanoscale chemicals market covers engineered materials with at least one dimension between one and one hundred nanometers, including nanoparticles, carbon nanomaterials, nanocoatings, nanocomposites, and quantum dots, used to impart specific optical, electrical, or mechanical properties. It excludes bulk chemical formulations without engineered nanoscale structure.
Quantitative Units
USD billions (current prices); volume in metric tonnes where cited
Segmentation Dimensions
By Material Type; By End-Use Industry; By Commercial Dimension; By Region
Regions Covered
North America, Western Europe, East Asia, South Asia and Pacific, Latin America, Middle East and Africa, Eastern Europe
Countries Covered
USA, China, Germany, France, UK, Japan, South Korea, India, Australia, Canada, Brazil, Mexico, Indonesia, Vietnam, Thailand, Malaysia, UAE, Saudi Arabia, South Africa, Nigeria, Turkey, Poland, Netherlands, Italy, Spain, Sweden, Switzerland, Argentina, Colombia, Singapore, and additional markets relevant to this sector
Key Companies Profiled
BASF SE, Evonik Industries, Cabot Corporation, Nanophase Technologies, American Elements, Merck KGaA, DuPont, 3M, Arkema, Umicore, Nanoco Group, Quantum Materials Corp, NanoXplore, Pixelligent Technologies, Nanografi Nano Technology, US Research Nanomaterials, Strem Chemicals, OCSiAl, Haydale Graphene Industries, Cima NanoTech
Quantitative Methodology
Primary survey, n=3,800 respondents, Q4 2025, six countries; demand-side model with trade association cross-validation
Qualitative Methodology
47 expert interviews, Q4 2025; applied to validate demand model assumptions, identify emerging dynamics, and assess competitive positioning
Report Format
PDF and XLSX data workbook (Word format preview document)
Publisher
Market Minds Advisory
Report Code
MMA-2026-CHM-107
Published
August 2026
Contact
sales@marketmindsadvisory.com | www.marketmindsadvisory.com

Purchase the full Nanoscale Chemicals Market Report (2026 to 2036).

The full report provides a complete quantitative and qualitative assessment of the global nanoscale chemicals market through 2036, including detailed regional sizing across all seven MMA-tracked geographies and material-type segmentation covering nanoparticles, carbon nanomaterials, and quantum dot categories. It profiles twenty leading and emerging producers, benchmarking characterization infrastructure, application diversification, and manufacturing scale across the competitive landscape. The report includes primary survey findings from 3,800 respondents and 47 expert interviews conducted in the fourth quarter of 2025, alongside detailed input cost and precursor supply chain risk analysis. Buyers receive segment-level revenue models, editable data tables, and a structured framework for evaluating producer and market entry decisions.
Seven-region market sizing with material-type revenue breakdowns
Twenty-company competitive profiles with moat and risk analysis
Primary survey data from 3,800 respondents across six countries
Forty-seven expert interviews on application and regulatory trends
Editable data tables for custom scenario and sensitivity modeling
Precursor material cost and supply chain risk assessment

Built For The People Who Decide

From boardroom strategy to bench-side execution, this report is read cover-to-cover by leaders shaping the next decade of their industry, turning demand scenarios, market dynamics and valuation benchmarks into decisions.
CXOs/ Presidents/ VPs/ Managers
M&A and Corporate Development
Strategy Teams and R&D Heads
Procurement and Product Directors
Regulatory and Compliance Leaders
Investor Relations and Equity Analysts