Market Minds Advisory
Nanocellulose Market

Nanocellulose Market: Hornification, freight economics and the captive consumption ceiling to 2036

Fifteen years of capacity announcements have produced plants running at roughly a third of nameplate, because the material cannot be dried without destroying it and cannot be shipped without paying to move water.

Lead Analyst

Bilal Shaikh

Published

September 2026

Make Smarter Decisions with Customized Research Insights

Request a free sample report and evaluate market opportunities, growth trends, and competitive dynamics relevant to your business needs.

2025 MARKET VALUE$0.6BMarket Size 2025
2036 FORECAST VALUE$2.3BBase Case , 2026 to 2036
CAGR 2026 TO 203613.4 %Bull 14.6% / Bear 12.1%
INCREMENTAL OPPORTUNITY$1.6BNet 10- year value creation
EXPANSION MULTIPLE3.52x2036 value over 2026 base
Strategic Levers
M&A Pipeline
Regional Outlook
Country Rankings
Competitive Intelligence
Segmental Deep-dive
Call-Us : 91 93563 13602

Executive Snapshot and Market Trajectory

Nanocellulose leaves the reactor as a slurry at roughly 3% solids, and drying it causes irreversible fibril aggregation that no amount of stirring afterwards reverses. So a producer either ships a tanker that is 97% water, or ships something that no longer performs as specified. Neither option is any good.
That single fact explains almost everything commercially odd about this material. Around 61% of output is consumed captively inside the producer's own paper and board, because moving it anywhere else costs more than the material is worth. Installed plants run at roughly 34% of nameplate. East Asia holds 28% of value on Japanese paper industry investment. Western Europe follows at 26% through integrated Nordic pulp producers.
Biomedical and life science grades compound at 20.1%, half again the market rate of 13.4%, and they escape the constraint entirely because volumes are tiny and pricing runs around forty times industrial levels, which makes freight irrelevant. Five producers hold 38% of supply, and every one of them is a pulp or paper company rather than a chemical specialist. The economics rewarded integration, and integration is what these five already had in place.
Market Definition
This report covers nanocellulose in its principal forms supplied for commercial application, spanning paper and board reinforcement, composites and automotive parts, rheology modifiers and coatings, barrier films and packaging coatings, biomedical and life science, and food and personal care. Volume is measured on a dry solids equivalent basis regardless of the slurry concentration actually shipped, and value at producer level. Excluded are conventional microfibrillated pulp, cellulose derivatives such as CMC and MCC, dissolving pulp, and laboratory research quantities not sold commercially.
Base Year Value
$0.6B in 2025 (MMA Primary Research Dataset, August 2026)
Forecast Period
2026 to 2036, eleven discrete annual values
CAGR
13.4% base case. Bull 14.6%. Bear 12.1%.
Fastest Growth Segment
Biomedical and Life Science: 20.1% CAGR
Fastest Growth Country
China: 16.2% CAGR
Fastest Growth Region
South Asia and Pacific: 15.4% CAGR
Largest Region
East Asia: 28% of 2025 global value
Market Leaders
Nippon Paper Industries, Stora Enso, Borregaard, Oji Holdings and UPM-Kymmene lead the market. Source: MMA Primary Research Dataset, July 2026.
Primary Survey
n=3,800 procurement and R&D decision-makers, Q4 2025, six countries
Methodology
Demand-side build-up, cross-validated against public data, 47 expert interviews

Nanocellulose Market Forecast Scenarios

nanocellulose-market-trends-size-forecast-scenario-1787555836336
Growth ran at 12.2% between 2020 and 2025 from a genuinely small base, and it looked better in press releases than in shipping records. Capacity announcements substantially outran commercial volume throughout the period, which is why installed plants now run at roughly 34% of nameplate. Most of what did sell went into applications close to the production site, since the freight economics permit nothing else at industrial pricing.
The 13.4% base case rests on three mechanisms. Biomedical grades compounding at 20.1% where pricing around forty times industrial levels makes the material's handling problems commercially irrelevant to the buyer. Barrier coatings at 15.6% as European packaging rules push brand owners toward fibre-based packaging that still needs an oxygen barrier. And captive paper reinforcement, which is unglamorous but real and requires no transport whatsoever. Savings there are counted as avoided cost, not revenue.
The 14.6% bull case is a redispersible dry form reaching genuine commercial validation, which would remove the freight constraint and open every application currently priced out by it. The 12.1% bear case is barrier coating losing to competing bio-based films before nanocellulose capacity is qualified into converter processes at scale. Coating line compatibility varies more than suppliers acknowledge publicly.

The Material That Cannot Travel

Every commercial peculiarity in this market traces to one physical property. Nanocellulose is produced as a slurry at roughly 3% solids, and drying it drives the fibrils into irreversible contact so they aggregate and will not redisperse to their original state. The material that comes back from drying is not the material that went in. A producer therefore ships a tanker of which 97% is water, or ships something that has lost the surface area the customer was buying.
TOP-FIVE CONCENTRATION38%Combined position across supply held by the leading producers
TYPICAL SLURRY SOLIDS3%Concentration at which most material leaves the production site
CAPTIVE CONSUMPTION SHARE61%Portion consumed inside the producer's own paper and board
NAMEPLATE UTILISATION34%Share of installed production capacity actually running most years
FREIGHT COST SHARE28%Portion of delivered cost attributable to moving water around
BIOMEDICAL PRICE PREMIUM40xMultiple over industrial grade pricing for life science material
The commercial consequence is a market that is genuinely local rather than global. Around 61% of output never leaves the site, going straight into the producer's own paper and board where it raises strength and permits basis weight reduction. That application is unexciting and it works. Freight accounts for roughly 28% of delivered cost for anybody buying at industrial pricing, which quietly eliminates most of the applications that fifteen years of conference presentations promised.
Where price is high enough, none of this matters. Biomedical grades sell at around forty times industrial levels for gram quantities into cell culture scaffolds and wound care, and that segment compounds at 20.1%. Freight simply disappears against a price like that.
"This industry has spent fifteen years announcing capacity for a material it cannot economically move. The plants running well are the ones inside a paper mill that consumes their output on site, and nobody wants to say that because it is a much smaller story than the one that raised the money."
Principal, Biomaterials and Speciality Fibres Practice · MMA Chemicals and Materials Practice · August 2026

Market Trends

Producers retreat toward captive consumption inside their own mills

Around 61% of nanocellulose output is now consumed inside the producing company's own paper and board operations, raising sheet strength and permitting basis weight reduction that saves fibre. That share has risen rather than fallen as merchant ambitions met freight arithmetic, since shipping a 3% solids slurry costs more than the material is worth at industrial pricing. Commercially this means capacity is being justified on internal fibre savings rather than external sales, which is a far smaller and far more defensible business than the one originally presented to investors. Investors were not told the arithmetic in those terms.
Market Impact: Segment compounds at 15.6% annually
Biomedical grades escape the freight constraint through pricing

Life science applications including cell culture scaffolds, wound dressings and tissue engineering matrices buy nanocellulose in gram and kilogram quantities at roughly forty times industrial grade pricing, which renders freight cost entirely immaterial to the transaction. Growth at 20.1% is the fastest in the market and it comes from a base so small that percentage terms overstate the absolute opportunity considerably. Purity, endotoxin control and batch consistency govern qualification rather than price. Producers organised around tonnes struggle to serve customers who order in grams and audit everything. Regulatory documentation matters more than any tonnage capability.
Market Impact: Underpins 28% of global value

Market Opportunities and Growth Drivers

European packaging rules push barrier coatings onto fibre substrates

European packaging and packaging waste requirements push brand owners toward fibre-based packaging that must still keep oxygen out, and polyethylene or aluminium layers compromise recyclability in exactly the way the rules target. Nanocellulose coatings deliver genuine oxygen barrier while remaining repulpable with the paper beneath them. Growth at 15.6% follows regulation rather than cost, since the coating is more expensive than the plastic it replaces. Converter qualification is the constraint, and it is slower than brand owner enthusiasm suggests to anybody reading announcements. Repulpability testing decides whether the format qualifies at all.
Market Impact: Adds 28% freight cost burden

Japanese industrial policy funds sustained nanocellulose development

Japanese government support through METI has funded nanocellulose development consistently for over a decade, covering plant construction, automotive component demonstration and standards work in a way no other country has matched. Nippon Paper, Oji and Daio all operate production as a result. That support explains why East Asia holds 28% of value despite the underlying applications being no more attractive in Japan than elsewhere. Policy rather than demand built this position, which makes it durable while support continues and questionable if it stops. Standards work is the most durable output so far.
Market Impact: Plants run at 34% of nameplate

Market Restraints and Challenges

Hornification prevents drying and redispersion of the material

Drying nanocellulose drives fibrils into irreversible hydrogen bonded contact, and the aggregated material will not redisperse to its original surface area no matter how it is treated afterwards. The root cause is the enormous surface area that makes the material useful in the first place, which is precisely what makes drying destructive. Commercially this forces slurry shipment at roughly 3% solids with freight at 28% of delivered cost. Producers are exploring carboxymethylation, sugar additives and never-dried spray routes, none yet validated at genuine commercial scale. The problem has resisted solution for roughly 15 years now.
Market Impact: Reaches 61% captive consumption

Announced capacity outruns commercial demand by a wide margin

Installed nanocellulose plants run at roughly 34% of nameplate capacity, the accumulated result of fifteen years in which capacity was announced against projected applications rather than contracted volume. The root cause is that early demonstration plants were funded by governments and parent paper companies on strategic grounds where commercial discipline was weaker than it would otherwise be. Commercially this suppresses pricing and deters new entrants. Producers are responding by redirecting output into captive paper use, which fills reactors without requiring anybody to buy anything. Announced figures still circulate as though they represented real output.
Market Impact: Prices around 40 times industrial grades
4 additional market trends, 3 additional growth drivers, and 2 additional restraints and challenges are covered in the full report. Contact sales@marketmindsadvisory.com to access the complete intelligence.

Segment CAGR and Growth Architecture

Volume is classified here by application, since freight economics rather than production route decide which uses are commercially reachable and which remain permanently theoretical at industrial pricing levels. Nanocellulose form, production feedstock and supply arrangement are each handled separately in the framework below, because one grade frequently serves several different applications without any modification at all.
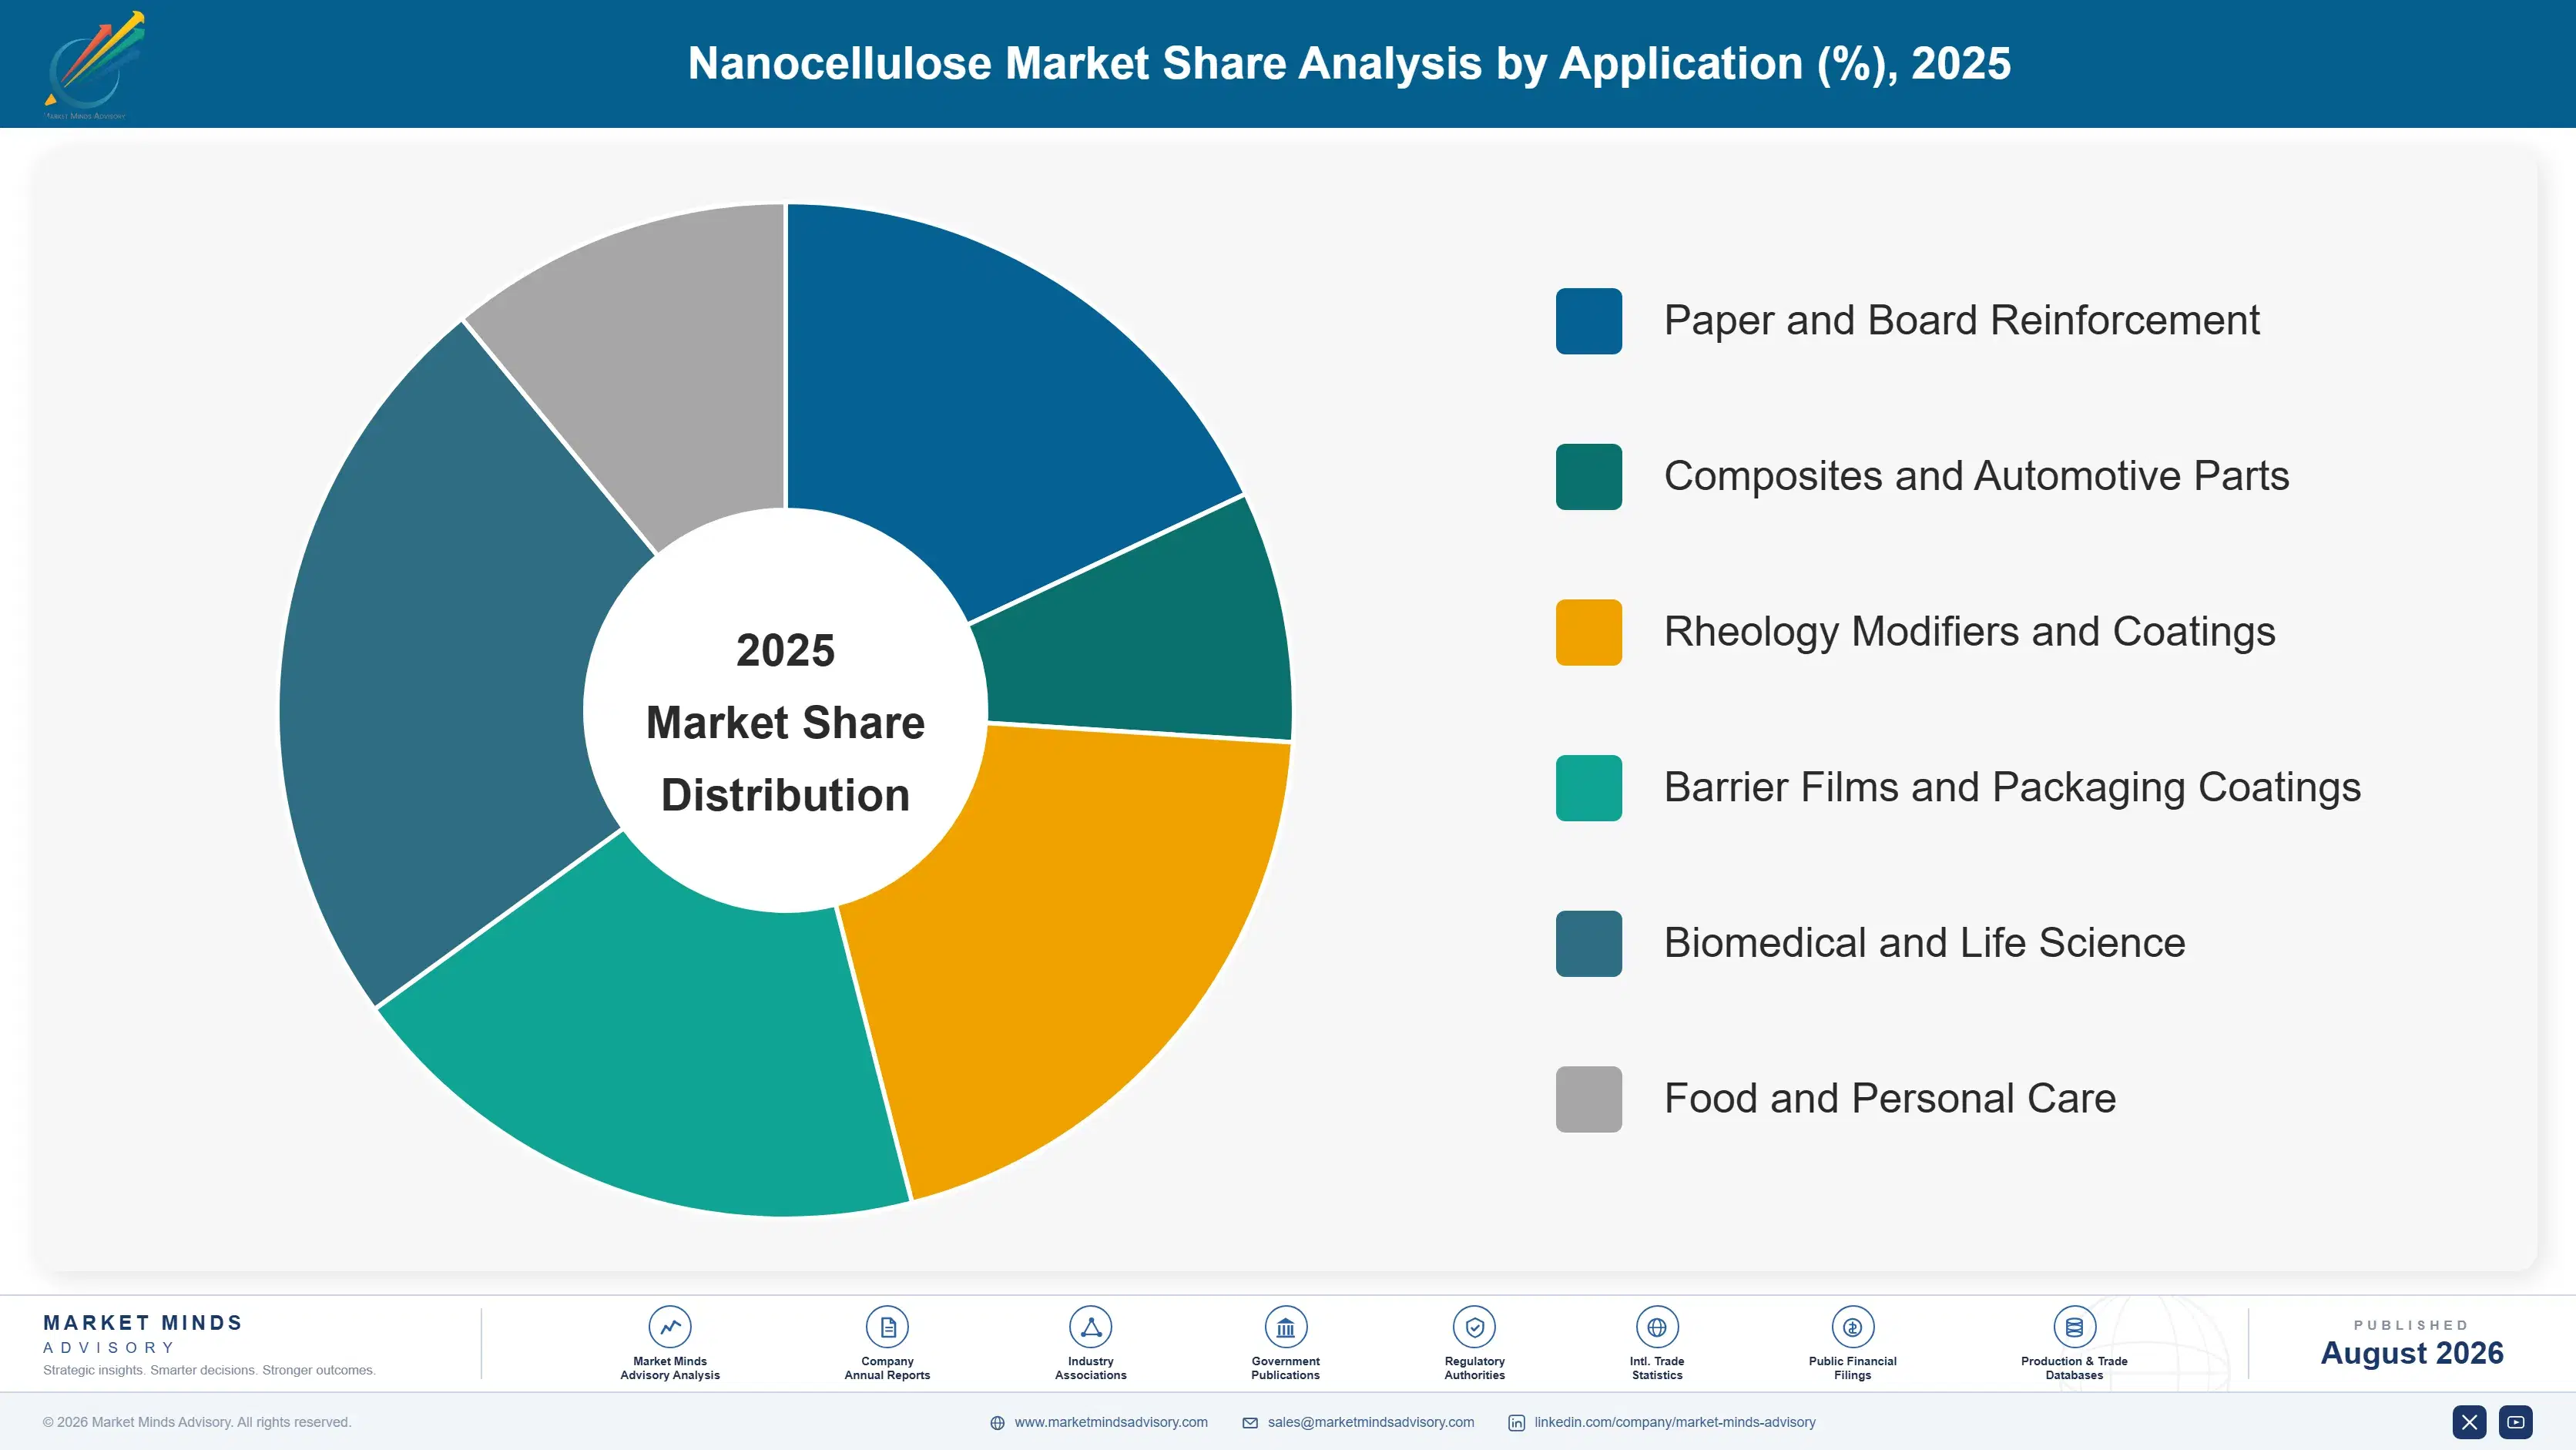
nanocellulose-market-trends-market-share-analysis-1787555836903

Biomedical and Life Science

Growing at 20.1%, half again the market rate, this segment covers cell culture scaffolds, wound dressings, tissue engineering matrices and diagnostic supports, and it exists commercially because pricing at roughly forty times industrial levels makes the material's handling economics entirely irrelevant. A customer ordering grams does not care what a tanker of slurry would cost to move. Qualification runs on purity, endotoxin control and batch-to-batch consistency rather than on price at all, and it takes years. The absolute opportunity is far smaller than the growth rate suggests, and producers organised around tonnage struggle genuinely with customers who audit everything and order almost nothing. Regulatory filings referencing a specific grade make these relationships extraordinarily durable once won.
CAGR 20.1%

Barrier Films and Packaging Coatings

European packaging rules push brand owners toward fibre-based packaging that must still exclude oxygen, and the polyethylene or aluminium layers conventionally providing that barrier compromise recyclability precisely as the regulation intends. Nanocellulose coatings deliver real oxygen barrier while remaining repulpable with the substrate beneath, which is the whole commercial argument. Growth at 15.6% follows regulation rather than cost, since the coating is more expensive than what it replaces. Converter qualification is the genuine constraint here, moving considerably slower than brand owner announcements imply, and coating line compatibility varies more than suppliers admit publicly. Repulpability testing decides whether a coated format qualifies as fibre-based at all, which is the entire regulatory point.
CAGR 15.6%
Full segment breakdown across 6 segments available in the complete report.

Regional Architecture and Country Demand Map

East Asia holds 28% of value on a decade of Japanese industrial policy rather than on any underlying demand advantage. Western Europe follows at 26% through Nordic pulp producers with genuinely integrated positions. Government funding rather than commercial demand has built most of this particular map.

East Asia

Japanese industrial policy through METI has funded nanocellulose development consistently for more than a decade, covering plant construction, automotive demonstration components and standards work at a level no other country has approached. Nippon Paper, Oji Holdings and Daio Paper all operate production because of it. Chinese producers are scaling rapidly from a later start, driven by paper industry investment and by packaging barrier applications, with country growth at 16.2% leading the world. Korean interest concentrates in electronics and separator applications. Growth at 14.4% reflects policy continuation and Chinese entry together rather than any demand advantage. Captive consumption inside Japanese board operations absorbs most domestic output. Merchant volumes remain small relative to installed nameplate capacity across the region.
Share: 28% | CAGR: 14.4% (2026 to 2036)

Western Europe

Nordic pulp producers hold the strongest integrated positions anywhere, with Stora Enso, UPM and Borregaard each operating production alongside the pulp mills that supply the feedstock and frequently consume the output. That integration is precisely what the freight economics reward, since captive use avoids the transport problem entirely. European packaging regulation drives barrier coating interest more strongly here than in any other region, though converter qualification remains slow. Biomedical grades from UPM serve life science customers across the continent. Growth at 11.8% is the slowest here despite the strongest positions, reflecting a mature paper base. Hydroelectric power access gives Nordic producers a permanent energy cost advantage that grid-powered competitors cannot close.
Share: 26% | CAGR: 11.8% (2026 to 2036)
Regional intelligence for 5 additional markets available in the complete report: North America, South Asia and Pacific, Latin America, Middle East and Africa, Eastern Europe. Contact sales@marketmindsadvisory.com.
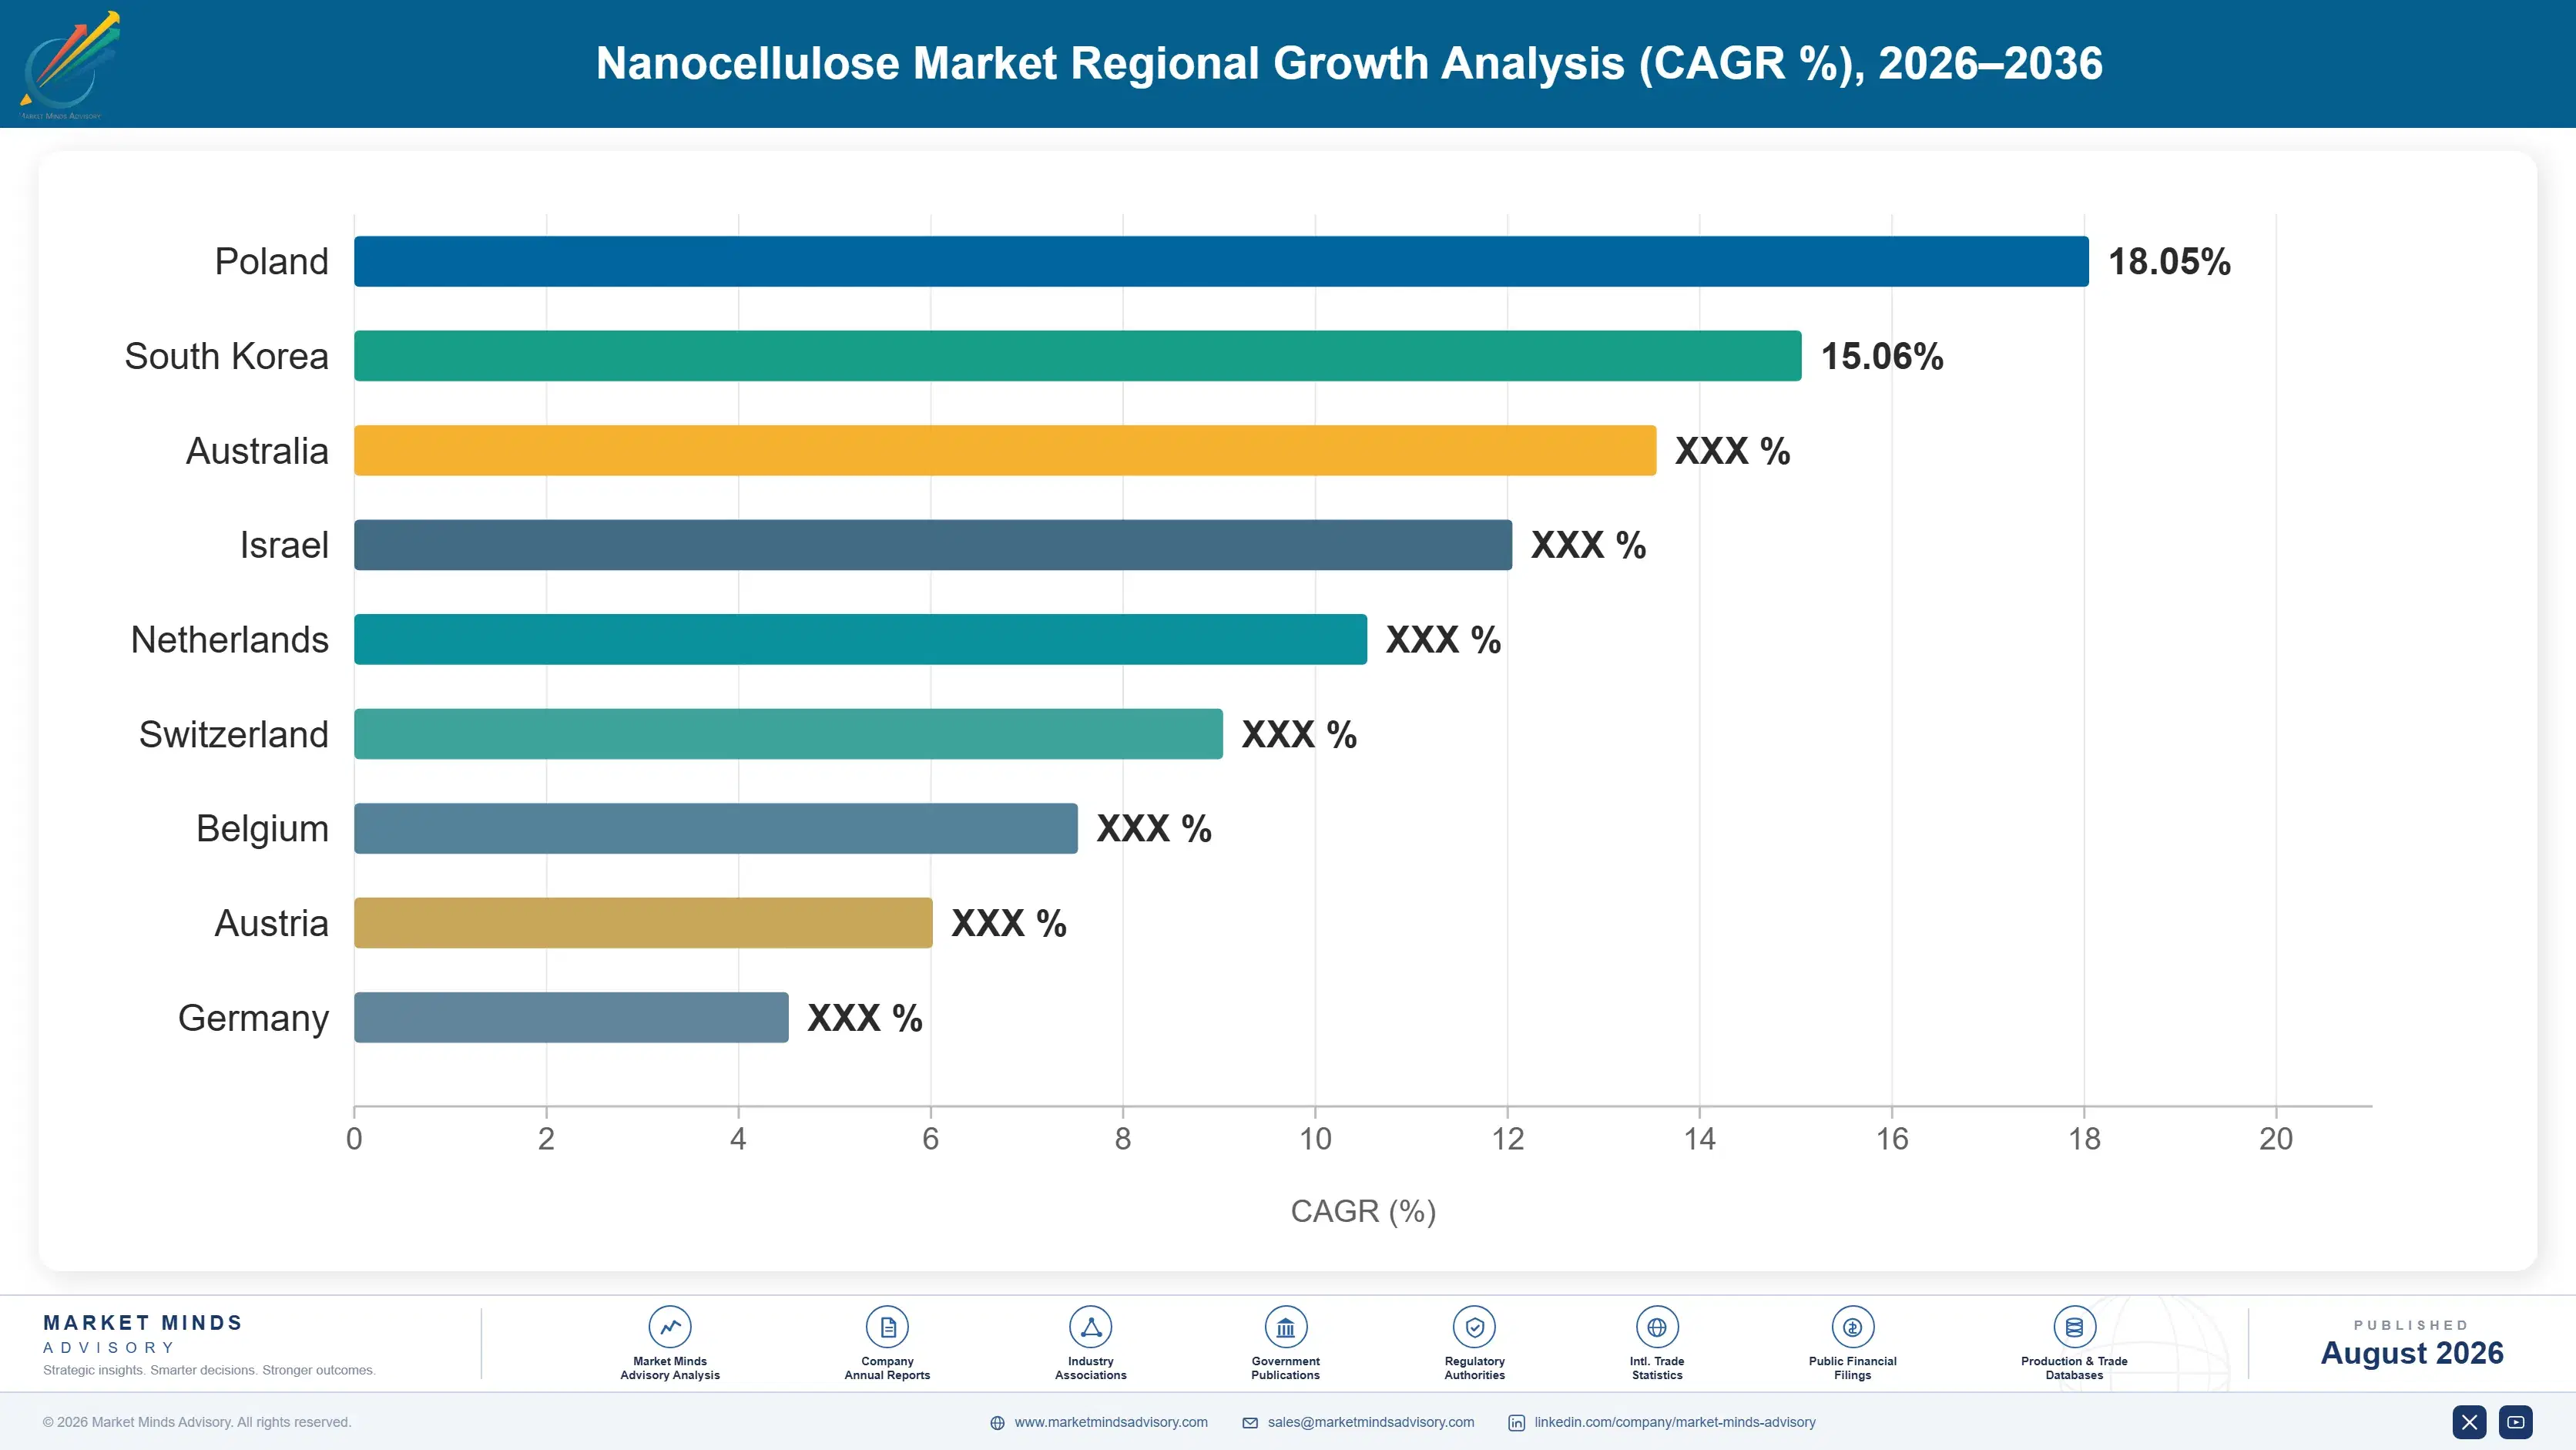
nanocellulose-market-trends-country-cagr-analysis-1787555837437

Where Nanocellulose Value Actually Lands

Four moves matter for a material that cannot be dried without damage and cannot be shipped any distance without paying to move water. Two of them accept the freight constraint and deliberately build inside it, and one attacks it directly. The fourth concerns the single application where price makes the whole problem simply disappear.

Justify capacity on captive fibre savings first

Around 61% of nanocellulose output is consumed inside the producer's own paper and board, raising strength enough to permit basis weight reduction that saves purchased fibre. That saving is real, requires no customer, and involves no freight at all. Plants justified this way run while plants justified on projected merchant sales sit at roughly 34% of nameplate. It is a smaller business than the one presented to investors fifteen years ago, and it is the one that actually operates every day. Board approval is far easier for a fibre saving than a sales forecast.
Market Impact: Loads reactors using 61% captive internal consumption today

Serve biomedical customers with grams, not tonnes

Life science buyers pay roughly forty times industrial pricing for gram quantities into scaffolds, wound care and diagnostics, which makes freight cost a rounding error rather than a constraint. Growth at 20.1% is the fastest here. The commercial requirement is purity documentation, endotoxin control and batch consistency rather than volume capability, and it demands a quality system a pulp mill does not have. Producers who treat this as a small tonnage opportunity rather than a different business consistently fail to qualify with the customers that matter. Endotoxin documentation is the practical barrier, not production.
Market Impact: Serves grades priced 40 times above industrial levels

Site production inside the customer's converting operation

Freight at 28% of delivered cost disappears when the slurry travels metres rather than kilometres, which argues for production units installed at large converting or coating sites instead of centralised plants shipping outward. Several producers have begun offering exactly this arrangement. It shifts capital and complexity onto the customer and it is the only configuration that makes industrial pricing work at distance. Centralised merchant plants shipping water across a continent have already demonstrated what happens, repeatedly and expensively. The arrangement suits large coating operations and nobody else at all. Qualification timelines still apply.
Market Impact: Removes 28% of delivered cost from freight alone

Fund redispersion work as an option, not a plan

Carboxymethylation, sugar additive protection and never-dried spray routes all aim at a dry form that redisperses to original surface area, and none has been validated at genuine commercial scale despite around 15 years of effort. Success would remove the freight constraint entirely and change the market's shape completely. Failure changes nothing about a business already built on captive use. Funding it as an option carried alongside a working captive business is rational, and building a commercial plan that assumes it is not. Several producers have quietly written off attempts already.
Market Impact: Addresses roughly 15 years of unsuccessful redispersion attempts

Who Controls the Margin Pool

Five producers hold 38% of supply measured on dry solids equivalent tonnage, the basis used throughout this section regardless of the slurry concentration actually shipped. Every one of them is a pulp or paper company rather than a chemical specialist, which is not coincidence. Feedstock access, existing mill infrastructure and somewhere to consume the output captively are what make the economics work at all.
Competition runs on three dimensions. Proximity to the consuming application, which decides whether industrial pricing is even arithmetically possible. Grade capability spanning fibrillated, crystalline and bacterial forms, since applications differ genuinely in what they require. And quality systems for biomedical supply, where documentation rather than any production skill governs qualification entirely. Nobody competes meaningfully on production cost, because utilisation dominates it so completely.

Rankings shift toward producers with genuine biomedical quality systems and toward those siting production inside converting operations rather than shipping outward. Japanese positions depend on continued policy support that nobody can guarantee indefinitely. Nordic producers hold the strongest integration and the cheapest power. Crystalline nanocellulose specialists remain most exposed to the freight problem that fibrillated producers solve captively.
nanocellulose-market-trends-company-positioning-matrix-1787555837962

Competitive Moat and Risk Dimensions

NIPPON PAPER INDUSTRIES

Moat: Japanese policy and scale

The company operates the deepest production position in Japan, built on more than a decade of consistent METI support covering plant construction, automotive demonstration and standards development. It consumes material captively across its own paper and board operations, which avoids the freight problem entirely and keeps reactors loaded without requiring any merchant customer to appear.
NIPPON PAPER INDUSTRIES

Risk: Policy dependence and domestic concentration

The position rests on industrial policy rather than on demand that would exist without it, and Japanese paper consumption is declining with population and digitisation. Export sales face the same freight arithmetic as everyone else. Producers building around biomedical quality systems or converter-sited production have paths that do not depend on any government continuing to fund the sector.
STORA ENSO

Moat: Integrated Nordic pulp position

Production sits alongside pulp mills supplying the feedstock and paperboard operations consuming the output, which is precisely the configuration freight economics reward. The company also holds real packaging barrier capability at a moment when European rules are pushing brand owners toward fibre-based formats that still need oxygen exclusion, and its converter relationships are direct.
STORA ENSO

Risk: Slow converter barrier qualification

Barrier coating growth at 15.6% depends on converters qualifying nanocellulose onto existing coating lines, and that process runs considerably slower than brand owner announcements suggest. Competing bio-based barrier materials are qualifying in parallel. A mature European paper base also limits captive volume growth relative to producers in expanding Asian markets.

Players Tracked

Prominent Players

Nippon Paper Industries
Stora Enso
Borregaard
Oji Holdings
UPM-Kymmene

Other Key Players

Daio Paper
Sappi
CelluForce
GranBio
Kruger
FiberLean Technologies
Melodea
Norske Skog
Suzano
Anomera
CelluComp
Blue Goose Biorefineries
Weidmann Fiber Technology
Nippon Shokubai
Chuetsu Pulp and Paper

Recent Developments

FEBRUARY 2025

A Nordic producer qualified barrier coating with a converter

A Nordic nanocellulose producer completed oxygen barrier coating qualification with a European packaging converter, following coating line trials that ran considerably longer than initially projected. This was a commercial qualification and supply arrangement rather than any joint venture or equity transaction. Repulpability testing formed part of the qualification.
Signal: Converter qualification remains the genuine constraint on barrier growth, and timelines consistently exceed what brand owner announcements imply
JUNE 2025

A Japanese producer redirected output toward captive board use

A Japanese producer shifted nanocellulose output away from merchant sales toward strength addition in its own paperboard, citing basis weight reduction economics. This was an internal allocation decision rather than any capacity change, acquisition or partnership with another company. Merchant customers beyond the region were served less than before.
Signal: Captive consumption keeps rising as merchant freight arithmetic proves unworkable at industrial pricing across any real distance
OCTOBER 2025

A biomedical supplier expanded life science grade capacity modestly

A European producer expanded dedicated life science grade capacity with associated purity and endotoxin documentation systems, serving cell culture and wound care customers ordering in gram quantities. This was organic capital investment rather than any acquisition or joint venture arrangement. Production volumes involved remain very small indeed.
Signal: Biomedical qualification depends on documentation systems rather than production scale, which pulp producers have systematically underestimated throughout

What Drives Producer Economics

Pulp feedstock is remarkably cheap relative to the finished material and accounts for only around 12% of production cost. Energy dominates instead at roughly 34%, because mechanical fibrillation is genuinely energy intensive and enzymatic or chemical pretreatment only reduces it partially. Capital recovery on plants running at 34% of nameplate is the largest cost of all, and it is a utilisation problem rather than an input problem.
European industrial energy costs rose sharply through 2022 and IEA data show them far above Asian and North American levels for an extended period, which hit mechanical fibrillation economics directly. Stora Enso recorded elevated energy costs across its operations in its Annual Report 2022. Nordic producers with hydroelectric access fared considerably better than those on grid power, and that difference persists as a permanent regional cost distinction.

The disadvantage mechanism is utilisation rather than input pricing, which is unusual and consistently misread. A plant running at a third of nameplate carries the same capital charge as one running full, spread across a third of the tonnes. Captive consumers avoid this by filling reactors with internal demand. Merchant producers dependent on external sales carry the full penalty, and no procurement skill addresses it.
nanocellulose-market-trends-cost-volatility-analysis-1787555838157

Load reactors with captive demand before pursuing merchant sales

Capital recovery across plants running at roughly 34% of nameplate is the dominant cost in this business and it responds to volume rather than to any procurement action. Internal paper and board consumption fills reactors without requiring a customer to be found or a tanker to be moved. Merchant sales then price against a loaded plant.

Site fibrillation where low-cost renewable power is available

Mechanical fibrillation consumes roughly 34% of production cost as energy, which makes power price a first-order siting decision rather than a secondary one. Nordic hydroelectric access produces a permanent advantage over grid-powered plants that no operating improvement closes. Producers siting on cheap firm renewable power lock in a cost position lasting the asset's life.

Apply enzymatic pretreatment to cut fibrillation energy demand

Enzymatic and carboxymethylation pretreatment reduce the mechanical energy required to reach target fibrillation, cutting the largest variable cost meaningfully though not eliminating it. Chemical and enzyme cost offsets part of the saving, so the net benefit varies with power price. Producers on expensive grid power gain most, and those on cheap hydro sometimes gain nothing at all.

Portfolio Architecture for Margin Defence

Margin here is decided by proximity and price point rather than by production capability, which inverts how most materials businesses work. Industrial fibrillated grades sold merchant at distance frequently run at negative contribution once freight at 28% of delivered cost is counted honestly. Captive paper reinforcement earns its return as avoided fibre purchase rather than as revenue at all. Barrier coating grades run at moderate margins. Biomedical grades at roughly forty times industrial pricing run higher than anything else in speciality materials.
The tension is that volume ambition and margin sit in opposite directions here more sharply than almost anywhere. Filling a reactor means captive paper use, which generates savings rather than sales. Earning real margin means biomedical, which consumes almost no capacity and demands a quality system a pulp mill has never needed. Producers pursuing both without acknowledging the conflict tend to underinvest in documentation while overinvesting in tonnes.

High-value pools sit in biomedical grades, in barrier coatings once converters qualify, and in captive fibre savings. Merchant industrial supply across distance is where the money has been lost repeatedly for fifteen years now. Fifteen years of evidence on that point is now available to anyone willing to read it.

Volume / Commodity-Adjacent

Merchant industrial fibrillated grades competing on delivered cost with freight at 28% of it. The thirteen-point range separates producers shipping within a hundred kilometres from those attempting genuine continental distribution economics.
Gross Margin: 5%-18%

Premium / Certified

Barrier coating grades and rheology modifiers where performance rather than price governs selection and converter qualification creates real switching cost. The sixteen-point spread reflects how far qualification has progressed with each individual customer.
Gross Margin: 22%-38%

Sustainability / Regulatory / Next-Generation

Biomedical and life science grades at roughly forty times industrial pricing. The twenty-seven-point range is wide because purity documentation, endotoxin control and regulatory support vary enormously between suppliers and buyers pay entirely for those.
Gross Margin: 45%-72%
nanocellulose-market-trends-portfolio-architecture-1787555838661

High-value Sub-segments and Strategic Watch-out

Biomedical and Life Science

Compounding at 20.1% at roughly forty times industrial pricing, where freight becomes irrelevant and documentation governs everything. The absolute opportunity is far smaller than the growth rate implies, and qualification takes years rather than months to complete. Pulp quality systems do not extend to it.
Gross Margin: 48%-72%

Packaging Barrier Coatings

Growing at 15.6% on European fibre-based packaging rules requiring recyclability that polyethylene and aluminium layers defeat. Converter qualification is the constraint and it moves considerably slower than brand owner announcements have consistently suggested it would. Competing bio-based barrier materials are qualifying in parallel with it.
Gross Margin: 24%-38%

Captive Paper Reinforcement

The reactor volume at 61% of output, earning its return as avoided fibre purchase rather than as revenue. Unexciting, requiring no customer and no freight, and the reason plants that run at all keep running. Value shows up as avoided purchase, never as top line.
Gross Margin: 12%-24%

Redispersible Dry Forms

Roughly 15 years of carboxymethylation, sugar protection and spray drying work without commercial validation at scale. Success would remove the freight constraint entirely, and the range reflects that nothing here is yet proven commercially anywhere. Fund this as an option rather than as any kind of plan.
Gross Margin: 0%-30%

How Demand Actually Renews

Demand renews on two entirely different clocks and conflating them has misled this industry for years. Captive paper reinforcement renews continuously with the producer's own board output and requires no purchasing decision from anybody. Merchant demand renews only when a converter or formulator requalifies, which happens rarely and slowly. Reporting both as one market has produced growth figures that describe internal transfers as commercial adoption.
Stickiness runs almost entirely through qualification depth by vertical. A biomedical customer with regulatory filings referencing a specific grade cannot switch without repeating validation work, which makes those relationships extraordinarily durable despite tiny volumes. A packaging converter that has tuned coating lines to one supplier's rheology faces months of retrials. Paper mills using their own material face no switching question whatsoever.

The buyer has shifted from research director to plant manager and procurement, and that has been uncomfortable for producers accustomed to selling potential. Early demand came from corporate research budgets evaluating a promising material. It now comes from operations people asking what it costs delivered and whether the coating line runs at full speed. That is a harder sale and a more honest one.
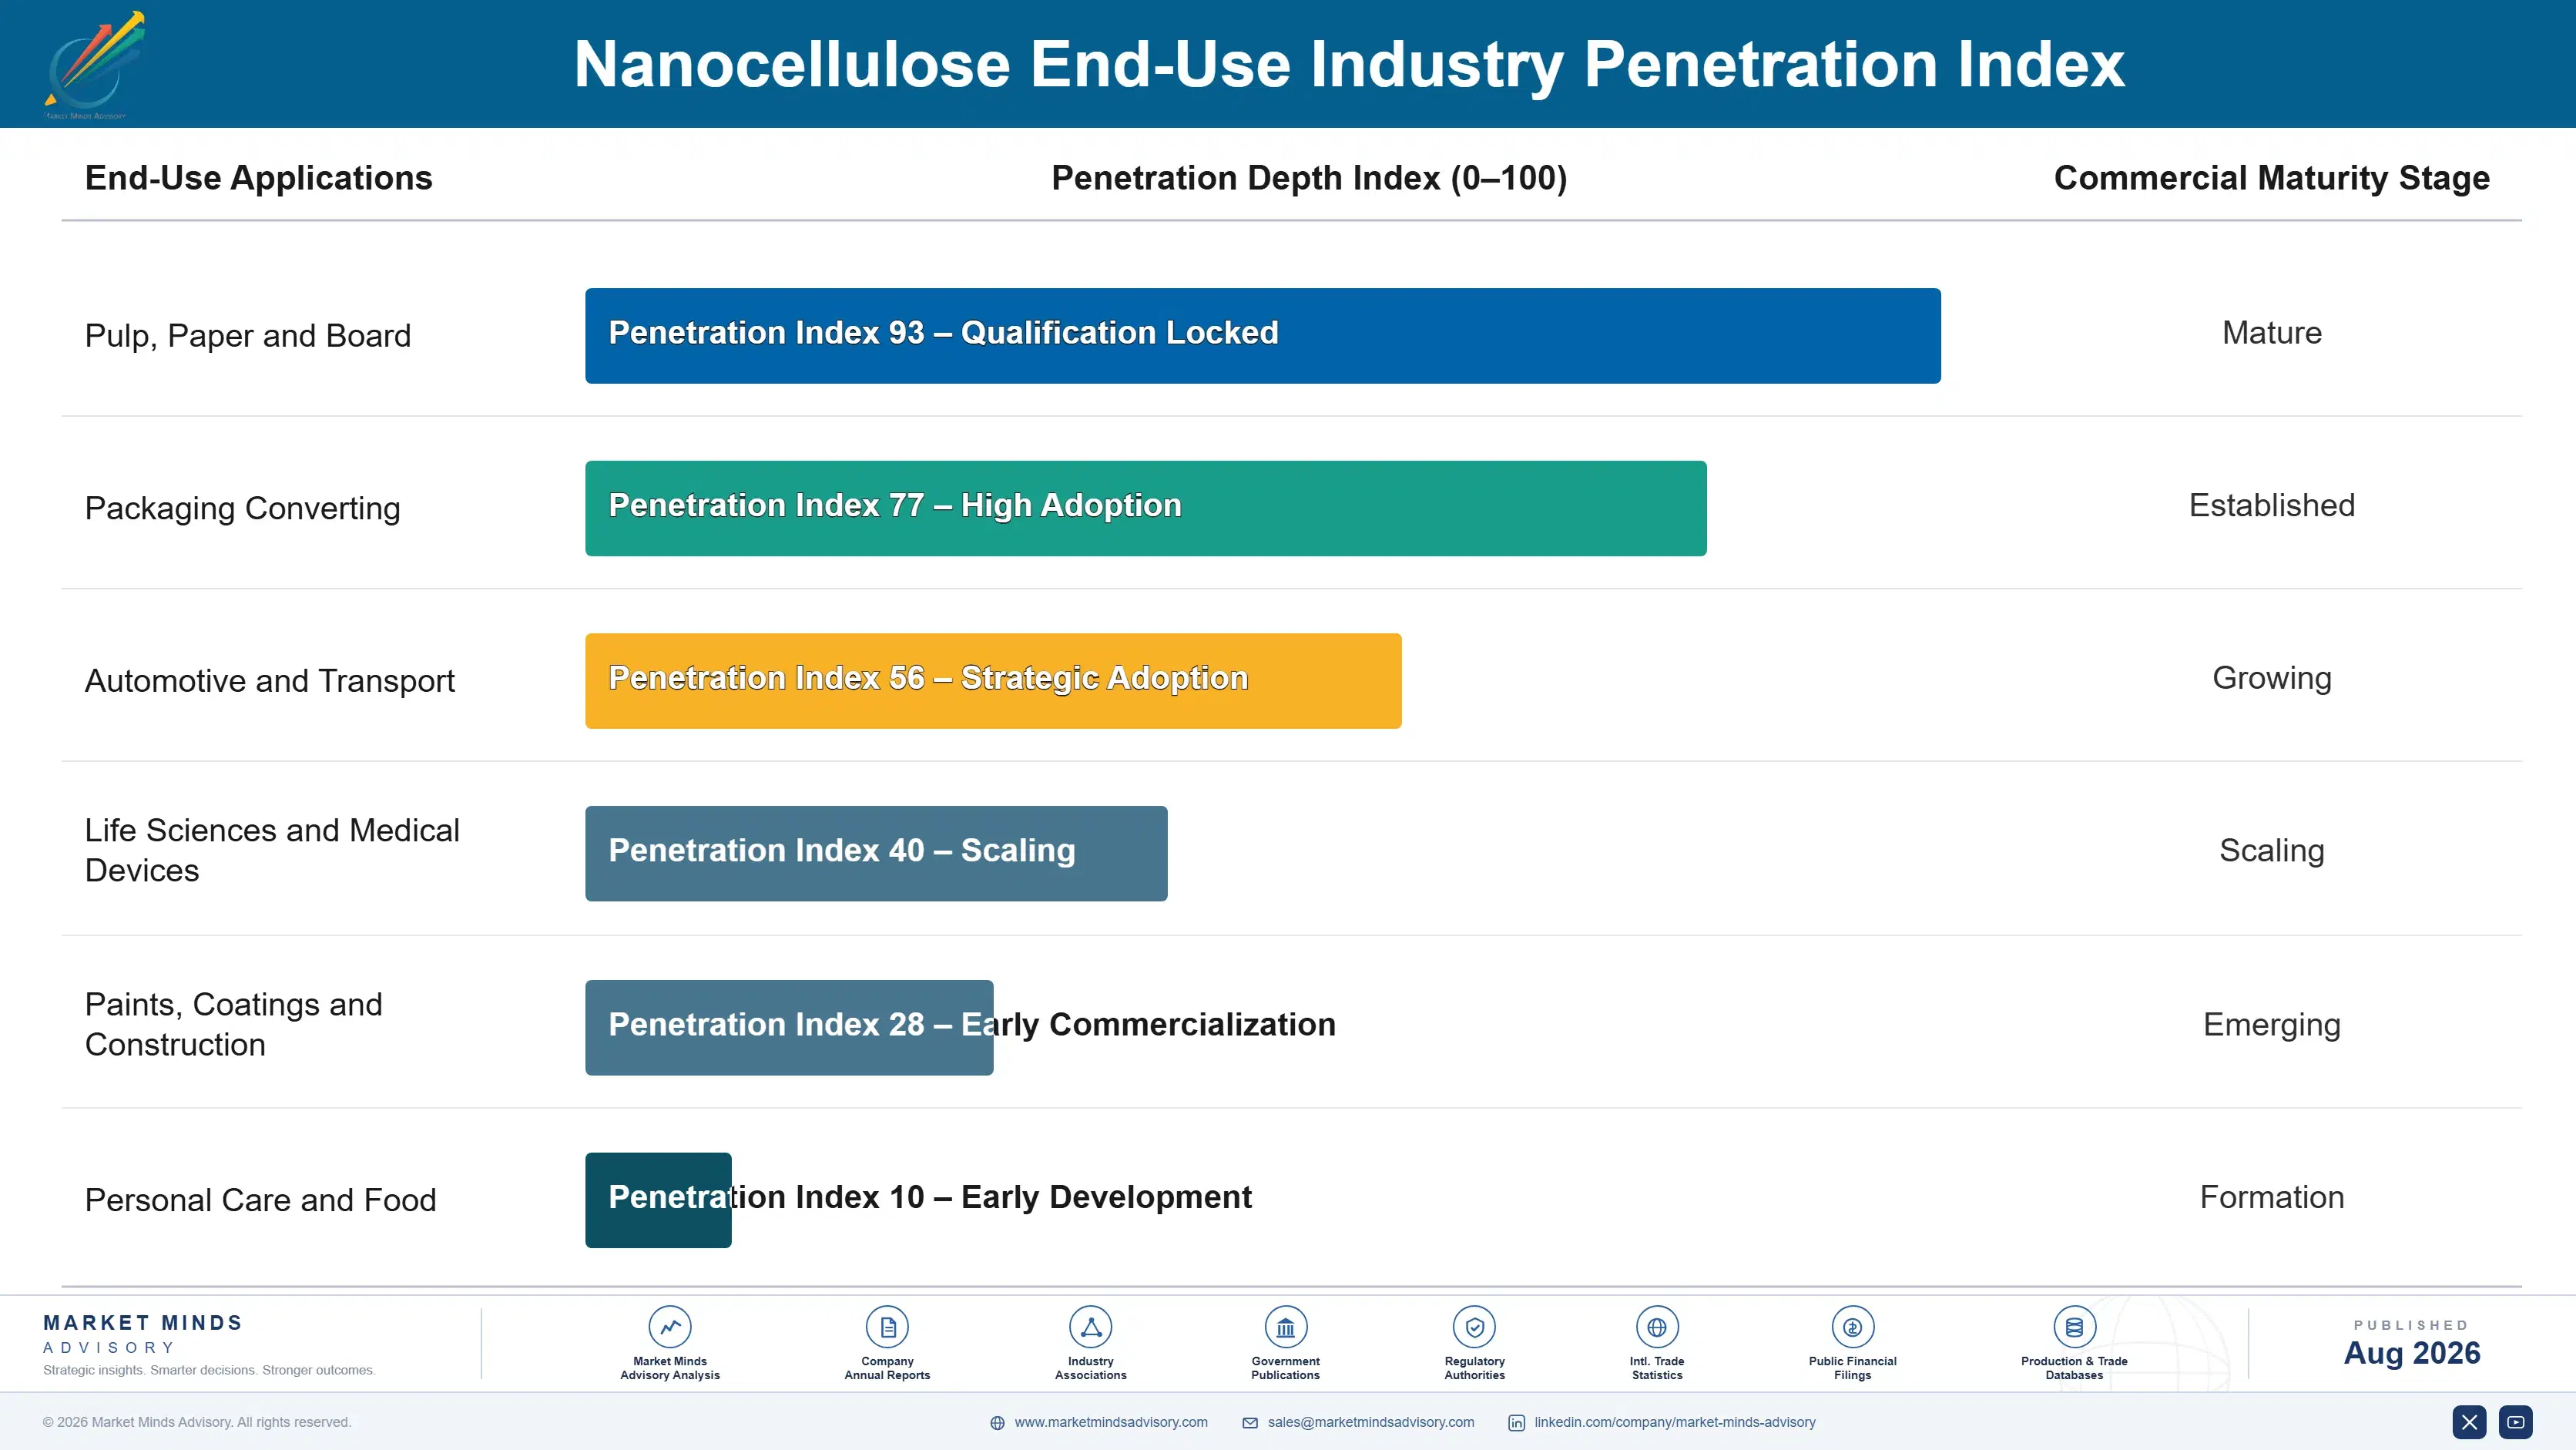
nanocellulose-market-trends-end-use-penetration-index-1787555839149

Where To Place The Bet

These are among the four positions where our research anticipates prominent divergence between winners and laggards over the coming forecast period. Each is grounded in the demand model, the regulatory perimeter, and the announced capacity pipeline.
01 / CAPTIVE LOAD DISCIPLINE

Fill the reactor internally before selling anything outward

Capital recovery across plants running at roughly 34% of nameplate is the dominant cost in nanocellulose production, and it responds to volume rather than to any procurement or operating improvement available to management. Internal paper and board consumption at 61% of output fills reactors without requiring a customer to be found or a tanker of slurry to be moved anywhere at all. Merchant sales should then be priced against an already loaded plant, which is a different and far stronger commercial position.
02 / BIOMEDICAL DOCUMENTATION BUILD

Build the quality system before chasing life science volume

Life science buyers pay roughly forty times industrial pricing and qualify suppliers on purity documentation, endotoxin control and batch consistency rather than on any production capability a pulp mill would recognise as relevant. Growth at 20.1% is the fastest in this market and the absolute volumes involved are genuinely trivial by comparison. Producers treating this as a small tonnage opportunity rather than as a fundamentally different business consistently fail to qualify with exactly the customers who are willing to pay the most for the material.
03 / FREIGHT GEOMETRY DESIGN

Put production where the material gets consumed

Freight accounts for roughly 28% of delivered cost at industrial pricing because a 3% solids slurry is overwhelmingly water, and drying to reduce that weight destroys the surface area the customer is actually buying in the first place. Production units sited inside large converting or coating operations eliminate the problem completely rather than merely reducing it at the margin. Centralised merchant plants shipping across continents have demonstrated the alternative repeatedly and expensively over the past fifteen years, and the arithmetic has not changed at all.
04 / REDISPERSION OPTION FUNDING

Fund the drying problem without planning around it

Carboxymethylation, sugar additive protection and never-dried spray routes all target a dry form that redisperses to original surface area, and roughly 15 years of sustained effort has produced nothing validated at genuine commercial scale by anybody. Success would remove the freight constraint and reshape this entire market fundamentally. Failure changes nothing at all for a business already built around captive internal consumption, which makes modest option funding entirely rational and building any commercial plan around the breakthrough arriving straightforwardly reckless.

Engagement Snapshot From the Field

A live engagement with an industry participant carrying material or product regulatory and market exposure ahead of a defining policy shift, showing how our research translates into a defensible multi-year portfolio strategy.
MARKET MINDS ADVISORY · CLIENT ENGAGEMENT SUMMARY
Nanocellulose Producer Strategic Portfolio Review and Transition Roadmap 2026·Investment Scenario on Nanocellulose Exposure Evaluation 2025-26
CLIENT PROFILE
A Nordic pulp and paper producer operating a nanocellulose plant with nameplate capacity around 8,000 tonnes dry solids equivalent (client-reported, unverified by MMA), commissioned five years earlier with partial public funding. Utilisation sat below 30%. Merchant sales had never reached projections. Management was preparing a further capacity investment case for board approval. Public funding conditions had already expired.
STRATEGIC CHALLENGE
The board had asked why a plant running below 30% needed expansion, and the commercial team could not answer without conceding that merchant demand projections had been wrong from the start. Nobody had tested whether the freight economics permitted merchant sales at industrial pricing at all, at any distance. The question had simply never been asked.
MMA APPROACH
MMA rebuilt delivered cost for every active and prospective merchant customer including freight on slurry at actual solids content, and compared it against the internal fibre saving from captive board use. Biomedical qualification requirements were mapped against the client's existing quality systems. The expansion case was tested against loaded rather than projected utilisation.
KEY FINDINGS
  1. Merchant sales beyond roughly 300 kilometres carried negative contribution once slurry freight was costed honestly, which explained the sales shortfall entirely without any market failure.
  2. Captive use in the client's own board raised strength enough to permit basis weight reduction worth more per tonne than most merchant sales had actually generated.
  3. Biomedical qualification was achievable but required documentation and endotoxin control systems the pulp quality organisation had never operated and could not simply extend.
  4. The expansion case relied on merchant volume projections functionally identical to those that had already failed once, with no change in the underlying freight arithmetic.
CLIENT PROFILE
A Nordic pulp and paper producer operating a nanocellulose plant with nameplate capacity around 8,000 tonnes dry solids equivalent (client-reported, unverified by MMA), commissioned five years earlier with partial public funding. Utilisation sat below 30%. Merchant sales had never reached projections. Management was preparing a further capacity investment case for board approval. Public funding conditions had already expired.
STRATEGIC CHALLENGE
The board had asked why a plant running below 30% needed expansion, and the commercial team could not answer without conceding that merchant demand projections had been wrong from the start. Nobody had tested whether the freight economics permitted merchant sales at industrial pricing at all, at any distance. The question had simply never been asked.
MMA APPROACH
MMA rebuilt delivered cost for every active and prospective merchant customer including freight on slurry at actual solids content, and compared it against the internal fibre saving from captive board use. Biomedical qualification requirements were mapped against the client's existing quality systems. The expansion case was tested against loaded rather than projected utilisation.
KEY FINDINGS
  1. Merchant sales beyond roughly 300 kilometres carried negative contribution once slurry freight was costed honestly, which explained the sales shortfall entirely without any market failure.
  2. Captive use in the client's own board raised strength enough to permit basis weight reduction worth more per tonne than most merchant sales had actually generated.
  3. Biomedical qualification was achievable but required documentation and endotoxin control systems the pulp quality organisation had never operated and could not simply extend.
  4. The expansion case relied on merchant volume projections functionally identical to those that had already failed once, with no change in the underlying freight arithmetic.
RECOMMENDED STRATEGY
Phase 1: Phase one: withdraw the expansion case and load existing capacity through captive board consumption, valuing output as avoided fibre purchase rather than as lost sales. Phase 2: Phase two: build separate biomedical quality documentation systems rather than extending pulp quality processes that will never satisfy a life science auditor. Phase 3: Phase three: restrict merchant selling to a defined radius where delivered economics work, and price the remainder to reflect that reality.
OUTCOME
The expansion case was withdrawn and utilisation rose above 60% within a year through captive board consumption (client-reported, unverified by MMA). Biomedical documentation is being built as a separate system. Merchant selling now operates within a defined radius, and the plant reached positive contribution for the first time.

Frequently Asked Questions

Foundational context covering the market sizes, CAGR, scope, country, region and competition that inform every finding below. This section is provided to cover basics and most often pre-purchase conversations, answered from the MMA Primary Research Dataset.

What is the current size of the Nanocellulose Market?

The market was valued at USD 0.58 billion in 2025, rising to an estimated USD 0.66 billion in 2026. East Asia holds the largest regional share at 28% of value.

How large will the Nanocellulose Market be by 2036?

MMA forecasts USD 2.31 billion by 2036 under the base case, an expansion multiple of 3.52 times the 2026 value. That represents USD 1.65 billion of incremental value.

What is the CAGR for the Nanocellulose Market 2026 to 2036?

The base case runs at 13.4% compound annual growth between 2026 and 2036, with a bull case at 14.6% and a bear case at 12.1%. Historical growth from 2020 to 2025 was 12.2%.

Which segment is growing fastest?

Biomedical and life science grades lead at 20.1%, half again the market rate, because pricing around forty times industrial levels makes freight cost irrelevant. Barrier coatings follow at 15.6%.

Who are the major companies in the Nanocellulose Market?

Nippon Paper Industries, Stora Enso, Borregaard, Oji Holdings and UPM-Kymmene hold 38% of supply. Every one is a pulp or paper producer rather than a chemical specialist.

Which country is growing fastest?

China leads at 16.2%, driven by paper industry investment and by packaging barrier applications, though it started considerably later than Japan or the Nordic countries.

Report Segmentation Architecture

The full report scope spans multiple orthogonal segmentation dimensions, with cross-tabulated demand data provided for each dimension pair. Coverage extends further to regional breakdowns, trend trajectories, and the competitive detail needed to support segment-level decision-making.

By Application

  • Paper and Board Reinforcement
  • Composites and Automotive Parts
  • Rheology Modifiers and Coatings
  • Barrier Films and Packaging Coatings
  • Biomedical and Life Science
  • Food and Personal Care

By End-Use Industry

  • Pulp, Paper and Board
  • Packaging Converting
  • Automotive and Transport
  • Life Sciences and Medical Devices
  • Paints, Coatings and Construction
  • Personal Care and Food

By Supply Arrangement

  • Captive Internal Transfer
  • Direct Merchant Supply
  • Converter-Sited Production
  • Distributor and Research Channel
  • Licensed Technology Supply

By Region

  • North America
  • Western Europe
  • East Asia
  • South Asia and Pacific
  • Latin America
  • Middle East and Africa
  • Eastern Europe

Scope, Methodology, and Coverage

Every figure in this report is reproducible from documented input assumptions. The scope below maps the historical period, the forecast horizon, the segmentation dimensions, and the countries covered, alongside the underlying primary and qualitative methodology.
Historical Period
2020 to 2025
Forecast Period
2026 to 2036
Base Year
2025 (USD billions; MMA Primary Research Dataset, August 2026)
Market Definition
The market comprises nanocellulose in its principal commercial forms, including fibrillated, crystalline and bacterial types, supplied across paper and board reinforcement, composites and automotive parts, rheology modifiers and coatings, barrier films and packaging coatings, biomedical and life science, and food and personal care applications. Volume is measured on a dry solids equivalent basis regardless of shipped slurry concentration, with value assessed at producer level including internal transfers priced at arm's length. Conventional microfibrillated pulp, cellulose derivatives such as CMC and MCC, dissolving pulp, and non-commercial research quantities fall outside scope.
Quantitative Units
USD billions (current prices); tonnes dry solids equivalent; USD per tonne by application grade
Segmentation Dimensions
By Application; By End-Use Industry; By Supply Arrangement; By Region
Regions Covered
North America, Western Europe, East Asia, South Asia and Pacific, Latin America, Middle East and Africa, Eastern Europe
Countries Covered
Japan, China, South Korea, Taiwan, India, Indonesia, Thailand, Australia, New Zealand, United States, Canada, Mexico, Finland, Sweden, Norway, Germany, France, Netherlands, Austria, United Kingdom, Poland, Czechia, Slovakia, Brazil, Chile, Argentina, Saudi Arabia, United Arab Emirates, South Africa, Egypt
Key Companies Profiled
Nippon Paper Industries, Stora Enso, Borregaard, Oji Holdings, UPM-Kymmene, Daio Paper, Sappi, CelluForce, GranBio, Kruger, FiberLean Technologies, Melodea, Norske Skog, Suzano, Anomera, CelluComp, Blue Goose Biorefineries, Weidmann Fiber Technology, Nippon Shokubai, Chuetsu Pulp and Paper
Quantitative Methodology
Primary survey, n=3,800 respondents, Q4 2025, six countries; demand-side model with trade association cross-validation
Qualitative Methodology
47 expert interviews, Q4 2025; applied to validate demand model assumptions, identify emerging dynamics, and assess competitive positioning
Report Format
PDF and XLSX data workbook (Word format preview document)
Publisher
Market Minds Advisory
Report Code
MMA-2026-CHM-712
Published
August 2026
Contact
sales@marketmindsadvisory.com | www.marketmindsadvisory.com

Purchase the full Nanocellulose Market Report (2026 to 2036).

The full report sizes the global nanocellulose market to 2036 across six applications and seven regions, measured on dry solids equivalent tonnage regardless of shipped slurry concentration. It treats hornification and freight economics as the governing commercial constraint rather than as a technical footnote, and separates captive internal transfer from genuine merchant demand throughout. Competitive analysis covers 20 participants on one consistent tonnage basis, with moat and risk assessment for the two leaders. Nameplate utilisation is quantified against announced capacity by region. Four quantified revenue levers close the analysis.
Six-application segment sizing with individual growth rates
Captive transfer separated from genuine merchant demand throughout
Nameplate utilisation quantified against announced capacity by region
Delivered cost modelling including slurry freight at actual solids
Twenty-participant competitive map on one dry solids basis
Four quantified revenue levers with commercial impact ranges

Built For The People Who Decide

From boardroom strategy to bench-side execution, this report is read cover-to-cover by leaders shaping the next decade of their industry, turning demand scenarios, market dynamics and valuation benchmarks into decisions.
CXOs/ Presidents/ VPs/ Managers
M&A and Corporate Development
Strategy Teams and R&D Heads
Procurement and Product Directors
Regulatory and Compliance Leaders
Investor Relations and Equity Analysts