Market Minds Advisory
Municipal Solid Waste Management Market

Municipal Solid Waste Management Market: Municipal Solid Waste Management Market: Destination Routes, Long-Term Liabilities and Contract Structure 2026 to 2036

A landfill is not a disposal method. It is a thirty year financial liability that somebody has to fund from a gate fee charged today, long before the last tonne ever arrives there.

Lead Analyst

Published

September 2026

Make Smarter Decisions with Customized Research Insights

Request a free sample report and evaluate market opportunities, growth trends, and competitive dynamics relevant to your business needs.

2025 MARKET VALUE$312.0BMarket Size 2025
2036 FORECAST VALUE$568.1BBase Case , 2026 to 2036
CAGR 2026 TO 20365.6 %Bull 6.8% / Bear 4.4%
INCREMENTAL OPPORTUNITY$238.7BNet 10- year value creation
EXPANSION MULTIPLE1.72x2036 value over 2026 base
Strategic Levers
M&A Pipeline
Regional Outlook
Country Rankings
Competitive Intelligence
Segmental Deep-dive
Call-Us : 91 93563 13602

Executive Snapshot and Market Trajectory.

The waste industry's defining commercial fact is invisible on every invoice it issues. Landfill carries a monitoring and aftercare obligation running thirty years past the final deposit, funded from gate fees charged today. The tipping fee has never been the real cost of anything.
The market reaches USD 329.47 billion in 2026 and USD 568.13 billion by 2036, a 1.72 times expansion at 5.6%. Anaerobic digestion of source-separated organics grows at 8.4%, half again the market rate of 5.6%, because organic waste in a landfill produces methane and nothing else diverts it. East Asia holds 30% of managed tonnage revenue on volume and incineration capacity, and India grows fastest at 9.6% as collection formalises.
Five operators hold 21% of managed tonnage revenue, which makes this among the most fragmented industries of its size anywhere. Veolia, SUEZ and Remondis built European positions across decades of municipal contracting. Waste Management and Republic Services consolidated North America. Thousands of municipal authorities and regional operators hold the remainder, and very few of them are going anywhere at all. Consolidation has been predicted for thirty years now and has still not arrived anywhere.
Market Definition
This report covers collection, treatment and disposal of municipal solid waste, segmented by destination route: advanced material recovery and sorting, anaerobic digestion of source-separated organics, energy recovery incineration, composting and aerobic stabilisation, mechanical biological treatment, and engineered landfill disposal. It excludes hazardous and clinical waste, industrial process waste, construction and demolition debris, wastewater treatment, and manufacture of collection vehicles or processing equipment.
Base Year Value
$312.0B in 2025 (MMA Primary Research Dataset, September 2026)
Forecast Period
2026 to 2036, eleven discrete annual values
CAGR
5.6% base case. Bull 6.8%. Bear 4.4%.
Fastest Growth Segment
Anaerobic Digestion Of Source-Separated Organics: 8.4% CAGR
Fastest Growth Country
India: 9.6% CAGR
Fastest Growth Region
South Asia and Pacific: 7.8% CAGR
Largest Region
East Asia: 30% of 2025 global value
Market Leaders
Veolia, Waste Management, Republic Services, SUEZ and Remondis lead on managed tonnage service revenue. Source: MMA Analysis.
Primary Survey
n=3,800 procurement and R&D decision-makers, Q4 2025, six countries
Methodology
Demand-side build-up, cross-validated against public data, 47 expert interviews

Municipal Solid Waste Management Market Forecast Scenarios

municipal-solid-waste-management-market-size-forecast-scenario-1789988890585
Between 2020 and 2025 the sector compounded at 4.6%, and the growth came from regulation rather than from volume. Household waste generation per person stayed broadly flat across developed economies. What changed was where each tonne had to go, as landfill taxes and diversion targets pushed material toward routes with higher gate fees. The industry grew by handling the same waste more expensively.
The base case holds 5.6% on three mechanisms. Landfill diversion mandates keep tightening across Europe, North America and increasingly Asia, moving tonnage toward treatment routes that charge considerably more per tonne. Extended producer responsibility schemes are transferring packaging waste costs from municipalities to producers, which funds sorting infrastructure that ratepayers would never have approved. And urbanisation across South Asia and Africa keeps adding collected tonnage to formal systems for the first time.
The bull case at 6.8% assumes organic waste separation reaches the participation rates European leaders already achieve, which would move enormous tonnage into anaerobic digestion at premium gate fees. The bear case at 4.4% is municipal budget pressure deferring infrastructure renewal and extending landfill permits, which several authorities have already done quietly when the alternative meant raising local taxes.

The Liability Nobody Puts On The Invoice

A landfill looks cheap on a gate fee comparison and is not. Closing one starts a monitoring and aftercare obligation running around thirty years, covering leachate, gas capture, cap integrity and groundwater testing long after the last lorry leaves. That money must be provisioned from fees charged while the site is open. Operators who under-provisioned in the 1990s pay for it now, from revenue those sites no longer generate.
TOP FIVE CONCENTRATION21%Highly fragmented across municipal and regional service operators everywhere
LANDFILL POST-CLOSURE OBLIGATION30 yearsMonitoring and aftercare required after the final waste deposit
ORGANIC STREAM CONTAMINATION RATE14%Non-organic material arriving in separately collected food waste
TYPICAL CONTRACT DURATION18 yearsMunicipal treatment agreements with guaranteed tonnage commitments attached
AVERAGE GATE FEEUSD 74Per tonne charged at treatment and disposal facilities
HOUSEHOLD WASTE PER CAPITA1.2 kilogramsGenerated daily across urban populations in developed economies
Organic waste is the highest-impact problem and the hardest one to solve, because it depends on households rather than on engineering. Food waste in a landfill generates methane, and separating it at source is the only intervention that removes the problem rather than capturing part of it later. Contamination in separately collected organics runs around 14%, and every point above that threshold degrades digestate value and eventually decides whether a plant is a business.
Contract structure shapes this industry more than technology does. Municipal treatment agreements run around 18 years with guaranteed tonnage attached, because nobody finances an incinerator without one. That commits a city to delivering waste exactly when its recycling targets demand less. Several European authorities now pay for tonnes they no longer generate.
"Ask a municipality what it costs to landfill a tonne and you get the gate fee. Ask what it costs to monitor that site for thirty years after it closes and the room goes quiet, because in most cases nobody has provisioned properly for it and everybody knows."
Director, Environmental Services and Resource Recovery Practice · MMA Energy and Environmental Services Practice · September 2026

Market Trends

Post-Closure Liability Reprices Landfill Against Every Alternative

A closed landfill requires around thirty years of leachate management, gas capture, cap maintenance and groundwater monitoring, and that obligation is funded from gate fees charged while the site still accepts waste. Operators who under-provisioned during the 1990s now carry costs against sites generating no revenue at all. Regulators across Europe and North America have tightened financial assurance requirements accordingly, which raises the true cost of the cheapest disposal route considerably. Landfill grows at 1.9% against 5.6% for the sector, and the liability rather than the environmental argument explains most of that gap.
Market Impact: Digestion compounds at 8.4% annually

Producer Responsibility Moves Packaging Costs Off Municipal Budgets

Extended producer responsibility schemes across the European Union, Canada and several American states now require packaging producers to fund the collection and sorting of what they place on the market, rather than leaving that cost with ratepayers. The practical effect is capital for sorting infrastructure that no municipal council would have approved through local taxation. Advanced material recovery compounds at 7.2% on funding that arrives from outside the waste budget entirely. The schemes also give producers a direct financial interest in packaging that sorts well, which is changing product design.
Market Impact: India compounds at 9.6% annually

Market Opportunities and Growth Drivers

Methane Rules Force Organic Waste Out Of Landfill

Food and garden waste decomposing in a landfill generates methane, which warms the atmosphere far more intensely than carbon dioxide over the periods regulators now care about. Landfill gas capture recovers a portion and never all of it. Separate organic collection removes the problem at source rather than mitigating it downstream, which is why the European Union, several American states and a growing list of Asian authorities have mandated it outright. Anaerobic digestion compounds at 8.4% on that requirement, and the digestate and biogas outputs both carry their own revenue.
Market Impact: Contracts guarantee tonnage for 18 years

Urbanisation Adds Tonnage To Formal Systems First Time

Across South Asia and much of Africa, waste that was previously handled informally or not at all is entering municipal collection systems as cities formalise services under public health pressure. That adds tonnage to the measured market rather than shifting it between routes, which is a different growth mechanism from anything happening in mature economies. India compounds at 9.6% on exactly this, with national urban sanitation programmes funding collection fleets and processing capacity together. The waste was always being generated. It is only now being collected, counted and paid for.
Market Impact: Contamination sits around 14%

Market Restraints and Challenges

Long Contracts Lock Cities Into Delivering Waste

Municipal treatment agreements run around 18 years with guaranteed tonnage attached, because incinerators and digestion plants cannot be financed without one. The root cause is capital intensity: a facility costing hundreds of millions needs certain throughput across its debt life, and no lender accepts municipal recycling ambition as a substitute. Commercially this obliges cities to deliver waste while their own targets demand less of it, and several European authorities now pay for tonnage they no longer generate. Mitigation runs through shorter terms, regional tonnage pooling and merchant capacity that most lenders still refuse to fund.
Market Impact: Aftercare obligations run 30 years

Contamination Decides Whether Separation Actually Works

Separately collected organic waste arrives with around 14% non-organic contamination, and every point above that degrades digestate quality until agricultural buyers refuse it entirely. The root cause is that separation happens in millions of kitchens rather than in any facility an operator controls, and no amount of processing sophistication compensates for what goes into the bin. Commercially this determines whether a digestion plant sells a product or disposes of a residue. Mitigation runs through household education, transparent bin rejection, and pre-treatment sorting that adds cost the original business case rarely included.
Market Impact: Sorting compounds at 7.2% annually
3 additional market trends, 4 additional growth drivers, and 2 additional restraints and challenges are covered in the full report. Contact sales@marketmindsadvisory.com to access the complete intelligence.

Segment CAGR and Growth Architecture

Segmentation follows destination route, since where a tonne ends up determines the gate fee it carries, the capital behind the facility and the regulatory pressure acting on it. Six routes cover the market: anaerobic digestion, advanced material recovery, energy recovery incineration, mechanical biological treatment, composting, and engineered landfill. Collection model and contracting authority are separate dimensions.
municipal-solid-waste-management-market-market-share-analysis-1789988891153

Anaerobic Digestion Of Source-Separated Organics

Anaerobic digestion grows at 8.4%, half again the market rate of 5.6%, on regulation that has decided organic waste must leave landfill. Food and garden material decomposing underground generates methane, and gas capture recovers only part of it, so separate collection is the only intervention that removes the problem rather than mitigating it. The European Union, several American states and a growing list of Asian authorities have mandated separation outright. Biogas and digestate both generate revenue alongside the gate fee, which improves the economics considerably. Everything then depends on contamination, which runs around 14% and decides whether the digestate is a product or another disposal problem. Households rather than engineers decide that number.
CAGR 8.4%

Advanced Material Recovery And Sorting

Advanced material recovery compounds at 7.2% on capital arriving from outside the municipal budget entirely. Extended producer responsibility schemes across the European Union, Canada and several American states now require packaging producers to fund collection and sorting of what they sell, which pays for optical sorting, robotics and near-infrared separation that no council would have funded through local taxation. The schemes also give producers a direct financial interest in packaging that sorts cleanly, which has started changing product design upstream. Recovered material prices remain volatile and tied to commodity markets, so gate fees rather than commodity revenue underpin the business case in practice. Producer money built this capacity, and ratepayers never would have.
CAGR 7.2%
Full segment breakdown across 6 segments available in the complete report.

Regional Architecture and Country Demand Map

East Asia leads at 30% of managed tonnage revenue on the largest waste volumes anywhere combined with the world's biggest incineration buildout. North America follows at 26% on high gate fees rather than volume. Both mechanisms are genuine and they are not the same mechanism at all.

East Asia

East Asia holds 30% of managed tonnage revenue, at the top of the standard band, on a combination of volume and capital that exists nowhere else. China generates more municipal waste than any country and has built energy recovery incineration capacity at a pace no other nation has attempted, driven by land scarcity around large cities rather than by climate policy. China Everbright Environment and Dongjiang Environmental operate at scale accordingly. Japanese incineration is near universal with gate fees among the highest anywhere, reflecting land constraints that make landfill genuinely impossible. Korean separation rates are excellent. Growth at 6.6% sits above the global rate on continued Chinese capacity commissioning. Land scarcity rather than climate policy explains it.
Share: 30% | CAGR: 6.6% (2026 to 2036)

North America

North America takes 26% of managed tonnage revenue on high gate fees rather than on volume, and landfill still handles a majority of tonnage because land remains available and cheap. Waste Management, Republic Services, Waste Connections and GFL Environmental consolidated a fragmented industry across three decades and now hold genuine pricing power in most metropolitan areas. Extended producer responsibility schemes are arriving state by state, which is transferring packaging costs off municipal budgets. Post-closure financial assurance requirements have tightened considerably. Growth at 4.8% sits below the global rate on a mature system where the volume simply is not increasing. Consolidation delivered pricing power here that European operators, working against municipal authorities rather than commercial customers, have never managed to build.
Share: 26% | CAGR: 4.8% (2026 to 2036)
Regional intelligence for 5 additional markets available in the complete report: Western Europe, South Asia and Pacific, Latin America, Middle East and Africa, Eastern Europe. Contact sales@marketmindsadvisory.com.
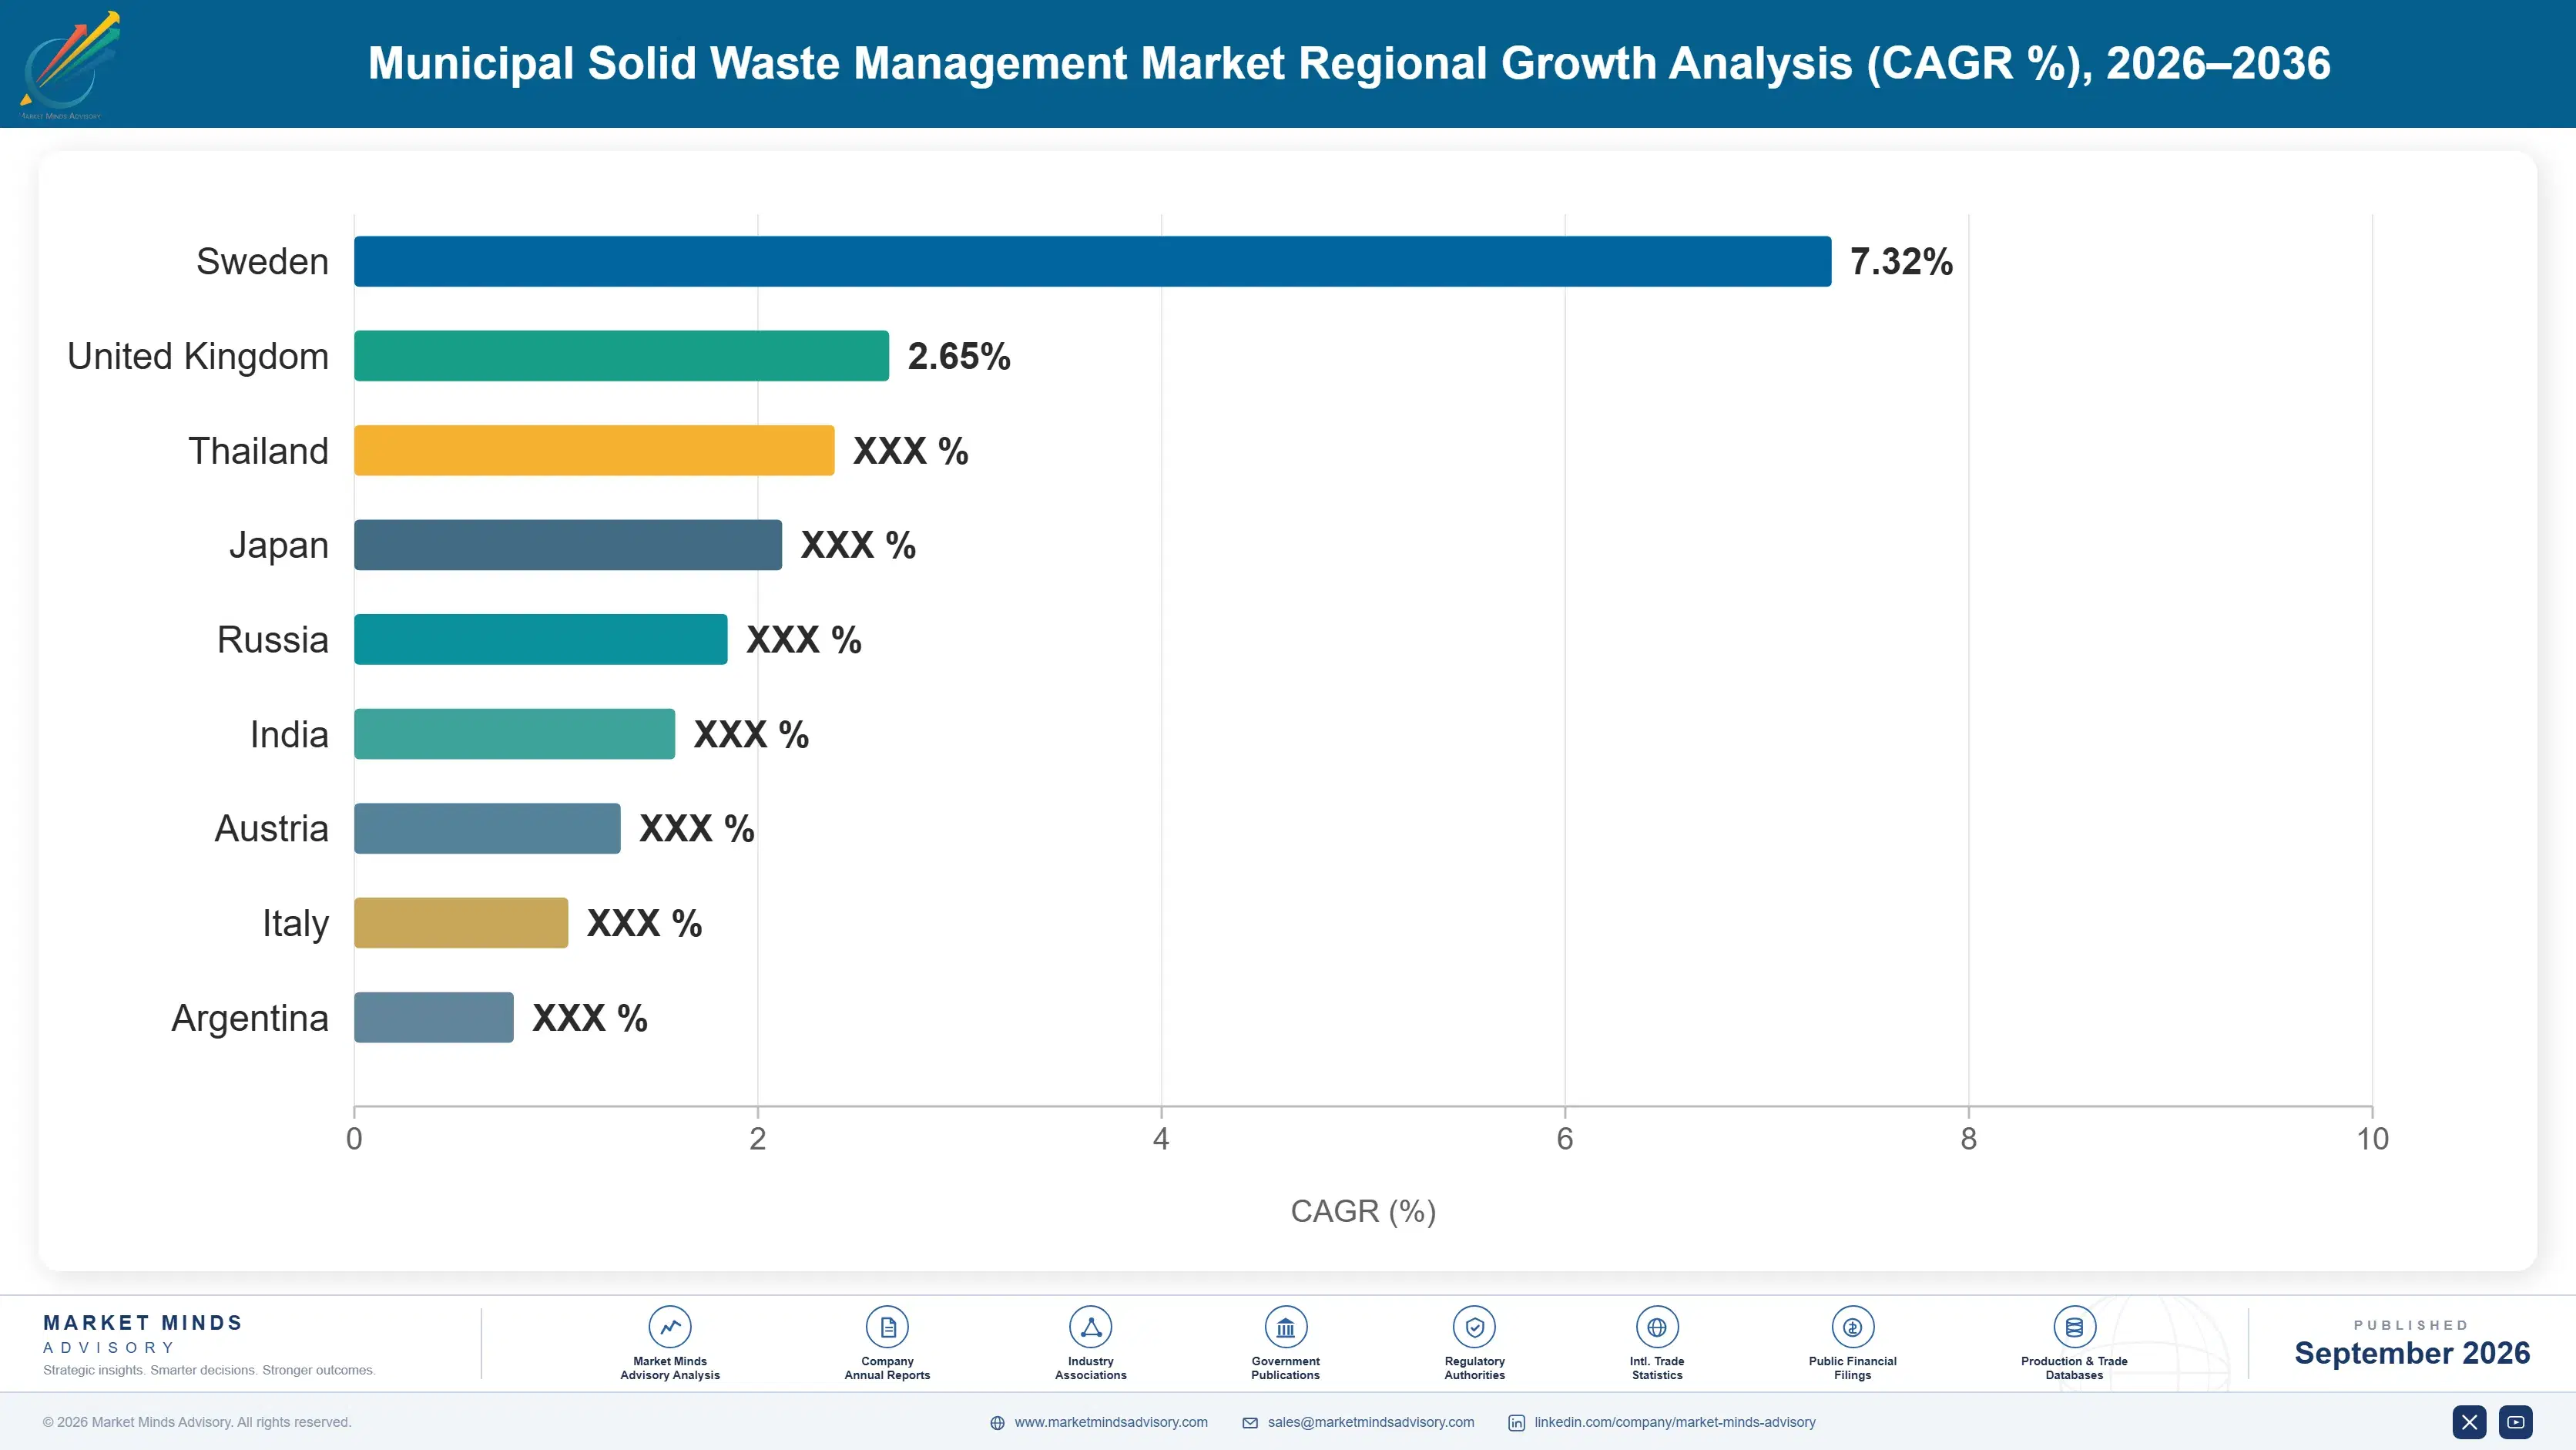
municipal-solid-waste-management-market-country-cagr-analysis-1789988891670

Where Waste Operators Actually Earn

Gate fees are set by regulation and competition rather than by any operator, tonnage grows slowly in mature markets, and the long contracts that make facilities financeable also trap everybody inside them. Each lever below works on cost, on liability or on contract structure rather than on price, because price is not something anybody here controls.

Provision Post-Closure Liability At Full Cost

A closed landfill requires around thirty years of leachate management, gas capture and groundwater monitoring, funded from gate fees charged while the site still accepts waste. Operators who under-provisioned during the 1990s carry those costs today against sites earning nothing at all. Pricing the full obligation into current gate fees looks like a competitive disadvantage and is actually the only sustainable position, because regulators keep tightening financial assurance requirements and the underprovisioned operators are the ones who eventually sell cheaply. Landfill grows at 1.9% precisely because this arithmetic finally became visible to everybody.
Market Impact: Aftercare runs a full 30 years past closure

Chase Producer Responsibility Funding Deliberately Instead

Extended producer responsibility schemes transfer packaging collection and sorting costs from ratepayers to producers, which supplies capital for optical sorting and robotics that no municipal council would fund through local taxation. Advanced material recovery compounds at 7.2% on that money. Operators positioned before a scheme launches capture the infrastructure contracts; those who wait are bidding against incumbents already installed. Scheme design is decided in consultation processes years ahead of implementation, and remarkably few operators participate in them despite the outcome determining where the money lands. The outcome of those processes determines exactly where the money lands.
Market Impact: Recovery compounds at 7.2% on pure producer money

Fix Contamination Before Building More Capacity

Separately collected organics arrive with around 14% contamination, and every point beyond that degrades digestate until agricultural buyers reject it and the output becomes another disposal cost. Operators consistently invest in processing sophistication when the problem sits in millions of kitchens upstream. Household education, transparent bin rejection and clear feedback move contamination further than any pre-treatment line does, at a small fraction of the capital. A digestion plant running clean feedstock sells two products; one running contaminated feedstock disposes of a residue and calls it recycling. That distinction decides whether the plant is a business.
Market Impact: Contamination above 14% destroys all the digestate value

Negotiate Shorter Terms And Pool Tonnage Regionally

Municipal contracts run around 18 years with guaranteed tonnage because lenders demand certainty across the debt life, and several European authorities now pay for waste that improved recycling removed. Regional tonnage pooling across multiple authorities gives a facility the throughput certainty a lender needs without obliging any single city to guarantee volumes it is actively trying to reduce. That structure requires cooperation between authorities who usually procure separately, which is the real obstacle rather than anything financial. The operators arranging it are winning contracts on terms others cannot offer. Cooperation is the obstacle, not finance.
Market Impact: Pooling shortens the full 18 year tonnage commitment

Who Controls the Margin Pool

Five operators hold 21% of managed tonnage revenue, which makes this one of the most fragmented industries anywhere at this scale. Veolia, SUEZ and Remondis built cross-border European positions through decades of municipal contracting. Waste Management and Republic Services consolidated North America into genuine regional pricing power. Thousands of municipal authorities and regional operators hold everything else. All participants are assessed on managed tonnage service revenue.
Competition is decided in procurement rather than in operation, since municipal tenders are scored on price, compliance and local employment commitments across long terms. Winning depends on knowing what an authority will actually accept, which favours incumbents and local knowledge over technical capability. Cross-border operators win by financing facilities that municipalities cannot fund themselves, not by operating them more cheaply.

Rankings shift on who holds landfill liability and who provisioned honestly for it, because tightening financial assurance rules are revealing balance sheets that looked adequate under previous requirements. The second pressure is contract renegotiation: authorities locked into tonnage guarantees they can no longer meet are seeking exits, and the operators who cooperate on renegotiation keep the relationship for the next contract cycle as well.
municipal-solid-waste-management-market-company-positioning-matrix-1789988892203

Competitive Moat and Risk Dimensions

VEOLIA

Moat: Municipal Contracting Relationship Depth

Veolia holds municipal relationships across dozens of countries built over more than a century, and waste contracts are awarded by authorities valuing demonstrated delivery above almost everything else. Those relationships extend into water and energy services with the same customers, producing local knowledge no newcomer accumulates quickly. Procurement scoring rewards exactly this and it cannot be bought.
VEOLIA

Risk: Stranded Incineration Capacity

Facilities financed against 18 year tonnage guarantees face European authorities whose recycling improvements have removed the waste those contracts assumed. Renegotiation is politically inevitable and commercially unattractive, and importing waste to fill capacity attracts criticism in several jurisdictions. The asset was built correctly for a forecast that policy then deliberately invalidated.
WASTE MANAGEMENT

Moat: Landfill Airspace And Permits

Waste Management controls permitted landfill airspace across North American markets where new permits are effectively unobtainable, and that scarcity gives genuine pricing power in every metropolitan area it serves. Collection routes feeding owned disposal assets capture margin at both ends of the chain. Replicating the position would require permits that regulators no longer issue to anybody at all.
WASTE MANAGEMENT

Risk: Post-Closure Provision Exposure

Every permitted landfill carries a thirty year aftercare obligation that must be funded from fees charged during operation, and tightening financial assurance requirements keep raising the amount regulators consider adequate. A portfolio of ageing sites concentrates that exposure over time. Diversion policy simultaneously reduces the tonnage revenue those provisions were always meant to come from.

Players Tracked

Prominent Players

Veolia
Waste Management
Republic Services
SUEZ
Remondis

Other Key Players

Waste Connections
Clean Harbors
Reworld
FCC Environment
Urbaser
Biffa
Renewi
China Everbright Environment
Dongjiang Environmental
Hitachi Zosen Inova
Stericycle
GFL Environmental
Cleanaway Waste Management
Ragn-Sells
Indaver

Recent Developments

MARCH 2025

Veolia Expands Anaerobic Digestion Capacity Across European Markets

Veolia expanded source-separated organic treatment capacity across several European markets, an organic capacity expansion rather than an acquisition or joint venture. European Union rules requiring separate organic collection are moving substantial tonnage away from landfill and incineration, and digestion produces biogas and digestate revenue alongside the gate fee.
Signal: Mandated separation is redirecting tonnage considerably faster than treatment capacity is being built to receive it.
OCTOBER 2024

Republic Services Raises Landfill Post-Closure Provisions On Tighter Rules

Republic Services increased its provisioning against landfill post-closure obligations following tightened financial assurance requirements, an accounting and compliance change rather than any transaction. Aftercare runs roughly thirty years past final deposit, and regulators across several jurisdictions have raised the amounts they consider adequate for that period.
Signal: The cheapest disposal route is being repriced by regulators rather than by competitors or by customers.
JULY 2025

China Everbright Environment Commissions Additional Energy Recovery Capacity

China Everbright Environment brought further energy recovery incineration capacity into commercial operation, an organic expansion rather than a partnership or merger. Chinese incineration buildout is driven by land scarcity around large cities rather than by climate policy, and the pace exceeds anything attempted in any other country.
Signal: Land availability rather than environmental ambition determines which disposal route a country actually ends up building.

What Handling A Tonne Costs

Collection accounts for roughly 48% of the cost of managing a tonne, dominated by fleet operation and crew labour across routes that cannot be shortened without reducing service. Treatment and disposal operation carries around 24%, varying enormously by destination route. Facility capital recovery absorbs about 16%, and provisioning against long-term site liabilities takes most of the balance.
Diesel pricing moved sharply through 2022 and the EIA has documented how far distillate costs diverged from historical patterns during that period, which hit collection economics directly. Veolia Annual Report 2024 and Waste Management Annual Report 2024 both record fuel and labour as principal operating variables. Municipal contracts with fixed pricing and no indexation absorbed the increase entirely, and several operators renegotiated at the first opportunity.

The competitive disadvantage mechanism is contract indexation rather than operating efficiency. Two operators running identical routes at identical cost can differ substantially on margin, purely because one negotiated fuel and labour indexation into an 18 year agreement and the other did not. Exposure concentrates in long municipal contracts signed during low inflation periods, which describes a great deal of the European contracted base and rather less of the American one.
municipal-solid-waste-management-market-cost-volatility-analysis-1789988892401

Index Long Municipal Contracts To Fuel And Labour

Collection is roughly 48% of the cost of managing a tonne, and many municipal agreements running around 18 years carry fixed pricing with no indexation at all. Negotiating indexation at signature costs nothing and removes an exposure the operator cannot hedge across that duration. Authorities generally accept it when the alternative is a higher fixed price throughout.

Optimise Collection Routes Against Actual Fill Levels

Collection routes are typically fixed by schedule rather than by need, so crews empty containers that are barely used and miss ones that overflow between visits. Fill level sensing and dynamic routing cut vehicle kilometres substantially against the largest single cost line in the business. The capital is modest and most operators still run routes designed decades ago.

Fund Aftercare Provisions From Current Gate Fees

Post-closure obligations run around thirty years past final deposit and must be met from revenue a closed site no longer generates. Operators treating provisioning as a balance sheet formality discover the gap when regulators raise assurance requirements. Pricing the full obligation into gate fees today is uncomfortable competitively and considerably cheaper than the alternative later.

Portfolio Architecture for Margin Defence

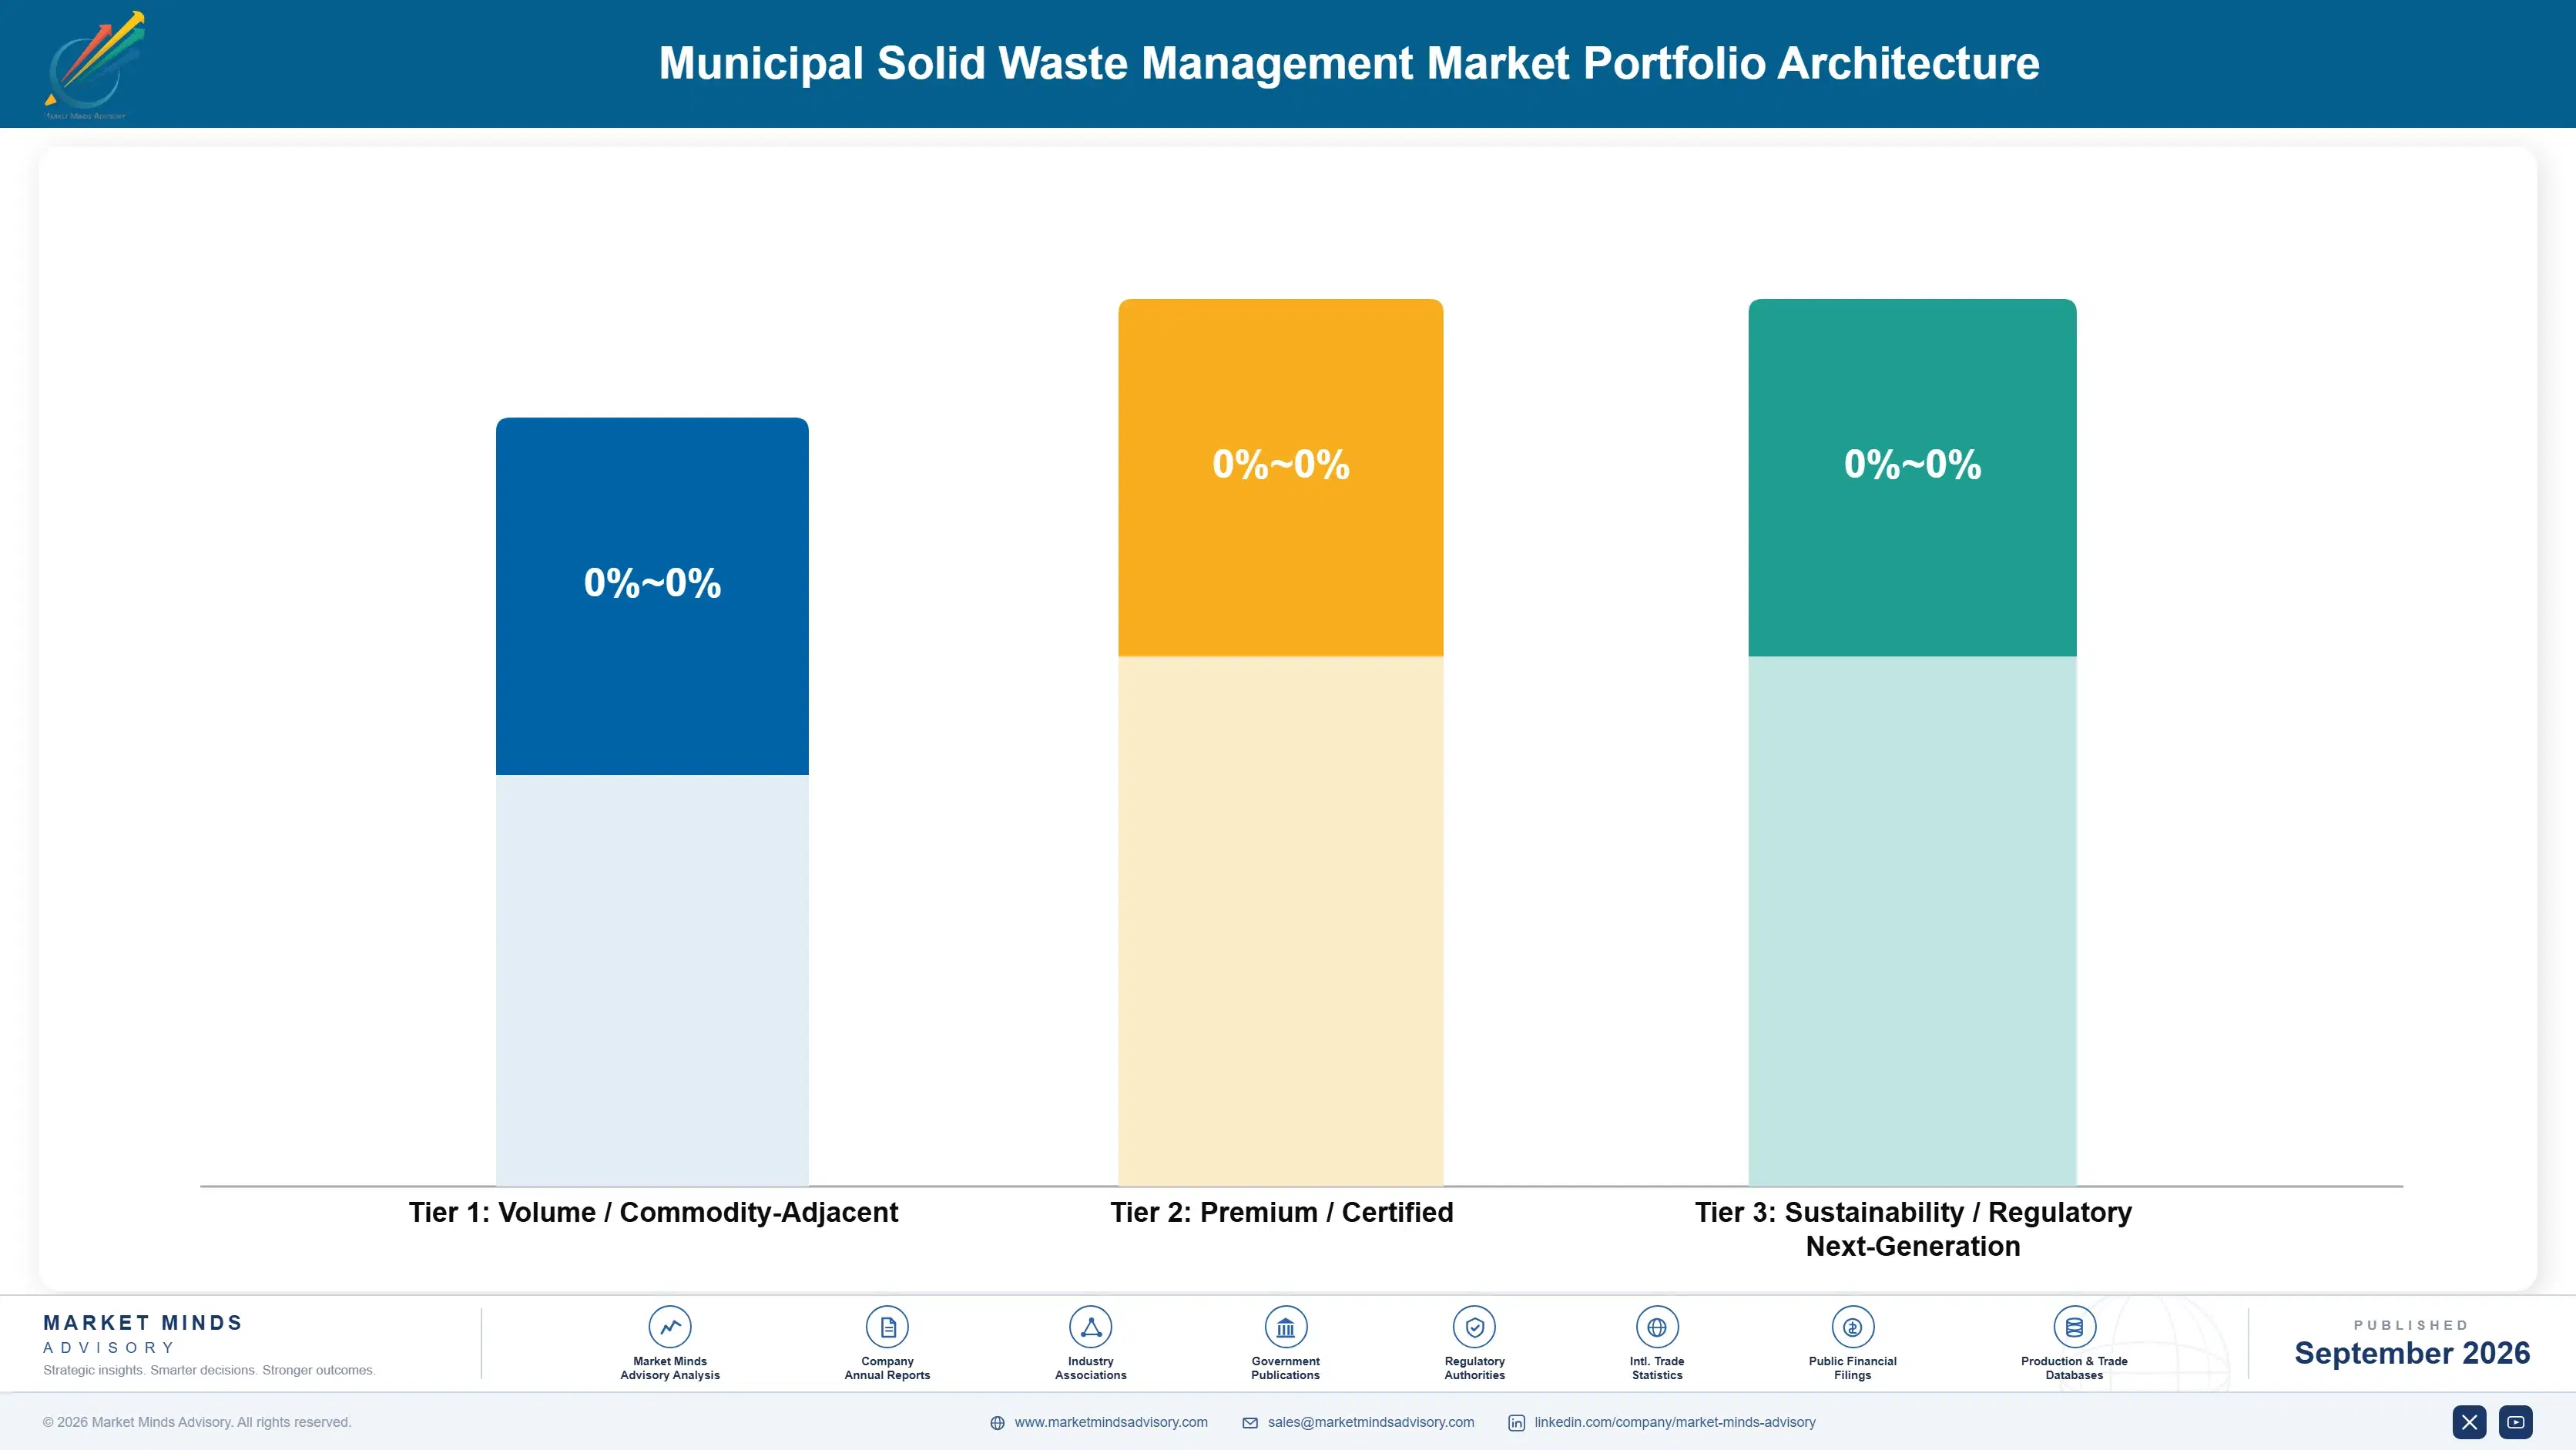
Margin architecture separates on capital intensity and on how contested each route is. Engineered landfill and composting earn least on a gate fee basis, though landfill margins look better than they are before aftercare provisioning is properly counted. Mechanical biological treatment and incineration sit in the middle. Advanced material recovery and anaerobic digestion earn most, because both carry regulatory mandate and secondary product revenue alongside the gate fee.
The volume versus premium tension is unusually literal in this industry. Landfill takes any tonne at low cost and no separation requirement, which is operationally simple and commercially declining. Digestion and material recovery need clean feedstock, which means depending on household behaviour the operator does not control. Operators keep choosing the high-value route and then discovering that 14% contamination decides the economics rather than the plant does.

High-value pools concentrate in anaerobic digestion and advanced sorting, and neither is reached by adding capacity alone. Digestion needs clean source separation, which requires years of household engagement no capital expenditure substitutes for. Sorting needs producer responsibility funding, which is allocated in policy consultations most operators never attend. Both depend on things happening outside the operator's own fence line entirely.

Volume / Commodity-Adjacent

Engineered landfill disposal and composting, taking any tonne at low gate fees with minimal separation requirements. The eight point spread separates operators who have provisioned honestly for thirty year aftercare obligations from those still reporting margins that ignore the liability.
Gross Margin: 12% to 20%

Premium / Certified

Energy recovery incineration and mechanical biological treatment, financed against long municipal contracts with guaranteed tonnage. The ten point spread tracks how much of an operator's capacity sits under contracts with fuel and labour indexation rather than fixed pricing agreed years ago.
Gross Margin: 24% to 34%

Sustainability / Regulatory / Next-Generation

Anaerobic digestion and advanced material recovery, both carrying regulatory mandate and secondary revenue from biogas, digestate or recovered commodities. The twelve point spread reflects feedstock quality, which contamination rates rather than plant sophistication ultimately determine.
Gross Margin: 36% to 48%
municipal-solid-waste-management-market-portfolio-architecture-1789988892910

High-value Sub-segments and Strategic Watch-out

Anaerobic Digestion Of Source-Separated Organics

Grows at 8.4% on mandates removing organic waste from landfill, with biogas and digestate revenue alongside the gate fee. The twelve point spread reflects feedstock quality. Contamination around 14% decides whether the digestate sells as a product or becomes another disposal problem. Kitchens decide this, not engineers.
Gross Margin: 36% to 48%

Advanced Material Recovery And Sorting

Grows at 7.2% on producer responsibility schemes funding sorting infrastructure that municipal budgets would never have approved. The twelve point spread reflects automation depth. Commodity price volatility means gate fees rather than recovered material sales underpin the actual business case here. Commodity revenue is a bonus rather than a foundation.
Gross Margin: 36% to 48%

Energy Recovery Incineration

Grows at 6.1% on land scarcity in dense economies rather than on any climate argument, financed against 18 year tonnage guarantees. The ten point spread reflects contract indexation. European capacity now faces authorities whose recycling improvements removed the waste those contracts assumed would arrive. Nobody forecast recycling improving that fast.
Gross Margin: 24% to 34%

Engineered Landfill Disposal

Grows at 1.9%, slowest of the six routes, as diversion mandates and thirty year aftercare provisioning reprice the cheapest option upward. The eight point spread separates honest provisioning from optimistic provisioning. Permitted airspace remains genuinely scarce and valuable in most developed markets. New permits are effectively unobtainable now.
Gross Margin: 12% to 20%

Why These Contracts Run So Long

The annuity is the municipal contract, and its length comes from capital rather than from customer loyalty. A treatment facility costing hundreds of millions requires certain throughput across its debt life, and no lender accepts a council's recycling ambition as collateral, so agreements run around 18 years with guaranteed tonnage attached. Once signed, the relationship is fixed for a generation of local politicians, several of whom will campaign against it without changing anything.
Depth varies by what physical asset sits behind the contract. An incinerator built for one authority under a tonnage guarantee is the deepest arrangement here and the most uncomfortable. A collection contract renegotiates on a shorter cycle and moves on price. Landfill with permitted airspace nobody else holds is deepest of all, because there is genuinely nowhere else for the waste to go.

The buyer has moved from a public works department to a climate and sustainability function in much of Europe and North America, and the questions changed with it. Public works asked about cost per tonne and route reliability. Sustainability asks about diversion rates, methane and where material actually ends up. Operators still answering the first set are losing tenders they would once have won.
municipal-solid-waste-management-market-end-use-penetration-index-1789988893409

What Decides Returns Here

These are among the four positions where our research anticipates prominent divergence between winners and laggards over the coming forecast period. Each is grounded in the demand model, the regulatory perimeter, and the announced capacity pipeline.
01 / LIABILITY PROVISIONING HONESTY

Fund Thirty Years Of Aftercare Now

A closed landfill requires around thirty years of leachate management, gas capture and groundwater monitoring, all funded from gate fees charged while the site is still accepting waste and generating revenue. Operators who under-provisioned during the 1990s are meeting those costs today from sites that earn nothing at all. Pricing the full obligation into current fees looks like a competitive disadvantage and is the only sustainable position, since regulators keep raising assurance requirements and underprovisioned operators end up selling cheaply.
02 / PRODUCER FUNDING POSITIONING

Get Into The Scheme Consultations Early

Extended producer responsibility transfers packaging collection and sorting costs from ratepayers to producers, supplying capital for optical sorting and robotics that no municipal council would have funded through local taxation anywhere. Advanced material recovery compounds at 7.2% on that money arriving from outside the waste budget entirely. Scheme design is settled in consultation processes years before implementation, and remarkably few operators attend them despite those processes determining exactly where the infrastructure money eventually lands and who ends up operating it.
03 / FEEDSTOCK QUALITY DISCIPLINE

Solve The Bin Before The Plant

Separately collected organic waste arrives with around 14% contamination, and every point beyond that degrades digestate until agricultural buyers reject it and a saleable product becomes another disposal cost instead. Operators keep investing in processing sophistication when the problem sits in millions of kitchens upstream that no plant engineering reaches. Household education, transparent bin rejection and clear feedback move contamination further than any pre-treatment line does, at a very small fraction of the capital cost, and almost nobody sequences it that way.
04 / CONTRACT STRUCTURE INNOVATION

Pool Tonnage Instead Of Guaranteeing It

Municipal agreements run around 18 years with guaranteed tonnage because lenders demand throughput certainty across the debt life, and several European authorities now pay for waste that improved recycling removed from the stream. Regional pooling across several authorities delivers the certainty a lender requires without obliging any single city to guarantee volumes it is actively working to reduce. The obstacle is cooperation between authorities who procure separately, and the operators arranging it are winning on terms their competitors simply cannot match.

Engagement Snapshot From the Field

A live engagement with an industry participant carrying material or product regulatory and market exposure ahead of a defining policy shift, showing how our research translates into a defensible multi-year portfolio strategy.
MARKET MINDS ADVISORY · CLIENT ENGAGEMENT SUMMARY
Municipal Solid Waste Management Producer Strategic Portfolio Review and Transition Roadmap 2026·Investment Scenario on Municipal Solid Waste Management Exposure Evaluation 2025-26
CLIENT PROFILE
A northern European municipal authority serving around 780,000 residents, holding an energy recovery incineration contract signed in 2011 with fourteen years still to run and a guaranteed annual tonnage attached to it. Household recycling had improved considerably faster than the original forecast assumed. The authority was paying for tonnage it no longer generated and importing waste to cover the shortfall.
STRATEGIC CHALLENGE
The sustainability function wanted the contract terminated on the grounds that it discouraged further recycling improvement. Finance pointed out that termination penalties exceeded the annual shortfall payments by a wide margin. Neither had modelled what the shortfall would look like as recycling continued improving, and the council had scheduled a public decision before anybody produced that analysis.
MMA APPROACH
MMA modelled residual waste tonnage through to contract expiry under three recycling improvement scenarios, and priced the shortfall payments against termination and renegotiation options. We assessed regional tonnage pooling with neighbouring authorities as an alternative to imports, and tested each option against the authority's own diversion targets. The work drew on 47 expert interviews conducted in Q4 2025 with operators, lenders and comparable authorities.
KEY FINDINGS
  1. Shortfall payments would rise roughly 3 times by contract expiry under the central recycling scenario, which nobody in the authority had modelled at all.
  2. Termination penalties exceeded fourteen years of projected shortfall payments by about 40%, so terminating was worse than continuing (client-reported, unverified by MMA).
  3. Two neighbouring authorities held uncontracted residual tonnage, and pooling arrangements with them would have covered around 70% of the projected annual shortfall.
  4. Imported waste covering the gap was travelling roughly 400 kilometres, at a carbon cost that undermined the diversion argument the sustainability function was making.
CLIENT PROFILE
A northern European municipal authority serving around 780,000 residents, holding an energy recovery incineration contract signed in 2011 with fourteen years still to run and a guaranteed annual tonnage attached to it. Household recycling had improved considerably faster than the original forecast assumed. The authority was paying for tonnage it no longer generated and importing waste to cover the shortfall.
STRATEGIC CHALLENGE
The sustainability function wanted the contract terminated on the grounds that it discouraged further recycling improvement. Finance pointed out that termination penalties exceeded the annual shortfall payments by a wide margin. Neither had modelled what the shortfall would look like as recycling continued improving, and the council had scheduled a public decision before anybody produced that analysis.
MMA APPROACH
MMA modelled residual waste tonnage through to contract expiry under three recycling improvement scenarios, and priced the shortfall payments against termination and renegotiation options. We assessed regional tonnage pooling with neighbouring authorities as an alternative to imports, and tested each option against the authority's own diversion targets. The work drew on 47 expert interviews conducted in Q4 2025 with operators, lenders and comparable authorities.
KEY FINDINGS
  1. Shortfall payments would rise roughly 3 times by contract expiry under the central recycling scenario, which nobody in the authority had modelled at all.
  2. Termination penalties exceeded fourteen years of projected shortfall payments by about 40%, so terminating was worse than continuing (client-reported, unverified by MMA).
  3. Two neighbouring authorities held uncontracted residual tonnage, and pooling arrangements with them would have covered around 70% of the projected annual shortfall.
  4. Imported waste covering the gap was travelling roughly 400 kilometres, at a carbon cost that undermined the diversion argument the sustainability function was making.
RECOMMENDED STRATEGY
Phase 1: Phase one: negotiate a tonnage pooling arrangement with the two neighbouring authorities rather than continuing to import waste over long distances. Phase 2: Phase two: reopen the contract on shortfall pricing rather than on termination, since the operator prefers renegotiation to a public dispute. Phase 3: Phase three: write recycling improvement scenarios into every future treatment contract, so that guaranteed tonnage falls automatically as diversion rises.
OUTCOME
The authority arranged regional pooling with both neighbours and reopened shortfall terms rather than pursuing termination (client-reported, unverified by MMA). Imported tonnage stopped entirely and shortfall exposure fell substantially. Future treatment contracts now include declining tonnage guarantees tied to diversion targets, which is the change that outlasted the engagement itself.

Frequently Asked Questions

Foundational context covering the market sizes, CAGR, scope, country, region and competition that inform every finding below. This section is provided to cover basics and most often pre-purchase conversations, answered from the MMA Primary Research Dataset.

What is the current size of the Municipal Solid Waste Management Market?

Global value reaches USD 329.47 billion in 2026, measured as managed tonnage service revenue across collection, treatment and disposal. The 2025 base is USD 312.0 billion.

How large will the Municipal Solid Waste Management Market be by 2036?

Managed tonnage revenue reaches USD 568.13 billion by 2036, an increase of USD 238.66 billion over the forecast period. That represents 1.72 times expansion from the 2026 base.

What is the CAGR for the Municipal Solid Waste Management Market 2026 to 2036?

The base case runs at 5.6% annually, with a bull case at 6.8% if organic separation reaches European leader participation rates and a bear case at 4.4% if municipal budgets defer infrastructure renewal.

Which segment is growing fastest?

Anaerobic digestion of source-separated organics grows at 8.4%, half again the market rate of 5.6%. Organic waste in landfill generates methane, and separate collection is the only intervention that removes the problem entirely.

Who are the major companies in the Municipal Solid Waste Management Market?

Veolia, Waste Management, Republic Services, SUEZ and Remondis lead on managed tonnage revenue, together holding just 21%. Thousands of municipal and regional operators hold the remainder.

Which country is growing fastest?

India leads at 9.6%, as urban sanitation programmes formalise collection in cities where waste was previously handled informally. Indonesia and Vietnam follow on similar urbanisation arithmetic.

Report Segmentation Architecture

The full report scope spans multiple orthogonal segmentation dimensions, with cross-tabulated demand data provided for each dimension pair. Coverage extends further to regional breakdowns, trend trajectories, and the competitive detail needed to support segment-level decision-making.

By Destination Route

  • Anaerobic Digestion Of Source-Separated Organics
  • Advanced Material Recovery And Sorting
  • Energy Recovery Incineration
  • Mechanical Biological Treatment
  • Composting And Aerobic Stabilisation
  • Engineered Landfill Disposal

By End-Use Industry

  • Municipal And Local Authority Services
  • Commercial And Retail Premises
  • Hospitality And Food Service
  • Institutional And Education Estates
  • Multi-Occupancy Residential
  • Public Realm And Street Cleansing

By Commercial Dimension

  • Long Term Municipal Concessions
  • Competitive Tender Service Contracts
  • Merchant Gate Fee Capacity
  • Producer Responsibility Scheme Funding
  • Public Private Partnership Structures
  • Direct Commercial Customer Contracts

By Region

  • North America
  • Western Europe
  • East Asia
  • South Asia and Pacific
  • Latin America
  • Middle East and Africa
  • Eastern Europe

Scope, Methodology, and Coverage

Every figure in this report is reproducible from documented input assumptions. The scope below maps the historical period, the forecast horizon, the segmentation dimensions, and the countries covered, alongside the underlying primary and qualitative methodology.
Historical Period
2020 to 2025
Forecast Period
2026 to 2036
Base Year
2025 (USD billions; MMA Primary Research Dataset, September 2026)
Market Definition
This report covers collection, treatment and disposal of municipal solid waste, segmented by destination route: advanced material recovery and sorting, anaerobic digestion of source-separated organics, energy recovery incineration, composting and aerobic stabilisation, mechanical biological treatment, and engineered landfill disposal. It excludes hazardous and clinical waste, industrial process waste, construction and demolition debris, wastewater treatment, and manufacture of collection vehicles or processing equipment.
Quantitative Units
USD millions, managed tonnage service revenue basis; managed tonnes annually; gate fees per tonne in USD; contamination rates as a percentage; post-closure obligation periods in years.
Segmentation Dimensions
Waste destination route; customer or premises type; commercial contracting structure; geography across seven regions.
Regions Covered
North America, Western Europe, East Asia, South Asia and Pacific, Latin America, Middle East and Africa, Eastern Europe
Countries Covered
China, Japan, South Korea, India, Indonesia, Australia, United States, Canada, Mexico, Brazil, Chile, Germany, Netherlands, France, Sweden, United Kingdom, Poland, Romania, United Arab Emirates, South Africa.
Key Companies Profiled
Veolia, Waste Management, Republic Services, SUEZ, Remondis, Waste Connections, Reworld, FCC Environment, Urbaser, Biffa, Renewi, China Everbright Environment, GFL Environmental, Cleanaway Waste Management, Indaver.
Quantitative Methodology
Primary survey, n=3,800 respondents, Q4 2025, six countries; demand-side model with trade association cross-validation
Qualitative Methodology
47 expert interviews, Q4 2025; applied to validate demand model assumptions, identify emerging dynamics, and assess competitive positioning
Report Format
PDF and XLSX data workbook (Word format preview document)
Publisher
Market Minds Advisory
Report Code
MMA-2026-ENE-121
Published
September 2026
Contact
sales@marketmindsadvisory.com | www.marketmindsadvisory.com

Purchase the full Municipal Solid Waste Management Market Report (2026 to 2036).

This report sizes the global municipal solid waste management market from 2026 to 2036 across six destination routes, six premises types and seven regions. It explains why a thirty year post-closure obligation reprices landfill against every alternative, how 14% contamination decides whether a digestion plant sells a product, and why 18 year tonnage guarantees now oblige European cities to deliver waste they no longer generate. Cost composition is sourced to EIA fuel data and company annual reports, with contract indexation analysed as the margin variable. Regional analysis explains why East Asia leads at 30% while India grows at 9.6%. Competitive assessment covers 20 named operators.
Six destination routes sized through to 2036
Post-closure liability modelled as the repricing mechanism
Collection cost composition from EIA and filings
Twenty named operators assessed on tonnage revenue
Four revenue levers with quantified commercial impact
Anonymised European authority contract review engagement included

Built For The People Who Decide

From boardroom strategy to bench-side execution, this report is read cover-to-cover by leaders shaping the next decade of their industry, turning demand scenarios, market dynamics and valuation benchmarks into decisions.
CXOs/ Presidents/ VPs/ Managers
M&A and Corporate Development
Strategy Teams and R&D Heads
Procurement and Product Directors
Regulatory and Compliance Leaders
Investor Relations and Equity Analysts