Market Minds Advisory
Multilayer Flexible Packaging Market

Multilayer Flexible Packaging Market: Every Layer Is There Because Something Failed

Every layer in a nine-layer structure is there because something failed a shelf life test once. Delayering campaigns keep running into that history, and the requalification bill nobody costed at the start.

Lead Analyst

Bilal Shaikh

Published

August 2026

Make Smarter Decisions with Customized Research Insights

Request a free sample report and evaluate market opportunities, growth trends, and competitive dynamics relevant to your business needs.

2025 MARKET VALUE$96.5BMarket Size 2025
2036 FORECAST VALUE$190.9BBase Case , 2026 to 2036
CAGR 2026 TO 20366.4 %Bull 7.6% / Bear 5.2%
INCREMENTAL OPPORTUNITY$88.2BNet 10- year value creation
EXPANSION MULTIPLE1.86x2036 value over 2026 base
Strategic Levers
M&A Pipeline
Regional Outlook
Country Rankings
Competitive Intelligence
Segmental Deep-dive
Call-Us : 91 93563 13602

Executive Snapshot and Market Trajectory

Nobody designs a seven-layer film for fun. Each layer answers a documented failure: oxygen ingress, delamination, seal contamination, curl on the filling machine. Recyclability now asks converters to strip layers whose removal reintroduces exactly the problem they were originally added to solve, and the industry has no good answer yet.
Growth runs at 6.4% on food safety requirements, chilled distribution reach, and single-serve format expansion in Asia. Transparent high-barrier oxide-coated structures grow fastest at 9.6%, exactly 1.50 times the market rate, because they deliver foil-class barrier without foil and without opacity. Oxygen-barrier structures using ethylene vinyl alcohol and polyamide follow at 7.8%. East Asia holds the largest share on converting capacity that no other region approaches.
Concentration reaches only 21% across the top five measured on annual converted film volume, which is remarkably low for a business of this scale and reflects how local converting economics remain. Resin runs 58% of cost of goods, so the industry is a polymer buyer before it is anything else. Requalification takes 14 months, and that single number governs how fast anything in this business actually changes on a converting line.
Market Definition
This market covers laminated and coextruded flexible packaging structures of two or more layers, measured at converter realised prices, spanning transparent high-barrier oxide-coated, oxygen-barrier, metallised barrier, moisture-barrier, non-barrier, and aluminium foil multilayer classes. Monolayer film, rigid and semi-rigid packaging, paper-based packaging without a polymer barrier layer, base resin and substrate production, and packaging or filling machinery are excluded from scope.
Base Year Value
$96.5B in 2025 (MMA Primary Research Dataset, August 2026)
Forecast Period
2026 to 2036, eleven discrete annual values
CAGR
6.4% base case. Bull 7.6%. Bear 5.2%.
Fastest Growth Segment
Transparent High-Barrier Oxide-Coated Structures: 9.6% CAGR
Fastest Growth Country
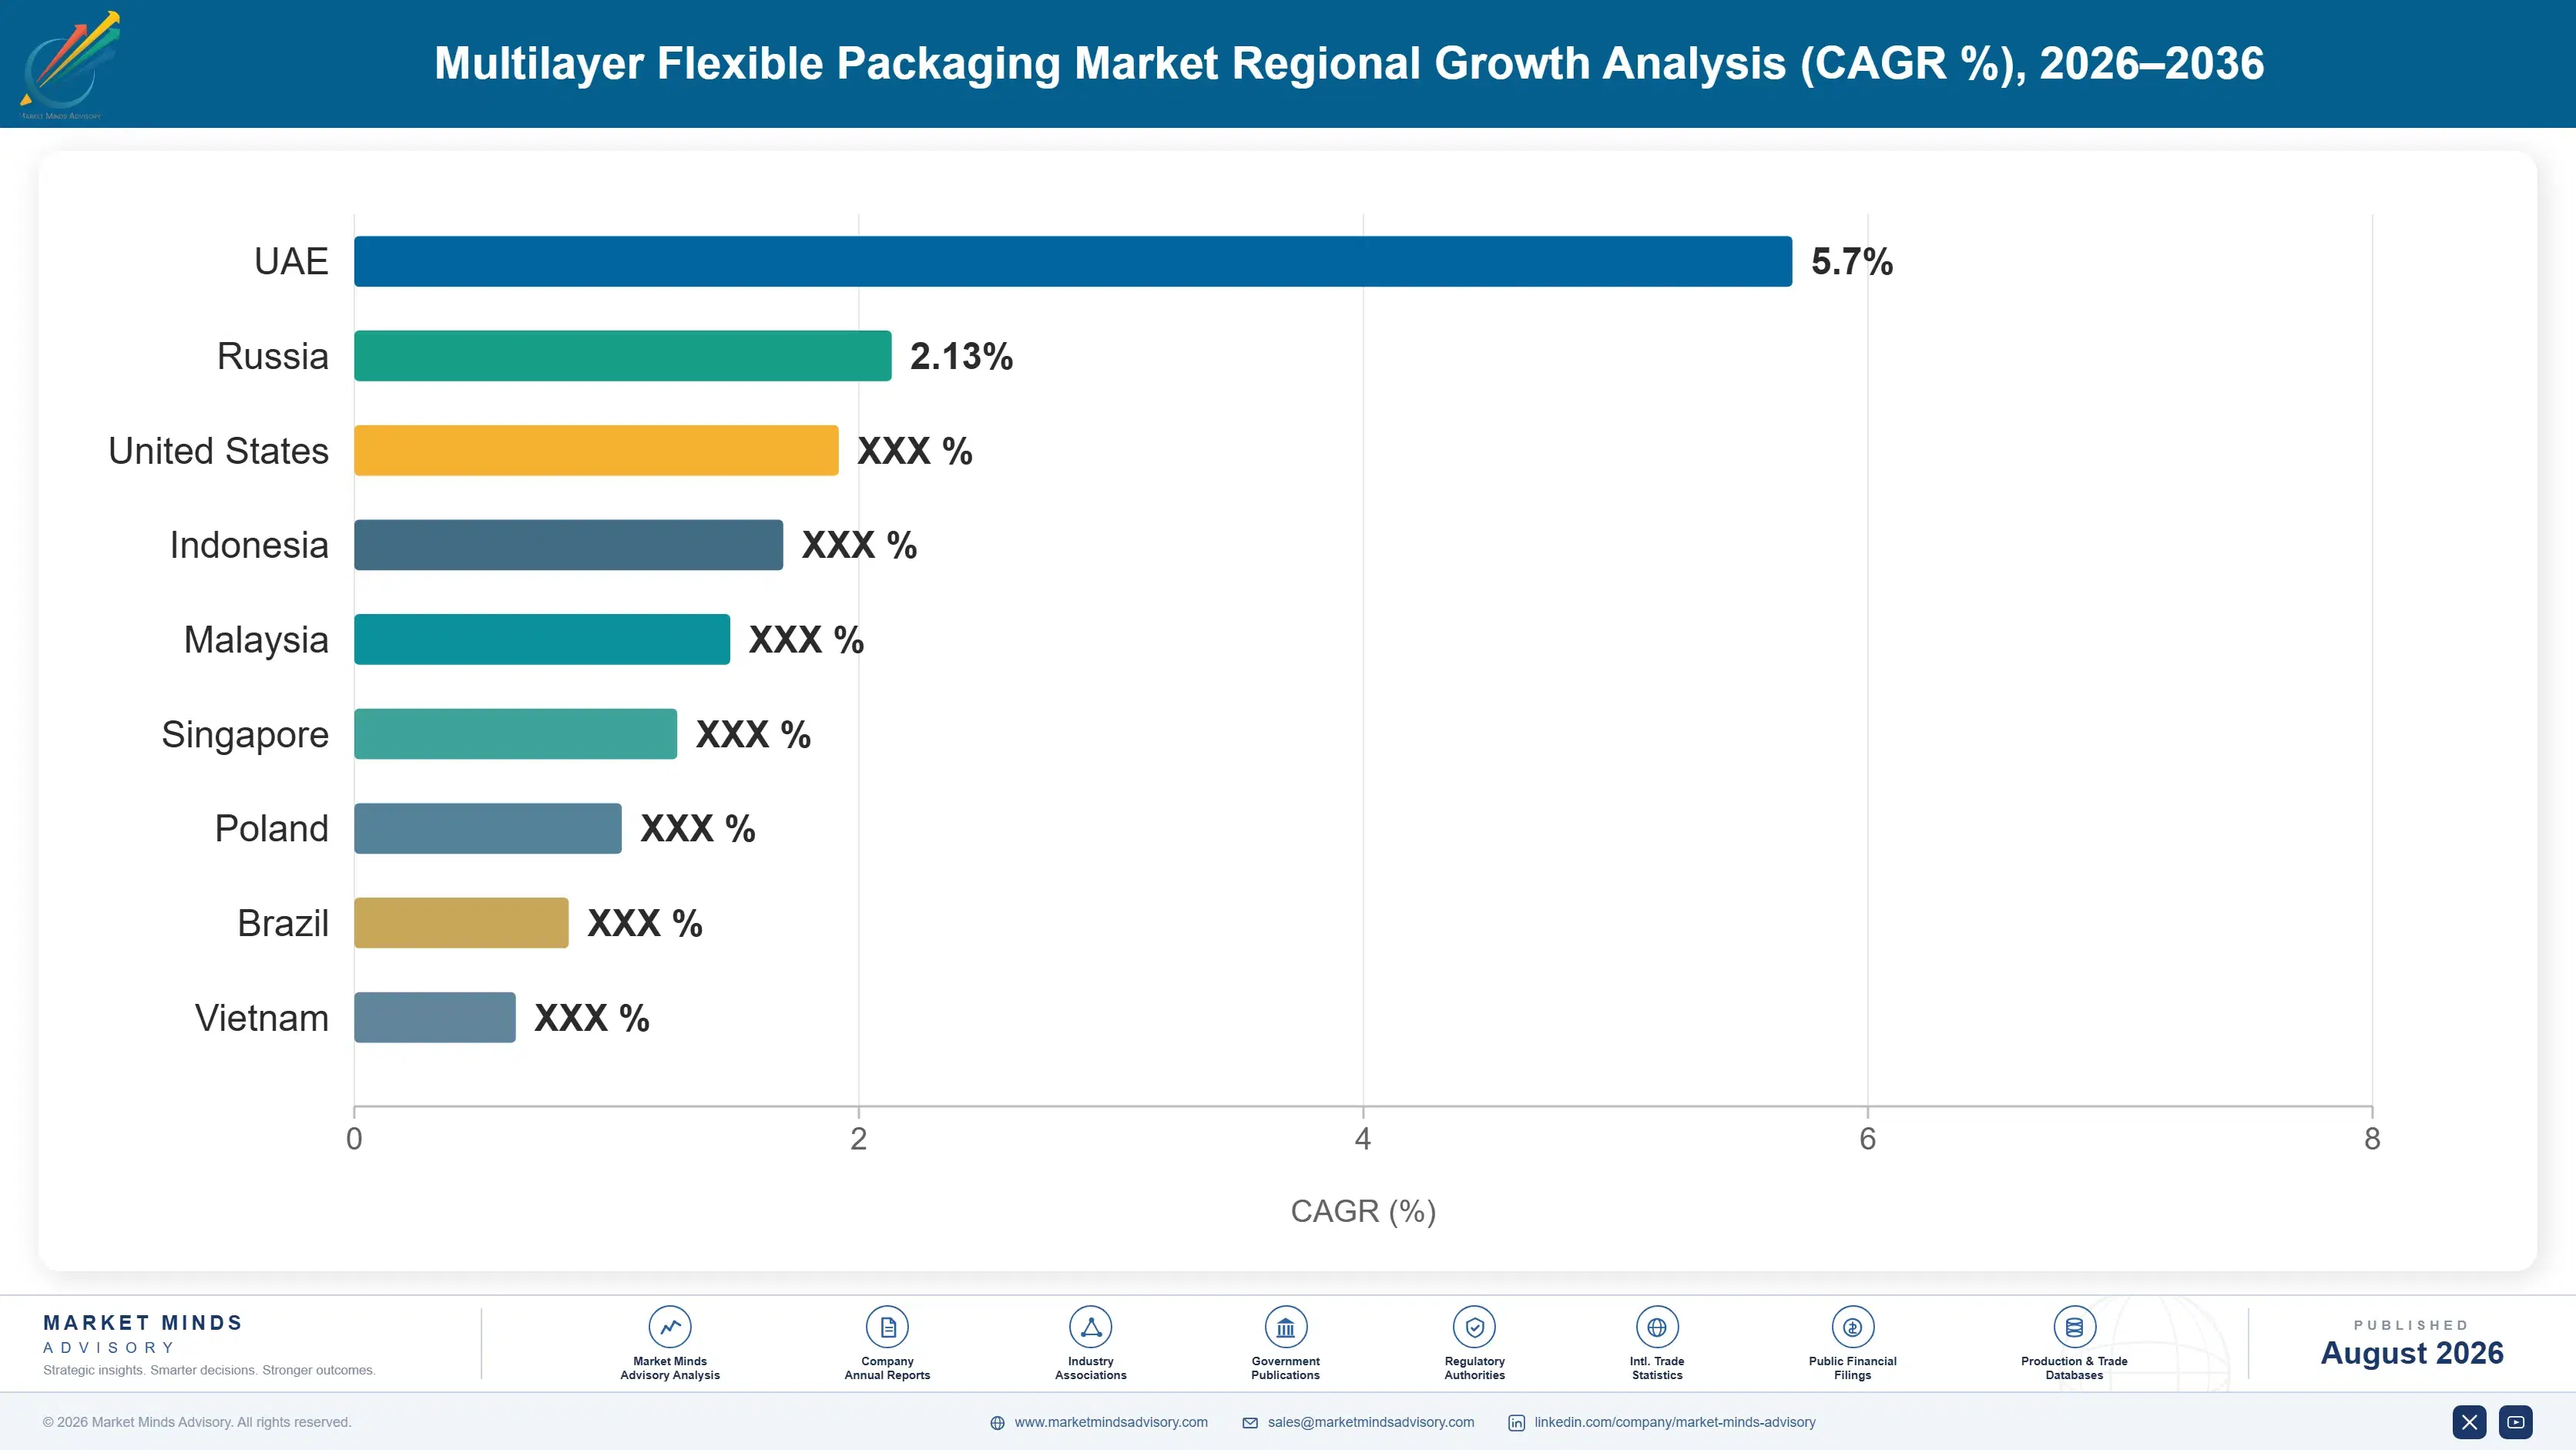
India: 9.4% CAGR
Fastest Growth Region
South Asia and Pacific: 8.5% CAGR
Largest Region
East Asia: 31% of 2025 global value
Market Leaders
Amcor, Berry Global, Sealed Air, Winpak, Sonoco. Source: MMA Analysis based on company annual reports.
Primary Survey
n=3,800 procurement and R&D decision-makers, Q4 2025, six countries
Methodology
Demand-side build-up, cross-validated against public data, 47 expert interviews

Multilayer Flexible Packaging Market Forecast Scenarios

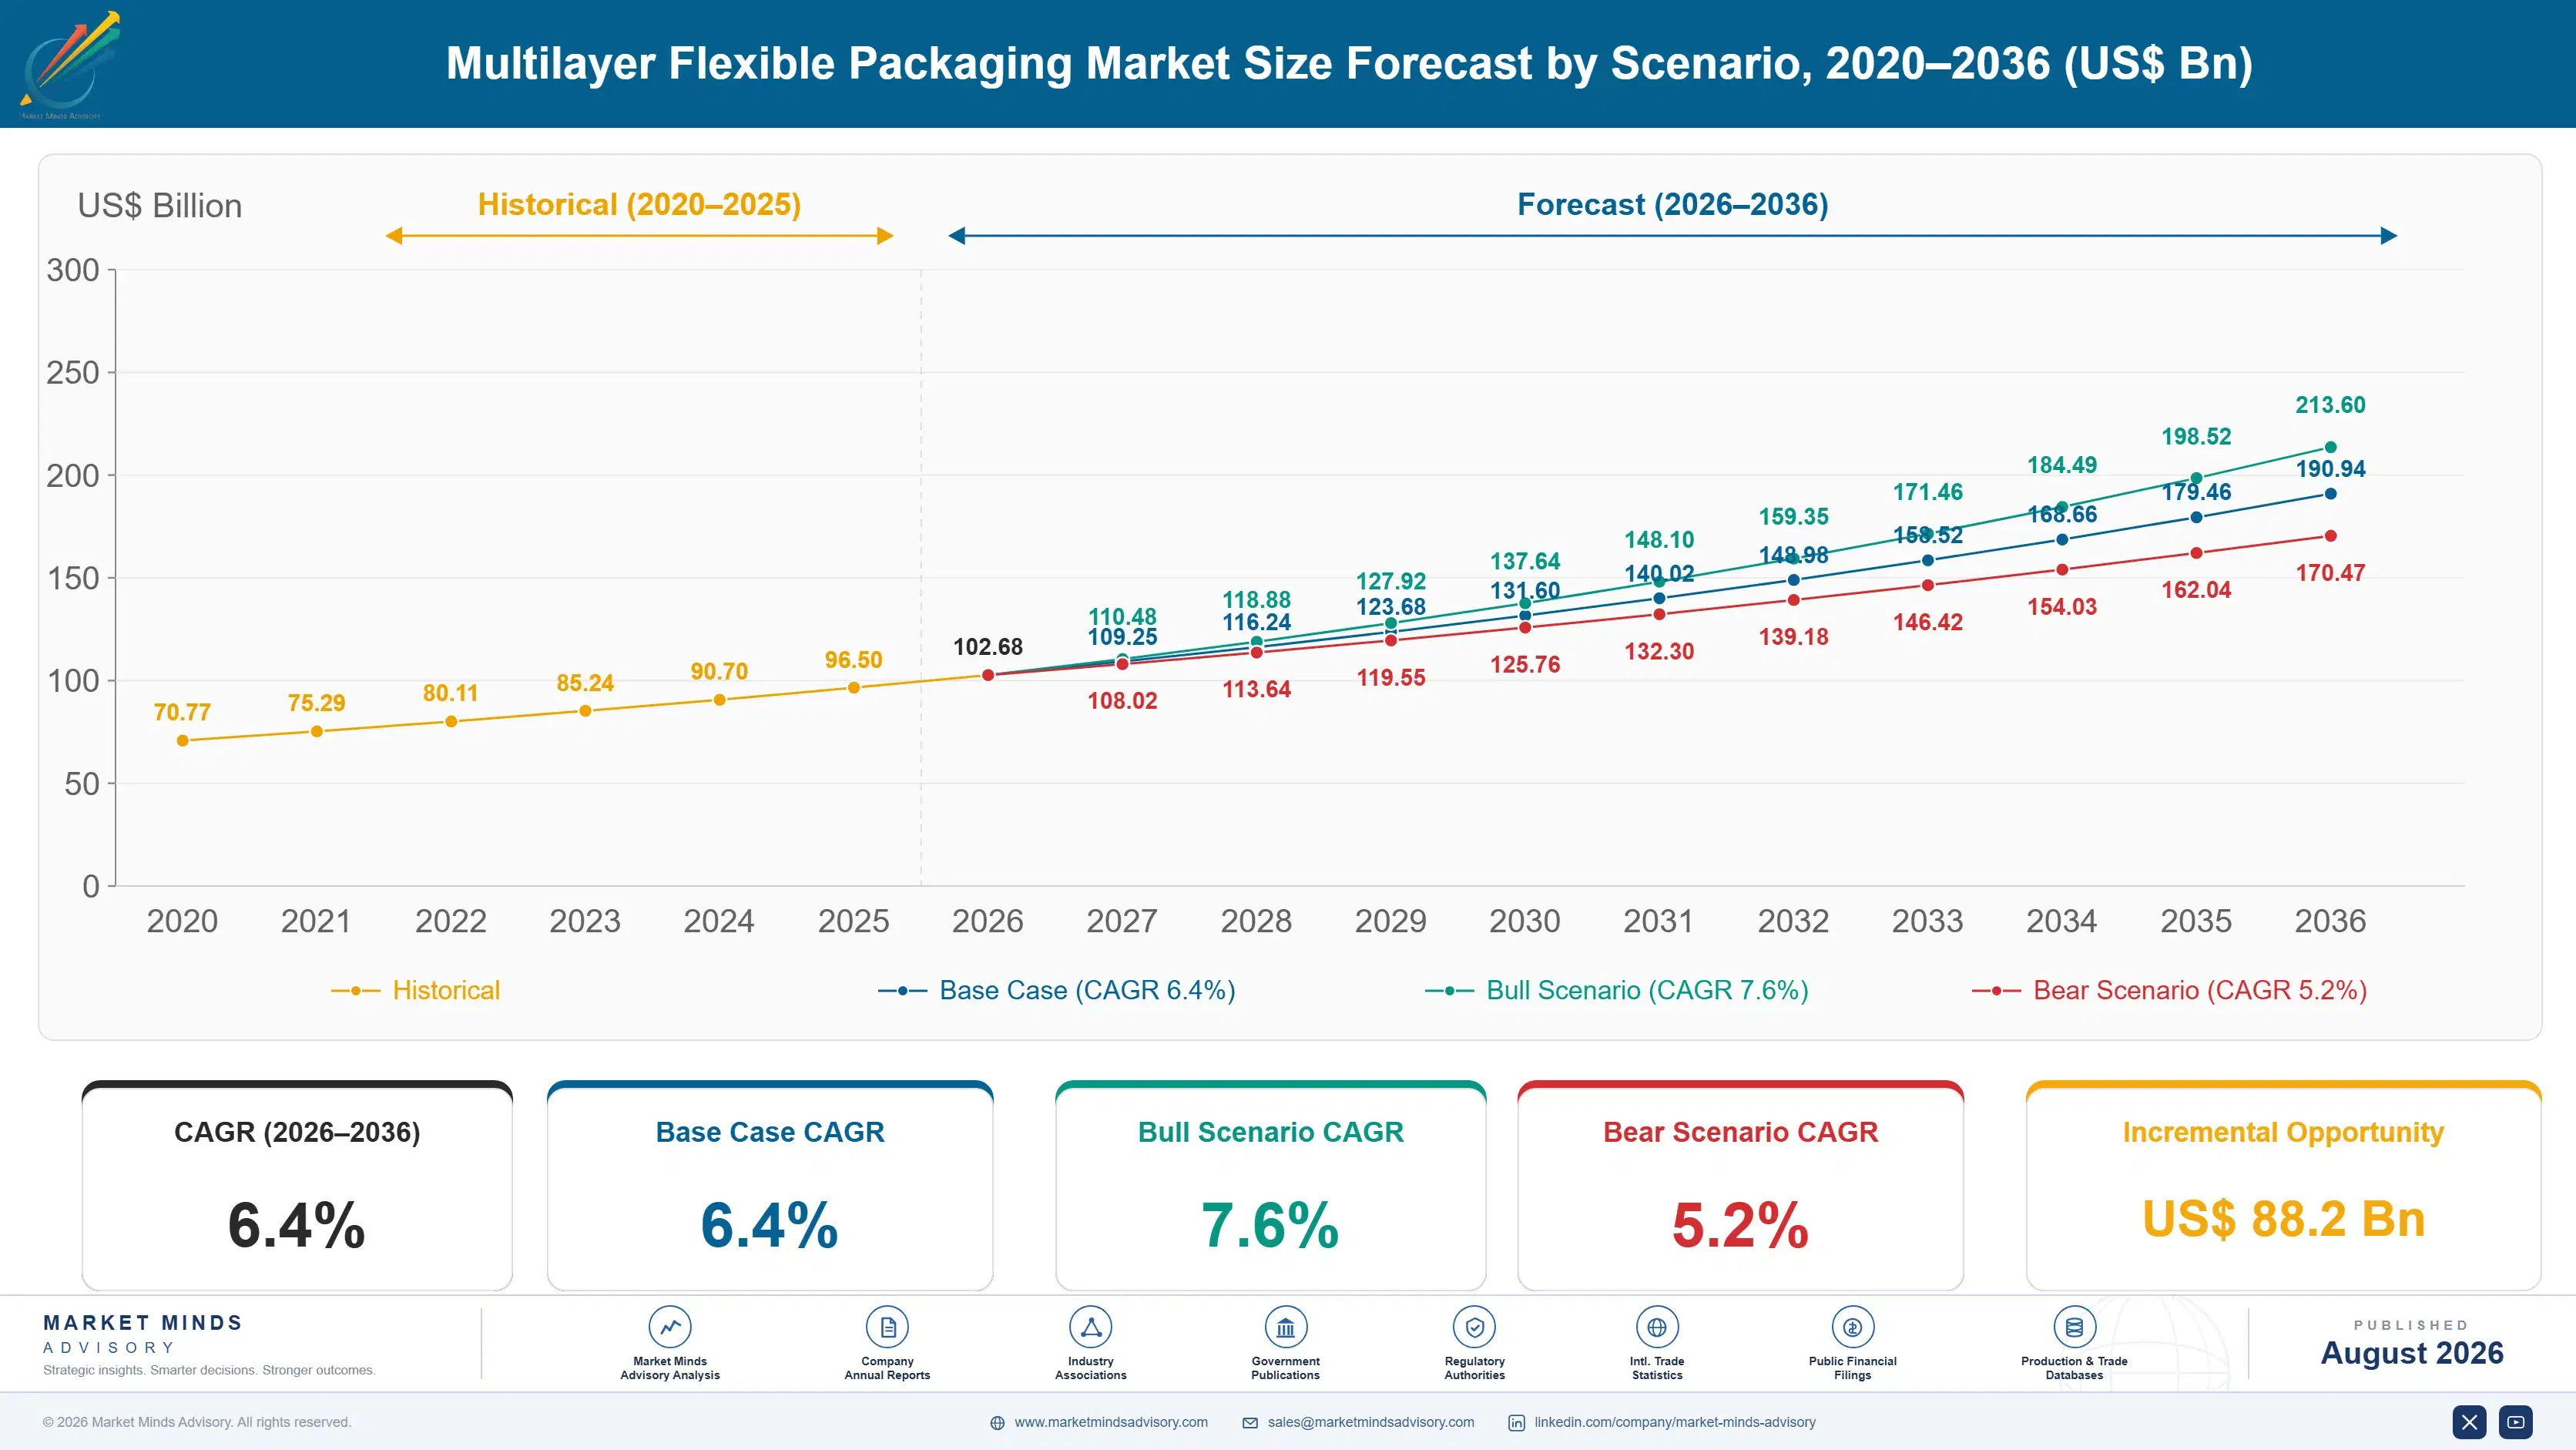
multilayer-flexible-packaging-market-size-forecast-scenario-1787299616769
Between 2020 and 2025 the business grew at 5.4%, which understates how much changed inside it. Volume shifted toward pouches and away from rigid formats, chilled distribution extended into markets that previously had none, and single-serve sachet demand in Asia absorbed enormous film volume at very thin margins. Converters added coextrusion capacity while adhesive lamination volumes held roughly flat. That mix shift matters more than the headline rate.
Three mechanisms carry the 6.4% base case. Food safety and shelf life requirements are the largest, since extending distribution range and reducing waste both run directly through barrier performance. Format conversion is the second, as pouches continue displacing cans, jars, and rigid tubs across categories where weight and shipping cost matter. And Asian single-serve demand is the third, delivering very large volume at margins that only scale makes workable at all.
The 7.6% bull case rests on oxide-coated transparent barrier reaching cost parity with metallised structures, which would pull a large volume of existing business into a higher-value class quickly. The 5.2% bear case is resin price collapse compressing realised film prices, since converters price off polymer and give back most of any input saving to customers within two quarters.

Reading the Qualification File

A nine-layer structure looks like over-engineering until you read its qualification file. There is a sealant layer, a tie layer because the sealant will not bond to the barrier, an ethylene vinyl alcohol barrier layer, another tie layer on the other side, a polyamide layer for puncture resistance, and an outer layer for printing and heat resistance. Every one of them answers something that failed.
TOP FIVE CONCENTRATION21%Unusually fragmented for a business of this scale
TYPICAL BARRIER LAYER COUNT7 layersCommon in structures for chilled and processed food
RESIN SHARE OF COGS58%Polymer input dominates converter cost before any conversion step
REQUALIFICATION LEAD TIME14 monthsShelf life testing required before any layer can change
COEXTRUSION SHARE46%Of structures produced without a separate lamination step involved
LINE SCRAP RATE9%Waste generated at startup and changeover across converting operations
That history is what makes delayering so slow. Removing a layer means requalifying the structure against shelf life, and shelf life testing runs real time on real product, which takes about 14 months before anybody knows whether it worked. No brand approves a change on accelerated data alone when the failure mode is spoiled food on a retail shelf.
Meanwhile the economics stay stubbornly simple. Resin is 58% of cost of goods, concentration sits at only 21% across the top five, and scrap runs near 9% because startup and changeover waste is unavoidable on a coextrusion line. Converters compete on scrap, on changeover time, and on how close they sit to the filling plant, because freight on empty film volume is punitive.
"Everybody in this business talks about resin like it is weather. It is not. Nine points of scrap and quarterly index terms are decisions somebody made, and they have cost more than the resin market ever did."
Director, Flexible Packaging and Barrier Structures Practice · MMA Packaging and

Market Trends

Oxide Coating Delivers Foil Barrier Without the Foil

Aluminium oxide and silicon oxide deposited a few nanometres thick onto polyester or polypropylene deliver oxygen and moisture barrier approaching foil, while staying transparent and microwaveable, neither of which foil manages. That combination is what pulls volume across: brands get the pack window consumers want and the shelf life the category demands from one structure. Growth runs at 9.6% against 6.4% for the market overall. Deposition capacity and flex-crack resistance are the two constraints holding it back. Foil still holds the applications where a pinhole cannot be tolerated at any price, and that boundary has moved slowly.
Market Impact: India grows at 9.4%
Layer Counts Rise Even As Total Thickness Falls

Downgauging has not simplified structures, it has complicated them. Converters removing microns compensate by adding functional layers, because a thinner film needs more help to hold barrier and puncture resistance at the same time. Nine-layer and eleven-layer coextrusion lines now run structures thinner overall than the five-layer films they replaced. That is genuinely counterintuitive and it explains why sustainability metrics based on layer count keep pointing the wrong direction. Material use per pack falls while recyclability gets harder, and both things are true at once. Roughly 18% of new coextrusion capacity commissioned since 2022 runs nine layers or more.
Market Impact: Around 6% annual rigid conversion

Market Opportunities and Growth Drivers

Chilled Distribution Extends Into Markets That Had None

Cold chain expansion changes what packaging has to do, because a product travelling four days chilled needs barrier that a product sold locally within a day never required. Refrigerated retail floor space across South and Southeast Asia has grown at double-digit rates for a decade, and every new chilled cabinet creates demand for structures that were previously unnecessary. India alone contributes the fastest national growth rate in this forecast at 9.4%. Converters serving those markets have moved from two-layer film to five-layer barrier structures within a single product generation. That is a large jump in one step.
Market Impact: Blocks change for 14 months

Pouches Keep Taking Volume From Cans And Jars

Format conversion is the oldest driver in flexible packaging and it has not finished. A stand-up pouch weighs a fraction of the glass jar or steel can it replaces, ships at a fraction of the freight cost, and occupies far less retail shelf depth. Pet food, soups, sauces, and baby food have all moved substantially, and categories that resisted on heat processing grounds are moving as retort-capable structures improve. Around 6% of remaining rigid volume in convertible categories shifts each year, and that transfer runs almost entirely into multilayer barrier film.
Market Impact: Resin is 58% of COGS

Market Restraints and Challenges

Requalification Takes Fourteen Months Before Anything Can Change

Any change to a structure that touches barrier requires shelf life requalification, and shelf life testing runs in real time on real product because accelerated data alone will not satisfy a brand whose failure mode is spoiled food. The root cause is that permeation is slow and its interaction with the specific product cannot be modelled reliably. Commercial impact is that a converter cannot respond to a resin shortage, a cost pressure, or a recyclability requirement inside 14 months. Participants are building pre-qualified structure libraries and running parallel testing programmes ahead of demand to compress it.
Market Impact: Growing at 9.6% annually

Resin Passes Through Faster Than Converters Can Absorb

Polymer runs 58% of cost of goods and contracts almost universally include price adjustment mechanisms tied to published resin indices, which sounds protective and is not. The root cause is that adjustment runs in both directions with a lag of one to two quarters, so converters absorb increases before recovering them and hand back decreases before they have earned anything. Commercial impact is margin that moves with resin rather than with performance. Mitigation runs through longer index lag negotiation, scrap reduction, and shifting mix toward structures where barrier performance rather than polymer weight sets the price.
Market Impact: 18% of new capacity
4 additional market trends, 3 additional growth drivers, and 2 additional restraints and challenges are covered in the full report. Contact sales@marketmindsadvisory.com to access the complete intelligence.

Segment CAGR and Growth Architecture

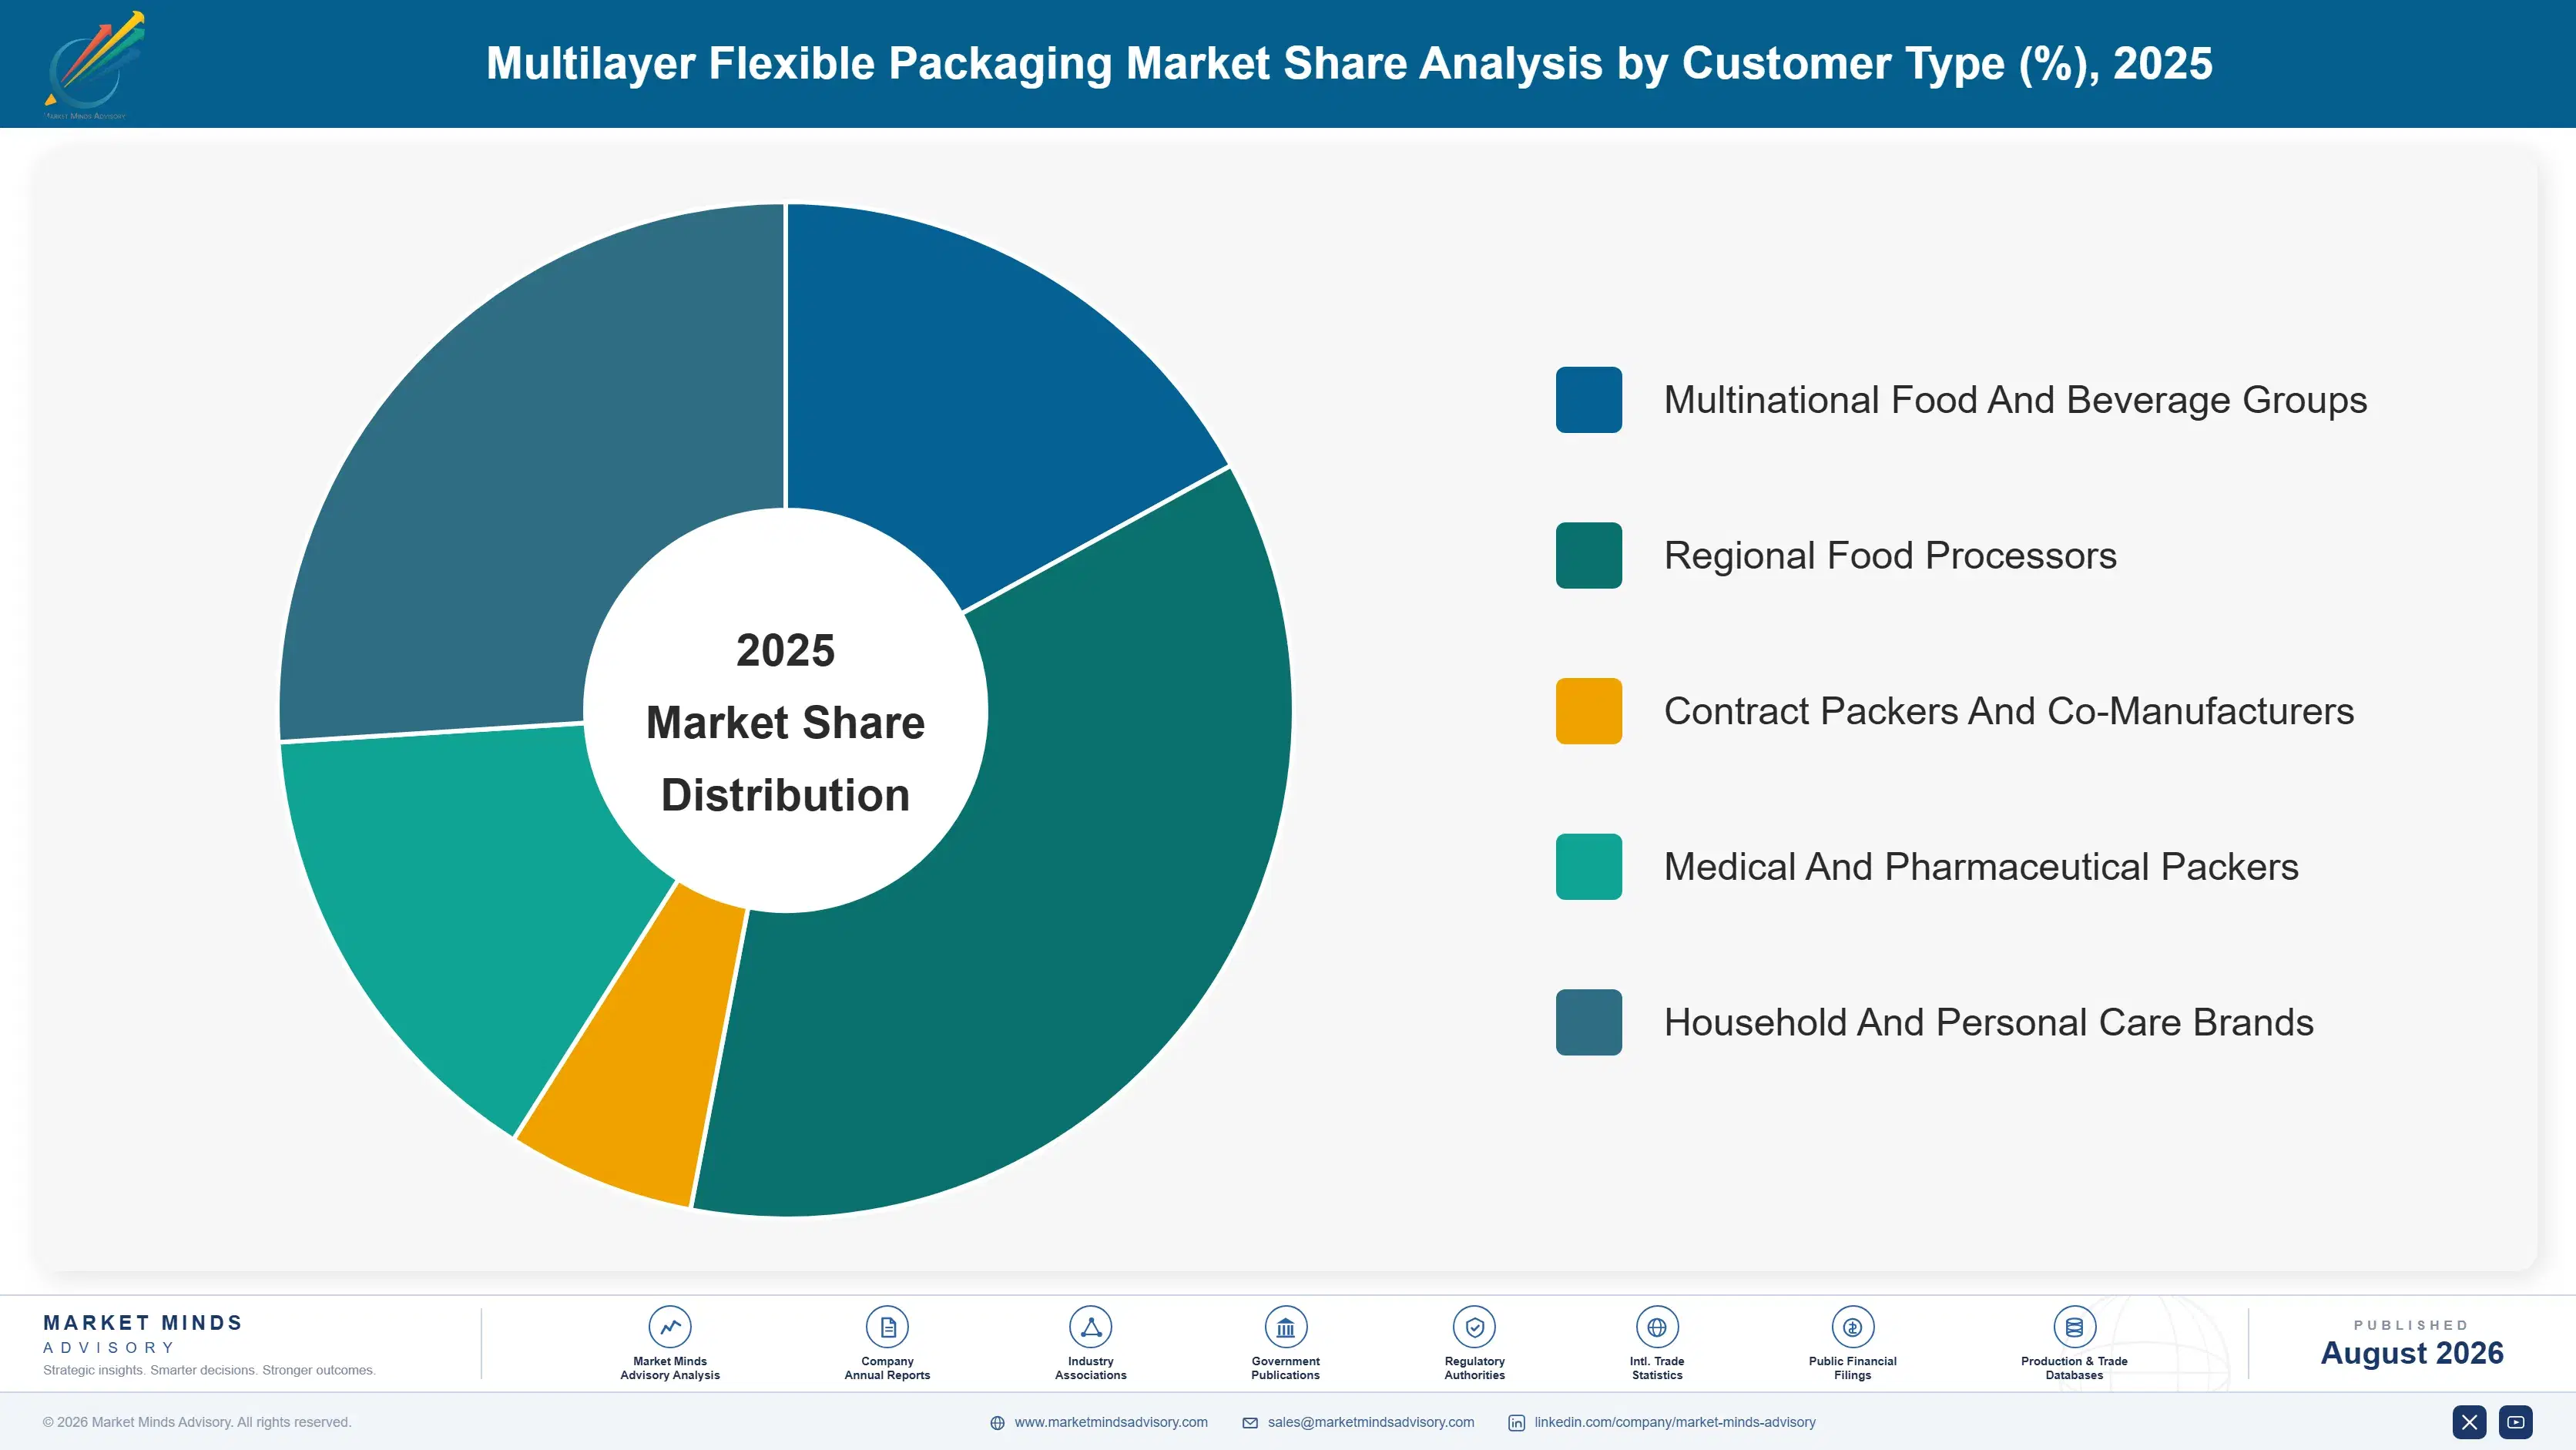
Segmentation follows barrier class, because barrier is what determines layer count, resin selection, conversion route, and the shelf life a brand can actually claim. Conversion technology and end-use category both cut across every barrier class rather than separating them, which makes either a poor primary dimension for a business organised around what the structure has to keep out.
multilayer-flexible-packaging-market-market-share-analysis-1787299617301

Transparent High-Barrier Oxide-Coated Structures

The fastest class at 9.6%, exactly 1.50 times the market rate, and the only one that delivers barrier close to foil while remaining transparent and microwaveable. Aluminium oxide and silicon oxide deposited a few nanometres thick onto polyester or polypropylene substrate do the work, and the coating adds almost nothing to structure weight. Adoption has been fastest in ready meals, pet food, and medical device packaging, where the pack window and the shelf life both matter. Two constraints hold it back: deposition capacity is limited to a modest number of qualified coaters, and the coating is brittle enough that flex cracking in distribution can compromise the barrier it provides. Coaters price accordingly.
CAGR 9.6%

Oxygen-Barrier Ethylene Vinyl Alcohol And Polyamide

Second fastest at 7.8%, and the workhorse of chilled and processed food where oxygen rather than moisture sets the shelf life. Ethylene vinyl alcohol delivers genuinely excellent oxygen barrier and loses much of it when wet, which is why these structures surround the barrier layer with polyolefin on both sides and tie layers to hold the whole thing together. That construction is what drives layer counts to seven and nine. Polyamide adds puncture and thermoforming performance the barrier layer cannot provide alone. Growth tracks chilled distribution expansion rather than any technology shift, and recyclability pressure is the main threat to it. A structure this good at its job is hard to replace.
CAGR 7.8%
Full segment breakdown across 6 segments available in the complete report.

Regional Architecture and Country Demand Map

Converting sits where food processing sits, so East Asia leads on capacity that no other region approaches, slightly above its framework band. Growth however runs fastest where chilled distribution is arriving rather than where it already exists, which points at South and Southeast Asia rather than China.

East Asia

Thirty-one percent, marginally above the framework band, and the justification is converting capacity rather than consumption: China alone operates more flexible packaging conversion lines than North America and Western Europe combined, serving both enormous domestic food processing volume and export packing. Japanese and Korean converters occupy the high-barrier end, supplying retort and medical structures at specifications the Chinese volume base does not attempt. Taiwan contributes substrate film supply into the regional structure. Growth at 7.4% runs above the global rate on continued chilled retail expansion in China and on domestic brands upgrading from two-layer to barrier structures. The upgrade path there is worth more than the volume growth underneath it.
Share: 31% | CAGR: 7.4% (2026 to 2036)

North America

Twenty-four percent, and the character here is high specification rather than high volume, with pet food, ready meals, and medical device packaging accounting for a disproportionate share of value. Converters run more nine-layer and above coextrusion capacity per unit of output than any other region, because the customer set will pay for performance. Retort structures for shelf-stable prepared food have grown steadily. Mexican converting has become a genuine part of the North American structure rather than a low-cost adjunct. Growth at 6.0% sits marginally below the global rate, reflecting a mature format-conversion position with limited chilled expansion left. Value growth here comes from mix, not from any more square metres.
Share: 24% | CAGR: 6.0% (2026 to 2036)
Regional intelligence for 5 additional markets available in the complete report: Western Europe, South Asia and Pacific, Latin America, Middle East and Africa, Eastern Europe. Contact sales@marketmindsadvisory.com.
multilayer-flexible-packaging-market-country-cagr-analysis-1787299617821

Where Multilayer Converters Actually Make Money

Resin is 58% of cost and requalification takes 14 months, which leaves less room to manoeuvre than most converters admit. Value comes from cutting scrap, from selling structure development rather than film, from building a pre-qualified library that removes the 14-month wait, and from mix shift into barrier classes where performance rather than polymer weight sets the price.

Attack Scrap Before Attacking Anything Else

Line scrap runs near 9% across the industry, generated almost entirely at startup and changeover, and every point of it is resin bought at full price and sold as regrind or waste. Converters cutting scrap from nine points to six recover roughly 1.7% of revenue straight to gross margin, which is more than most win from a whole year of price negotiation. The work is unglamorous: faster changeover, better startup profiles, tighter gauge control, operator discipline. Nobody wants to fund it because it appears nowhere on a customer proposal. That is precisely why it stays available.
Market Impact: Cutting three scrap points recovers about 1.7% of revenue

Build A Pre-Qualified Structure Library Ahead Of Demand

Requalification takes 14 months and it starts when the customer asks, which means a converter without pre-tested alternatives simply cannot respond to a resin shortage or a recyclability requirement inside a year. Running shelf life programmes on likely successor structures before anybody requests them costs perhaps 400,000 dollars a year in testing and sample production. It converts a 14-month answer into a two-month answer, and in a category where brands plan on annual cycles that difference decides who keeps the business. Very few converters have actually made that investment yet.
Market Impact: Parallel testing programme costs about 400,000 dollars annually

Sell Structure Development Instead Of Selling Film

Brands rarely know which structure they need; they know what the product is, how far it travels, and how long it has to last. A converter who turns that into a specification owns the qualification and therefore the supply for the structure's life, which typically runs seven to nine years. Converters selling to a specification written by somebody else compete on price for the same period. Building a development function costs around 900,000 dollars a year in staff and test capability, and it changes what a customer conversation is about.
Market Impact: Development function costs about 900,000 dollars each year

Move Mix Toward Barrier Rather Than Bulk

Non-barrier and moisture-barrier structures price off polymer weight, which means margin moves with resin and performance earns nothing. Oxide-coated and oxygen-barrier classes price off what the structure achieves, and gross margin runs fifteen to seventeen points higher as a result. Shifting even 15% of volume between those groups changes the shape of a converter's earnings more than any cost programme available. The obstacle is capital: deposition and nine-layer coextrusion capacity both require investment, and the customer set has to be built alongside it. Converters who moved early are already earning the spread.
Market Impact: Shifting 15% of volume reshapes the earnings profile

Who Controls the Margin Pool

Concentration reaches only 21% across the top five measured on annual converted film volume, which is remarkably low for a business of this size and reflects economics that stay stubbornly local. Freight on empty film is punitive relative to its value, so a converter three hundred kilometres from the filling plant beats one two thousand kilometres away regardless of scale. The gap between leader and nearest challenger is narrow enough that ordering depends on which volumes you count.
Competitive activity runs on four dimensions. Structure development capability is the first, since a converter who writes the specification owns the qualification. Scrap and changeover performance is the second and it decides who can quote profitably. Barrier capacity, particularly deposition and nine-layer coextrusion, is the third. Proximity to the filling plant is the fourth and it beats the other three more often than anyone in the industry likes to admit.

Emerging pressure comes from recyclability requirements that ask converters to remove layers they spent decades adding. Rankings will shift toward whoever holds pre-qualified reduced-layer structures when the deadlines arrive, and that is not necessarily the largest converter today.
multilayer-flexible-packaging-market-company-positioning-matrix-1787299618340

Competitive Moat and Risk Dimensions

AMCOR

Moat: Structure development across many geographies

Writing the specification rather than quoting against one is the difference between owning a structure for its seven to nine year life and competing on price every year. Doing that across many countries at once, with local qualification and local testing, is something very few converters can offer a multinational food company that wants one answer everywhere.
AMCOR

Risk: Enormous qualified structure portfolio

Every structure in a very large portfolio eventually needs a recyclable successor, and each one carries its own 14-month shelf life requalification with an individual customer. That programme scales with breadth rather than with revenue, so the largest portfolio faces the largest bill. Scale that helps in steady conditions works against you when the whole technical basis moves.
BERRY GLOBAL

Moat: Resin buying at genuine scale

Polymer is 58% of cost of goods, so purchasing terms matter more here than in almost any other converting business. Buying at very large aggregate volume across many plants delivers a cost position that a regional converter cannot approach on the single input that dominates the quotation. That advantage compounds every time resin moves.
BERRY GLOBAL

Risk: Cost position invites price competition

A business built on buying polymer better tends to sell on price, and customers learn to ask for the saving. Index-linked contracts then hand most of any input advantage back within two quarters. Competing on the input rather than on what the structure achieves leaves margin exposed to a variable nobody in the business controls.

Players Tracked

Prominent Players

Amcor
Berry Global
Sealed Air
Winpak
Sonoco

Other Key Players

Huhtamaki
Constantia Flexibles
Mondi
ProAmpac
Coveris
Wipak
Schur Flexibles
UFlex
Toppan
Dai Nippon Printing
Glenroy
TC Transcontinental
Printpack
Bryce Corporation
Sigma Plastics Group

Recent Developments

MARCH 2025

Converter commissions eleven-layer coextrusion line for chilled food structures

A flexible packaging converter commissioned an eleven-layer blown coextrusion line aimed at chilled protein and cheese structures where oxygen barrier and puncture resistance are both required. The investment was organic capital expenditure funded internally rather than any partnership, joint venture, or acquisition of existing converting capacity.
Signal: Layer counts keep rising even as total structure thickness falls, which most sustainability reporting misses entirely
JUNE 2025

Coating specialist expands transparent high-barrier deposition capacity in Asia

A vacuum deposition specialist expanded aluminium oxide coating capacity at an Asian site, targeting transparent high-barrier film for ready meals and pet food. The expansion was organic capital investment on an existing site rather than any acquisition of a competing coater or joint venture with a converter.
Signal: Deposition capacity rather than demand limits the fastest growing barrier class, and coaters are pricing accordingly today
SEPTEMBER 2025

Food group begins real-time shelf life testing on reduced-layer structures

An international food company started real-time shelf life programmes on reduced-layer successors across several chilled categories, ahead of any regulatory deadline requiring the change. The work was an internal packaging development decision rather than a supply agreement or any commercial arrangement with a specific converter.
Signal: Brands starting requalification early are the ones who will still have compliant structures when deadlines actually arrive

Buying Polymer, Selling Film

Polymer dominates at roughly 58% of cost of goods, split across polyethylene and polypropylene for the bulk layers, polyester for the outer web, ethylene vinyl alcohol and polyamide for barrier, and adhesive systems for lamination. Most of that resin comes from regional crackers within the converting region itself, since polymer freight economics discourage long-distance movement. Conversion energy adds about nine percent.
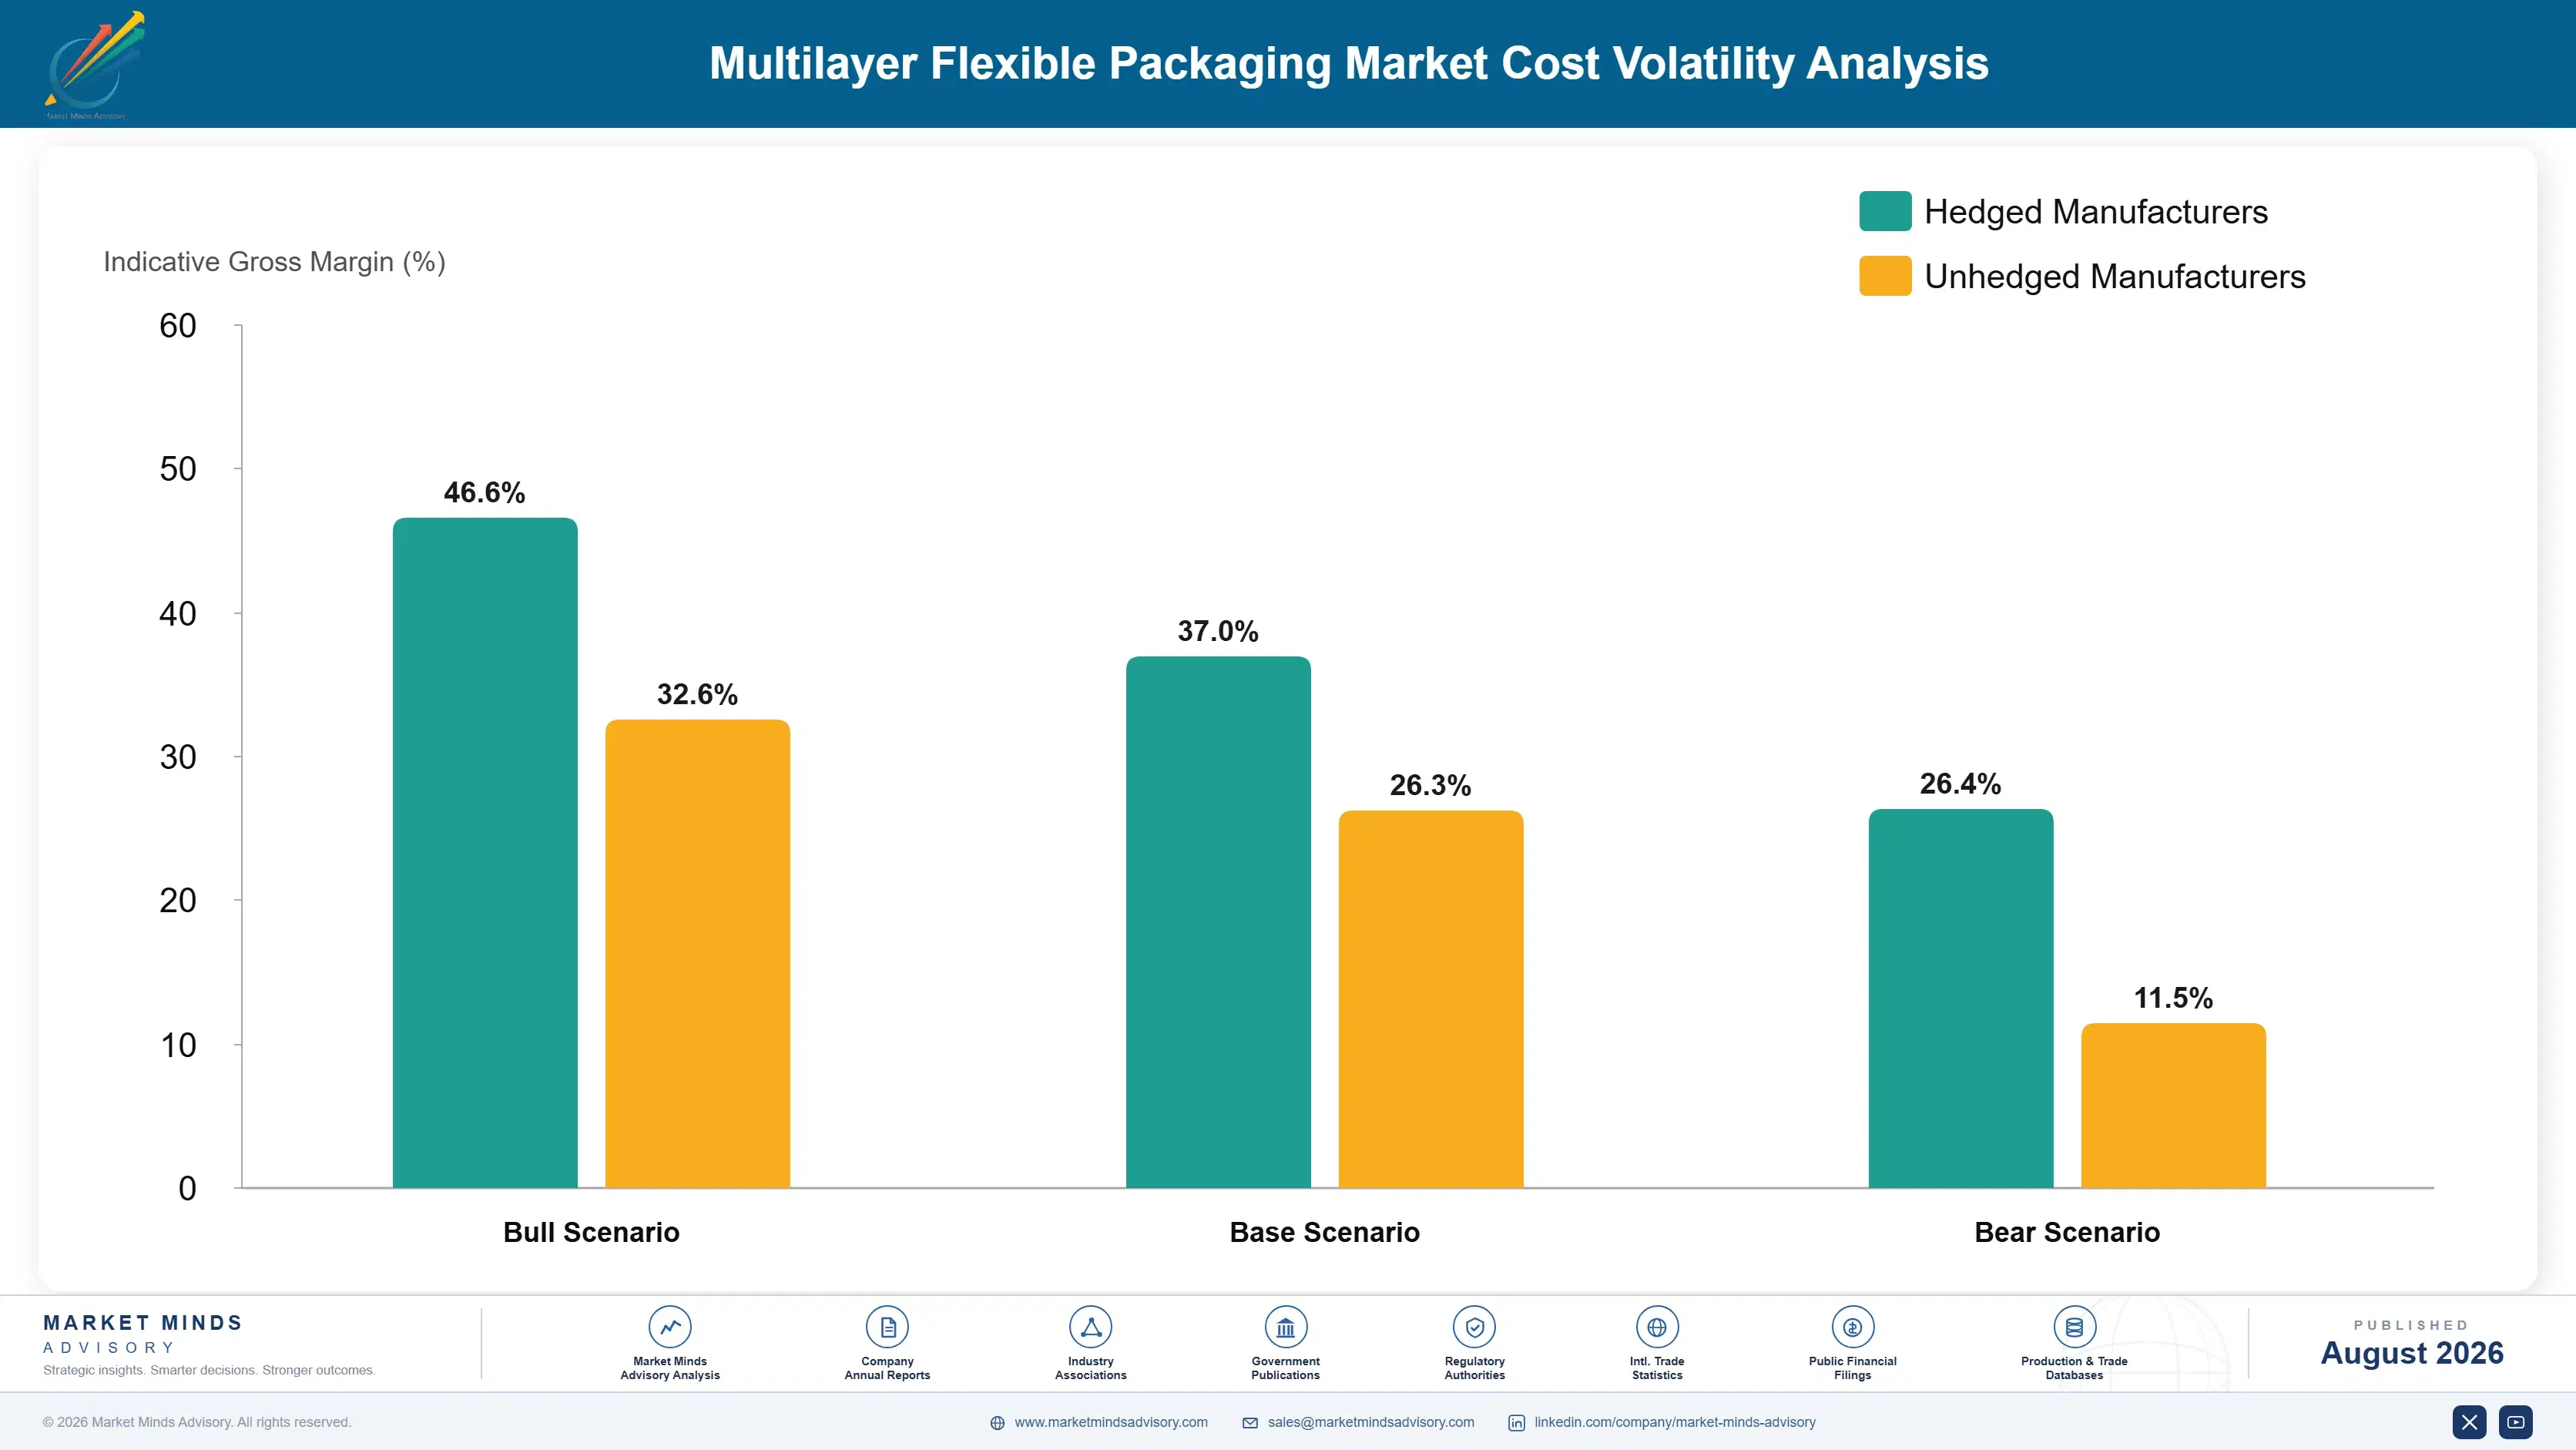
European energy costs through 2022 and 2023 were the event that mattered, since cracker economics and converting energy both moved at once. EIA and IEA reporting documented natural gas and feedstock movements that raised European polyolefin costs well above Gulf Coast and Middle Eastern equivalents, and several crackers closed. Converters with index-linked contracts passed most of it through eventually, but the lag cost them a full year of margin first.

The competitive disadvantage mechanism runs through contract lag rather than through purchasing price. Every converter buys resin at broadly similar terms within a region, but the one whose contracts adjust quarterly bleeds for a quarter while the one adjusting monthly does not. Exposure also varies by mix: a converter selling barrier structures priced on performance absorbs resin movement far better than one selling non-barrier film priced on weight.
multilayer-flexible-packaging-market-cost-volatility-analysis-1787299618536

Negotiate resin index lag down to monthly adjustment

Contracts adjusting quarterly cost a converter a full quarter of margin every time resin moves upward, and hand back decreases just as slowly when it falls. Monthly adjustment removes most of that exposure without changing the underlying price at all. The negotiation is unglamorous and customers resist it, but the value equals roughly two thirds of the lag exposure.

Reduce scrap so less resin is bought at all

Nine percent line scrap means a converter buys nine percent more polymer than it sells, at full price, and recovers a fraction as regrind. Cutting that to six points is the cheapest resin cost reduction available and requires no negotiation with anybody. Changeover speed and startup gauge control deliver most of it, and neither needs new capital equipment.

Shift mix toward structures priced on performance

Film sold by weight passes resin movement straight through to margin, while film sold on what the barrier achieves does not. Moving volume into oxide-coated and oxygen-barrier classes reduces resin sensitivity at the same time as it raises gross margin by fifteen to seventeen points. That is the only mitigation here that improves both exposure and profitability together.

Portfolio Architecture for Margin Defence

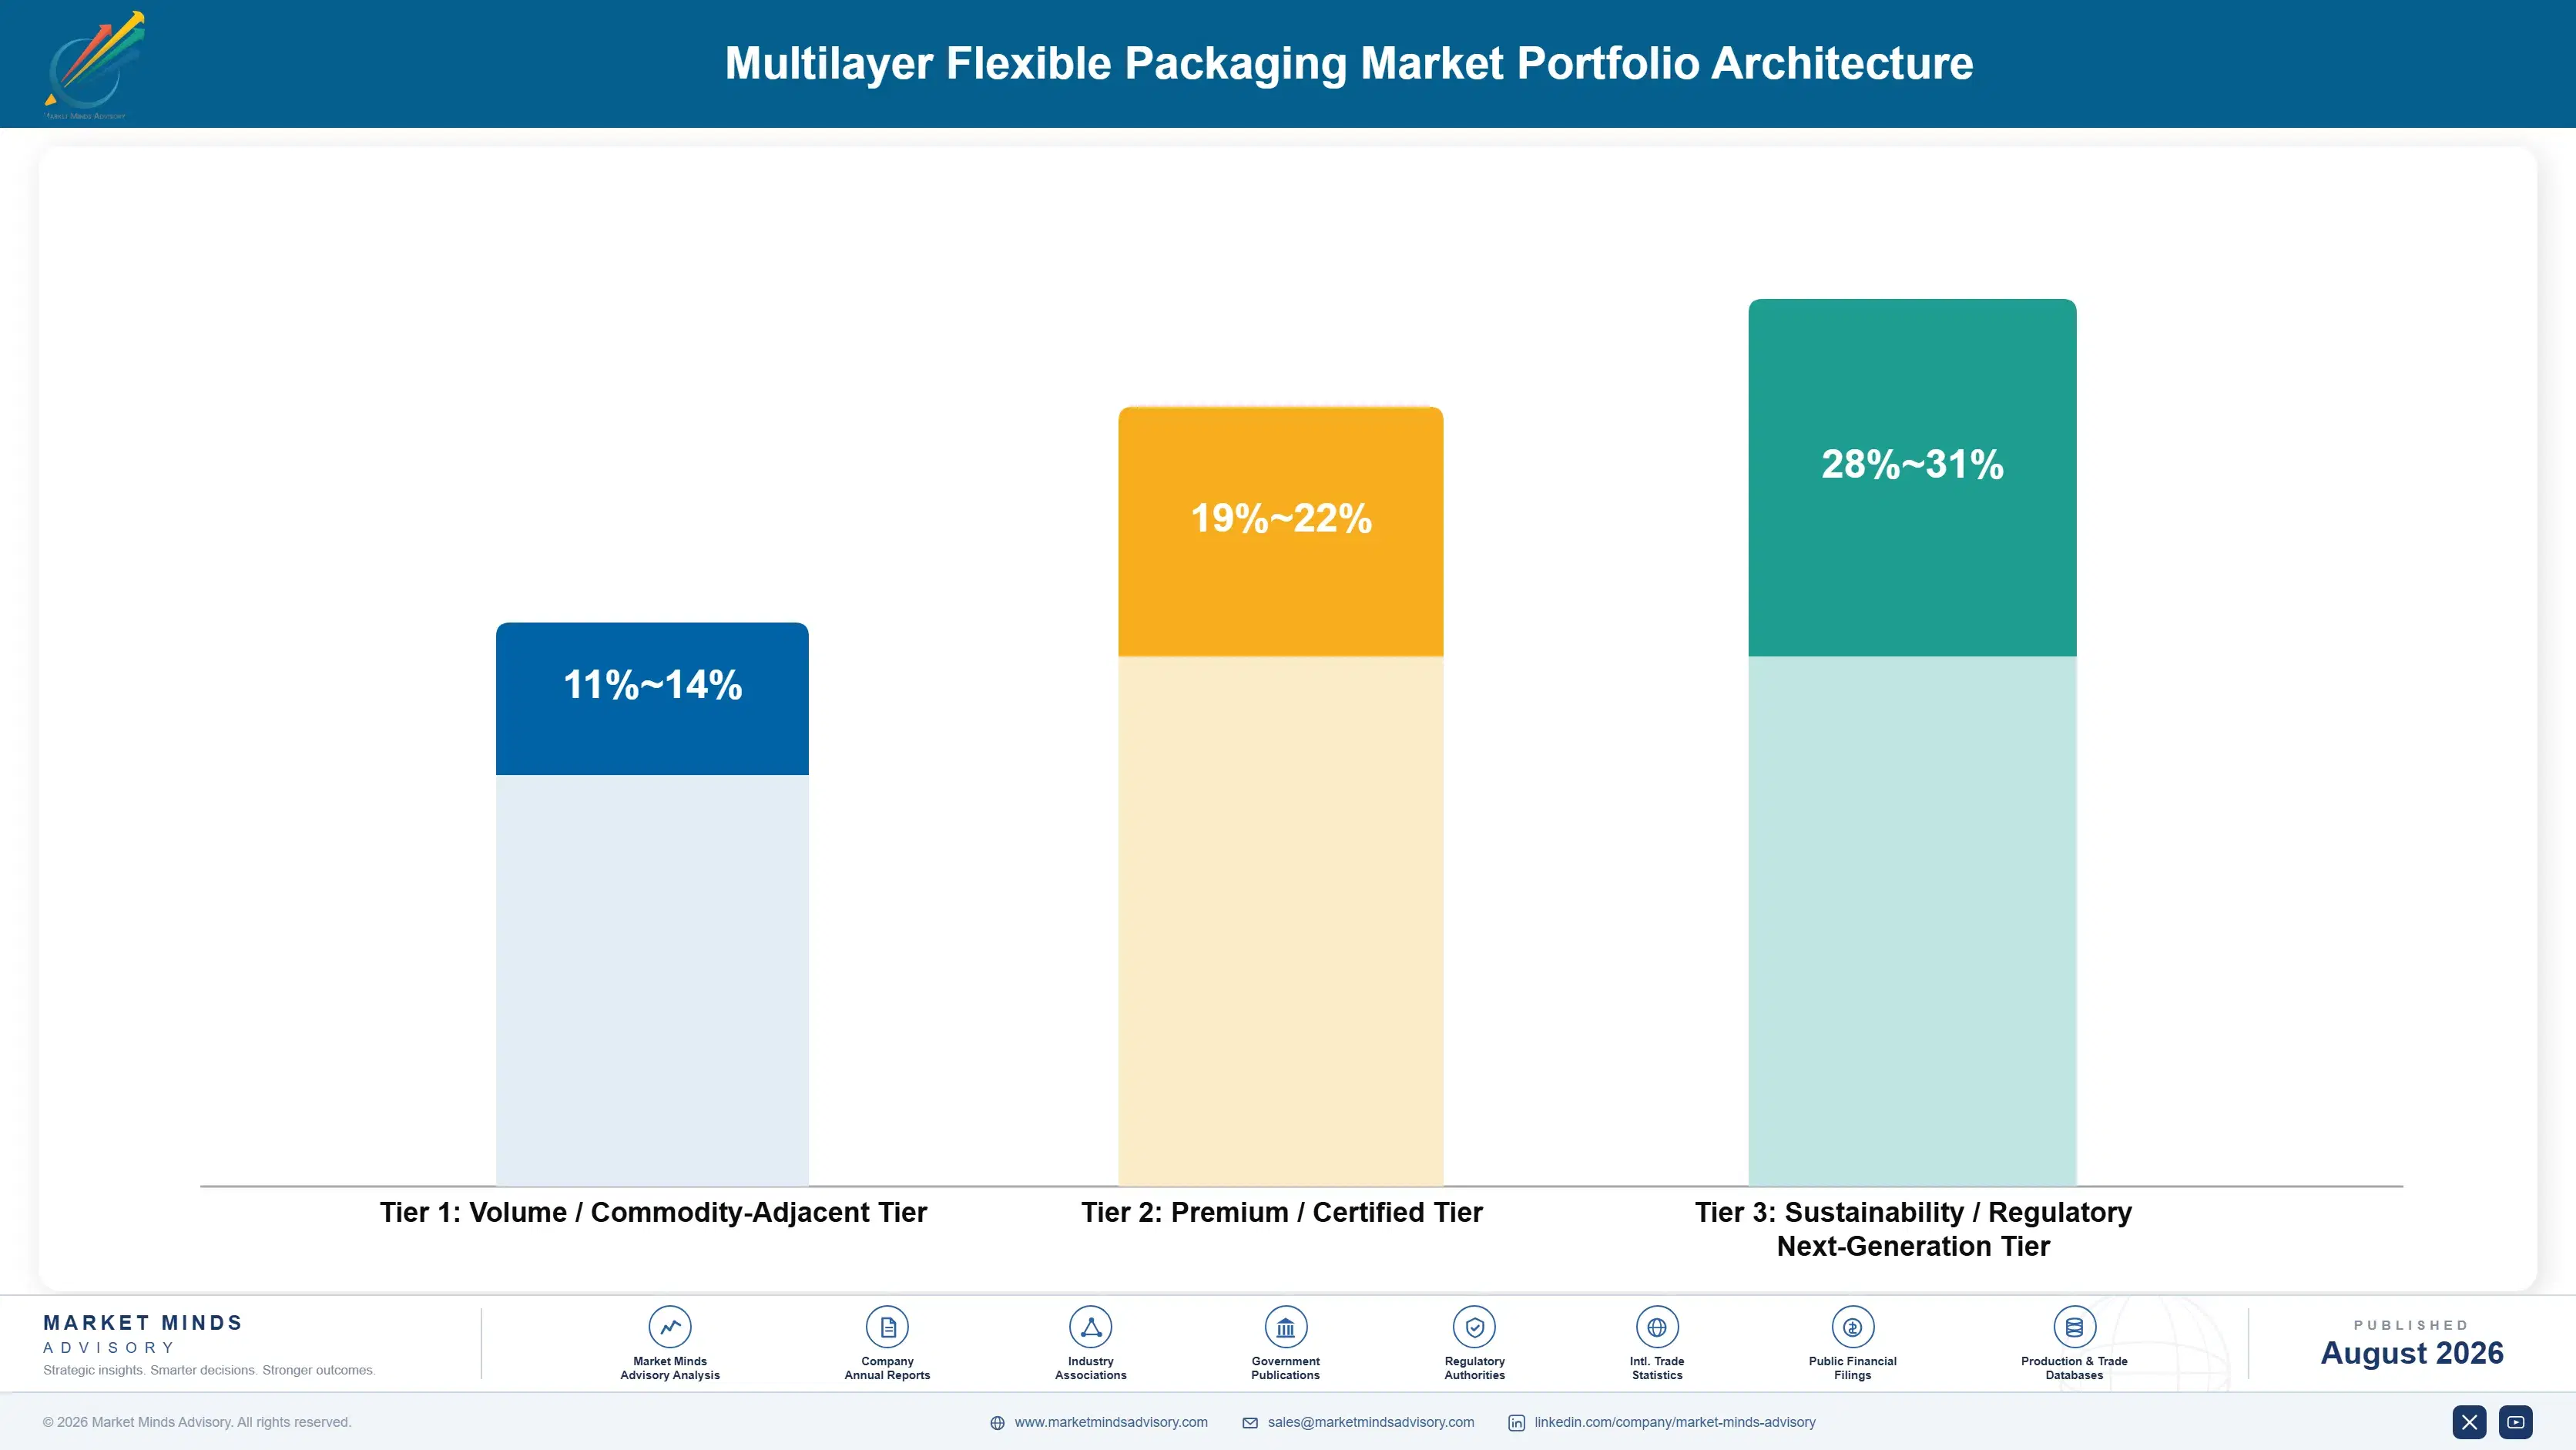
Three tiers describe this business and the spread is wider than a commodity converting business should show. Non-barrier and moisture-barrier structures sit at the bottom, priced on polymer weight with margin that moves with resin. Oxygen-barrier and metallised structures sit meaningfully higher because the technical requirement is real and qualification creates switching cost. Oxide-coated transparent barrier occupies a third tier where deposition capacity restricts supply.
The tension is that volume tiers carry the fixed cost. Coextrusion lines, laboratory capability, and shelf life testing all need throughput underneath them, and non-barrier work provides it. Several converters tried to abandon the bottom tier for margin reasons and discovered their high-value structures could no longer carry the overhead alone. Running a nine-layer line at sixty percent utilisation destroys more value than the mix improvement creates.

High-value pools concentrate where qualification is hardest to repeat. Medical device packaging, retort structures, and transparent high-barrier ready meal film all share long requalification cycles and customers who will not change supplier casually. Those are the pools worth building capability against, and they are also the ones where deposition or nine-layer capacity is the entry ticket.

Volume / Commodity-Adjacent Tier

Non-barrier and moisture-barrier structures for dry goods, secondary packaging, and short shelf life applications. Priced on polymer weight, so margin moves with resin rather than with performance, but the throughput that carries every fixed cost in the plant.
Gross Margin: 11-14%

Premium / Certified Tier

Oxygen-barrier structures using ethylene vinyl alcohol and polyamide, plus metallised barrier film, sold into chilled and processed food. Margin reflects genuine technical requirement and the switching cost that shelf life qualification creates around an incumbent supplier.
Gross Margin: 19-22%

Sustainability / Regulatory / Next-Generation Tier

Transparent high-barrier oxide-coated structures and reduced-layer recycle-ready constructions supplied with real-time shelf life evidence. Best margin because deposition capacity is limited and because the qualification work behind a compliant successor structure cannot be compressed by anybody.
Gross Margin: 28-31%
multilayer-flexible-packaging-market-portfolio-architecture-1787299619034

High-value Sub-segments and Strategic Watch-out

Transparent High-Barrier Oxide-Coated Structures

Best margin and fastest growth at 9.6%, delivering barrier close to foil while staying transparent and microwaveable. Deposition capacity rather than demand sets the ceiling, and qualified coaters are few enough that they price accordingly. Flex cracking remains the technical weakness. Nobody has solved that yet.
Gross Margin: 28-31%

Oxygen-Barrier Structures

Strong margin and 7.8% growth, carried by chilled distribution expanding into markets that previously had none. Qualification creates real switching cost around incumbent suppliers. The exposure is recyclability pressure, since these are precisely the seven and nine layer structures regulators want simplified. Requalification will take years.
Gross Margin: 19-22%

Non-Barrier And Moisture-Barrier Volume

The volume core at thin margin, priced on polymer weight and fully exposed to resin index movement in both directions. It nonetheless carries the coextrusion capacity, laboratory capability, and testing overhead that make everything above it possible at all. Abandoning it for margin reasons has failed repeatedly.
Gross Margin: 11-14%

Aluminium Foil Multilayer

The strategic watch-out, growing at only 2.4% and steadily losing applications to oxide-coated alternatives that deliver comparable barrier with transparency. Foil retains the cases where a pinhole cannot be tolerated at any price, and that boundary has moved slowly rather than not at all. Its decline is real.
Gross Margin: 16-19%

How the Volume Actually Recurs

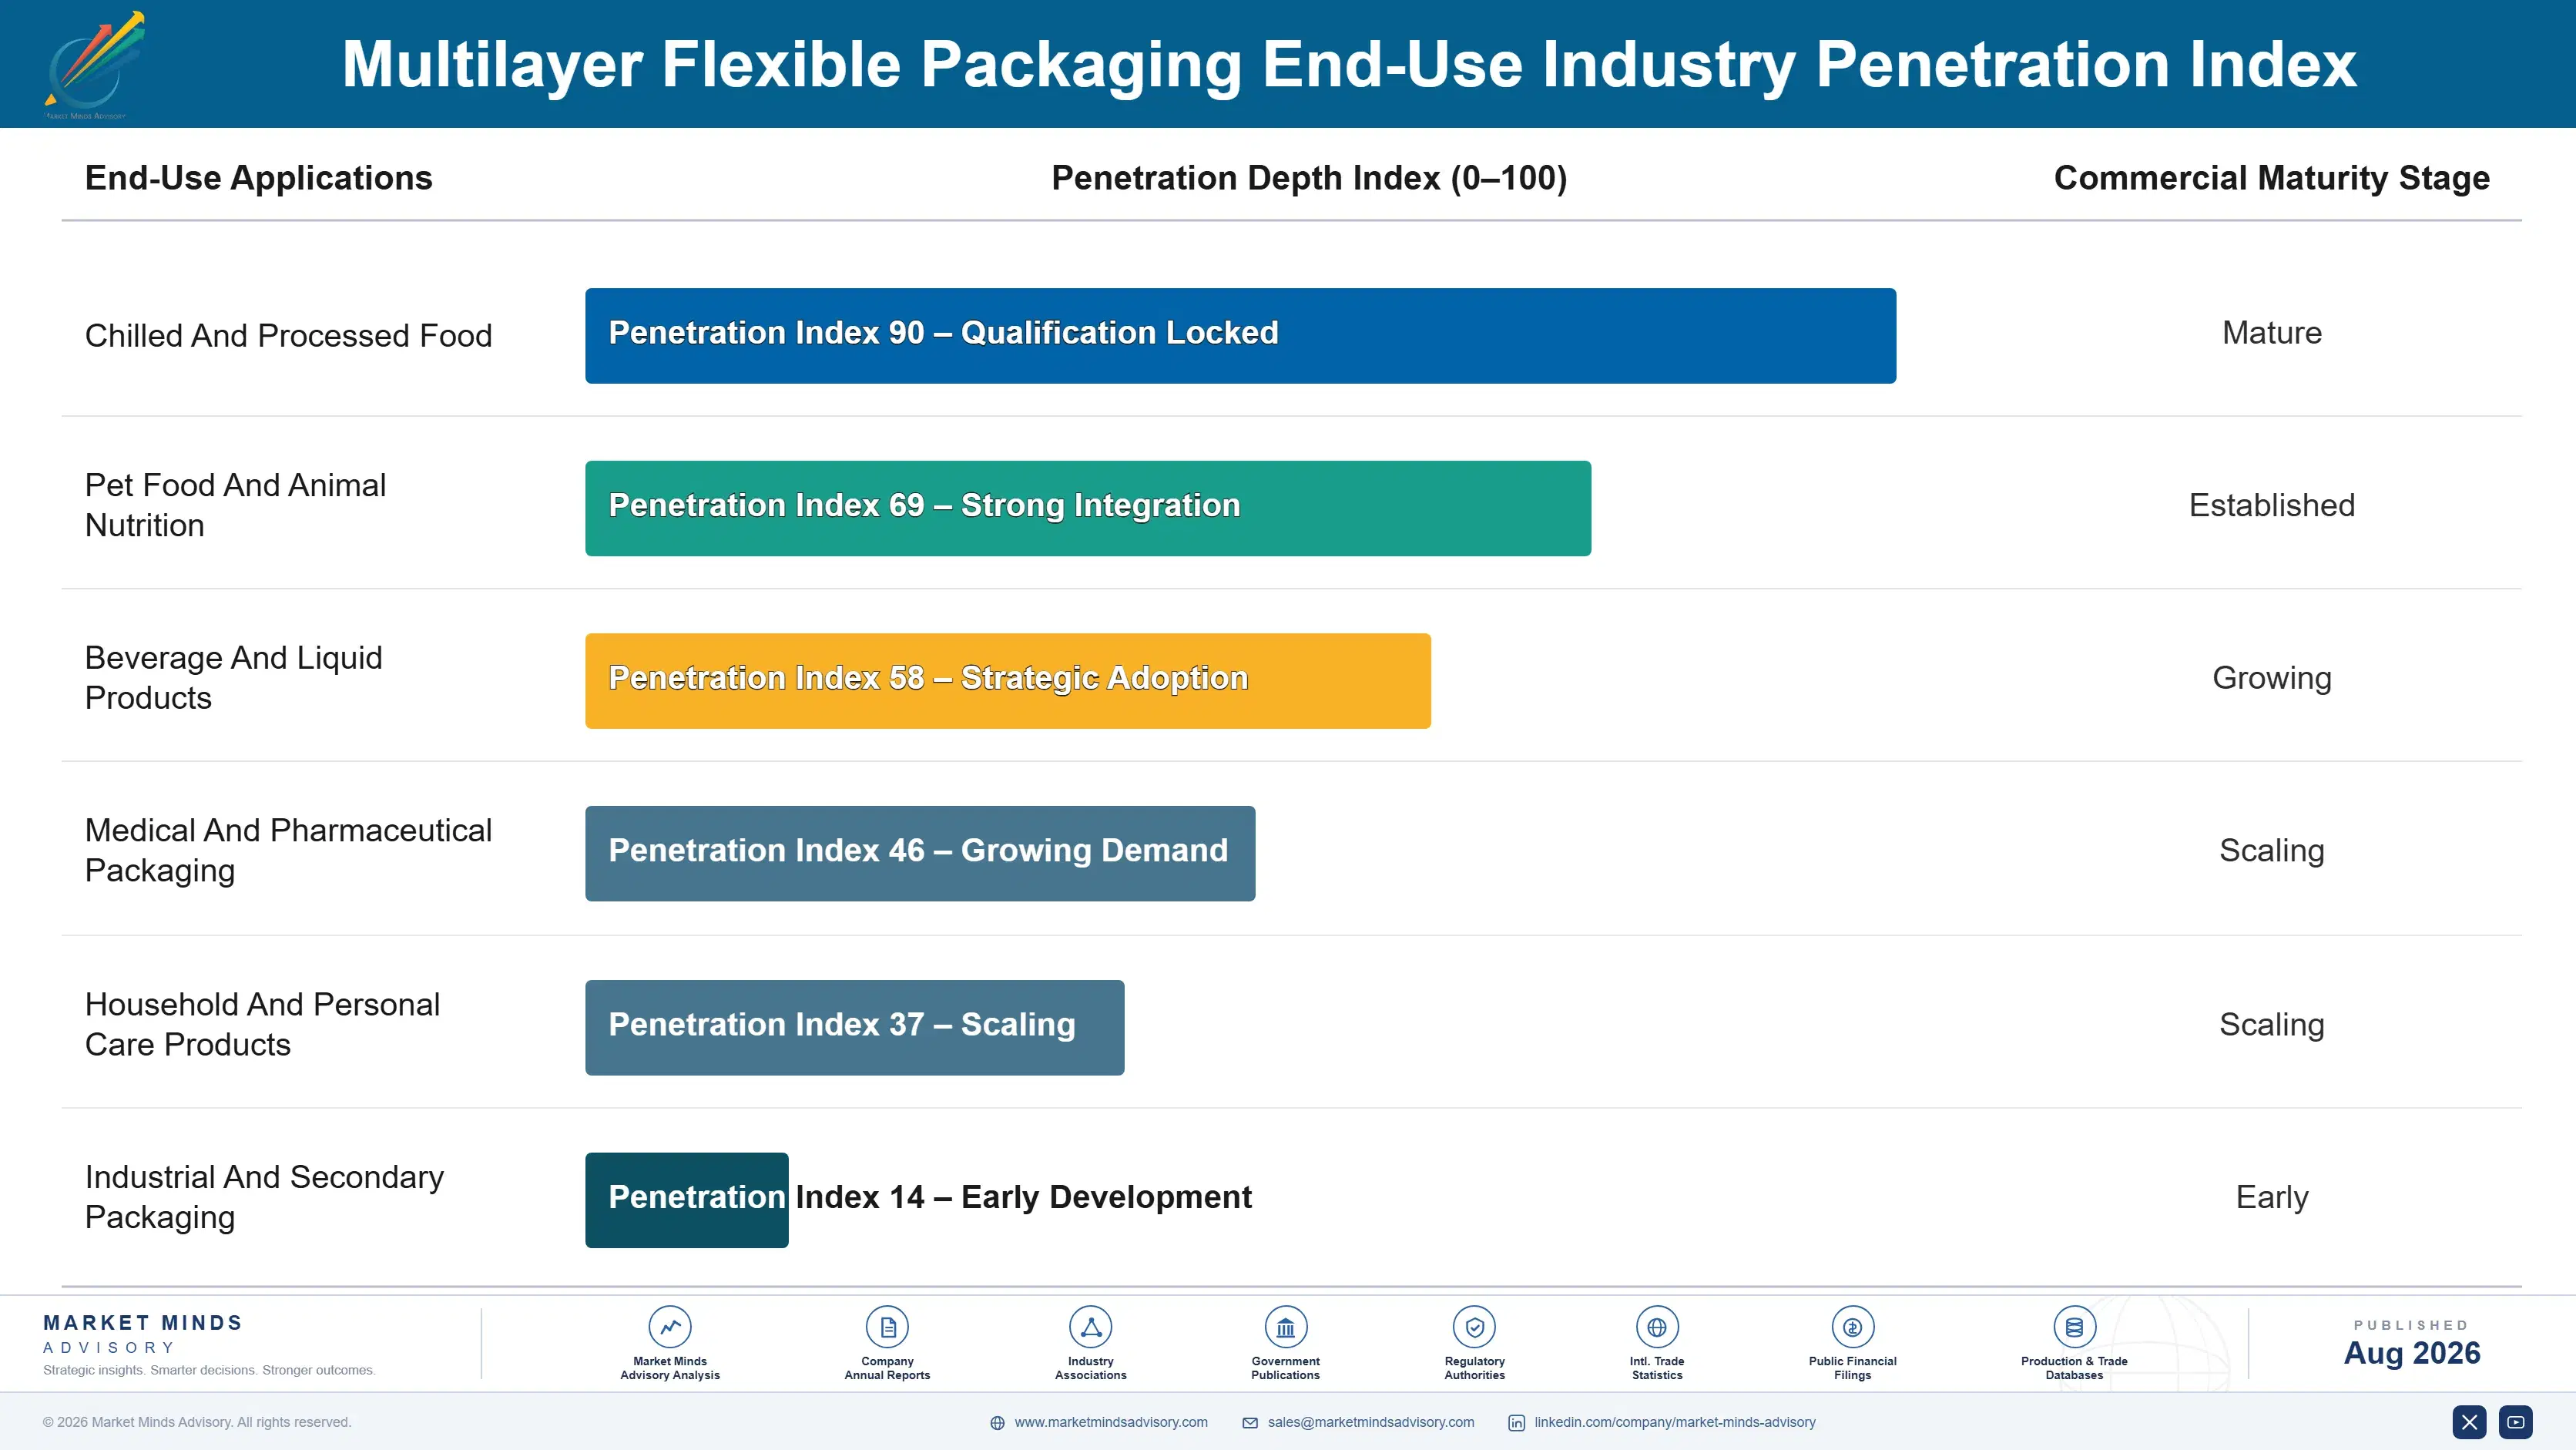
Once a structure is qualified for a product, the film order recurs for the product's commercial life, which typically runs seven to nine years before a reformulation or a pack redesign forces requalification. That makes this an annuity business dressed up as a converting one. Incumbency is worth far more than the quotation suggests, because the customer's alternative is 14 months of shelf life testing before anybody can switch.
Stickiness varies enormously by vertical. Medical device packaging is the deepest, since a change touches regulatory filings as well as shelf life, and suppliers there hold positions measured in decades. Chilled food sits next, with genuine qualification depth. Dry goods and secondary packaging barely stick at all and retender on price annually. Pet food falls somewhere in between, technically demanding but commercially aggressive about it.

Buyer profiles have moved. Packaging technologists once owned these decisions outright; sustainability functions now sit alongside them with a veto, and procurement runs the commercial terms separately. A younger cohort of technologists arrives expecting recyclability as a design input rather than as a constraint to be argued about, which changes what a converter has to bring to the first meeting.
multilayer-flexible-packaging-market-end-use-penetration-index-1787299619523

What We Would Tell a Board

These are among the four positions where our research anticipates prominent divergence between winners and laggards over the coming forecast period. Each is grounded in the demand model, the regulatory perimeter, and the announced capacity pipeline.
01 / SCRAP COST RECOVERY

Nine points of scrap is the cheapest margin available

Line scrap runs near 9% across this industry and every point of it is polymer bought at full price and recovered as regrind at a fraction of it. Cutting three points returns roughly 1.7% of revenue directly to gross margin, which exceeds what most converters win from an entire year of customer price negotiation. The work is changeover speed and startup gauge control rather than capital equipment, which is exactly why nobody funds it properly and why it stays available year after year.
02 / STRUCTURE QUALIFICATION OWNERSHIP

Write the specification or compete on price forever

A converter who turns a brand's product, distribution range, and shelf life requirement into a specification owns the qualification and therefore the supply for the structure's seven to nine year commercial life. A converter quoting against somebody else's specification competes on price across that same period and wins nothing durable from it. Building the development function to do the first costs around 900,000 dollars annually in staff and test capability, which is trivial against what a single qualified structure returns.
03 / REQUALIFICATION READINESS PROGRAMMES

Fourteen months starts when the customer asks, not before

Shelf life requalification runs 14 months in real time on real product, and that clock starts on the day a customer requests an alternative rather than on the day a converter decides to prepare. Running parallel programmes on likely successor structures before anybody asks costs perhaps 400,000 dollars a year in testing and sample production. It turns a 14-month answer into a two-month answer, and in a category where brands plan annually that gap decides who keeps the business entirely.
04 / BARRIER MIX SHIFT

Move volume where performance rather than weight sets price

Non-barrier and moisture-barrier structures price off polymer weight, which hands resin movement straight through to margin and rewards performance with nothing at all. Oxide-coated and oxygen-barrier classes price off what the structure achieves and carry gross margin fifteen to seventeen points higher as a direct result, which is the whole argument. Shifting even 15% of volume between those groups reshapes a converter's earnings more than any cost programme available, though deposition and nine-layer capacity are the capital price of entry.

Engagement Snapshot From the Field

A live engagement with an industry participant carrying material or product regulatory and market exposure ahead of a defining policy shift, showing how our research translates into a defensible multi-year portfolio strategy.
MARKET MINDS ADVISORY · CLIENT ENGAGEMENT SUMMARY
Multilayer Flexible Packaging Producer Strategic Portfolio Review and Transition Roadmap 2026·Investment Scenario on Multilayer Flexible Packaging Exposure Evaluation 2025-26
CLIENT PROFILE
A regional flexible packaging converter with approximately 480 million dollars in annual revenue (client-reported, unverified by MMA), operating six converting plants across two continents and serving food processors, pet food producers, and household goods brands. The business ran predominantly non-barrier and moisture-barrier structures, held no vacuum deposition capacity, and had one nine-layer coextrusion line running at partial utilisation.
STRATEGIC CHALLENGE
Gross margin had compressed for three consecutive years despite volume growth, and management attributed it entirely to resin index movement. A proposal to exit low-margin non-barrier accounts was on the table. The board wanted an independent read on whether resin was genuinely the cause before approving a volume reduction that would strip throughput from every plant.
MMA APPROACH
We decomposed three years of margin movement into resin index effect, scrap, mix, and contract lag, then benchmarked each against comparable converters. Line scrap was measured by plant and by product family rather than in aggregate. Contract adjustment terms were reviewed across the top thirty accounts, and the nine-layer line's utilisation history was reconstructed from production records.
KEY FINDINGS
  1. Resin index movement explained under a third of the margin compression; contract lag on quarterly-adjusting accounts explained considerably more and had never been separately measured.
  2. Line scrap averaged eleven points against an industry level near nine, and two plants ran above thirteen, which alone accounted for a substantial share of the gap.
  3. The nine-layer line ran at 58% utilisation because the sales function had never been given barrier structures to sell, not because barrier demand was absent from the customer base.
  4. Exiting the proposed non-barrier accounts would have removed enough throughput to push three plants below the utilisation at which their fixed cost is recoverable at all.
CLIENT PROFILE
A regional flexible packaging converter with approximately 480 million dollars in annual revenue (client-reported, unverified by MMA), operating six converting plants across two continents and serving food processors, pet food producers, and household goods brands. The business ran predominantly non-barrier and moisture-barrier structures, held no vacuum deposition capacity, and had one nine-layer coextrusion line running at partial utilisation.
STRATEGIC CHALLENGE
Gross margin had compressed for three consecutive years despite volume growth, and management attributed it entirely to resin index movement. A proposal to exit low-margin non-barrier accounts was on the table. The board wanted an independent read on whether resin was genuinely the cause before approving a volume reduction that would strip throughput from every plant.
MMA APPROACH
We decomposed three years of margin movement into resin index effect, scrap, mix, and contract lag, then benchmarked each against comparable converters. Line scrap was measured by plant and by product family rather than in aggregate. Contract adjustment terms were reviewed across the top thirty accounts, and the nine-layer line's utilisation history was reconstructed from production records.
KEY FINDINGS
  1. Resin index movement explained under a third of the margin compression; contract lag on quarterly-adjusting accounts explained considerably more and had never been separately measured.
  2. Line scrap averaged eleven points against an industry level near nine, and two plants ran above thirteen, which alone accounted for a substantial share of the gap.
  3. The nine-layer line ran at 58% utilisation because the sales function had never been given barrier structures to sell, not because barrier demand was absent from the customer base.
  4. Exiting the proposed non-barrier accounts would have removed enough throughput to push three plants below the utilisation at which their fixed cost is recoverable at all.
RECOMMENDED STRATEGY
Phase 1: Phase 1 (months one to nine): cancel the account exit, attack scrap at the two worst plants, and renegotiate quarterly index terms to monthly. Phase 2: Phase 2 (months nine to twenty-four): build a barrier structure offer for the existing customer base and fill the nine-layer line before buying anything else. Phase 3: Phase 3 (months twenty-four to forty-two): evaluate vacuum deposition capacity against the transparent high-barrier enquiries the business is currently unable to serve.
OUTCOME
The account exit was cancelled. Scrap at the two worst plants fell by four points within three quarters, monthly index adjustment was agreed on eighteen of the top thirty accounts, and nine-layer utilisation reached the high seventies as barrier structures were sold into existing customers (client-reported, unverified by MMA).

Frequently Asked Questions

Foundational context covering the market sizes, CAGR, scope, country, region and competition that inform every finding below. This section is provided to cover basics and most often pre-purchase conversations, answered from the MMA Primary Research Dataset.

What is the current size of the Multilayer Flexible Packaging Market?

The market is valued at USD 96.5 billion in 2025, rising to USD 102.68 billion in 2026. Multilayer structures account for the majority of flexible packaging by value, since barrier is where the cost sits.

How large will the Multilayer Flexible Packaging Market be by 2036?

MMA forecasts USD 190.93 billion by 2036, an increase of USD 88.25 billion over the 2026 base. That represents an expansion multiple of 1.86 times across the forecast period.

What is the CAGR for the Multilayer Flexible Packaging Market 2026 to 2036?

The base case CAGR is 6.4%, with a bull case of 7.6% and a bear case of 5.2%. The historical rate from 2020 to 2025 was 5.4%, so the business is accelerating modestly.

Which segment is growing fastest?

Transparent high-barrier oxide-coated structures at 9.6%, exactly 1.50 times the market rate. They deliver barrier approaching aluminium foil while remaining transparent and microwaveable, which foil cannot manage at any thickness.

Who are the major companies in the Multilayer Flexible Packaging Market?

Amcor, Berry Global, Sealed Air, Winpak, and Sonoco lead on annual converted film volume. The top five hold only 21% between them, which is unusually fragmented for a market of this size.

Which country is growing fastest?

India at 9.4%, driven by refrigerated retail cabinet installations creating demand for barrier structures that simply were not needed before. Chilled distribution arriving is worth more growth than chilled distribution already existing.

Report Segmentation Architecture

The full report scope spans multiple orthogonal segmentation dimensions, with cross-tabulated demand data provided for each dimension pair. Coverage extends further to regional breakdowns, trend trajectories, and the competitive detail needed to support segment-level decision-making.

By Barrier Class

  • Transparent High-Barrier Oxide-Coated Structures
  • Oxygen-Barrier Ethylene Vinyl Alcohol And Polyamide
  • Metallised Barrier Structures
  • Moisture-Barrier Structures
  • Non-Barrier Multilayer Structures
  • Aluminium Foil Multilayer Structures

By End-Use Industry

  • Chilled And Processed Food
  • Pet Food And Animal Nutrition
  • Beverage And Liquid Products
  • Medical And Pharmaceutical Packaging
  • Household And Personal Care Products
  • Industrial And Secondary Packaging

By Customer Type

  • Multinational Food And Beverage Groups
  • Regional Food Processors
  • Contract Packers And Co-Manufacturers
  • Medical And Pharmaceutical Packers
  • Household And Personal Care Brands

By Region

  • East Asia
  • North America
  • Western Europe
  • South Asia and Pacific
  • Latin America
  • Middle East and Africa
  • Eastern Europe

Scope, Methodology, and Coverage

Every figure in this report is reproducible from documented input assumptions. The scope below maps the historical period, the forecast horizon, the segmentation dimensions, and the countries covered, alongside the underlying primary and qualitative methodology.
Historical Period
2020 to 2025
Forecast Period
2026 to 2036
Base Year
2025 (USD billions; MMA Primary Research Dataset, August 2026)
Market Definition
This market comprises laminated and coextruded flexible packaging structures of two or more layers, measured at converter realised prices for printed and unprinted output across roll stock, pouches, lidding, and thermoform web. Barrier class coverage spans transparent high-barrier oxide-coated, oxygen-barrier using ethylene vinyl alcohol and polyamide, metallised barrier, moisture-barrier, non-barrier multilayer, and aluminium foil multilayer structures. Monolayer film, rigid and semi-rigid packaging, paper-based packaging without a polymer barrier layer, base resin and unconverted substrate production, adhesive and ink manufacture, and packaging or filling machinery fall outside scope.
Quantitative Units
USD billions (current prices); million square metres converted; realised price per square metre; average layer count
Segmentation Dimensions
By Barrier Class; By End-Use Industry; By Customer Type; By Region
Regions Covered
East Asia, North America, Western Europe, South Asia and Pacific, Latin America, Middle East and Africa, Eastern Europe
Countries Covered
China, Japan, South Korea, Taiwan, India, Thailand, Vietnam, Indonesia, Australia, USA, Canada, Mexico, Germany, Italy, Spain, France, UK, Netherlands, Belgium, Poland, Czechia, Turkey, Brazil, Argentina, Chile, Saudi Arabia, UAE, Egypt, Morocco, South Africa, and additional markets relevant to this sector
Key Companies Profiled
Amcor, Berry Global, Sealed Air, Winpak, Sonoco, Huhtamaki, Constantia Flexibles, Mondi, ProAmpac, Coveris, Wipak, Schur Flexibles, UFlex, Toppan, Dai Nippon Printing, Glenroy, TC Transcontinental, Printpack, Bryce Corporation, Sigma Plastics Group
Quantitative Methodology
Primary survey, n=3,800 respondents, Q4 2025, six countries; demand-side model with trade association cross-validation
Qualitative Methodology
47 expert interviews, Q4 2025; applied to validate demand model assumptions, identify emerging dynamics, and assess competitive positioning
Report Format
PDF and XLSX data workbook (Word format preview document)
Publisher
Market Minds Advisory
Report Code
MMA-2026-PAC-378
Published
August 2026
Contact
sales@marketmindsadvisory.com | www.marketmindsadvisory.com

Purchase the full Multilayer Flexible Packaging Market Report (2026 to 2036).

The full report sizes multilayer flexible packaging across six barrier classes, six end-use industries, six customer types, and seven regions, with country detail for the twenty largest national markets. Layer count and structure architecture are analysed by application, since layer count rather than film area determines both cost and recyclability outcome. Shelf life requalification timelines are quantified by category, because that clock governs how fast anything in this market can change. Competitive profiling covers twenty companies on annual converted film volume. Vacuum deposition and nine-layer coextrusion capacity is mapped by operator and region.
Layer count and structure architecture analysed by application
Shelf life requalification timelines quantified by product category
Vacuum deposition and coextrusion capacity mapped by operator
Line scrap and changeover benchmarks across converting operations
Resin index contract terms compared across converter agreements
Barrier class margin spreads calibrated to industry economics

Built For The People Who Decide

From boardroom strategy to bench-side execution, this report is read cover-to-cover by leaders shaping the next decade of their industry, turning demand scenarios, market dynamics and valuation benchmarks into decisions.
CXOs/ Presidents/ VPs/ Managers
M&A and Corporate Development
Strategy Teams and R&D Heads
Procurement and Product Directors
Regulatory and Compliance Leaders
Investor Relations and Equity Analysts