Market Minds Advisory
Functional Food Ingredients Market

Functional Food Ingredients Market: Where The Health Claim Is Worth More Than The Molecule

A commercial reading of health-positioned food ingredients, where an approved claim carries more pricing power than the compound itself, and regulators across three continents disagree on what may be said.

Lead Analyst

Lisa Gevelber

Published

September 2026

Make Smarter Decisions with Customized Research Insights

Request a free sample report and evaluate market opportunities, growth trends, and competitive dynamics relevant to your business needs.

2025 MARKET VALUE$96.3BMarket Size 2025
2036 FORECAST VALUE$192.5BBase Case , 2026 to 2036
CAGR 2026 TO 20366.5 %Bull 7.7% / Bear 5.3%
INCREMENTAL OPPORTUNITY$90.0BNet 10- year value creation
EXPANSION MULTIPLE1.88x2036 value over 2026 base
Strategic Levers
M&A Pipeline
Regional Outlook
Country Rankings
Competitive Intelligence
Segmental Deep-dive
Call-Us : 91 93563 13602

Executive Snapshot and Market Trajectory

The molecule is rarely the hard part. Getting a regulator to let a brand say what the molecule does, in a market where the same compound may carry a claim in Tokyo and none at all in Brussels, is where the commercial value in this category actually sits.
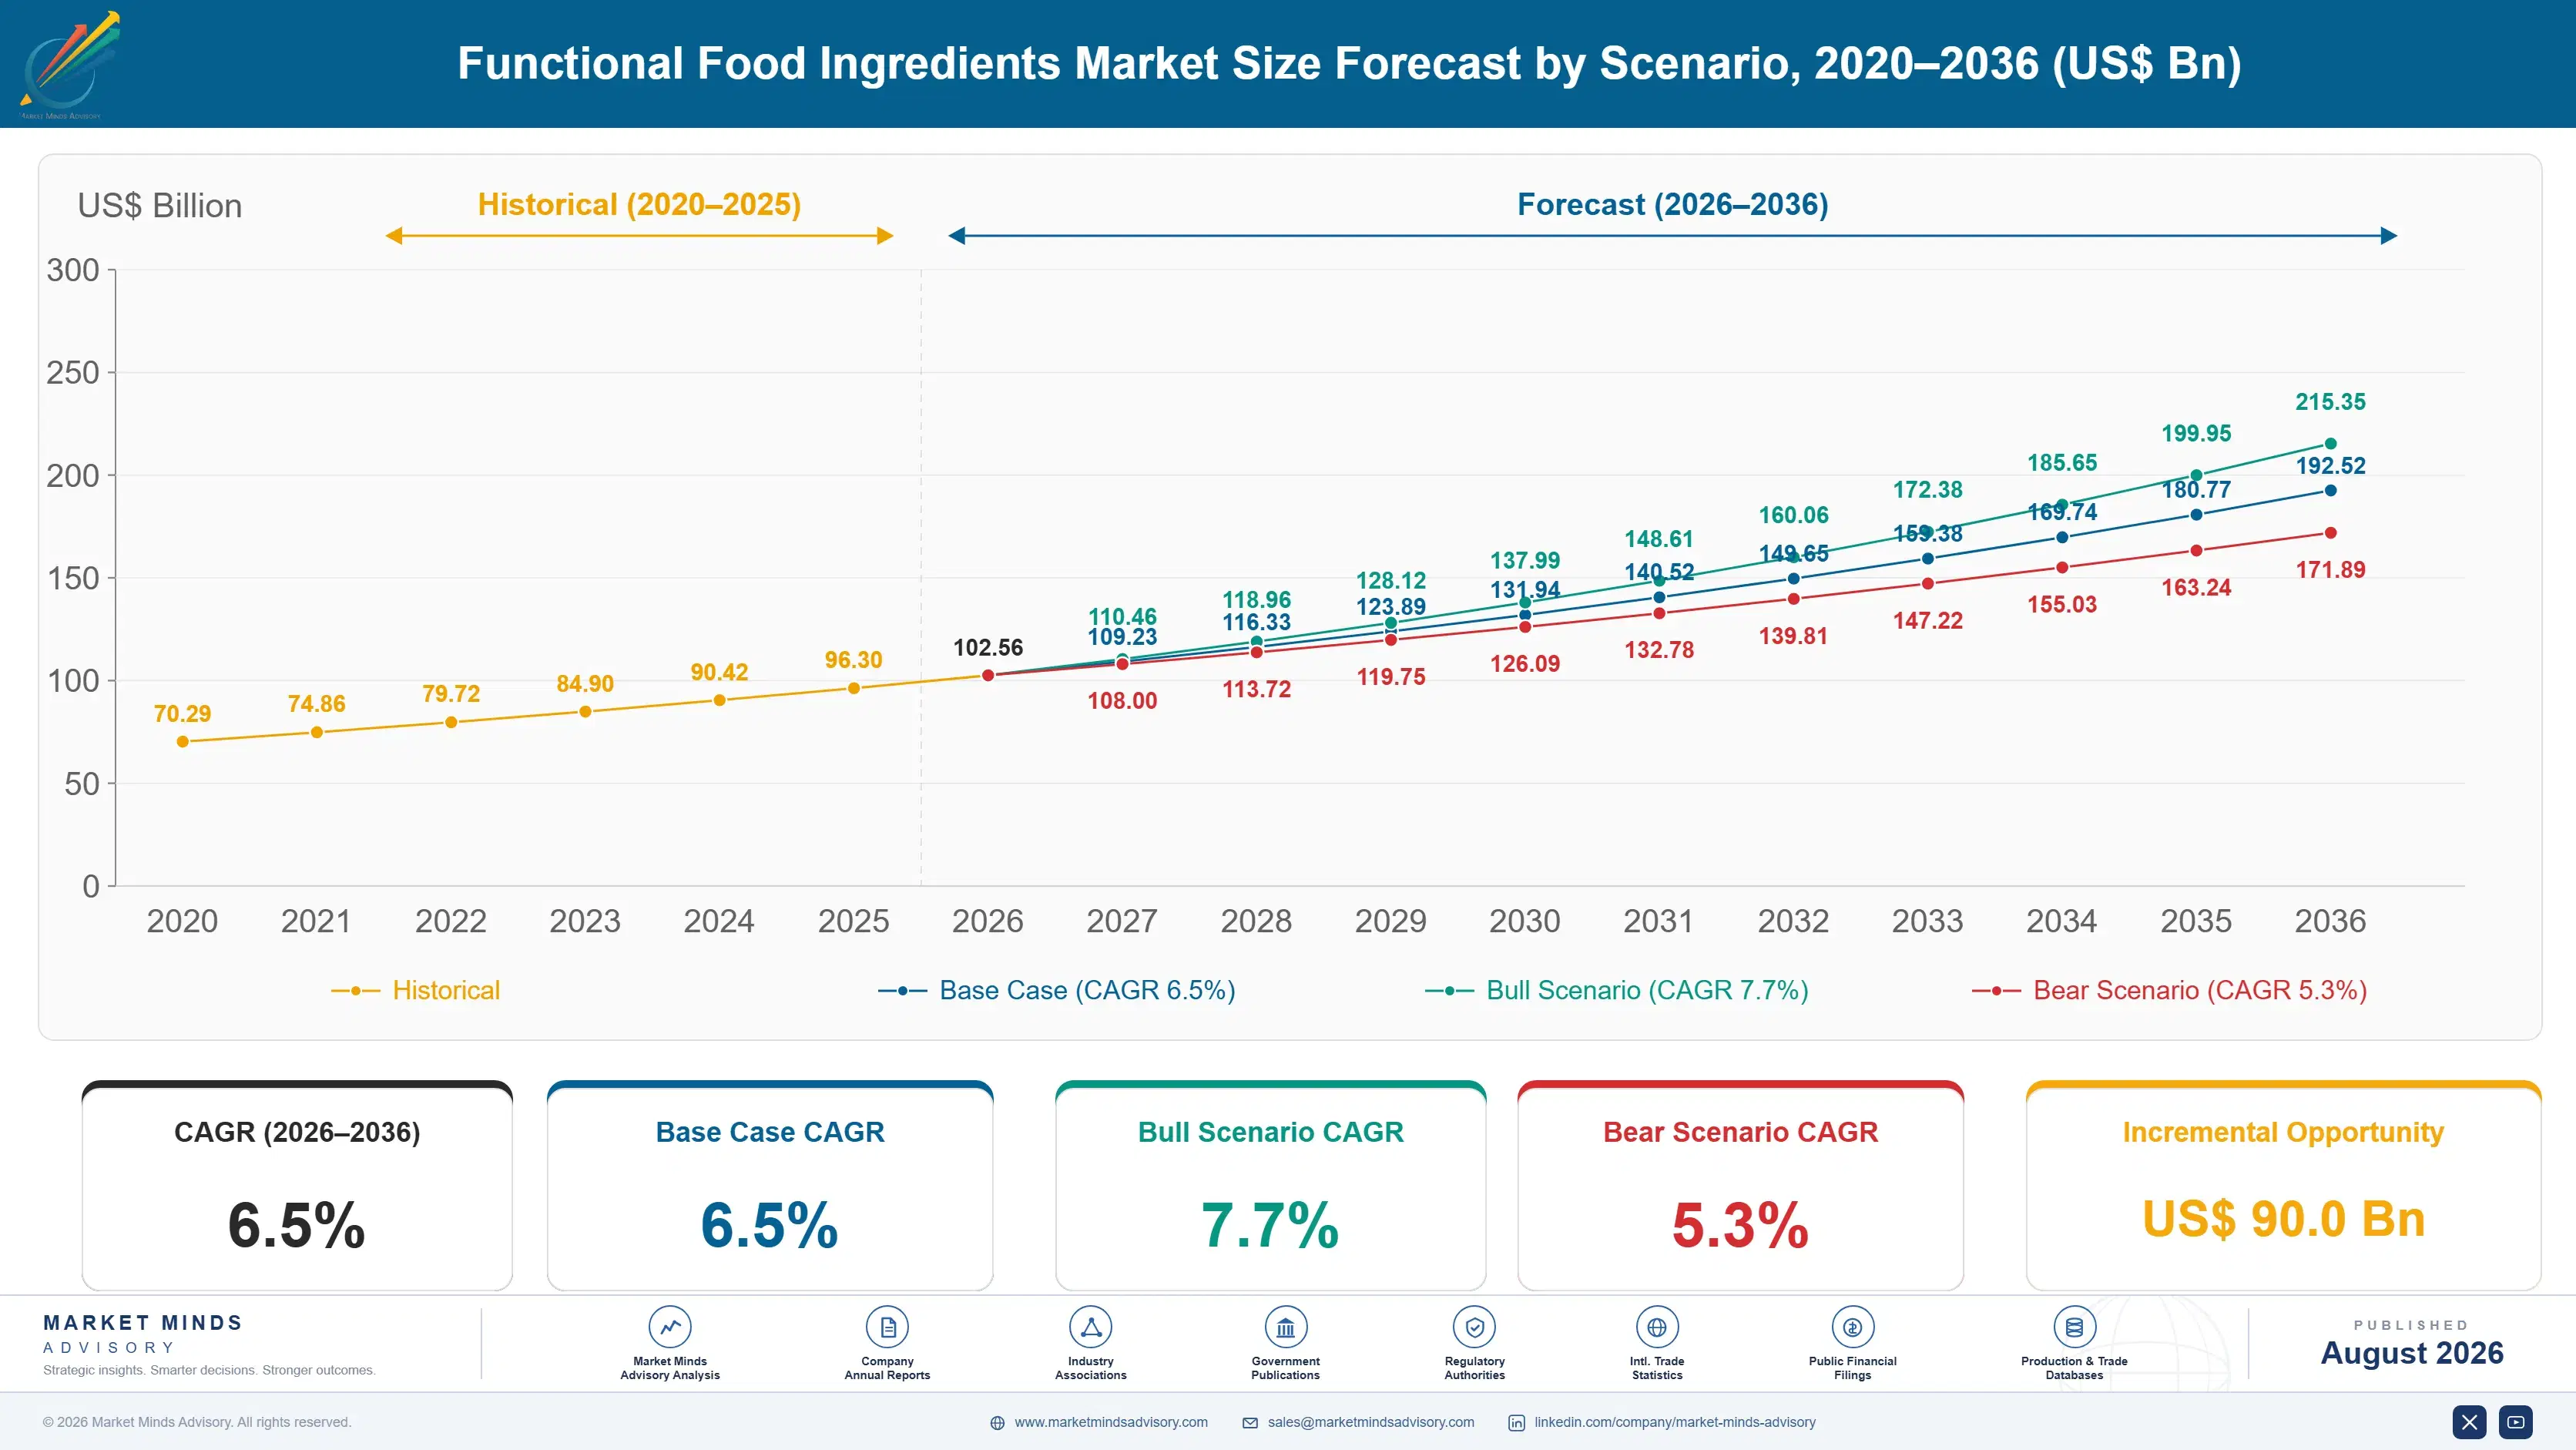
The market stands at USD 96.3 billion in 2025 and reaches USD 192.52 billion by 2036 at a 6.5% CAGR. Probiotics and live cultures grow fastest at 11.7%, about 1.80 times the overall rate, on digestive and immune positioning that consumers now recognise without being taught. East Asia holds 29% of value on established functional food regulation and consumption habits, while India posts the quickest national growth at 11.3%.
Fragmentation is moderate, with the top five holding roughly 27% of ingredient revenue across a category that spans fermentation, extraction, and chemical synthesis. Two forces pull in different directions. Consumer willingness to pay for health positioning keeps rising, while European claim regulation has rejected the large majority of submitted health claims, which leaves ingredient suppliers selling science that brand owners cannot legally repeat on a label. Suppliers now sell three claim positions for one molecule.
Market Definition
The functional food ingredients market covers ingredients added to food and beverage products for a physiological benefit beyond basic nutrition, spanning probiotics and live cultures, prebiotic and dietary fibres, vitamins and minerals for fortification, proteins and amino acids, and plant extracts and bioactive compounds. Finished functional food and beverage products, dietary supplements sold in dose form, pharmaceutical actives, animal nutrition ingredients, and standard commodity food ingredients used for taste or texture alone are excluded.
Base Year Value
$96.3B in 2025 (MMA Primary Research Dataset, August 2026)
Forecast Period
2026 to 2036, eleven discrete annual values
CAGR
6.5% base case. Bull 7.7%. Bear 5.3%.
Fastest Growth Segment
Probiotics and Live Cultures: 11.7% CAGR
Fastest Growth Country
India: 11.3% CAGR
Fastest Growth Region
South Asia and Pacific: 8.8% CAGR
Largest Region
East Asia: 29% of 2025 global value
Market Leaders
DSM-Firmenich, IFF, Kerry Group, BASF, Novonesis. Source: MMA Analysis based on company annual reports.
Primary Survey
n=3,800 procurement and R&D decision-makers, Q4 2025, six countries
Methodology
Demand-side build-up, cross-validated against public data, 47 expert interviews

Functional Food Ingredients Market Forecast Scenarios

multifunctional-food-ingredients-market-size-forecast-scenario-1787324567539
Growth from 2020 to 2025 compounded near 5.4%, and the pandemic reshaped what sold rather than how much. Immune-positioned ingredients, particularly vitamin D, zinc, and probiotics, surged through 2020 and 2021 as consumers self-medicated through diet. Weight management and protein fortification took over afterwards. Underneath the swings, the category kept adding volume because fortification became normal in mainstream products rather than remaining a specialist positioning.
Three mechanisms carry the base case to 6.5%. First, mainstream fortification, as functional ingredients move from niche health brands into everyday dairy, bakery, and beverage products sold on ordinary shelves. Second, gut health, where probiotic and prebiotic science has reached a level of consumer understanding that removes the education cost suppliers used to carry. Third, protein demand, which keeps pulling dairy, plant, and specialty proteins into formats that never contained them before.
The bull case at 7.7% assumes European claim approvals loosen for well-evidenced gut health and cognitive ingredients, which would let brand owners say what the science supports. The bear case at 5.3% assumes claim rejection continues, front-of-pack nutrition labelling penalises fortified products for sugar or fat content regardless of added benefit, and private label reformulation pushes ingredient prices down across mainstream categories.

The Claim Is The Asset, Not The Compound

Three forces set demand. Mainstream fortification provides the volume, as ingredients move from specialist health brands into ordinary dairy, bakery, and beverage lines. Consumer health awareness provides the pricing, since shoppers accept a premium for a benefit they grasp. And regulation sets the ceiling, because an ingredient whose benefit cannot be stated on the pack is worth far less than the identical compound where the claim is permitted.
MARKET CONCENTRATIONCR5: 27%Moderately fragmented across fermentation, extraction, and synthesis routes
EUROPEAN CLAIM APPROVALAbout 15%Proportion of submitted health claims that regulators have accepted
INGREDIENT COST SHARE2% to 8%Functional ingredient as a portion of finished product cost
CLAIM DOSSIER TIMELINE3 to 5 yearsTypical clinical and regulatory work behind one approved claim
FERMENTATION CAPACITY UTILISATIONAbout 82%Running rate across specialist fermentation assets in this category
REFORMULATION CYCLE LENGTH18 to 30 monthsInterval at which brand owners revisit an established product recipe
Commercially, the striking feature is how little the ingredient costs against what it changes. A functional ingredient typically represents 2% to 8% of finished product cost while shifting the retail price into a higher bracket entirely. That asymmetry is why brand owners pay for evidence, and why suppliers spend three to five years building a claim dossier. Reformulation windows come every 18 to 30 months.
The decade ahead turns on regulatory divergence. European authorities have approved roughly 15% of submitted health claims, Japanese and Chinese systems operate quite differently, and American structure-function claims allow language Europe rejects outright. A supplier selling into all three needs three regulatory strategies and three sets of copy for them. That fragmentation favours large ingredient houses with dedicated regulatory affairs teams over specialists with better molecules.
"Suppliers keep pitching mechanism of action to customers who cannot print any of it on the box. The winning conversation is not what the ingredient does; it is which of these eleven sentences a brand owner may legally use in each market they sell into."
Director, Food Ingredients and Nutrition Practice · MMA Agriculture and Food / S

Market Trends

Gut Health Moves From Niche To Mainstream

Probiotics and live cultures grow at 11.7% against a market at 6.5%, and consumer understanding rather than new science explains the acceleration. Shoppers now recognise strain names, colony counts, and the general link between digestion and immunity without being educated first, which removes a cost suppliers carried for two decades. Prebiotic fibres have followed the same route. Formats have widened well beyond yoghurt into beverages, bakery, snacks, and confectionery, each of which introduces stability and shelf life problems that live organisms make genuinely difficult to solve. Chilled dairy still carries most of the volume.
Market Impact: Ingredient is 2% to 8%
Front-Of-Pack Labelling Penalises Products That Were Deliberately Fortified

Nutrition scoring systems rate products on sugar, salt, saturated fat, and calorie content, and most award little or no credit for added functional benefit. A fortified beverage can therefore carry a poor front-of-pack score despite delivering the nutrient it was reformulated to provide, which brand owners find commercially unacceptable in categories where the score is displayed. The practical response has been reformulation of the base product alongside fortification, adding cost and technical difficulty to projects that were straightforward when the ingredient was simply added. Ingredient suppliers are now drawn into the sugar conversation too.
Market Impact: Protein spans 5 new categories

Market Opportunities and Growth Drivers

Fortification Becomes Normal In Mainstream Products

Functional ingredients have moved out of specialist health brands into everyday dairy, bakery, cereal, and beverage lines sold in ordinary supermarkets. Protein-fortified yoghurt, fibre-enriched bread, and vitamin-added beverages now sit on the main shelf rather than the health aisle, which multiplies addressable volume many times over. The ingredient itself represents only 2% to 8% of finished product cost, so the commercial case for brand owners is straightforward whenever the positioning supports a higher retail price. That arithmetic keeps pulling new categories into scope. Bakery and cereal categories are converting fastest at present.
Market Impact: Roughly 15% of claims approved

Protein Demand Pulls Into Unfamiliar Formats

Consumer protein interest has spread well beyond sports nutrition into mainstream food, driven by satiety, weight management, and ageing populations concerned about muscle maintenance. Dairy proteins, plant proteins, and specialty amino acids are now formulated into snacks, beverages, bakery, and confectionery that never contained them. Each new format brings genuine technical difficulty around solubility, texture, and off-notes that formulation support must solve. That support requirement favours ingredient suppliers with application laboratories over those selling on specification and price alone. Application laboratories, not price lists, are what win these projects now.
Market Impact: Viability drops 90% through baking

Market Restraints and Challenges

European Claim Regulation Rejects Most Submissions

European authorities have approved roughly 15% of submitted health claims, and rejection means a brand owner cannot state the benefit that justified the reformulation in the first place. The root cause is an evidence standard closer to pharmaceutical practice than food practice, requiring human intervention trials that many food ingredients have never been subjected to. Commercially this strands genuine science behind unsayable labels. Suppliers mitigate through claim dossiers built on clinical trials, market-specific positioning language, and prioritising jurisdictions where structure-function claims permit more. Structure-function markets absorb what Europe will not permit.
Market Impact: Probiotics grow at 11.7% annually

Live Culture Stability Limits Format Expansion

Probiotic organisms must remain viable through processing, distribution, and shelf life, and most food processes were designed without any regard for keeping bacteria alive. The root cause is straightforward biology: heat, moisture, oxygen, and acidity all reduce viable counts, and several of those are unavoidable in baking, pasteurisation, and beverage production. Commercially this restricts probiotics to formats that tolerate them, mostly chilled dairy. Participants mitigate through microencapsulation, spore-forming strains that survive heat, and postbiotic preparations that do not require live organisms at all. None of those fully replaces a viable chilled product.
Market Impact: Scoring covers 4 nutrient categorie
4 additional market trends, 3 additional growth drivers, and 2 additional restraints and challenges are covered in the full report. Contact sales@marketmindsadvisory.com to access the complete intelligence.

Segment CAGR and Growth Architecture

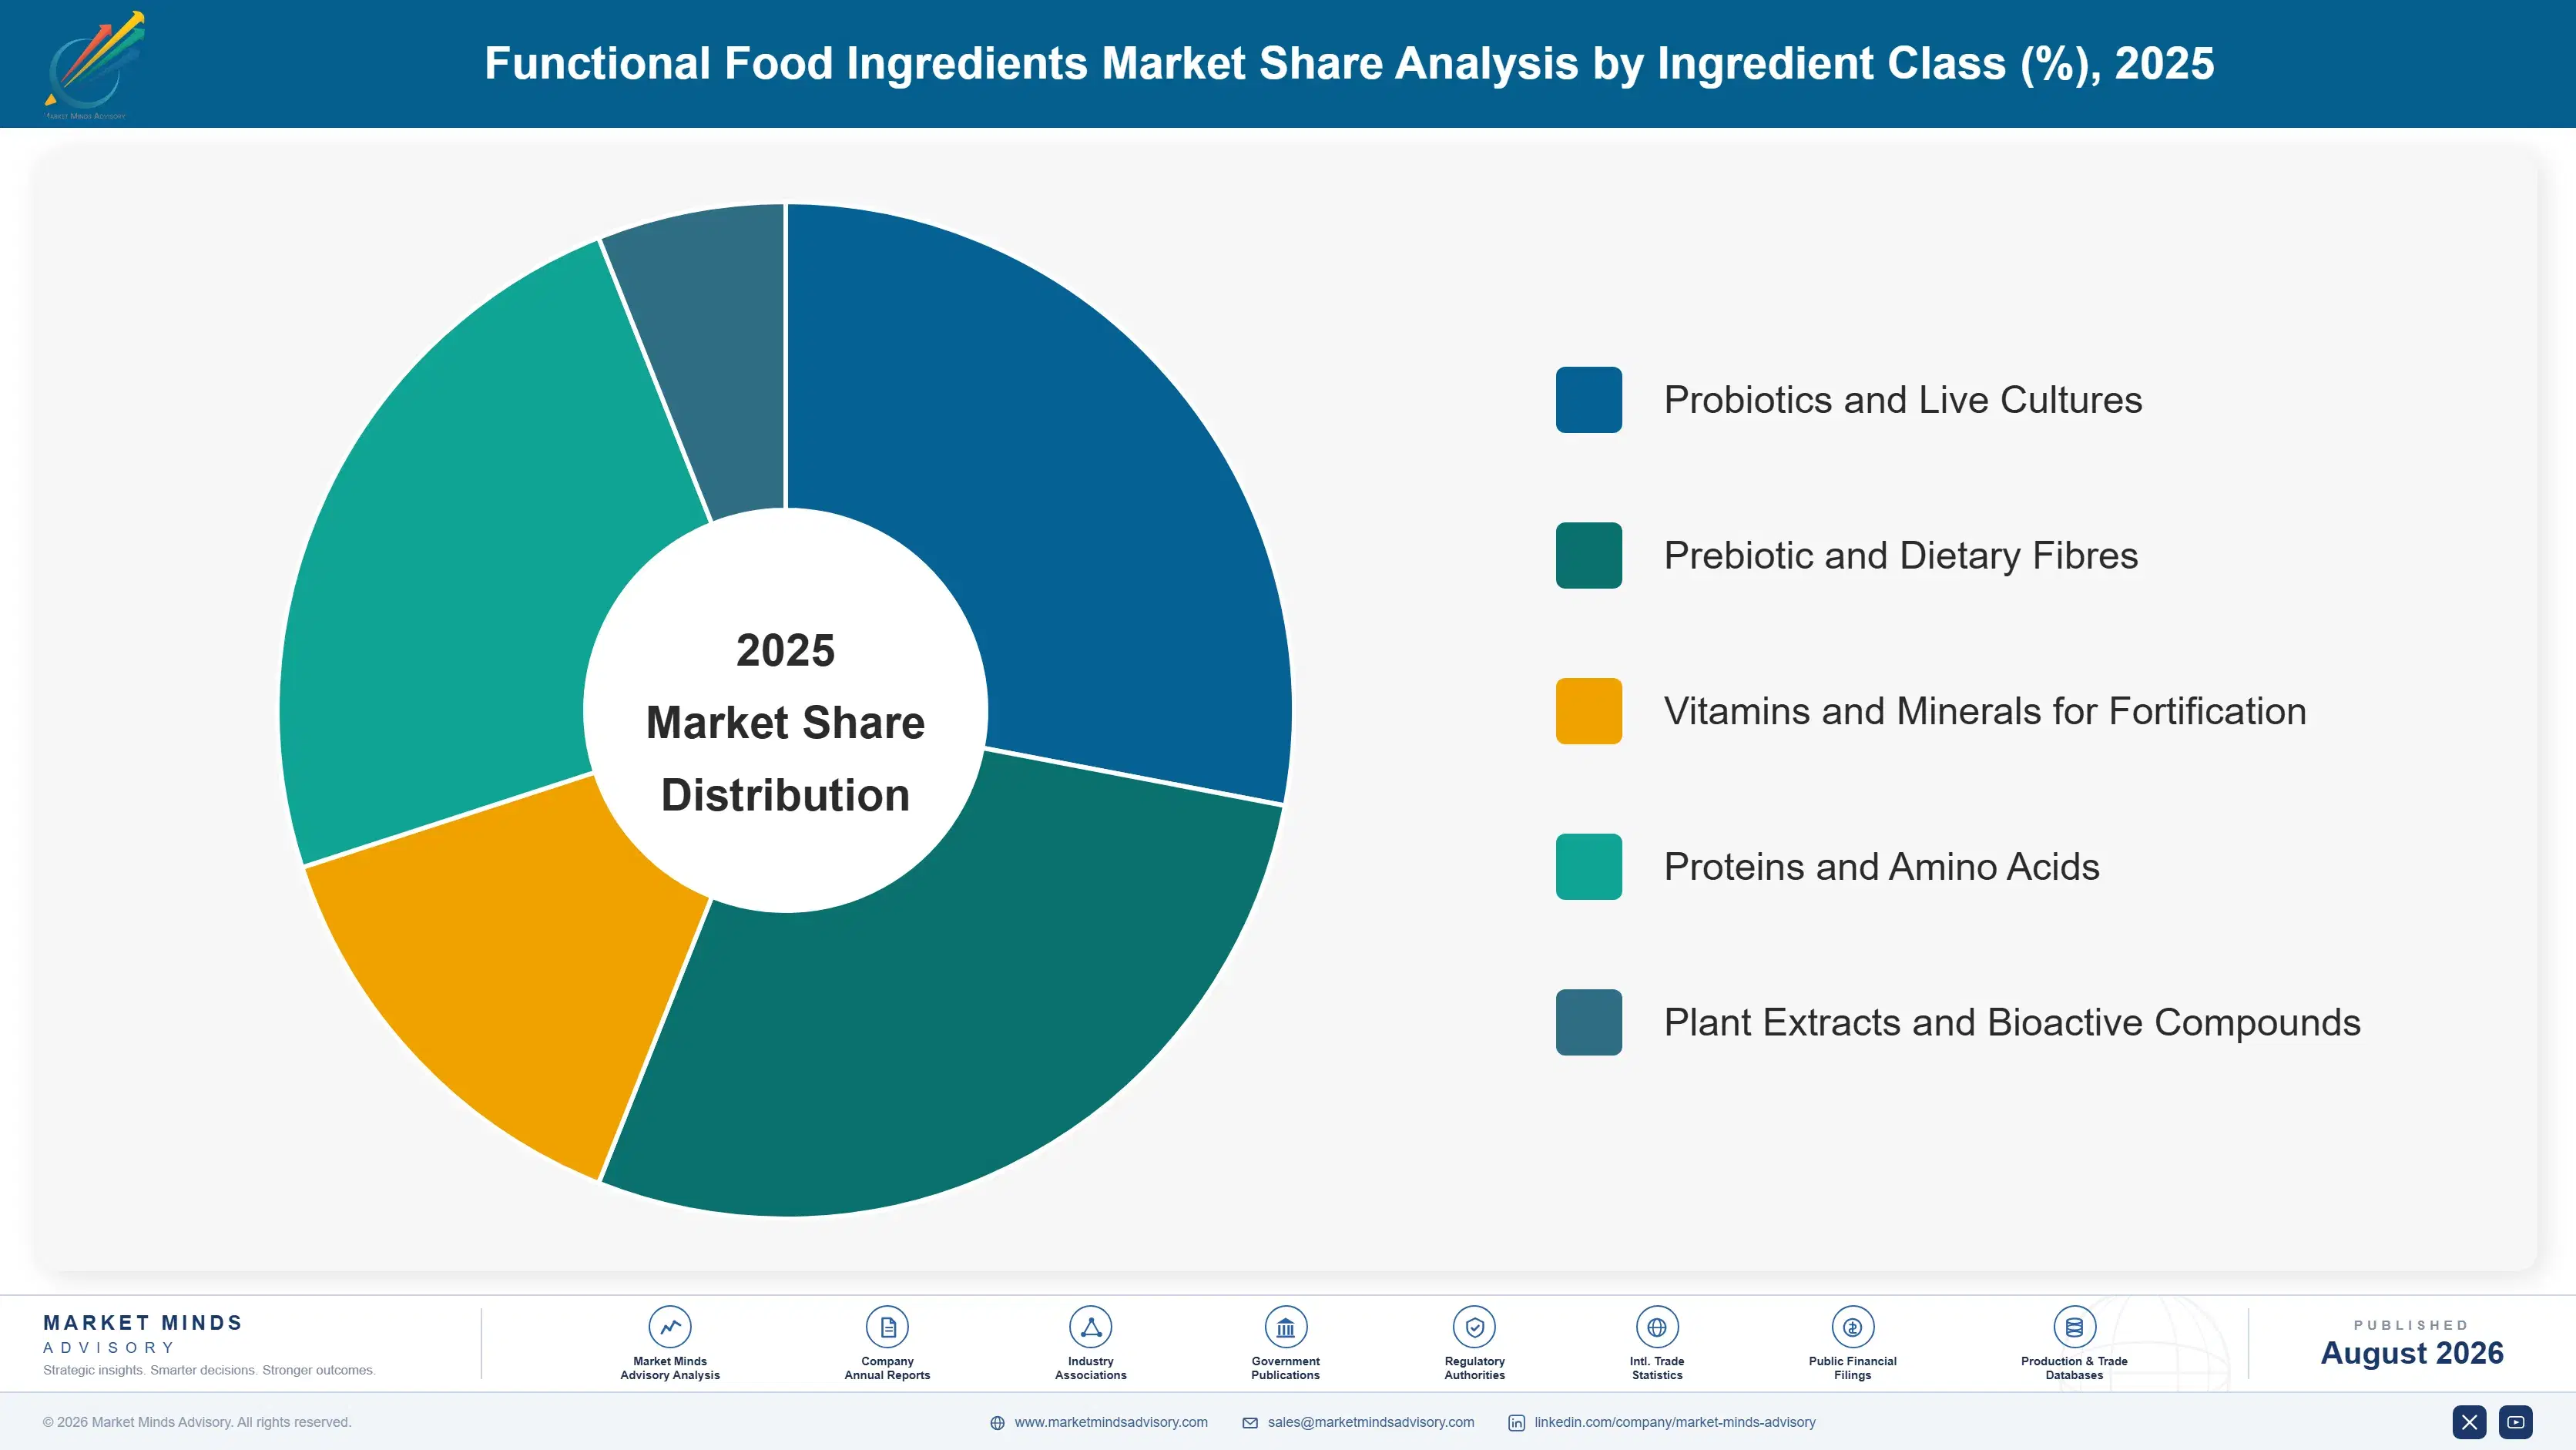
Segmentation follows ingredient class, a single classification describing the type of functional material supplied. Each class carries its own production route, stability behaviour, regulatory pathway, and claim position, so commercial economics track the class rather than the health benefit marketed. End-use category and sales channel appear separately within the framework as their own distinct dimensions.
multifunctional-food-ingredients-market-market-share-analysis-1787324568095

Probiotics and Live Cultures

Probiotics and live cultures grow fastest at 11.7%, about 1.80 times the overall 6.5% rate, and consumer familiarity rather than new science drives most of it. Shoppers recognise strain names and colony counts without education, which removes a marketing cost that suppliers carried for two decades. Production runs through fermentation, so capacity is specialised and expansion takes years rather than months. The commercial constraint is viability: organisms must survive processing, distribution, and shelf life, which restricts most products to chilled formats. Microencapsulation, spore-forming strains, and postbiotic preparations are all being deployed to widen that range, with genuinely mixed results so far. Capacity, not consumer interest, is the practical limit right now.
CAGR 11.7%

Prebiotic and Dietary Fibres

Prebiotic and dietary fibres grow at 8.4%, the second-fastest class, and they benefit from the same gut health awareness driving probiotics without carrying any of the viability problems. Inulin, resistant starches, galacto-oligosaccharides, and beta-glucans all survive processing that kills live cultures, which makes them formulable into bakery, cereal, beverage, and snack products with far less technical difficulty. Fibre shortfall against dietary guidelines is well documented across developed markets, giving the category a public health argument that regulators accept more readily than most. Digestive tolerance at higher doses is the practical formulation limit, and it constrains how much can be added per serving. Public health argument gives the class unusual regulatory goodwill.
CAGR 8.4%
Full segment breakdown across 5 segments available in the complete report.

Regional Architecture and Country Demand Map

Regulatory permissiveness and consumption habit together set this distribution more than population does. East Asia leads on established functional food frameworks and daily consumption patterns, while Western Europe holds substantial value despite the strictest claim regime of any major market. South Asia and Pacific grows quickest of the seven.

North America

North America holds 27% of value, and its regulatory position explains much of the commercial character. Structure-function claims permit language that European authorities would reject outright, provided the claim avoids disease treatment, which gives brand owners far more room to communicate a benefit. Protein fortification has moved deepest here, appearing across snacks, beverages, and bakery in mainstream retail rather than health channels. Private label participation is heavy and puts persistent pressure on ingredient pricing. Growth of 6.0% reflects mature consumption with continued category expansion, and a consumer base already comfortable paying more for a health position they understand. Claim language developed here rarely transfers to European packaging without substantial rewriting.
Share: 27% | CAGR: 6.0% (2026 to 2036)

Western Europe

Claim regulation defines this market more than consumption does. Western Europe holds 22% of value while operating the strictest health claim regime of any major region, with roughly 15% of submitted claims approved and an evidence standard closer to pharmaceutical practice. Brand owners consequently sell reformulated products they cannot fully describe. Front-of-pack nutrition scoring compounds it, since a fortified product can still score poorly on sugar or fat. Nordic and Dutch markets consume functional dairy heavily. Growth of 5.0% is the slowest of the seven, reflecting flat food volumes and genuine communication constraints on the science suppliers fund. Suppliers therefore carry regulatory affairs cost here that other regions do not require of them.
Share: 22% | CAGR: 5.0% (2026 to 2036)
Regional intelligence for 5 additional markets available in the complete report: East Asia, South Asia and Pacific, Latin America, Middle East and Africa, Eastern Europe. Contact sales@marketmindsadvisory.com.
multifunctional-food-ingredients-market-country-cagr-analysis-1787324568609

Where Ingredient Suppliers Actually Earn Premium

Selling a compound on specification against a dozen equivalent suppliers is how this category commoditises. The four moves below shift earnings toward ground competitors cannot copy quickly: owning the claim dossier, solving the formulation problem, holding fermentation capacity, and reaching the reformulation window before the specification closes. Each takes years to build and resists a price response.

Own The Claim Dossier, Not Just The Molecule

A claim dossier takes three to five years of clinical work and considerable money, and European authorities approve roughly 15% of submissions. The supplier holding an approved claim sells something no competitor can match by matching the specification, because the brand owner is buying the sentence it may print rather than the compound in the bag. That converts a commodity ingredient into a differentiated one for the life of the approval. Suppliers without dossiers compete on price against everyone who makes the same molecule. Dossiers also travel poorly between jurisdictions, which multiplies the work.
Market Impact: Roughly 15% of submitted health cla

Sell Formulation Support Rather Than Specification

Protein off-notes, fibre texture, and probiotic viability are real technical problems that brand owners frequently cannot solve internally, particularly in formats that never carried these ingredients. A supplier arriving with an application laboratory and a working prototype competes on a different basis from one sending a specification sheet and a price. Viability through baking can drop 90% without the right encapsulation, and solving that is worth more than any discount. Application support also embeds the supplier in the recipe, which is where switching cost accumulates. That is where renewals are actually won.
Market Impact: Viability can drop 90% without the

Hold Fermentation Capacity Ahead Of Demand

Probiotics grow at 11.7% and fermentation capacity takes years to build, qualify, and bring to reliable yield. Suppliers running near 82% utilisation cannot serve a large new customer without either displacing an existing one or committing capital well ahead of contracted volume. Those who build early capture the growth; those who wait for firm orders arrive after the brand owner has qualified somebody else's strain. Capacity is the binding constraint in this class, not demand or science. Qualification alone takes 12 to 18 months after the plant is mechanically complete and running.
Market Impact: Fermentation assets already run nea

Reach The Reformulation Window Before It Closes

Brand owners revisit established recipes every 18 to 30 months, and outside that window a specification is effectively frozen no matter how good the alternative ingredient is. Suppliers tracking customer reformulation cycles and arriving with data and prototypes at the right moment get evaluated. Those calling at other times get filed. Front-of-pack scoring and sugar reduction programmes are currently forcing reformulation across many categories at once, which is opening more windows than usual right now. A supplier tracking 40 major accounts knows which recipes open next quarter and which stay shut.
Market Impact: Recipes reopen only every 18 to 30

Who Controls the Margin Pool

Fragmentation is moderate: the top five hold roughly 27% of ingredient revenue across a category spanning fermentation, extraction, and chemical synthesis. The gap between leaders and challengers is regulatory affairs capability and application support rather than manufacturing quality, which is comparable among established suppliers. All participants here are assessed on one basis, revenue from functional food and beverage ingredients, excluding finished products, dose-form supplements, and ani
Competition runs along four lines. First, approved claims, since a dossier no competitor holds converts a commodity molecule into a differentiated one. Second, application support, because formulation problems in unfamiliar formats are what brand owners actually need solved. Third, production capacity, particularly fermentation assets that take years to build. Fourth, multi-market regulatory reach, as a global brand owner needs consistent supply across three incompatible claim regimes.

Pressure is building from two directions. Front-of-pack scoring and sugar reduction are forcing simultaneous reformulation across many categories, which reopens specifications that had been settled for years. Meanwhile specialist fermentation companies with strong strain portfolios are taking probiotic positions from broader ingredient houses. Rankings should favour suppliers holding approved claims and fermentation capacity over those competing on ingredient specification and delivered price alone.
multifunctional-food-ingredients-market-company-positioning-matrix-1787324569131

Competitive Moat and Risk Dimensions

DSM-FIRMENICH

Moat: Claim dossiers and regulatory reach

DSM-Firmenich holds one of the deepest portfolios of substantiated health claims in the industry, supported by regulatory affairs teams operating across European, American, and Asian frameworks simultaneously. That combination lets global brand owners run consistent formulations with market-appropriate claim language. Its vitamin and nutritional lipid manufacturing scale also sets a cost position that specialist competitors cannot approach on established compounds.
DSM-FIRMENICH

Risk: Vitamin pricing and merger integration

A meaningful share of revenue sits in vitamins where Chinese manufacturing capacity has driven persistent price volatility and chronically low margin on established compounds. Integration following the merger continues to absorb management attention that competitors are spending on customer development. Specialist fermentation companies with focused strain portfolios also compete effectively in probiotics, where breadth offers less advantage than depth.
IFF

Moat: Culture portfolio and fermentation scale

IFF holds one of the strongest culture and probiotic strain portfolios in the industry alongside substantial fermentation capacity, which matters in the fastest-growing ingredient class where capacity takes years to build. Strain-specific clinical evidence supports claim positions generic equivalents cannot match. Application capability across dairy, beverage, and bakery reaches customers who need viability problems solved rather than specifications quoted.
IFF

Risk: Debt load and portfolio breadth

Balance sheet leverage following major acquisitions constrains the capital available for fermentation expansion at the moment probiotic demand is growing fastest. A portfolio spanning flavours, enzymes, and health ingredients dilutes focus against specialists competing in single classes. Dairy category exposure also concentrates probiotic revenue in the formats where competition is heaviest and private label participation is strongest.

Players Tracked

Prominent Players

DSM-Firmenich
IFF
Kerry Group
BASF
Novonesis

Other Key Players

Ingredion
Tate and Lyle
ADM
Cargill
Glanbia Nutritionals
Roquette
BENEO
FrieslandCampina Ingredients
Arla Foods Ingredients
Lallemand
Sabinsa
Fonterra
Corbion
Lesaffre
Lonza

Recent Developments

MARCH 2025

European claim submissions continue facing high rejection rates

Further health claim opinions issued under the European framework maintained the pattern of rejection for gut health and cognitive submissions on evidence grounds. This was regulatory assessment rather than any commercial transaction, and it reinforced the gap between what the science supports and what brand owners may legally print.
Signal: Evidence standards closer to pharmaceutica
NOVEMBER 2024

Fermentation capacity expansions announced across probiotic suppliers

Several culture and probiotic producers committed to expanding fermentation capacity in Europe and North America as demand growth outpaced available output. These were organic capacity expansions rather than acquisitions or joint ventures, and they reflect capacity rather than demand being the binding constraint in the fastest-growing class.
Signal: Capacity committed years ahead of any cont
JULY 2024

Front-of-pack scoring expansion prompts wide reformulation activity

Additional markets extended front-of-pack nutrition scoring requirements, prompting brand owners to reopen recipes across dairy, beverage, and bakery categories at the same time. This was regulatory labelling policy rather than a corporate event, and it created an unusually broad set of reformulation windows for ingredient suppliers.
Signal: Simultaneous reformulation across many cat

Fermentation Feedstock, Dairy Streams, Energy

Cost structure varies by production route more than ingredient class. Fermentation-derived materials run on carbohydrate feedstock at 18% to 26% of cost with energy and utilities adding 15% to 22%, since fermentation, separation, and drying are energy intensive. Dairy-derived proteins track milk and whey stream pricing at 55% to 70% of cost. Plant extracts carry agricultural raw material at 40% to 55%, exposed to harvest variability.
The 2022 European energy crisis hit fermentation and drying operations particularly hard, with IEA reporting industrial gas prices at several times prior-year levels. Spray drying is among the most energy-intensive steps in ingredient work, and several European producers curtailed output rather than run at a loss. Novonesis and Kerry Group both disclosed energy and input cost pressure across that period, and pass-through to brand owners lagged badly.

Exposure separates by production route and location, not company size. A European fermentation producer carries energy costs an American or Chinese equivalent does not, on a process where energy is a fifth of cost. Dairy protein producers carry milk price exposure they cannot hedge, since whey pricing follows cheese production decisions elsewhere. Plant extract suppliers carry harvest risk on single-region crops, where one poor season resets pricing.
multifunctional-food-ingredients-market-cost-volatility-analysis-1787324569325

Index brand owner contracts to published feedstock benchmarks

Feedstock and energy together drive a third or more of cost on fermentation routes and more on dairy proteins, while annual supply agreements leave that swing with the supplier. Indexation converts it into a mechanical adjustment. Brand owners resist on commodity ingredients but concede more readily where an approved claim or application support makes the supplier difficult to replace.

Improve fermentation yield before adding new capacity

Strain improvement, feed strategy, and recovery gains raise output from existing assets at a fraction of the price of new capacity, which takes years to qualify. A few points of yield improvement can defer capital expenditure entirely. The work requires sustained investment and does not deliver on a predictable schedule, so it complements capacity planning rather than replaces it.

Diversify agricultural sourcing across growing regions

Plant extract inputs grown in a single region expose the supplier to one harvest, one weather pattern, and one set of export decisions. Qualifying material from a second region costs analytical work and specification alignment once, then provides continuity permanently. Brand owners increasingly require documented sourcing continuity anyway, so the commercial and compliance cases now point the same way.

Portfolio Architecture for Margin Defence

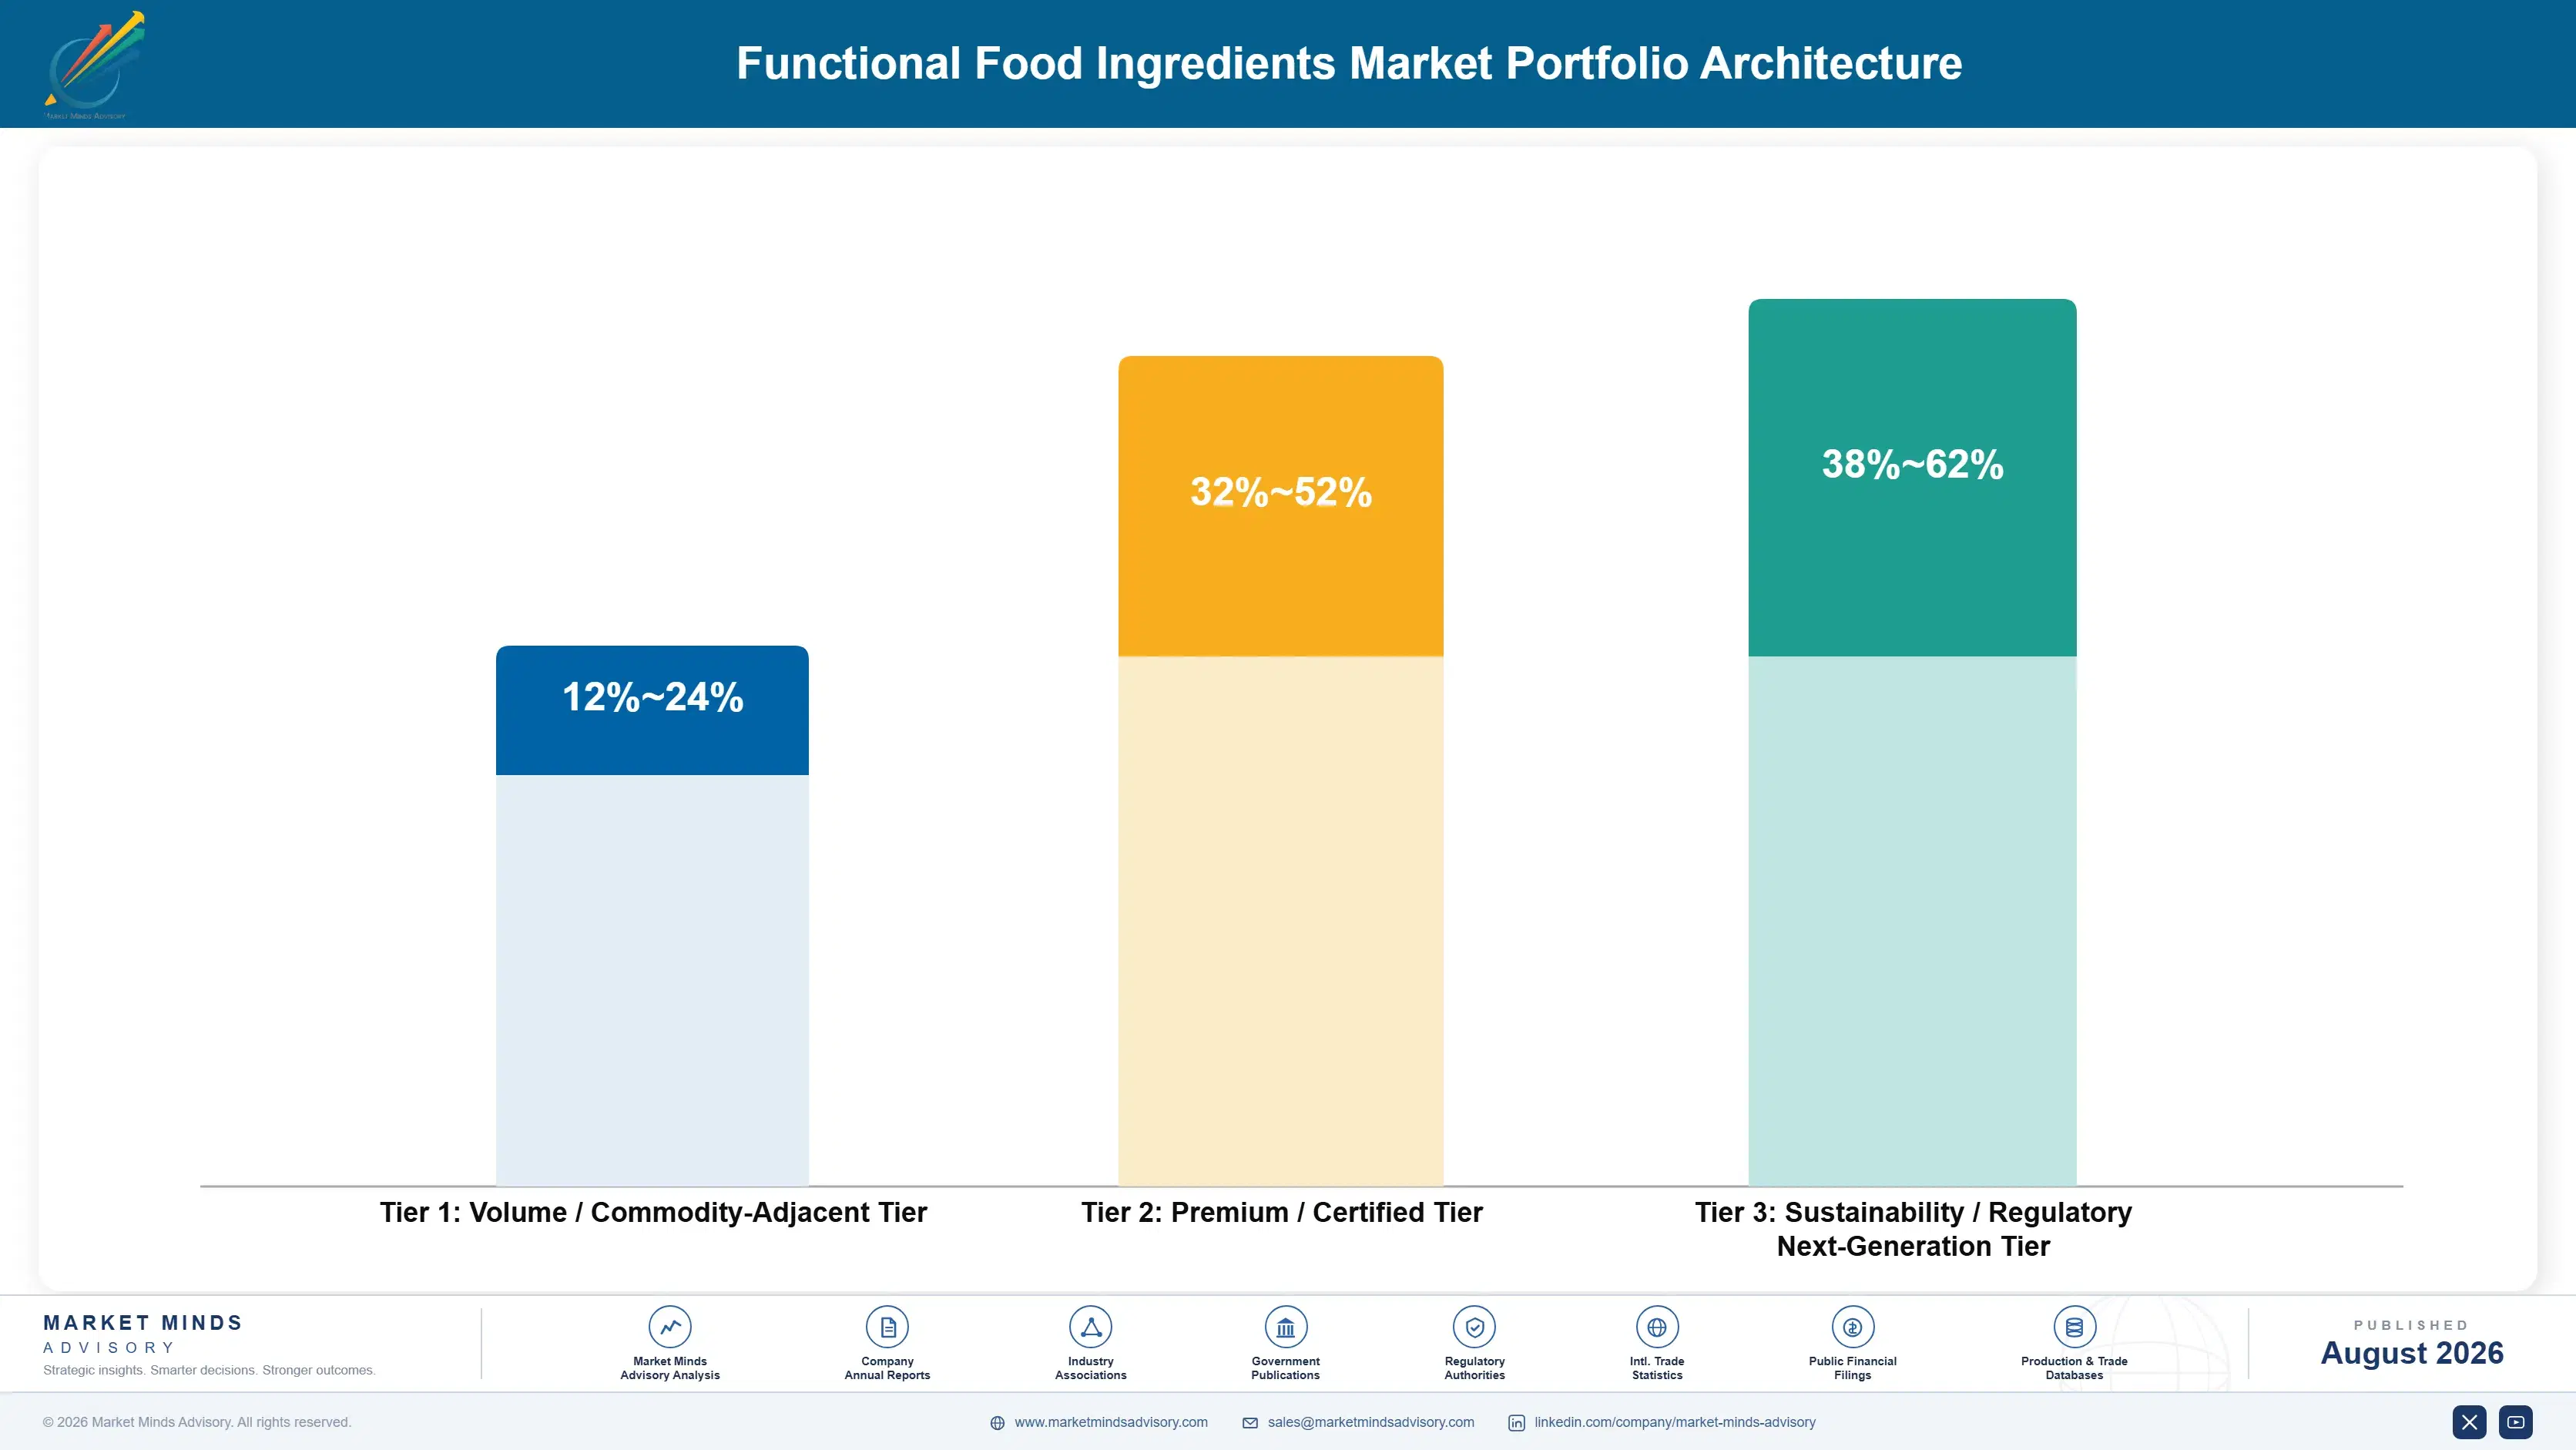
The portfolio splits into three tiers with different economics. Bulk vitamins, standard fibres, and commodity minerals form the volume tier, where Chinese manufacturing scale sets pricing and differentiation is essentially absent. Clinically substantiated ingredients with approved claims earn more, because the brand owner buys permission to make a statement rather than a compound. Specialist strains, novel bioactives, and encapsulated systems price against the formulation problem they solve.
The tension runs between volume ingredients that fill assets and claim-backed materials that earn the return. Bulk vitamins and standard fibres keep processing capacity loaded, cover fixed cost on expensive plant, and maintain the relationships through which specialist material sells. Yet they compete against Chinese production on delivered price alone. Suppliers handling this well run volume for utilisation while directing development toward claim dossiers and application capability.

High-value pools concentrate where evidence or capability limits competition: ingredients with approved health claims, patented strains with strain-specific clinical data, encapsulation systems that solve viability in difficult formats, and application-developed formulations embedded in a customer recipe. All four escape specification-and-price comparison. Bulk vitamin C and standard inulin sit at the other end, where a dozen producers offer identical material and delivered cost is the only variable.

Volume / Commodity-Adjacent Tier

Bulk vitamins, standard fibres, and commodity minerals sold on delivered price against Chinese manufacturing scale. The range is wide because production route and energy cost separate European producers sharply from Asian equivalents at identical selling prices.
Gross Margin: 12-24%

Premium / Certified Tier

Clinically substantiated ingredients carrying approved claims, patented strains, and materials with strain-specific evidence. The range is wide because claim status varies by jurisdiction, and the same ingredient earns quite differently across regulatory regions.
Gross Margin: 32-52%

Sustainability / Regulatory / Next-Generation Tier

Novel bioactives, encapsulated delivery systems, postbiotics, and precision fermentation proteins. The range is wide because regulatory approval status differs enormously by market and several of these carry unrecovered development cost.
Gross Margin: 38-62%
multifunctional-food-ingredients-market-portfolio-architecture-1787324569830

High-value Sub-segments and Strategic Watch-out

Probiotics and Live Cultures

High value and high growth at 11.7%, the fastest class, on gut health awareness that no longer requires consumer education. Viability through processing is the binding constraint, and fermentation capacity takes years to build, qualify, and bring to reliable yield. Expansion decisions have to precede the orders.
Gross Margin: 34-56%

Prebiotic and Dietary Fibres

High value with strong growth at 8.4%, carrying gut health positioning without any of the viability problems that restrict live cultures. Digestive tolerance at higher doses limits how much can be added per serving, which caps value per finished product. Formulation is straightforward by comparison with live cultures.
Gross Margin: 28-46%

Vitamins and Minerals for Fortification

The volume core, growing at 4.8% and squeezed by Chinese manufacturing scale on established compounds. Mandatory fortification programmes across India, Brazil, and much of Africa provide baseline volume that consumer preference does not influence at all. Pricing follows Chinese capacity decisions rather than anything a Western producer does.
Gross Margin: 12-24%

Plant Extracts and Bioactive Compounds

The strategic watch-out, growing at 7.1% on botanical interest that regulators treat with real caution. Harvest variability resets pricing annually, and claim substantiation is hardest here because traditional use evidence rarely meets modern trial standards. Sourcing concentration in single growing regions adds a further commercial risk.
Gross Margin: 26-48%

How Recipe Positions Actually Hold

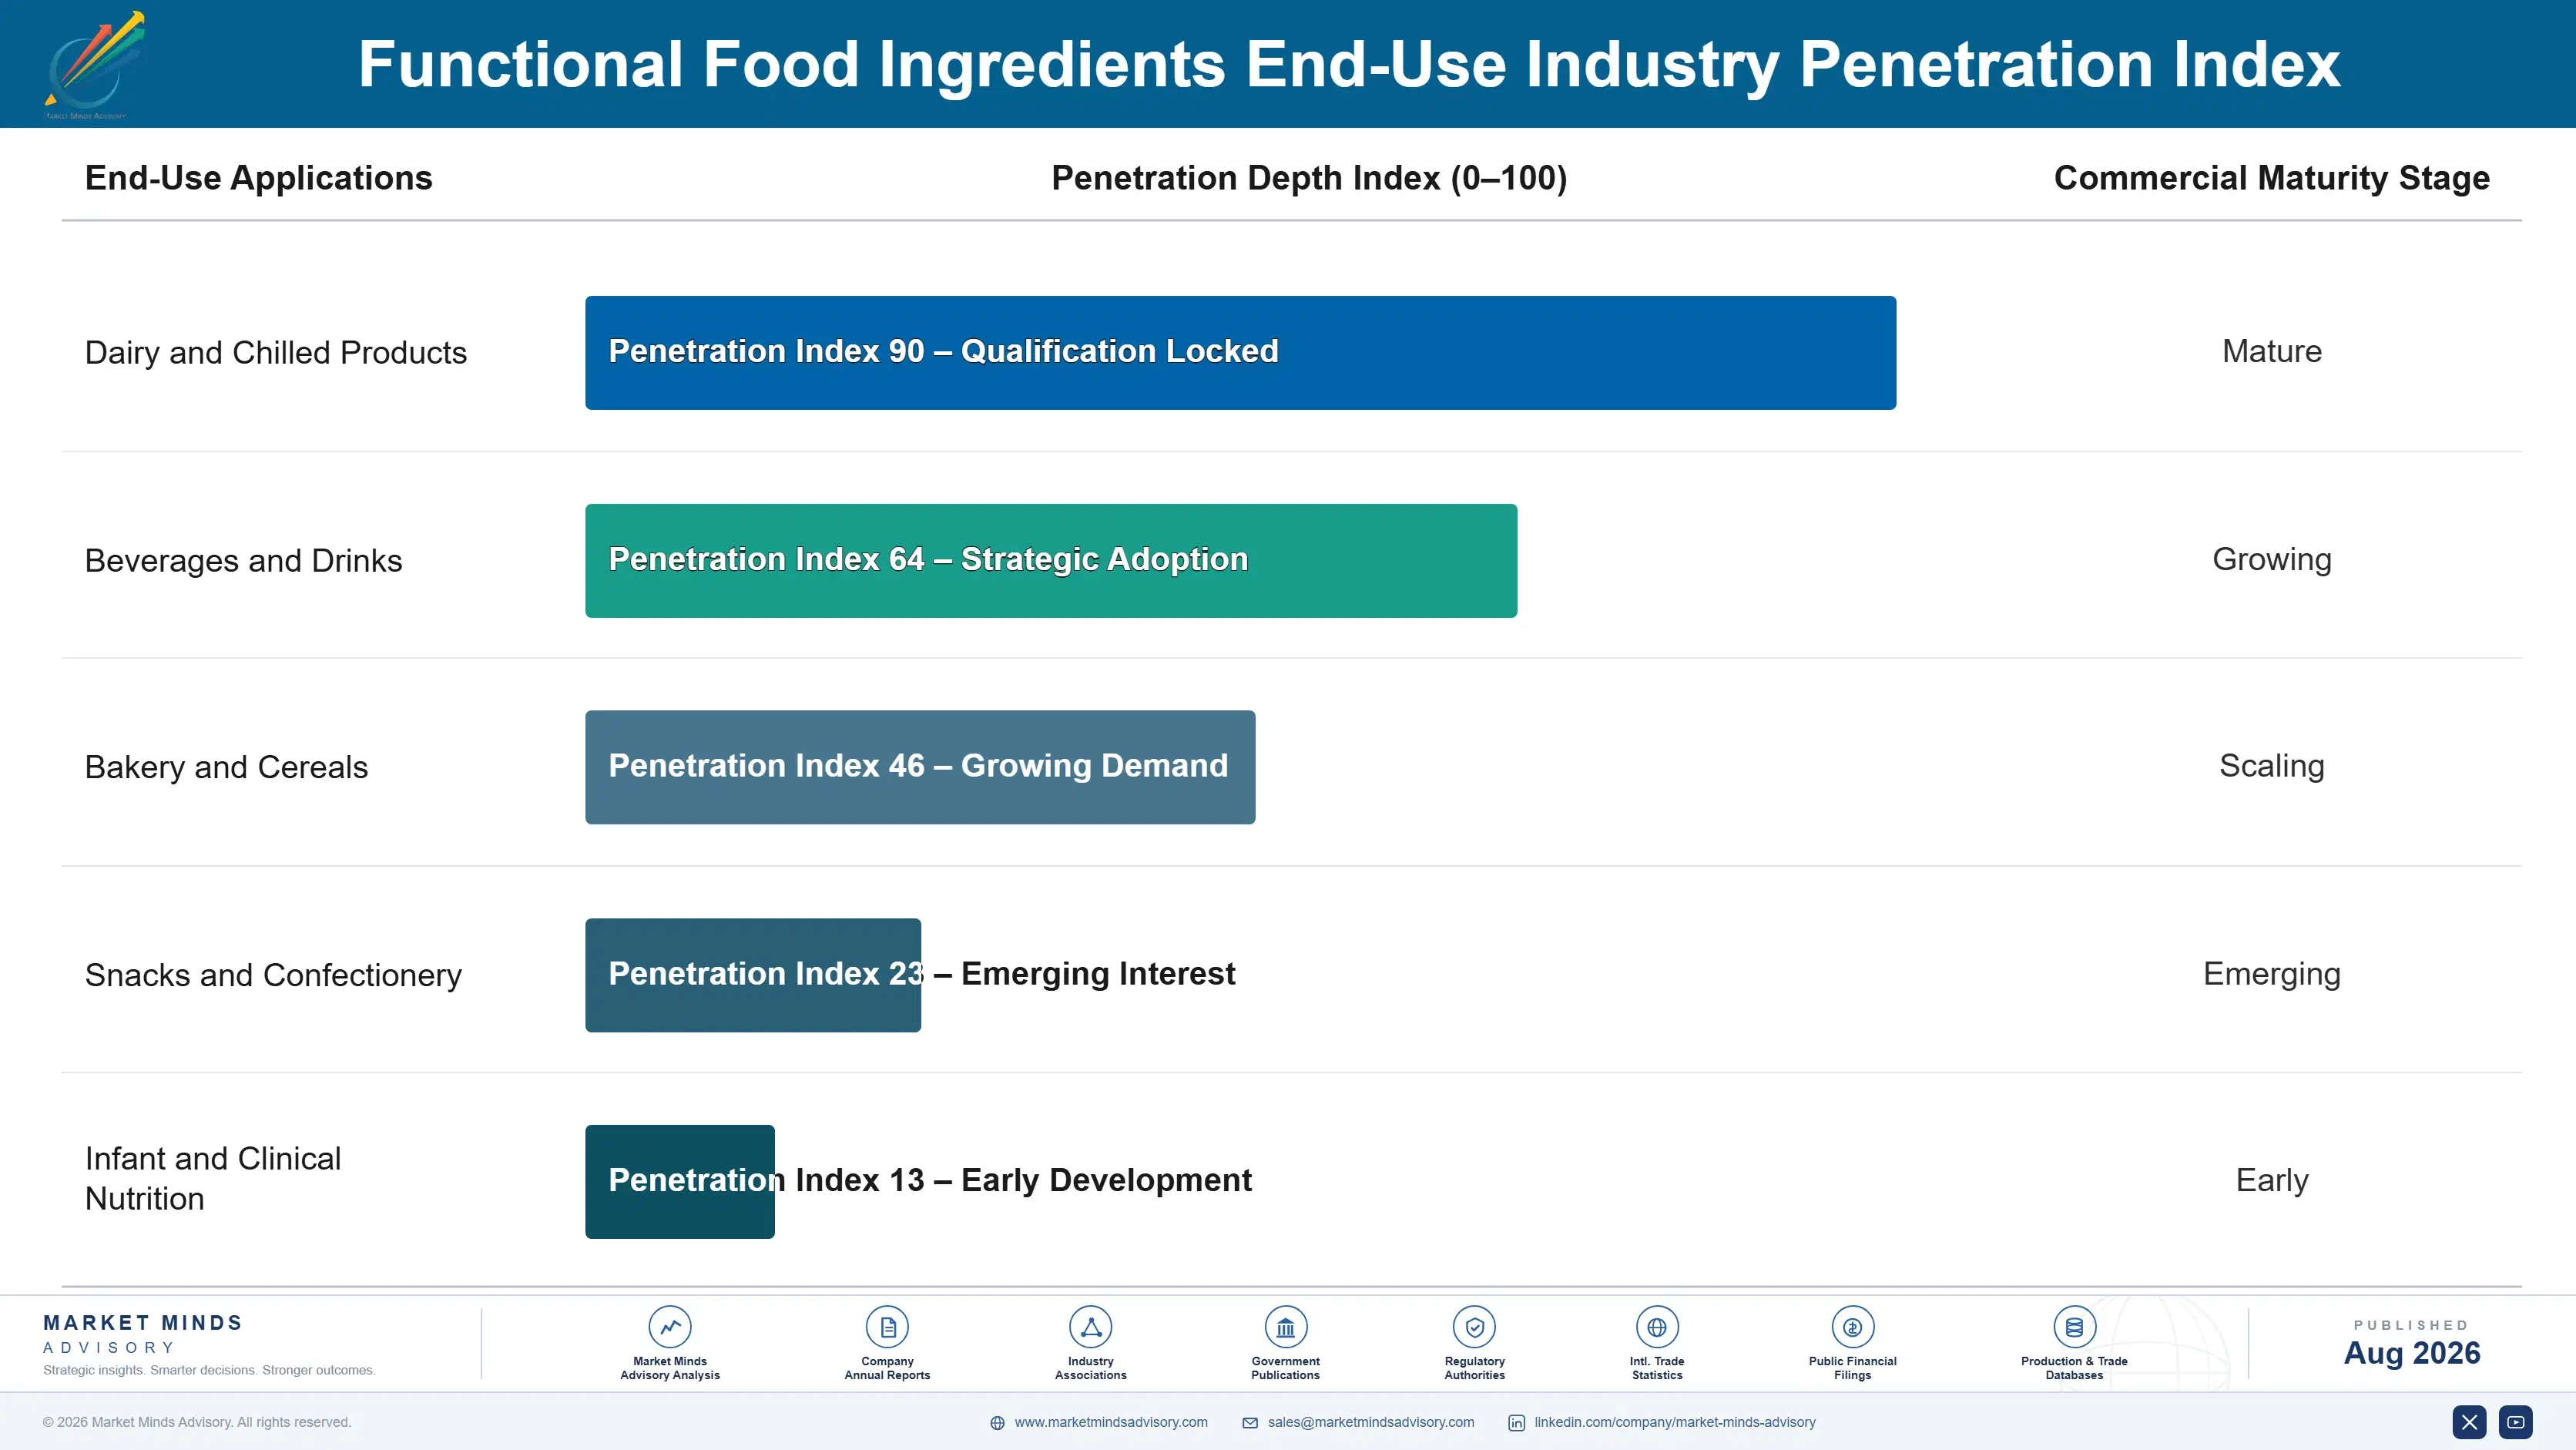
Demand commits at recipe qualification and repeats as orders. An ingredient written into an approved formulation has passed sensory testing, shelf life validation, regulatory review, and often consumer trials. Changing it reopens all of them. Brand owners revisit recipes every 18 to 30 months, and outside it the specification is frozen. That protects incumbents, which is why front-of-pack scoring and sugar reduction matter: they force recipes open across categories at once.
Stickiness varies by how much of the product identity the ingredient carries. A patented strain named on the pack sticks hardest, since removing it changes the marketing claim itself. Encapsulated systems solving a viability problem stick nearly as well, because the alternative reintroduces the problem. Standard vitamins and commodity fibres stick least, moving on delivered price at every purchasing review to whichever supplier quotes lowest.

Buyer profiles have shifted from food technologists specifying functionality toward teams where regulatory, marketing, and procurement hold a veto. Regulatory asks what may be said in each market before development begins. Marketing asks whether consumers recognise the ingredient. That change rewards suppliers bringing claim language and consumer data alongside technical specification, and penalises those still selling mechanism of action to a food technologist alone.
multifunctional-food-ingredients-market-end-use-penetration-index-1787324570319

Our Call On Functional Ingredients

These are among the four positions where our research anticipates prominent divergence between winners and laggards over the coming forecast period. Each is grounded in the demand model, the regulatory perimeter, and the announced capacity pipeline.
01 / CLAIMS BEAT COMPOUNDS

Brand owners buy the sentence, not the molecule

European authorities approve roughly 15% of submitted health claims, which means an approved claim is a genuinely scarce asset that no competitor can obtain merely by matching a specification sheet. The brand owner is buying permission to state a benefit, and the compound is simply how that permission is delivered. Suppliers who fund dossiers convert commodity molecules into differentiated ones for the life of the approval, while those who do not simply compete on price against everyone else making the identical material.
02 / FORMULATION SUPPORT SELLS

Solve the problem rather than quote the specification

Protein off-notes, fibre texture, and probiotic viability are genuine technical problems that brand owners frequently cannot solve internally, particularly in snack, beverage, and bakery formats that never carried these ingredients before. Viability through baking can drop 90% without correct encapsulation, and solving that problem is worth considerably more to a brand owner than any discount a competitor offers. Application laboratories and working prototypes also embed a supplier inside the recipe, which is precisely where switching cost accumulates and then holds for years afterwards.
03 / FERMENTATION CAPACITY BINDS

Build before the volume is contracted, not after

Probiotics grow at 11.7% against a market growing at 6.5%, and fermentation assets running near 82% utilisation cannot absorb a large new customer without displacing an existing one somewhere. Building fermentation capacity takes years to construct, qualify, and bring to reliable yield, so the decision has to precede the order rather than follow it. Suppliers waiting for firm contracted volume before committing will arrive after the brand owner has qualified a competitor's strain, validated it in the recipe, and moved on.
04 / REFORMULATION WINDOWS MATTER

Specifications reopen rarely and close again quickly

Brand owners revisit their established recipes only every 18 to 30 months, and between those windows a specification is frozen regardless of how much better an alternative ingredient might actually be. Suppliers who track customer reformulation cycles and arrive with clinical data and working prototypes at the right moment get a genuine hearing; the rest get filed. Front-of-pack scoring and sugar reduction programmes are currently forcing recipes open across many categories at once, and that unusually wide window will not last indefinitely.

Engagement Snapshot From the Field

A live engagement with an industry participant carrying material or product regulatory and market exposure ahead of a defining policy shift, showing how our research translates into a defensible multi-year portfolio strategy.
MARKET MINDS ADVISORY · CLIENT ENGAGEMENT SUMMARY
Functional Food Ingredients Producer Strategic Portfolio Review and Transition Roadmap 2026·Investment Scenario on Functional Food Ingredients Exposure Evaluation 2025-26
CLIENT PROFILE
A European dairy processor with roughly USD 2.1 billion in annual revenue engaged MMA after front-of-pack nutrition scoring pushed several of its functional yoghurt and drink lines into poor scores despite the added ingredients. The client reported that four of its seven functional lines were losing listings at major retailers on score grounds alone (client-reported, unverified by MMA).
STRATEGIC CHALLENGE
Adding probiotics and protein had not offset sugar content in the scoring system, and reformulating to cut sugar risked the taste profile that drove repeat purchase. Ingredient suppliers had proposed additional functional materials without addressing the scoring arithmetic at all. The board needed to know which lines were worth reformulating and which should be discontinued before further investment.
MMA APPROACH
MMA modelled front-of-pack scores against reformulation options rather than evaluating ingredients on their own merits, which internal work had done. We tested which claim language remained available in each target market after reformulation, since several proposed ingredients carried no approved European claim. We then assessed consumer recognition of the ingredients concerned, rather than assuming familiarity from category sales.
KEY FINDINGS
  1. Sugar reduction moved scores more than any functional addition could, meaning ingredient selection was secondary to base recipe reformulation entirely on every line tested.
  2. Two of the proposed ingredients carried no approved European claim, so the client would have paid a premium for a benefit it could not legally state.
  3. Consumer recognition of the named strain was far below internal assumptions outside two of the client's nine markets (client-reported, unverified by MMA).
  4. Three of the seven lines could not reach an acceptable score without losing the taste profile driving repeat purchase, and were better discontinued.
CLIENT PROFILE
A European dairy processor with roughly USD 2.1 billion in annual revenue engaged MMA after front-of-pack nutrition scoring pushed several of its functional yoghurt and drink lines into poor scores despite the added ingredients. The client reported that four of its seven functional lines were losing listings at major retailers on score grounds alone (client-reported, unverified by MMA).
STRATEGIC CHALLENGE
Adding probiotics and protein had not offset sugar content in the scoring system, and reformulating to cut sugar risked the taste profile that drove repeat purchase. Ingredient suppliers had proposed additional functional materials without addressing the scoring arithmetic at all. The board needed to know which lines were worth reformulating and which should be discontinued before further investment.
MMA APPROACH
MMA modelled front-of-pack scores against reformulation options rather than evaluating ingredients on their own merits, which internal work had done. We tested which claim language remained available in each target market after reformulation, since several proposed ingredients carried no approved European claim. We then assessed consumer recognition of the ingredients concerned, rather than assuming familiarity from category sales.
KEY FINDINGS
  1. Sugar reduction moved scores more than any functional addition could, meaning ingredient selection was secondary to base recipe reformulation entirely on every line tested.
  2. Two of the proposed ingredients carried no approved European claim, so the client would have paid a premium for a benefit it could not legally state.
  3. Consumer recognition of the named strain was far below internal assumptions outside two of the client's nine markets (client-reported, unverified by MMA).
  4. Three of the seven lines could not reach an acceptable score without losing the taste profile driving repeat purchase, and were better discontinued.
RECOMMENDED STRATEGY
Phase 1: Phase 1 (0 to 6 months): Reformulate base recipes for sugar before selecting functional ingredients, reversing the sequence the internal programme had assumed. Phase 2: Phase 2 (6 to 18 months): Restrict ingredient selection to materials carrying approved claims in the markets where each line actually sells. Phase 3: Phase 3 (18 to 30 months): Discontinue the three lines that cannot reach acceptable scores and redeploy that capacity to the reformulated lines.
OUTCOME
The client reformulated four lines, recovered retailer listings on three of them, and discontinued the remaining three rather than funding further reformulation. Restricting ingredient choice to claim-approved materials cut ingredient spend by roughly 9% while improving what marketing could legally say (client-reported, unverified by MMA).

Frequently Asked Questions

Foundational context covering the market sizes, CAGR, scope, country, region and competition that inform every finding below. This section is provided to cover basics and most often pre-purchase conversations, answered from the MMA Primary Research Dataset.

What is the current size of the Functional Food Ingredients Market?

The global functional food ingredients market is valued at USD 96.3 billion in 2025, covering probiotics, prebiotic fibres, fortification vitamins and minerals, proteins, and plant bioactives. Finished products and dose-form supplements are excluded.

How large will the Functional Food Ingredients Market be by 2036?

The market is forecast to reach USD 188.68 billion by 2036 in the base case, about 1.84 times the 2026 level. That represents incremental value of roughly USD 86.12 billion across the decade.

What is the CAGR for the Functional Food Ingredients Market 2026 to 2036?

The market grows at a 6.5% CAGR in the base case, with bull and bear scenarios at 7.7% and 5.3%. The spread turns mainly on European claim approvals and front-of-pack labelling pressure.

Which segment is growing fastest?

Probiotics and live cultures grow fastest at 11.7%, about 1.80 times the overall rate, on gut health awareness that no longer requires consumer education. Prebiotic and dietary fibres follow at 8.4%.

Who are the major companies in the Functional Food Ingredients Market?

Leading suppliers include DSM-Firmenich, IFF, Kerry Group, BASF, and Novonesis. Fragmentation is moderate, with the top five holding roughly 27% of ingredient revenue across fermentation, extraction, and synthesis routes.

Which country is growing fastest?

India grows fastest at an 11.3% CAGR, as packaged food penetration rises and staple fortification mandates cover salt, oil, and milk. China and Indonesia follow on packaged dairy and beverage expansion.

Report Segmentation Architecture

The full report scope spans multiple orthogonal segmentation dimensions, with cross-tabulated demand data provided for each dimension pair. Coverage extends further to regional breakdowns, trend trajectories, and the competitive detail needed to support segment-level decision-making.

By Ingredient Class

  • Probiotics and Live Cultures
  • Prebiotic and Dietary Fibres
  • Vitamins and Minerals for Fortification
  • Proteins and Amino Acids
  • Plant Extracts and Bioactive Compounds

By End-Use Industry

  • Dairy and Chilled Products
  • Beverages and Drinks
  • Bakery and Cereals
  • Snacks and Confectionery
  • Infant and Clinical Nutrition

By Sales Channel

  • Direct Contract To Food Manufacturer
  • Ingredient Distributor and Trader
  • Contract Manufacturer and Co-Packer
  • Retailer Own-Label Supply

By Region

  • North America
  • Western Europe
  • East Asia
  • South Asia and Pacific
  • Latin America
  • Middle East and Africa
  • Eastern Europe

Scope, Methodology, and Coverage

Every figure in this report is reproducible from documented input assumptions. The scope below maps the historical period, the forecast horizon, the segmentation dimensions, and the countries covered, alongside the underlying primary and qualitative methodology.
Historical Period
2020 to 2025
Forecast Period
2026 to 2036
Base Year
2025 (USD billions; MMA Primary Research Dataset, August 2026)
Market Definition
The functional food ingredients market comprises the manufacture and sale of ingredients incorporated into food and beverage products to deliver a physiological benefit beyond basic nutrition, valued at supplier selling prices to food manufacturers, distributors, and contract packers. It spans probiotics and live cultures, prebiotic and dietary fibres, vitamins and minerals used for fortification, proteins and amino acids sold on a functional basis, and plant extracts and bioactive compounds, together with the encapsulation and delivery systems applied to them. Finished functional food and beverage products, dietary supplements sold in tablet, capsule, or dose form, pharmaceutical active ingredients, animal and pet nutrition ingredients, infant formula sold as a finished product, and commodity food ingredients used solely for taste, colour, preservation, or texture are excluded.
Quantitative Units
USD billions (current prices); ingredient volume in thousand tonnes where applicable
Segmentation Dimensions
By Ingredient Class; By End-Use Industry; By Sales Channel; By Region
Regions Covered
North America, Western Europe, East Asia, South Asia and Pacific, Latin America, Middle East and Africa, Eastern Europe
Countries Covered
USA, China, Germany, France, UK, Japan, South Korea, India, Australia, Canada, Brazil, Mexico, Indonesia, Vietnam, Thailand, Malaysia, UAE, Saudi Arabia, South Africa, Nigeria, Turkey, Poland, Netherlands, Italy, Spain, Sweden, Switzerland, Argentina, Colombia, Singapore, and additional markets relevant to this sector
Key Companies Profiled
DSM-Firmenich, IFF, Kerry Group, BASF, Novonesis, Ingredion, Tate and Lyle, ADM, Cargill, Glanbia Nutritionals, Roquette, BENEO, FrieslandCampina Ingredients, Arla Foods Ingredients, Lallemand, Sabinsa, Fonterra, Corbion, Novonesis, Lonza
Quantitative Methodology
Primary survey, n=3,800 respondents, Q4 2025, six countries; demand-side model with trade association cross-validation
Qualitative Methodology
47 expert interviews, Q4 2025; applied to validate demand model assumptions, identify emerging dynamics, and assess competitive positioning
Report Format
PDF and XLSX data workbook (Word format preview document)
Publisher
Market Minds Advisory
Report Code
MMA-2026-AGR-253
Published
August 2026
Contact
sales@marketmindsadvisory.com | www.marketmindsadvisory.com

Purchase the full Functional Food Ingredients Market Report (2026 to 2036).

The full MMA Functional Food Ingredients report sizes the market across five ingredient classes, five end-use categories, four sales channels, and seven regions through 2036. It profiles 20 suppliers on a consistent basis of functional food and beverage ingredient revenue, scoring each on approved claim portfolio, application support depth, production capacity, and multi-market regulatory reach. Scenario models quantify how claim approval rates, front-of-pack labelling, and fermentation capacity move both volume and achievable margin by class. The report also includes health claim status mapping across major jurisdictions, reformulation window tracking by category, fermentation capacity and utilisation analysis, and ingredient cost share benchmarking for finished product economics.
Five-class and four-channel market sizing to 2036
Twenty-supplier benchmark on functional food ingredient revenue
Health claim status mapping across major regulatory jurisdictions
Reformulation window tracking by food and beverage category
Fermentation capacity and utilisation analysis for probiotic classes
Ingredient cost share benchmarking against finished product economics

Built For The People Who Decide

From boardroom strategy to bench-side execution, this report is read cover-to-cover by leaders shaping the next decade of their industry, turning demand scenarios, market dynamics and valuation benchmarks into decisions.
CXOs/ Presidents/ VPs/ Managers
M&A and Corporate Development
Strategy Teams and R&D Heads
Procurement and Product Directors
Regulatory and Compliance Leaders
Investor Relations and Equity Analysts