Market Minds Advisory
Multichannel Networks Market

Multichannel Networks Market: Multichannel Networks Market: Creator Leverage, Rights Ownership and What Survived The Aggregation Model 2026 to 2036

The original business aggregated creators who had no realistic alternative at all. Creators now have several, which left aggregation worth almost nothing and made rights ownership worth a great deal more.

Lead Analyst

Published

September 2026

Make Smarter Decisions with Customized Research Insights

Request a free sample report and evaluate market opportunities, growth trends, and competitive dynamics relevant to your business needs.

2025 MARKET VALUE$6.2BMarket Size 2025
2036 FORECAST VALUE$18.7BBase Case , 2026 to 2036
CAGR 2026 TO 203610.5 %Bull 11.8% / Bear 9.3%
INCREMENTAL OPPORTUNITY$11.8BNet 10- year value creation
EXPANSION MULTIPLE2.71x2036 value over 2026 base
Strategic Levers
M&A Pipeline
Regional Outlook
Country Rankings
Competitive Intelligence
Segmental Deep-dive
Call-Us : 91 93563 13602

Executive Snapshot and Market Trajectory.

The original business aggregated creators who had no realistic alternative at all. Creators now have several of them, which left pure aggregation worth almost nothing and made owning rights in the underlying content worth a great deal more than it ever used to be.
The market reaches USD 6.9 billion in 2026 and USD 18.7 billion by 2036, a 2.71 times expansion at 10.5% annually. Rights ownership and catalogue licensing grows at 15.8%, half again the market rate of 10.5%, because owning content generates revenue whichever platform happens to be paying well this year. East Asia holds 29% of global network revenue, and Indonesia compounds fastest of any market at 17.4% on creator economies that keep scaling rapidly.
Five networks hold just 31% of managed creator revenue between them, and concentration keeps falling as creators become steadily harder to retain. Studio71, BroadbandTV, Collab, Yoola and Jellysmack lead what remains of the field. Networks that only take a share of the advertising revenue have very little left to defend at all, which is exactly why so many have moved toward production, rights and brand services instead.
Market Definition
This report covers multichannel network businesses by revenue class: rights ownership and catalogue licensing, brand partnership and sponsorship management, production and content services, audience development and channel operations, merchandising and commerce enablement, and advertising revenue share administration. It excludes talent agencies representing individuals without channel operations, video platforms and hosting infrastructure, advertising technology and exchanges, music labels and recorded music rights, and traditional television production companies.
Base Year Value
$6.2B in 2025 (MMA Primary Research Dataset, September 2026)
Forecast Period
2026 to 2036, eleven discrete annual values
CAGR
10.5% base case. Bull 11.8%. Bear 9.3%.
Fastest Growth Segment
Rights Ownership And Catalogue Licensing: 15.8% CAGR
Fastest Growth Country
Indonesia: 17.4% CAGR
Fastest Growth Region
South Asia and Pacific: 12.7% CAGR
Largest Region
East Asia: 29% of 2025 global value
Market Leaders
Studio71, BroadbandTV, Collab, Yoola and Jellysmack lead on managed creator and network revenue. Source: MMA Analysis.
Primary Survey
n=3,800 procurement and R&D decision-makers, Q4 2025, six countries
Methodology
Demand-side build-up, cross-validated against public data, 47 expert interviews

Multichannel Networks Market Forecast Scenarios

multichannel-networks-market-size-forecast-scenario-1789996498577
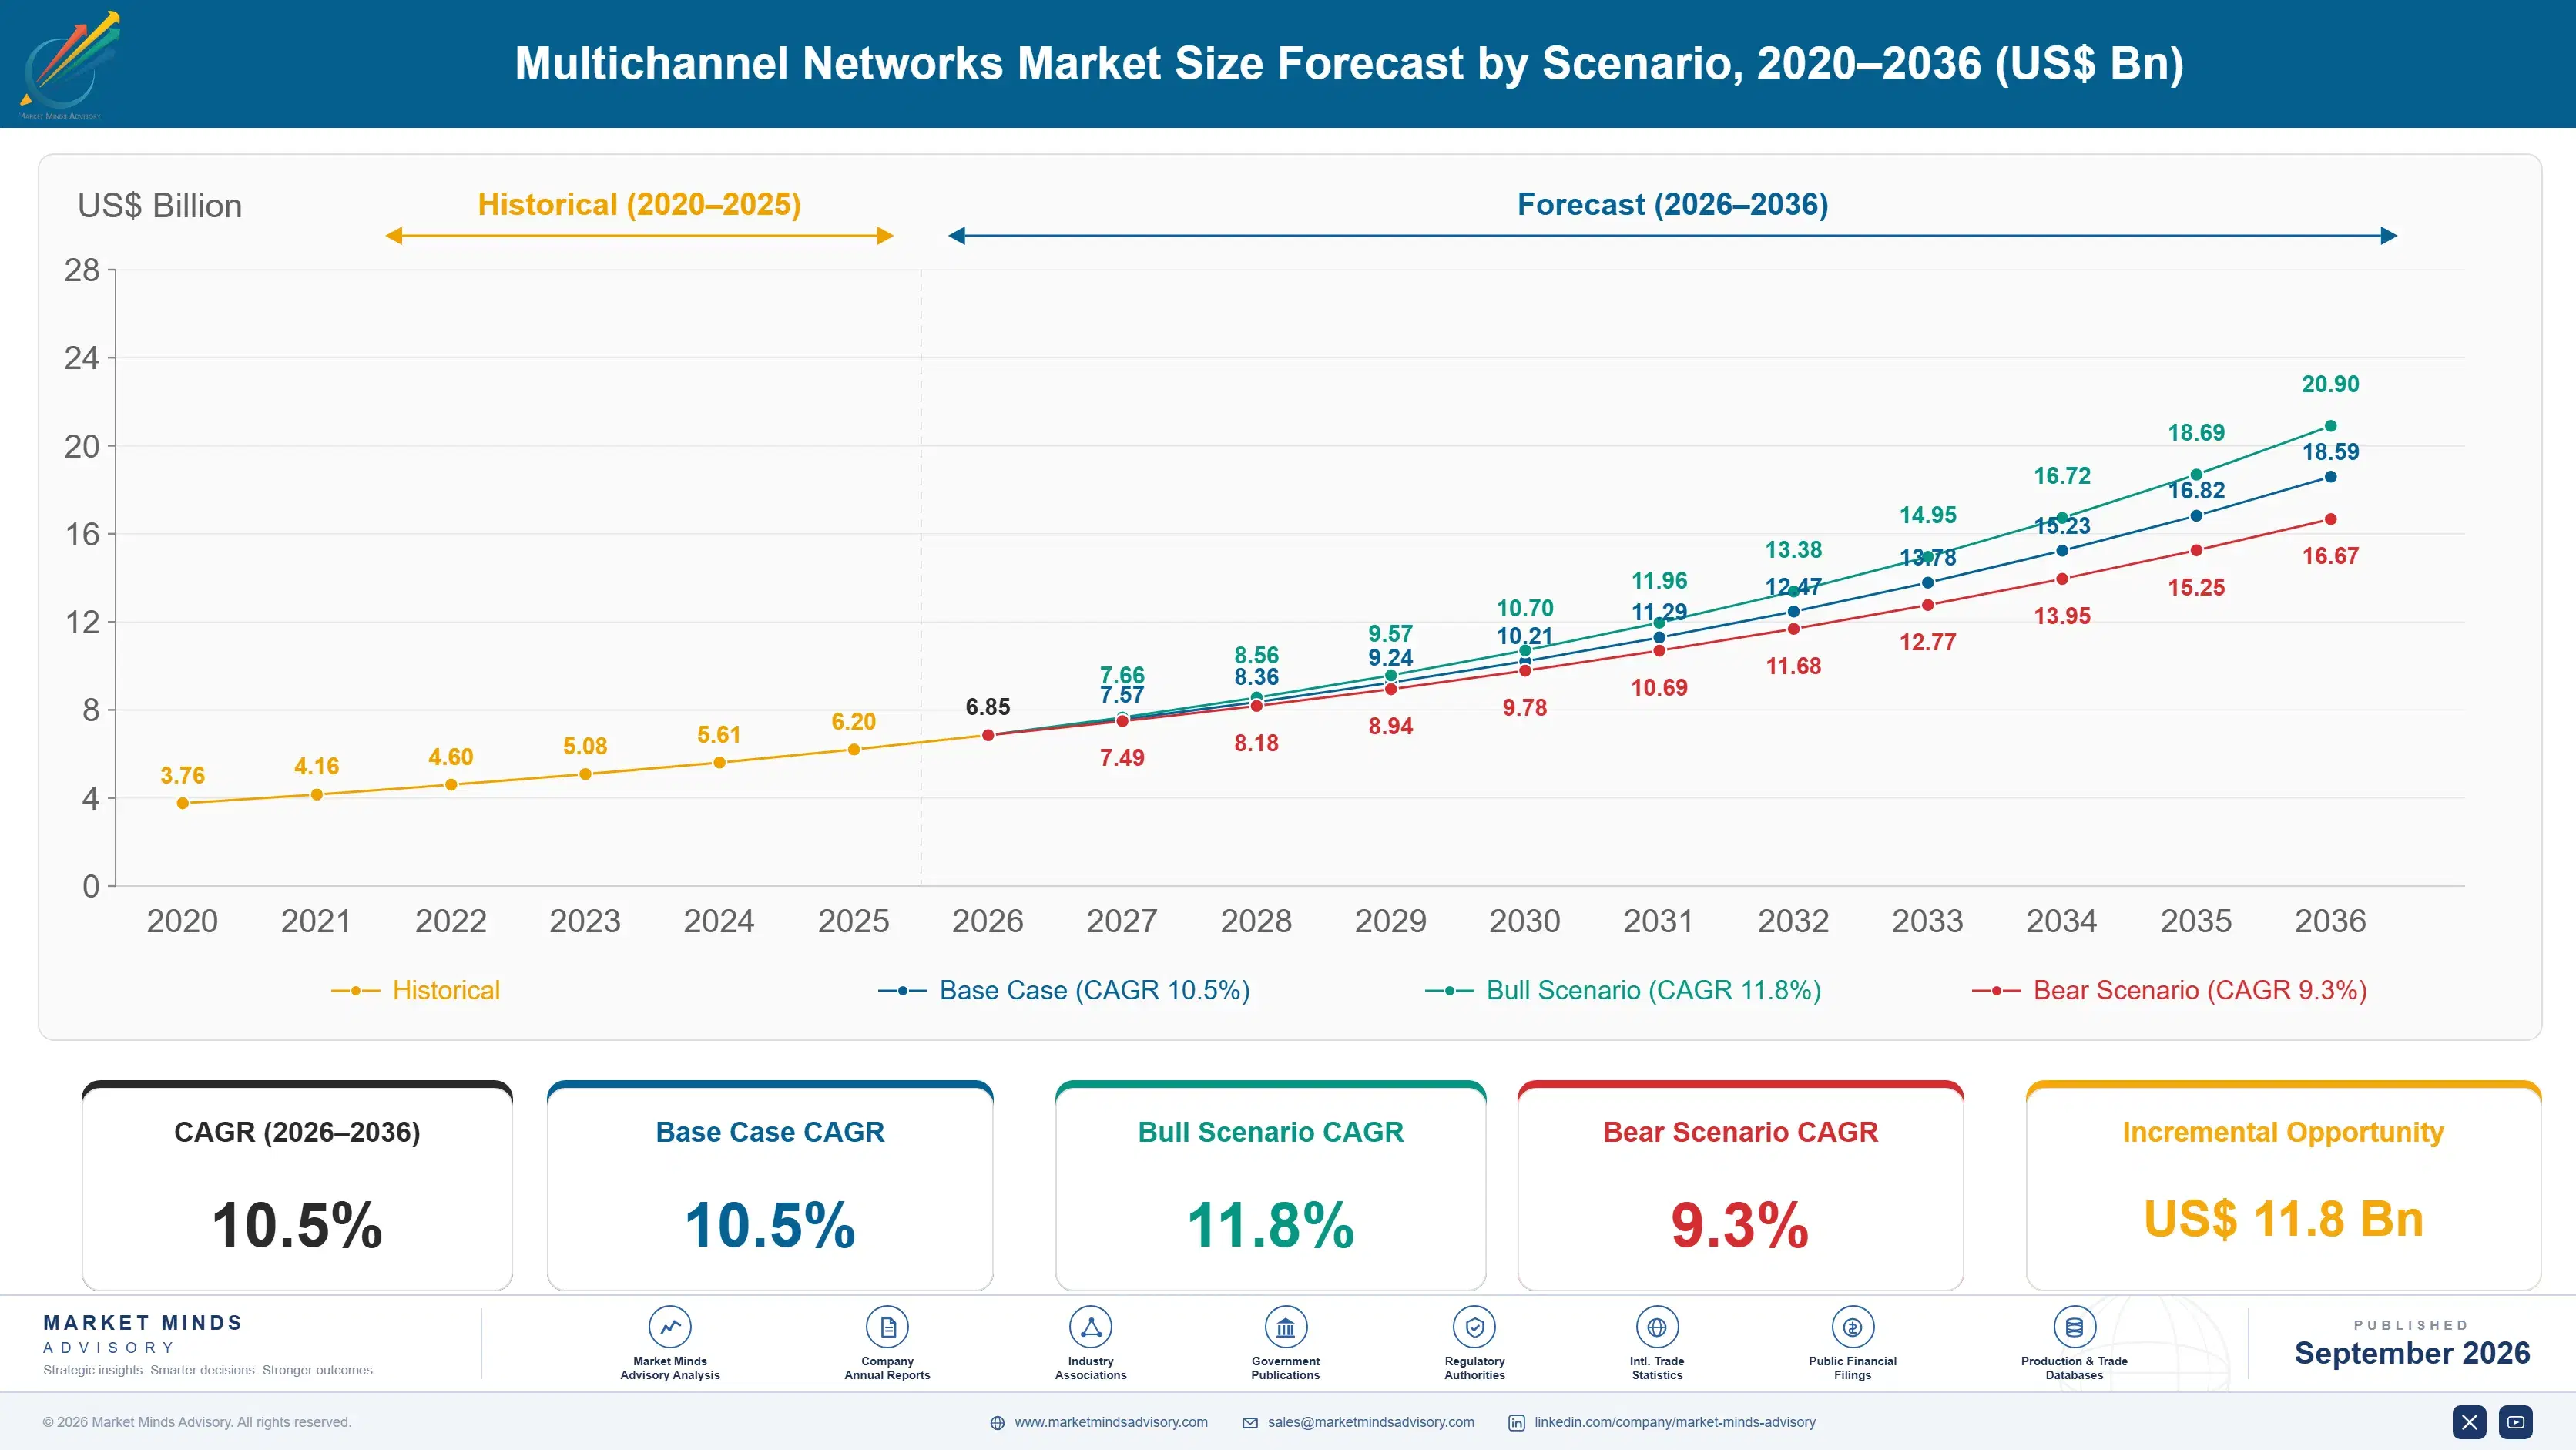
Between 2020 and 2025 the category compounded at 9.4%, and the composition changed far more than the total did. Advertising revenue share collapsed as a proposition once platforms offered creators direct terms and better analytics than any network provided. What grew instead was production services, brand management and rights ownership, all of which give a network something it can hold.
The base case holds 10.5% on three mechanisms. Rights ownership keeps expanding because content that a network owns generates revenue across whichever platform pays well in a given year. Brand partnership management keeps growing as advertisers move budget toward creators and find they cannot manage hundreds of individual relationships. And creator economies across Southeast Asia, India and Latin America keep scaling in markets where organised representation barely existed five years ago.
The bull case at 11.8% assumes platform monetisation terms tighten enough that creators need commercial partners again, which would restore leverage networks lost years ago. The bear case at 9.3% is continued disintermediation: every tool that lets a creator manage brand deals, production or merchandise directly removes a service networks currently supply, and those tools keep improving steadily.

What Survived Aggregation

This industry was built on a proposition that stopped being true. Networks aggregated creators who had no way to monetise, negotiate or reach advertisers alone, and took a share of advertising revenue for solving that. Platforms then offered creators direct terms, better analytics and easier payouts, and the proposition evaporated. Advertising revenue share now accounts for only around 18% of network revenue and keeps falling.
TOP FIVE CONCENTRATION31%Low and falling as creators become considerably harder to retain
CREATOR RETENTION PERIOD22 monthsTypical time before a creator leaves or renegotiates network terms
ADVERTISING SHARE REVENUE18%Portion of network revenue from platform advertising splits alone
OWNED RIGHTS SHARE27%Network revenue from content whose rights it actually holds
BRAND DEAL TAKE RATE22%Typical network share on managed brand partnership arrangements
CREATOR ROSTER SIZE340 creatorsMedian managed roster across established network operators today
What replaced it is ownership rather than intermediation. Around 27% of network revenue now comes from content whose rights the network actually holds, which generates income regardless of which platform is paying well this year and cannot be renegotiated away by a creator with better options. Rights ownership and catalogue licensing grows at 15.8% against 10.5% for the market, and it is the only part of this business with genuine durability.
Retention explains most of the rest. A creator stays with a network around 22 months before leaving or renegotiating, which is far too short to justify heavy investment in anybody who is purely a revenue share relationship. Networks have responded by offering production, brand management and commerce services a creator cannot easily replicate, and by owning content wherever they can negotiate it.
"The uncomfortable truth is that these businesses solved a problem the platforms then solved better and for free. What survived is the parts that look like a production company or a rights holder. The parts that look like an aggregator are worth roughly what aggregation is worth now, which is very little."
Director, Creator Economy and Digital Media Practice · MMA Technology Practice · September 2026

Market Trends

Rights Ownership Replaces Revenue Share As The Model

Around 27% of network revenue now comes from content whose rights the network genuinely holds, up considerably from a business that once ran almost entirely on advertising splits. Owned content generates income across whichever platform pays well in a given year and cannot be renegotiated away by a creator who has found better terms elsewhere. Rights ownership and catalogue licensing grows at 15.8% against 10.5% for the market. That shift converts these businesses from intermediaries into something closer to production companies with libraries. Libraries accumulate where contracts simply expire on somebody else's decision.
Market Impact: Networks take 22% on partnerships

Advertising Revenue Share Keeps Declining As A Proposition

Platform advertising splits now generate only around 18% of network revenue, down from being essentially the whole business a decade ago, because platforms offer creators direct terms and better analytics than any network ever supplied. The root proposition, that creators needed somebody to monetise on their behalf, stopped being true and has not become true again. Networks still relying on that revenue have very little to defend when a creator with 340 peers on the same roster starts asking questions. Nothing has restored that leverage and nothing looks likely to.
Market Impact: Indonesia compounds at 17.4% yearly

Market Opportunities and Growth Drivers

Advertisers Cannot Manage Hundreds Of Creator Relationships

Brand budgets keep moving toward creators, and an advertiser working with dozens of them discovers that contracting, briefing, approving and measuring each relationship individually is genuinely unmanageable at any scale. Networks take around 22% on managed brand partnerships for solving exactly that, and the advertiser rather than the creator is the one who values it. Brand partnership and sponsorship management grows at 12.9% as a result, and it is a service the platforms have shown no interest in providing themselves. Agencies are now competing directly for exactly the same work.
Market Impact: Advertising share fell to 18%

Creator Economies Scale In Newly Organised Markets

Indonesia compounds at 17.4%, faster than any other market, on a creator economy that has scaled enormously in a country where organised representation barely existed five years ago. India, Brazil and the Philippines follow broadly similar patterns at slightly different speeds. Networks entering those markets find creators who genuinely need commercial support rather than creators who have already learnt they can manage without it, which is a considerably better starting position than any mature market offers. Acquisition terms in those markets remain considerably more favourable than anything available in mature ones. Live commerce is also more developed there.
Market Impact: Creators stay only 22 months

Market Restraints and Challenges

Direct Tools Keep Removing Services Networks Supply

Every tool that lets a creator manage brand deals, commission production or run merchandise directly removes a service networks currently charge for, and those tools keep improving without any network being consulted about it. The root cause is that most network services are coordination rather than capability, and coordination is exactly what software replaces. Commercially this erodes the offer continuously. Mitigation runs through rights ownership, which no tool substitutes for, and through production capability requiring capital and craft a creator cannot easily assemble alone. Every improvement in creator tooling narrows what remains chargeable.
Market Impact: Owned rights reach 27% of revenue

Creator Retention Is Too Short For Heavy Investment

A creator stays around 22 months before leaving or renegotiating, which is far too short a horizon to justify significant investment in anybody the network does not own content with. The root cause is that creators hold the audience relationship and networks hold nothing much beyond a contract. Commercially this caps what any network will spend developing talent. Mitigation runs through rights participation in what gets made, through multi-year production commitments, and through services creators cannot readily replace elsewhere. Recruitment spending frequently fails to recover before the creator departs elsewhere. Roster growth accumulates churn rather than any durable asset.
Market Impact: Advertising share falls to 18%
4 additional market trends, 3 additional growth drivers, and 2 additional restraints and challenges are covered in the full report. Contact sales@marketmindsadvisory.com to access the complete intelligence.

Segment CAGR and Growth Architecture

Segmentation follows revenue class, since each carries different durability, different exposure to disintermediation and a different party who actually values it. Six classes cover the market, spanning rights ownership, brand partnership management, production services, audience development, commerce enablement and advertising revenue administration. Creator tier and geographic market are separate dimensions handled elsewhere in this report.
multichannel-networks-market-market-share-analysis-1789996499134

Rights Ownership And Catalogue Licensing

Rights ownership and catalogue licensing grows at 15.8%, half again the market rate of 10.5%, because owned content generates revenue whichever platform happens to be paying well in a given year and cannot be renegotiated away by a creator who has found better terms somewhere else. Around 27% of network revenue now comes from content the network genuinely holds rights in, up from a business that once ran almost entirely on advertising splits. This is the only part of the model with real durability, and it converts these businesses into something closer to production companies with libraries than to intermediaries. Acquisition costs have risen sharply as creators learnt what participation is worth.
CAGR 15.8%

Brand Partnership And Sponsorship Management

Brand partnership and sponsorship management compounds at 12.9% because advertisers rather than creators are the ones who genuinely value it. An advertiser working with dozens of creators finds that contracting, briefing, approving and measuring each relationship individually is unmanageable at any real scale, and networks take around 22% for solving exactly that problem. Platforms have shown no interest in providing this service themselves, which makes it considerably more defensible than anything built on advertising splits. The commercial catch is that agencies are moving into the same territory with existing advertiser relationships. Advertiser relationships rather than creator relationships determine who wins this work, which is a considerable change from how the category originally operated.
CAGR 12.9%
Full segment breakdown across 6 segments available in the complete report.

Regional Architecture and Country Demand Map

East Asia holds 29% of network revenue, ahead of every other region, on creator economies operating at genuine commercial scale right across China, Japan and South Korea. North America follows at 24% on established networks and on the largest advertiser budgets found anywhere in the world.

East Asia

East Asia takes 29% of network revenue, the largest regional share, on creator economies that operate at a scale and commercial maturity nowhere else quite matches. Chinese creator management runs through domestic platforms with entirely different commercial arrangements from Western ones, which separates that portion of the market almost completely. Japanese and South Korean networks work closely with entertainment industries where rights ownership was always the normal expectation rather than an innovation. Commerce enablement is considerably more developed here than anywhere else. Growth at 11.6% sits above the global rate on commerce and rights rather than advertising. Rights expectations here were always considerably firmer than in Western markets. Domestic arrangements dominate the Chinese portion.
Share: 29% | CAGR: 11.6% (2026 to 2036)

North America

Twenty-four percent of network revenue reaches North America, where the largest advertiser budgets and the most established networks both sit. Creators here learnt earliest that platforms would deal with them directly, which collapsed the aggregation proposition sooner and pushed networks toward production and rights faster than elsewhere. Studio71, BroadbandTV, Collab and Jellysmack all operate significant businesses from this region. Talent agencies compete directly for brand partnership management using existing advertiser relationships. Growth at 9.9% sits marginally below the global rate on a market that already went through its correction. Rights acquisition began earlier here and costs correspondingly more today. Agencies compete aggressively for the brand work. The correction here arrived earliest of anywhere.
Share: 24% | CAGR: 9.9% (2026 to 2036)
Regional intelligence for 5 additional markets available in the complete report: Western Europe, South Asia and Pacific, Latin America, Middle East and Africa, Eastern Europe. Contact sales@marketmindsadvisory.com.
multichannel-networks-market-country-cagr-analysis-1789996499657

What Networks Can Still Charge For

Aggregation stopped being valuable the moment that platforms began dealing with creators directly, creator retention now runs well under two years, and every single coordination service these networks provide is steadily being replaced by a tool that somebody else built. The four levers below follow those conditions rather than any argument about creator relationships.

Own Rights Rather Than Taking Percentages

Around 27% of network revenue now comes from content whose rights the network genuinely holds, and that revenue arrives regardless of which platform pays well this year or whether a creator renegotiates. Advertising splits at 18% of revenue can be taken away by anybody with better options and frequently are. Networks investing in owned formats, catalogue and production rights are building something durable. Those still optimising revenue share terms are defending a position that has been eroding steadily for the better part of a decade. Libraries accumulate while percentages simply do not.
Market Impact: Owned rights now generate fully 27% of revenue

Sell To Advertisers Rather Than To Creators

An advertiser working with dozens of creators finds contracting, briefing, approving and measuring each relationship individually unmanageable, and networks take around 22% for solving exactly that coordination problem. The advertiser values it far more than the creator does, and platforms have shown no interest in providing the service themselves. Networks positioning their offer to creators are selling to the party with the most alternatives available. Those positioning to advertisers are selling to the party actually holding the budget. Agencies have noticed exactly the same thing and are moving in with existing advertiser relationships already in place.
Market Impact: Brand deals now carry a 22% take rate

Enter Markets Before Creators Learn Independence

Indonesia compounds at 17.4% on a creator economy that scaled before any organised representation existed to serve it, and India, Brazil and the Philippines follow similar patterns. Creators in those markets genuinely need commercial support rather than having already learnt they can manage without it. That is a fundamentally better starting position than any mature market offers, where the aggregation proposition collapsed years ago. Networks concentrating on established markets are competing where the value proposition has already been thoroughly tested and found wanting. Entry terms deteriorate quickly once creators learn independence.
Market Impact: Indonesia alone compounds at 17.4% every single year

Build Capability Rather Than Coordination Services

Most network services are coordination, and coordination is precisely what software replaces, which is why every new creator tool removes something networks charge for. Production capability requiring capital, craft and crew is genuinely different, because a creator cannot assemble it alone at 22 months of network tenure. Networks offering scheduling, reporting and negotiation support are supplying services that will be automated. Those offering studios, production teams and format development are supplying something considerably harder to replicate. Studios, crew and format development cost real capital, which is precisely what makes them defensible against the tooling. Coordination never was.
Market Impact: Creator retention now runs only 22 months typically

Who Controls the Margin Pool

Five networks hold just 31% of managed creator and network revenue, and that concentration keeps falling as creators become steadily harder to retain across a market with more alternatives every year. Studio71, BroadbandTV, Collab, Yoola and Jellysmack lead. All participants here are assessed on managed creator and network revenue rather than on any broader media or production business they also operate. Concentration has fallen steadily across every year we have measured it.
Competition runs on rights participation and production capability rather than on revenue share terms, which creators now negotiate against multiple bidders and platforms undercut entirely. The second dimension is advertiser relationships, because brand partnership management is valued by the advertiser rather than the creator, and talent agencies with existing advertiser relationships compete directly for exactly that work.

Pressure comes from platforms dealing with creators directly and from creator tools replacing coordination services, both of which erode the offer rather than competing with it. Rankings shift where creator economies are newly organising rather than in mature markets, particularly across Indonesia, India and Brazil. Rights acquisition terms in those newly organising markets remain considerably more favourable than anything available in mature ones today.
multichannel-networks-market-company-positioning-matrix-1789996500219

Competitive Moat and Risk Dimensions

JELLYSMACK

Moat: Format And Distribution Capability

Jellysmack built capability in adapting content across platforms and formats, which is genuine production work rather than coordination and which a creator cannot easily replicate alone. That capability generates value the creator can measure directly in audience reach beyond their original platform. Building comparable capability requires production infrastructure and format knowledge accumulated across many creators rather than any contractual arrangement.
JELLYSMACK

Risk: Creator Retention Exposure

Creators stay around 22 months on average and hold the audience relationship throughout, so capability delivered without rights participation benefits somebody who may leave. Investment in a creator who departs transfers entirely to whoever they join next. Defending against that requires owning rights in what gets produced rather than merely producing it well.
STUDIO71

Moat: Owned Content Library Position

Studio71 built a position around owning rights in content rather than administering revenue shares, which generates income across platforms regardless of creator movement or platform terms. Around 27% of category revenue now comes from owned rights and that share keeps rising. A library accumulates and cannot be renegotiated away, which is the only genuinely durable asset available in this business.
STUDIO71

Risk: Acquisition Cost Escalation

Creators have learnt what rights participation is worth and negotiate accordingly, so acquiring rights costs considerably more than it did when networks held more leverage. Building a library now requires capital against uncertain content performance. The strategy is correct and the entry price has risen substantially since the networks that own libraries began building them.

Players Tracked

Prominent Players

Studio71
BroadbandTV
Collab
Yoola
Jellysmack

Other Key Players

Night Media
Whalar
Viral Nation
Underscore Talent
Wasserman
Creative Artists Agency
Influential
Billion Dollar Boy
Digitas
Socialyte
Fullscreen
Mediakraft Networks
Webedia
MCN Asia
Chocomedia

Recent Developments

FEBRUARY 2025

Networks Expand Owned Content Rights Positions

Several multichannel networks expanded positions in content where they hold the underlying rights rather than administering revenue shares, a commercial repositioning rather than any single transaction. Owned content generates revenue across whichever platform pays well in a given year and cannot be renegotiated away by a creator finding better terms.
Signal: A content library accumulates while any revenue share arrangement can simply be renegotiated away entirely instead.
SEPTEMBER 2024

Talent Agencies Extend Into Brand Partnership Management

Established talent agencies extended creator brand partnership management using existing advertiser relationships, a commercial expansion rather than any acquisition. Networks take around 22% on managed partnerships, and the advertiser rather than the creator is the party that genuinely values the coordination those arrangements actually provide.
Signal: Agencies already hold exactly the advertiser relationships that make brand partnership management so genuinely valuable here.
JUNE 2025

Indonesian Creator Economy Scales Ahead Of Representation

Indonesian creator populations scaled substantially across video and live commerce platforms ahead of any organised representation developing to serve them, a market development rather than any corporate transaction. Networks entering those markets find creators who genuinely need commercial support rather than creators who have already learnt to manage entirely alone.
Signal: Entering before creators learn independence is a far better commercial position than any mature market offers.

What Running A Network Costs

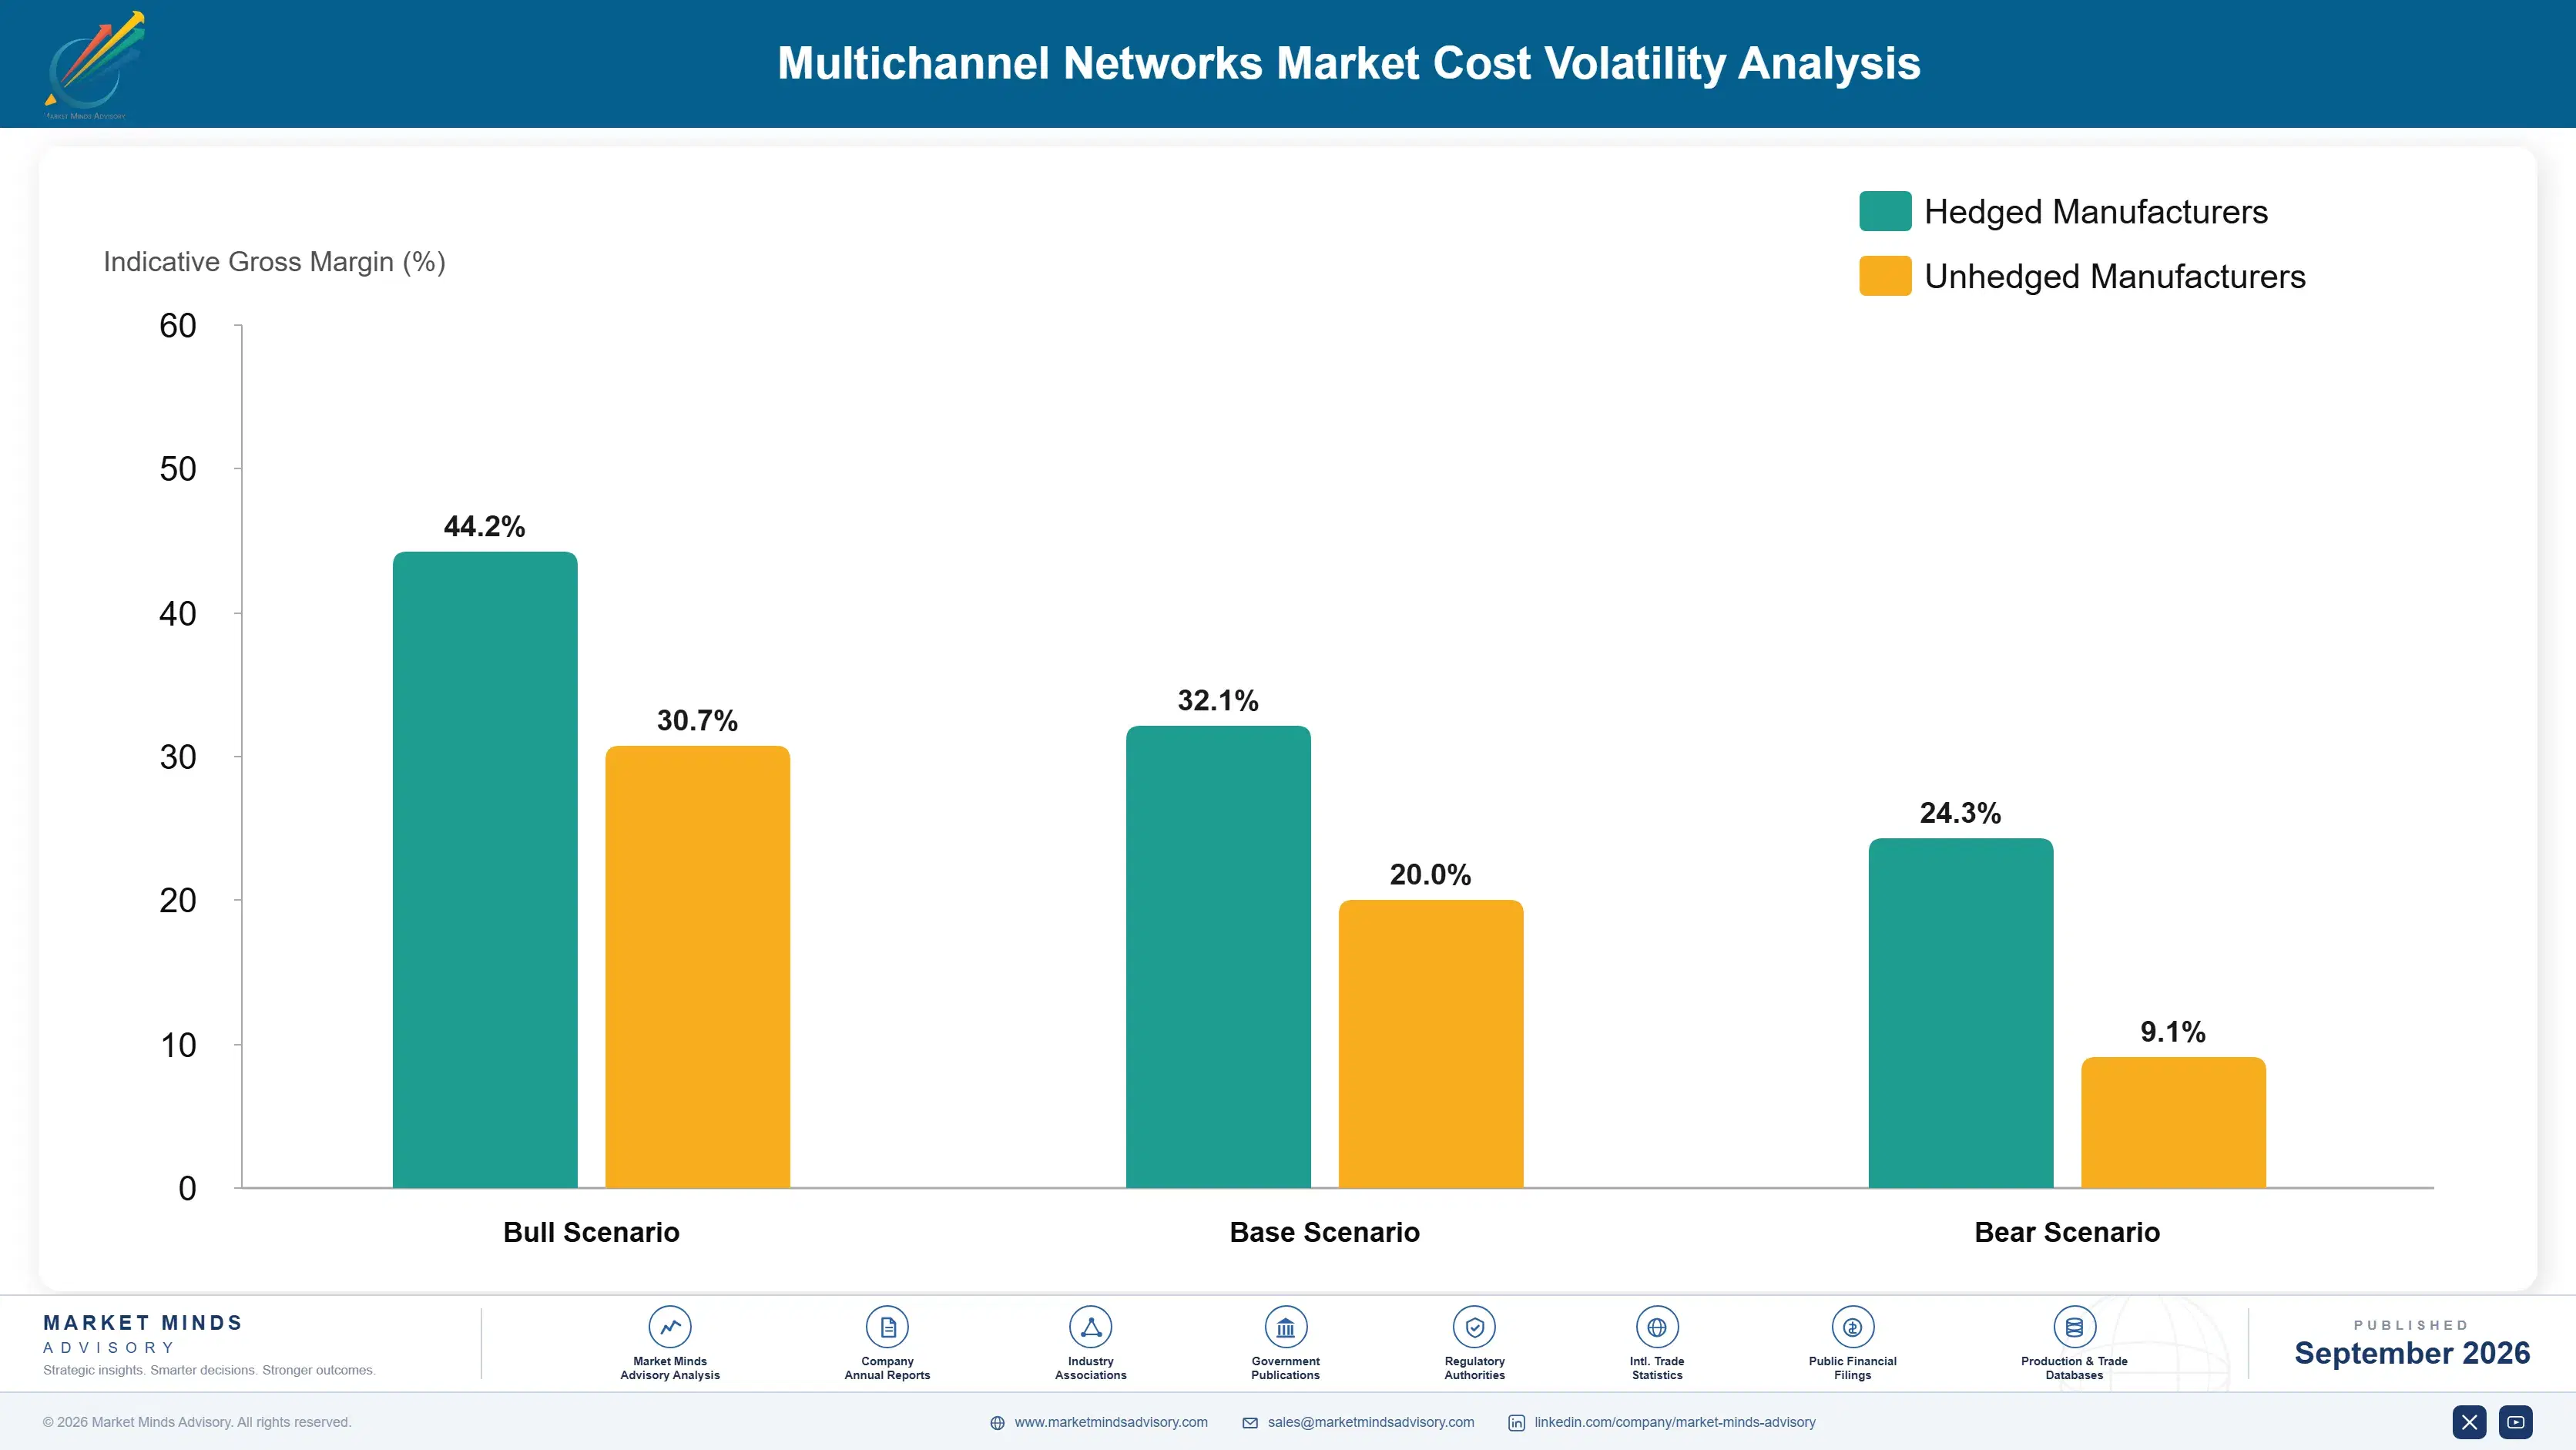
Creator payments and revenue share obligations absorb roughly 58% of network cost, which is the dominant line and rises whenever creator leverage improves. Production and content services take around 16% for networks operating studios and crews. Rights acquisition absorbs about 13% and has risen sharply, with sales and advertiser servicing taking most of the remaining balance across a people-heavy operation.
Creator acquisition costs rose materially through 2023 and 2024 as competition for established creators intensified and as those creators learnt what rights participation was actually worth. Warner Bros Discovery Annual Report 2024 and Publicis Groupe Annual Report 2024 both record talent and content acquisition cost as principal operating variables across creator and content operations. Networks with existing rights libraries absorbed that pressure considerably better than those still building.

The competitive disadvantage mechanism is rights acquisition timing rather than ongoing cost. A network that built a library when creator leverage was lower carries a cost base competitors cannot now replicate at any price. Exposure concentrates among networks entering rights ownership late, whose acquisition costs reflect creators who fully understand what they are giving up and who negotiate accordingly on every single deal.
multichannel-networks-market-cost-volatility-analysis-1789996500419

Acquire Rights In Newly Organising Creator Markets

Rights acquisition absorbs roughly 13% of cost and has risen sharply as creators learnt what participation is worth. Markets where creator economies scaled before organised representation appeared offer acquisition terms that mature markets no longer do. Indonesia compounds at 17.4% and creators there genuinely need commercial support, which changes the negotiation considerably in the network's favour.

Shift Cost From Revenue Share Into Production

Creator payments absorb roughly 58% of cost and rise whenever creator leverage improves, which it keeps doing. Production capability costs money once and generates value across many creators rather than scaling with each individual relationship. Networks whose cost base is almost entirely revenue share have no operational leverage at all when creator terms move against them.

Build Advertiser Servicing As Scalable Capability

Advertiser servicing sits inside the remaining cost balance and scales with the number of brand relationships rather than with creator count. Building it as repeatable capability rather than as account management headcount converts a linear cost into something that improves with volume. Most networks staff advertiser servicing entirely by headcount and never examine the alternative.

Portfolio Architecture for Margin Defence

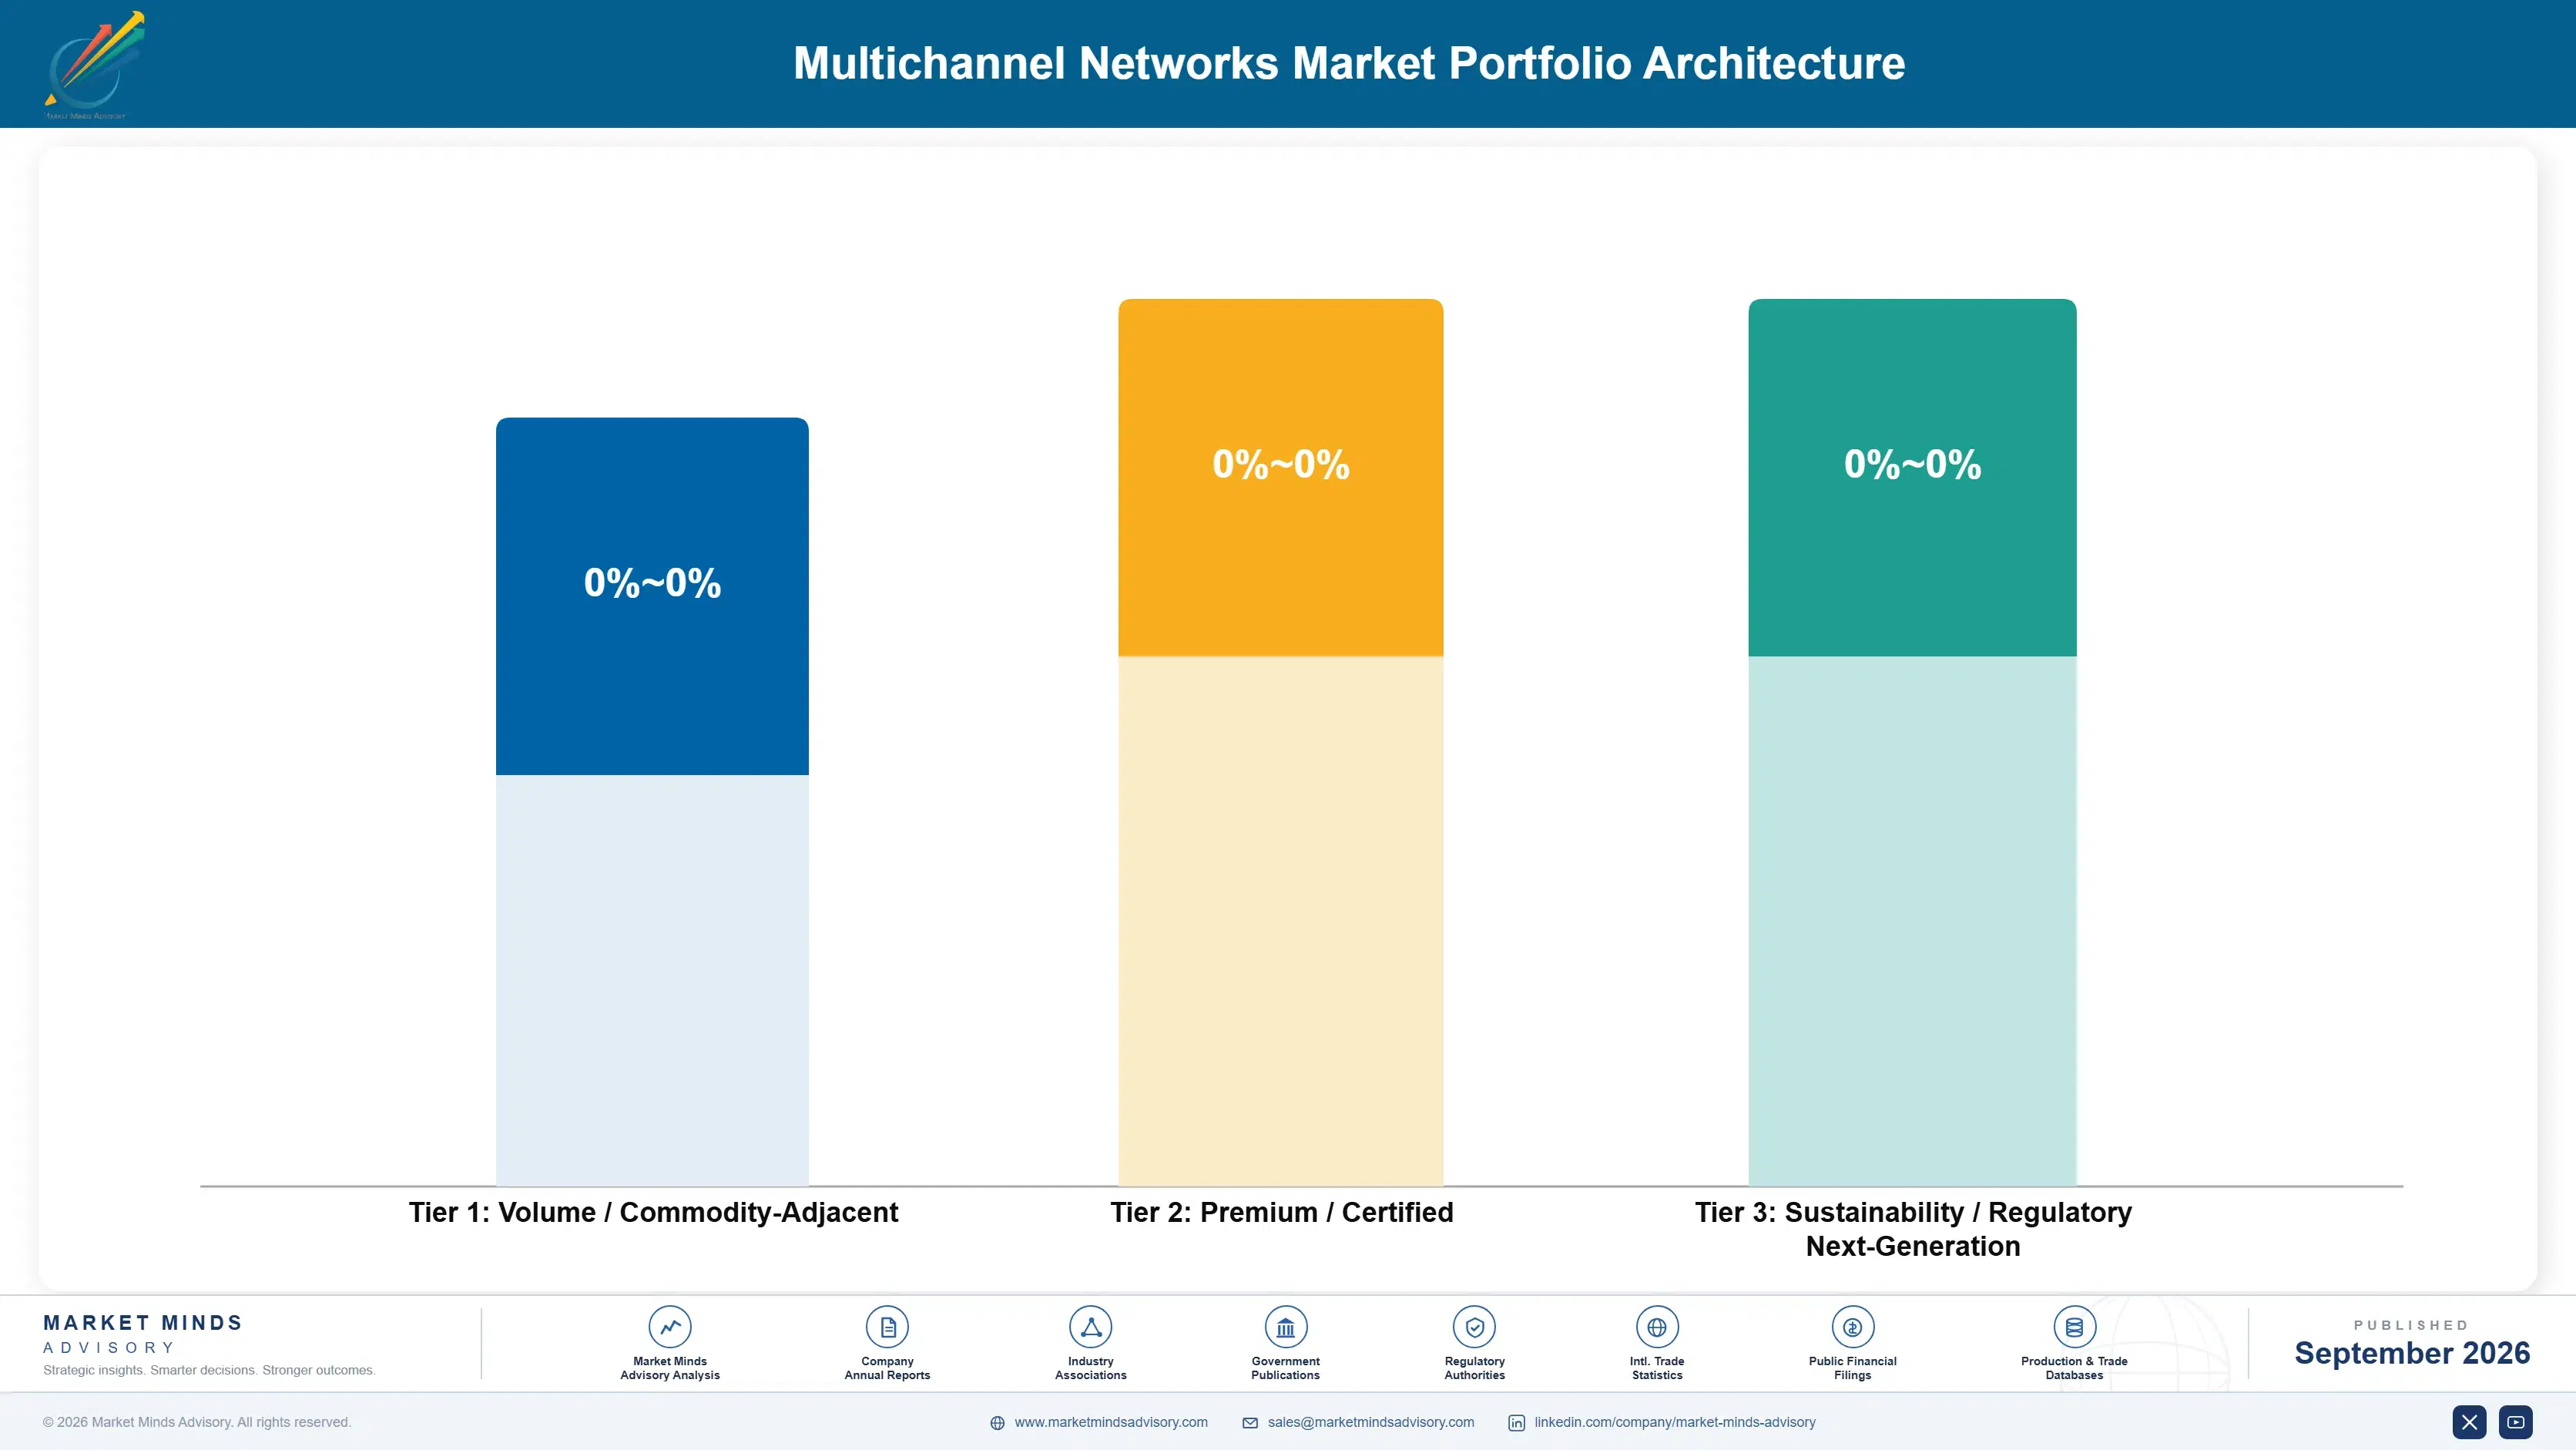
Margin architecture separates on whether the network owns anything. Advertising revenue share administration earns least, since it is pure intermediation on terms platforms set and creators can renegotiate. Audience development sits above on service content. Rights ownership, production services and brand partnership management earn most, because each involves either an owned asset or capability a creator genuinely cannot replicate alone at reasonable cost.
The volume versus premium tension runs between roster size and rights depth. A large roster generates administration revenue at thin margin and constant churn against 22 month retention. A rights library generates income without any creator relationship needing to persist at all. Networks optimising roster growth are accumulating churn rather than assets, which is why several have quietly stopped reporting creator counts.

High-value pools concentrate in rights ownership and in production capability, and neither is reached through creator relationship management. Rights require capital and negotiating position that has deteriorated as creators learnt their worth. Production requires studios, crew and format knowledge. Both are genuinely difficult and expensive, which is precisely why they remain valuable while aggregation has not. Neither accumulates quickly and neither can be bought at yesterday's prices any more.

Volume / Commodity-Adjacent

Advertising revenue share administration and basic channel operations, which is pure intermediation on terms platforms set and creators can renegotiate at will. The ten point spread separates networks with efficient administration from those carrying account management headcount against declining revenue.
Gross Margin: 12% to 22%

Premium / Certified

Audience development, channel operations and commerce enablement services, where genuine capability and cross-market reach determine value alongside price. The fourteen point spread tracks how much of a network's service is actual capability against how much is coordination that software will eventually replace.
Gross Margin: 28% to 42%

Sustainability / Regulatory / Next-Generation

Rights ownership and catalogue licensing, production services and brand partnership management, each involving an owned asset or capability that a creator genuinely cannot replicate alone. The eighteen point spread reflects library depth and production capability, neither of which accumulates quickly.
Gross Margin: 48% to 66%
multichannel-networks-market-portfolio-architecture-1789996500950

High-value Sub-segments and Strategic Watch-out

Rights Ownership And Catalogue Licensing

Grows at 15.8% because owned content generates revenue whichever platform pays well and cannot be renegotiated away. The eighteen point spread reflects library depth. Around 27% of network revenue now comes from content the network genuinely holds rights in. Acquisition costs have risen sharply since.
Gross Margin: 48% to 66%

Brand Partnership And Sponsorship Management

Grows at 12.9% because advertisers rather than creators genuinely value the coordination it provides across many relationships. The eighteen point spread reflects advertiser relationship depth. Networks take around 22% on managed partnerships, and agencies now compete directly. Platforms show no interest at all in providing it.
Gross Margin: 48% to 66%

Production And Content Services

Grows at 11.7% on capability requiring studios, crew and format knowledge that a creator cannot assemble alone. The eighteen point spread reflects production infrastructure depth. It is capability rather than coordination, which is why software has not replaced it. Capital and craft both matter considerably here.
Gross Margin: 48% to 66%

Advertising Revenue Share Administration

Grows at 3.2%, slowest of the six revenue classes, on pure intermediation that platforms and creators have both learnt to route around. The ten point spread reflects administration efficiency. It now generates only around 18% of network revenue and keeps falling. Nothing suggests that decline will reverse.
Gross Margin: 12% to 22%

What Actually Holds Creators

The annuity here is rights rather than any relationship, which is an uncomfortable conclusion for a business built on relationships. A creator stays around 22 months and holds the audience throughout, so nothing about the relationship persists once they leave. Content the network owns rights in keeps generating revenue afterwards regardless. Networks that understood this early hold libraries; those that did not hold contracts that expire on somebody else's decision.
Depth varies enormously by what the network actually provides. A rights position in produced content is permanent and transfers nothing to a departing creator. Production capability holds creators who genuinely cannot replicate it, particularly those working in formats requiring crew and studio access. Revenue share administration holds nobody at all, and creators leave the moment somebody offers marginally better terms or a platform improves its direct arrangements.

The paying party has moved from creator to advertiser across the most valuable service. A creator evaluates whether the network's share is worth what it provides and increasingly concludes otherwise. An advertiser evaluates whether managing dozens of individual creator relationships is feasible and concludes firmly that it is not. Networks positioning everything toward creators are selling to the party holding all the alternatives.
multichannel-networks-market-end-use-penetration-index-1789996501477

What Networks Should Now Own

These are among the four positions where our research anticipates prominent divergence between winners and laggards over the coming forecast period. Each is grounded in the demand model, the regulatory perimeter, and the announced capacity pipeline.
01 / RIGHTS POSITION BUILDING

Own Content Rather Than Taking Percentages

Around 27% of network revenue now comes from content whose rights the network genuinely holds, and that revenue arrives regardless of which platform pays well this year or whether any particular creator renegotiates their terms. Advertising splits at 18% of revenue can be taken away by anybody holding better options, and frequently are taken away without much warning. Networks investing in owned formats, catalogue and production rights are building the only genuinely durable asset available here, and nothing else in this business survives a creator departure at all.
02 / ADVERTISER SIDE POSITIONING

Sell To Whoever Actually Holds Budget

An advertiser working with dozens of creators finds that contracting, briefing, approving and measuring each relationship individually is genuinely unmanageable at any real scale, and networks take around 22% for solving exactly that coordination problem. The advertiser values that considerably more than the creator does, and platforms have shown no interest at all in providing the service themselves. Networks positioning their whole offer toward creators are selling to the party with the most alternatives, while those positioning to advertisers sell to whoever actually controls the budget.
03 / EARLY MARKET ENTRY

Arrive Before Independence Becomes Obvious

Indonesia compounds at 17.4% on a creator economy that scaled before any organised representation existed to serve it, and India, Brazil and the Philippines all follow broadly similar patterns behind it. Creators in those markets genuinely need commercial support rather than having already learnt that they can manage perfectly well without it. That is a fundamentally better starting position than any mature market now offers, where the aggregation proposition collapsed years ago, and acquisition terms there remain considerably more favourable than anywhere mature.
04 / CAPABILITY OVER COORDINATION

Supply What Software Cannot Replace

Most network services are coordination rather than capability, and coordination is precisely what software replaces, which is exactly why every new creator tool removes something these networks currently charge for. Production capability requiring capital, craft and crew is genuinely different, because a creator cannot assemble it alone within 22 months of average network tenure. Networks offering scheduling, reporting and negotiation support are supplying services that will be automated soon enough, because capability requiring capital survives where pure coordination reliably does not.

Engagement Snapshot From the Field

A live engagement with an industry participant carrying material or product regulatory and market exposure ahead of a defining policy shift, showing how our research translates into a defensible multi-year portfolio strategy.
MARKET MINDS ADVISORY · CLIENT ENGAGEMENT SUMMARY
Multichannel Networks Producer Strategic Portfolio Review and Transition Roadmap 2026·Investment Scenario on Multichannel Networks Exposure Evaluation 2025-26
CLIENT PROFILE
An independent network managing several hundred creators across three separate language markets, with revenue heavily weighted toward platform advertising splits. Creator churn had risen for three consecutive years and margin had compressed steadily alongside it. Management believed the answer was simply recruiting more creators onto the roster in order to replace those departing every single quarter.
STRATEGIC CHALLENGE
Commercial leadership wanted to expand the roster aggressively and had budgeted recruitment accordingly. Finance observed that each additional creator generated declining revenue at rising acquisition cost. Nobody had separated revenue by source or measured what proportion came from anything the network actually owned rather than administered on somebody else's behalf.
MMA APPROACH
MMA separated revenue by class across three years, distinguishing advertising splits from brand partnerships, production services and any owned rights. We measured creator tenure and lifetime contribution by cohort, and assessed what proportion of services the network provided could be replaced by tools creators could obtain directly. Work drew on 47 expert interviews conducted in Q4 2025 with networks, creators and advertisers.
KEY FINDINGS
  1. Advertising splits generated close to 7 in 10 of revenue while contributing a considerably smaller share of gross margin than management had assumed.
  2. Median creator tenure had fallen below two years, which meant recruitment spending rarely recovered its cost before the creator departed to somebody else entirely.
  3. The network held rights in almost nothing at all that it had helped produce across several years of production work (client-reported, unverified by MMA).
  4. Brand partnership revenue carried much the strongest margin, and the advertiser relationships behind it were held personally by two individuals who could leave.
CLIENT PROFILE
An independent network managing several hundred creators across three separate language markets, with revenue heavily weighted toward platform advertising splits. Creator churn had risen for three consecutive years and margin had compressed steadily alongside it. Management believed the answer was simply recruiting more creators onto the roster in order to replace those departing every single quarter.
STRATEGIC CHALLENGE
Commercial leadership wanted to expand the roster aggressively and had budgeted recruitment accordingly. Finance observed that each additional creator generated declining revenue at rising acquisition cost. Nobody had separated revenue by source or measured what proportion came from anything the network actually owned rather than administered on somebody else's behalf.
MMA APPROACH
MMA separated revenue by class across three years, distinguishing advertising splits from brand partnerships, production services and any owned rights. We measured creator tenure and lifetime contribution by cohort, and assessed what proportion of services the network provided could be replaced by tools creators could obtain directly. Work drew on 47 expert interviews conducted in Q4 2025 with networks, creators and advertisers.
KEY FINDINGS
  1. Advertising splits generated close to 7 in 10 of revenue while contributing a considerably smaller share of gross margin than management had assumed.
  2. Median creator tenure had fallen below two years, which meant recruitment spending rarely recovered its cost before the creator departed to somebody else entirely.
  3. The network held rights in almost nothing at all that it had helped produce across several years of production work (client-reported, unverified by MMA).
  4. Brand partnership revenue carried much the strongest margin, and the advertiser relationships behind it were held personally by two individuals who could leave.
RECOMMENDED STRATEGY
Phase 1: Phase one: stop roster expansion entirely and redirect recruitment budget toward acquiring rights positions in content the network already helps produce. Phase 2: Phase two: institutionalise the advertiser relationships currently held by two individuals, since those generated the strongest margin in the whole business. Phase 3: Phase three: exit the purely administrative revenue share arrangements entirely, where the network contributed nothing that any creator actually valued.
OUTCOME
The network halted roster expansion and began acquiring rights positions in produced content instead (client-reported, unverified by MMA). Margin improved measurably within a year despite lower creator counts. Revenue is now reported by class rather than in aggregate, which made the underlying problem visible and kept it that way.

Frequently Asked Questions

Foundational context covering the market sizes, CAGR, scope, country, region and competition that inform every finding below. This section is provided to cover basics and most often pre-purchase conversations, answered from the MMA Primary Research Dataset.

What is the current size of the Multichannel Networks Market?

Global value reaches USD 6.9 billion in 2026, measured as managed creator and network revenue across six revenue classes. The 2025 base is USD 6.2 billion.

How large will the Multichannel Networks Market be by 2036?

The market reaches USD 18.7 billion by 2036, an increase of USD 11.8 billion across the forecast period. That represents 2.71 times expansion from the 2026 base.

What is the CAGR for the Multichannel Networks Market 2026 to 2036?

The base case runs at 10.5% annually, with a bull case at 11.8% if platform monetisation tightens enough that creators need partners again and a bear case at 9.3% if direct tools keep improving.

Which segment is growing fastest?

Rights ownership and catalogue licensing grows at 15.8%, half again the market rate of 10.5%. Owned content generates revenue whichever platform happens to be paying well.

Who are the major companies in the Multichannel Networks Market?

Studio71, BroadbandTV, Collab, Yoola and Jellysmack lead on managed creator and network revenue, together holding 31%. Night Media, Whalar and Viral Nation hold smaller positions.

Which country is growing fastest?

Indonesia leads at 17.4%, on a creator economy that scaled before any organised representation existed to serve it. India and Brazil both follow behind it.

Report Segmentation Architecture

The full report scope spans multiple orthogonal segmentation dimensions, with cross-tabulated demand data provided for each dimension pair. Coverage extends further to regional breakdowns, trend trajectories, and the competitive detail needed to support segment-level decision-making.

By Revenue Class

  • Rights Ownership And Catalogue Licensing
  • Brand Partnership And Sponsorship Management
  • Production And Content Services
  • Merchandising And Commerce Enablement
  • Audience Development And Channel Operations
  • Advertising Revenue Share Administration

By End-Use Industry

  • Consumer Brand Advertising
  • Gaming And Interactive Entertainment
  • Beauty And Personal Care
  • Food And Beverage Marketing
  • Consumer Electronics Promotion
  • Financial Services Communications

By Commercial Dimension

  • Direct Creator Representation
  • Advertiser Managed Campaign Services
  • Rights Acquisition And Co-Production
  • Platform Partnership Programmes
  • Regional Network Affiliation
  • Commerce And Live Selling Enablement

By Region

  • North America
  • Western Europe
  • East Asia
  • South Asia and Pacific
  • Latin America
  • Middle East and Africa
  • Eastern Europe

Scope, Methodology, and Coverage

Every figure in this report is reproducible from documented input assumptions. The scope below maps the historical period, the forecast horizon, the segmentation dimensions, and the countries covered, alongside the underlying primary and qualitative methodology.
Historical Period
2020 to 2025
Forecast Period
2026 to 2036
Base Year
2025 (USD billions; MMA Primary Research Dataset, September 2026)
Market Definition
This report covers multichannel network businesses by revenue class: rights ownership and catalogue licensing, brand partnership and sponsorship management, production and content services, audience development and channel operations, merchandising and commerce enablement, and advertising revenue share administration. It excludes talent agencies representing individuals without channel operations, video platforms and hosting infrastructure, advertising technology, music labels, and traditional television production companies.
Quantitative Units
USD millions, managed creator and network revenue basis; managed creator counts; creator retention in months; revenue by class as a percentage; brand partnership take rates as a percentage.
Segmentation Dimensions
Revenue class; advertiser category served; commercial representation and partnership route; geography across seven regions.
Regions Covered
North America, Western Europe, East Asia, South Asia and Pacific, Latin America, Middle East and Africa, Eastern Europe
Countries Covered
China, Japan, South Korea, Indonesia, India, Philippines, Thailand, Australia, United States, Canada, Mexico, Brazil, Colombia, United Kingdom, Germany, France, Spain, Poland, United Arab Emirates, Nigeria.
Key Companies Profiled
Studio71, BroadbandTV, Collab, Yoola, Jellysmack, Night Media, Whalar, Viral Nation, Underscore Talent, Wasserman, Influential, Billion Dollar Boy, Fullscreen, Mediakraft Networks, Webedia.
Quantitative Methodology
Primary survey, n=3,800 respondents, Q4 2025, six countries; demand-side model with trade association cross-validation
Qualitative Methodology
47 expert interviews, Q4 2025; applied to validate demand model assumptions, identify emerging dynamics, and assess competitive positioning
Report Format
PDF and XLSX data workbook (Word format preview document)
Publisher
Market Minds Advisory
Report Code
MMA-2026-TEC-841
Published
September 2026
Contact
sales@marketmindsadvisory.com | www.marketmindsadvisory.com

Purchase the full Multichannel Networks Market Report (2026 to 2036).

This report sizes the global multichannel networks market from 2026 to 2036 across six revenue classes, six advertiser categories and seven regions. It explains why aggregation stopped being valuable once platforms dealt with creators directly, with advertising revenue share now generating only around 18% of network revenue. Rights ownership at roughly 27% of revenue is analysed as the only genuinely durable position available in this business. Creator retention at around 22 months is examined as the constraint that caps what any network will invest in talent. Regional analysis explains why East Asia leads at 29% of network revenue.
Six revenue classes sized through to 2036
Rights ownership quantified against advertising share decline
Creator retention assessed as an investment constraint
Twenty named networks assessed on managed revenue
Four revenue levers with quantified commercial impact
Anonymised independent network model engagement documented in full

Built For The People Who Decide

From boardroom strategy to bench-side execution, this report is read cover-to-cover by leaders shaping the next decade of their industry, turning demand scenarios, market dynamics and valuation benchmarks into decisions.
CXOs/ Presidents/ VPs/ Managers
M&A and Corporate Development
Strategy Teams and R&D Heads
Procurement and Product Directors
Regulatory and Compliance Leaders
Investor Relations and Equity Analysts