Market Minds Advisory
Multi Colored LED Beads Market

Multi Colored LED Beads Market: Multi Colored LED Beads Market: Package Constructions, Binning Economics and Regional Capacity 2026 to 2036

Chinese packaging houses took this category and never gave it back. Competition runs on colour consistency and binning yield now, because everybody can build the package and almost nobody can bin it well.

Lead Analyst

Published

September 2026

Make Smarter Decisions with Customized Research Insights

Request a free sample report and evaluate market opportunities, growth trends, and competitive dynamics relevant to your business needs.

2025 MARKET VALUE$4.6BMarket Size 2025
2036 FORECAST VALUE$11.6BBase Case , 2026 to 2036
CAGR 2026 TO 20368.8 %Bull 10.0% / Bear 7.6%
INCREMENTAL OPPORTUNITY$6.6BNet 10- year value creation
EXPANSION MULTIPLE2.32x2036 value over 2026 base
Strategic Levers
M&A Pipeline
Regional Outlook
Country Rankings
Competitive Intelligence
Segmental Deep-dive
Call-Us : 91 93563 13602

Executive Snapshot and Market Trajectory.

Multi colour LED beads are a commodity with an uncommodity problem. Anyone can package red, green and blue emitters into one housing. Getting a million of them to produce the same colour at the same drive current is where the money and the failures both are found.
The market reaches USD 5.00 billion in 2026 and USD 11.62 billion by 2036, a 2.32 times expansion at 8.8%. Mini LED RGB packages grow at 13.2%, half again the market rate of 8.8%, driven by fine pitch display walls and backlight zoning. East Asia holds 58% of value, and China alone accounts for roughly 74% of global packaged output. That concentration has been tightening, not loosening. Nobody outside Asia has added capacity since 2019.
Five suppliers hold only 42% of value, which is unusually fragmented for a component category this mature. Nichia and ams OSRAM defend the top on patent position and colour consistency rather than on cost. Below them sit a dozen Chinese packaging houses competing at average selling prices near USD 0.06 per bead. Phosphor cost runs around 22% and rare earth pricing is not theirs to control.
Market Definition
This report covers multi colour LED beads: packaged light emitting diode components containing two or more independently addressable emitter colours in a single housing, including RGB, RGBW and tunable white packages. It excludes single-colour LED packages, bare LED die and wafers, finished luminaires and display panels, LED driver integrated circuits sold separately, and the phosphor and substrate materials supplied into packaging.
Base Year Value
$4.6B in 2025 (MMA Primary Research Dataset, September 2026)
Forecast Period
2026 to 2036, eleven discrete annual values
CAGR
8.8% base case. Bull 10.0%. Bear 7.6%.
Fastest Growth Segment
Mini LED RGB Packages: 13.2% CAGR
Fastest Growth Country
India: 12.4% CAGR
Fastest Growth Region
South Asia and Pacific: 11.0% CAGR
Largest Region
East Asia: 58% of 2025 global value
Market Leaders
Nichia, ams OSRAM, Seoul Semiconductor, Lumileds and Everlight Electronics lead on packaged unit shipments. Source: MMA Analysis.
Primary Survey
n=3,800 procurement and R&D decision-makers, Q4 2025, six countries
Methodology
Demand-side build-up, cross-validated against public data, 47 expert interviews

Multi Colored LED Beads Market Forecast Scenarios

multi-colored-led-beads-market-size-forecast-scenario-1788455014868
Between 2020 and 2025 the category compounded at 7.4%, which understates how disruptive the period was. Decorative and signage demand collapsed through 2020 and recovered fast. Then fine pitch display walls pulled mini LED volumes up sharply from 2022, while general lighting demand for colour packages went nowhere. The average selling price fell throughout, so unit growth ran well ahead of value growth.
The base case holds 8.8% on three mechanisms. Fine pitch display walls keep migrating to smaller pixel pitches, and each halving of pitch quadruples the bead count per square metre. Automotive ambient lighting has become a specification feature rather than an option, which puts multi colour packages into vehicles that never had them. And horticultural lighting buys tunable spectrum packages on yield evidence rather than on preference, which makes that demand considerably less discretionary than most lighting applications.
The bull case at 10.0% assumes micro LED display production reaches volume before 2032, which would multiply bead counts again. The bear case at 7.6% is price: Chinese capacity additions outrun demand, average selling prices fall faster than unit growth compensates, and the category grows in volume while shrinking in value for two or three years.

Why Binning Decides Who Makes Money

A multi colour LED bead is three or four emitter dice, a phosphor layer where white is involved, a housing and wire bonds. None of that is difficult. What is difficult is that the human eye detects colour differences the specification sheet calls identical, and a display wall built from two colour bins looks wrong from across the room. Binning yield at 82% is therefore the number that separates a profitable packaging house from a busy one.
TOP FIVE CONCENTRATION42%Unusually fragmented for a component category this mature
AVERAGE SELLING PRICEUSD 0.06Per packaged bead, falling steadily every single year
TOP PRODUCING COUNTRY SHARE74%China holds the overwhelming majority of packaged output
CAPACITY UTILISATION76%Below comfortable levels across most Chinese packaging houses
COLOUR BINNING YIELD82%Share of output meeting tight colour consistency specifications
PHOSPHOR COST SHARE22%Portion of package cost exposed to rare earth pricing
Pricing tells the rest of the story. Average selling price sits near USD 0.06 per bead and has fallen every year for a decade, which happens when capacity outruns demand and nobody has a defensible difference. Chinese packaging houses added capacity aggressively through the 2010s under provincial subsidy programmes, and utilisation has sat around 76% ever since. That overhang sets the price for everyone.
The exception is patents. Nichia holds foundational positions on phosphor conversion and package construction that have been litigated repeatedly and mostly upheld. That gives the top of the market a floor the volume producers cannot reach, and it explains why concentration sits at 42% rather than dispersing entirely. Patent expiry timing is the most consequential date in this industry.
"Every conversation in this industry eventually becomes a conversation about bins. The suppliers who treat binning as a quality control function lose to the ones who treat it as the product, and that has been true for fifteen years."
Principal Analyst, Optoelectronic Components Practice · MMA Technology Practice · September 2026

Market Trends

Fine Pitch Display Walls Multiply Bead Counts

A display wall at 1.9 millimetre pixel pitch uses roughly a quarter of the beads a 0.9 millimetre wall needs for the same area, and the industry has been halving pitch on a predictable cycle. Control room, broadcast studio and retail installations have all moved down at least one step. The consequence for bead demand is geometric rather than linear: shrinking pitch quadruples the component count per square metre while the installed area also grows. Mini LED RGB packages compound at 13.2% on that arithmetic alone, before any new application appears.
Market Impact: Yield gains of 18% documented

Automotive Ambient Lighting Becomes A Standard Specification

Interior ambient lighting moved from a luxury option to a mid-market expectation over roughly five model cycles, and the content per vehicle rose with it. A premium interior now carries dozens of addressable multi colour packages across door cards, dashboard, footwells and headliner. Automotive qualification means AEC-Q102 compliance, wider temperature range and colour stability over a vehicle life, which the volume packaging houses find harder than they expected. The result is a segment where pricing holds against a category that otherwise deflates every year, and where design wins last a platform.
Market Impact: Raises selling price 3 times

Market Opportunities and Growth Drivers

Horticultural Lighting Buys Spectrum On Yield Evidence

Controlled environment agriculture specifies light by spectrum because crop response to red, blue and far-red ratios is measurable in grams of yield per kilowatt hour. That makes multi colour packages a production input rather than a lighting choice, and it puts the purchasing decision with an agronomist holding trial data. Vertical farms, greenhouse retrofits and cannabis production have all standardised on tunable spectrum fixtures. Demand here holds through lighting market cycles because the buyer is optimising crop economics rather than replacing a fitting, and the switching cost once a recipe is validated is genuinely high.
Market Impact: Prices down 40% since 2019

Addressable Packages Move Control Into The Bead

Integrating a driver into the package lets a single data line address thousands of beads individually, which removes the wiring harness and the external controller that decorative and architectural installations used to need. Installation labour falls sharply and system cost falls with it, even though the bead itself costs more. Entertainment lighting, architectural facades and consumer decorative products have all converted. The commercial effect is that a packaging house selling addressable parts captures value that previously sat with the driver supplier and the installer, which is the only mix shift in this category that raises average selling price.
Market Impact: Phosphor at 22% of cost

Market Restraints and Challenges

Chronic Overcapacity Drives Price Deflation Every Year

Capacity utilisation sits around 76% across Chinese packaging houses and average selling price has fallen every year for a decade. The root cause is provincial subsidy programmes through the 2010s that funded packaging lines on employment and output targets rather than on return, leaving capacity that has no reason to exit. Commercially this transfers the entire benefit of volume growth to buyers. Mitigation is limited and mostly about mix: suppliers moving into automotive-qualified, addressable or horticultural packages escape the deflation, and the ones competing on standard SMD parts do not.
Market Impact: Bead count rises 4 times

Rare Earth Phosphor Pricing Sits Outside Supplier Control

Phosphor accounts for roughly 22% of package cost and depends on europium, yttrium and cerium compounds sourced overwhelmingly from Chinese processing. The root cause is that rare earth separation capacity concentrated in one country over two decades while nobody else found the economics attractive. Price moves and export policy changes therefore land on packaging houses with no hedge available and no substitute chemistry ready. Mitigation is under way but slow: some suppliers are qualifying narrow-band phosphors that use less material per package, and a few are evaluating quantum dot conversion that avoids rare earths entirely.
Market Impact: Content up 60 packages per vehicle
4 additional market trends, 3 additional growth drivers, and 2 additional restraints and challenges are covered in the full report. Contact sales@marketmindsadvisory.com to access the complete intelligence.

Segment CAGR and Growth Architecture

Segmentation follows package construction, since the housing, die count and interconnect method determine which applications a bead can serve and what it costs to make. Six constructions cover the market: mini LED RGB, chip-on-board modules, standard SMD RGB, high-power multi colour, through-hole lamps, and integrated driver addressable packages. Application and channel are treated separately.
multi-colored-led-beads-market-market-share-analysis-1788455015402

Mini LED RGB Packages

Mini LED RGB packages use emitter dice below 200 micron and grow at 13.2%, half again the market rate of 8.8%. Fine pitch display walls are the whole story: as pixel pitch falls, bead count per square metre rises geometrically, and every step down the pitch ladder locks in demand for a smaller package. Manufacturing is where suppliers separate, since placing and bonding dice this small at acceptable yield requires equipment and process control that most packaging houses have not funded. Binning is harder too, because colour variation at small die sizes is wider. Pricing holds better than anywhere else in the category, which is why every Chinese producer of scale is investing here.
CAGR 13.2%

Chip-On-Board Multi Colour Modules

Chip-on-board modules mount bare dice directly onto a substrate under a shared phosphor and encapsulant layer, and they grow at 11.4%. The construction suits high density and high flux applications where discrete packages waste space: horticultural fixtures, stage lighting and architectural floodlighting all specify it. Thermal performance is better because heat leaves through the substrate rather than through a package lead frame. The trade is repairability, since a single failed die means replacing the module. Colour mixing is also more difficult to control across a large emitting area, which is exactly the problem the better suppliers have solved and the volume producers have not. That gap shows up directly in the price each can command.
CAGR 11.4%
Full segment breakdown across 6 segments available in the complete report.

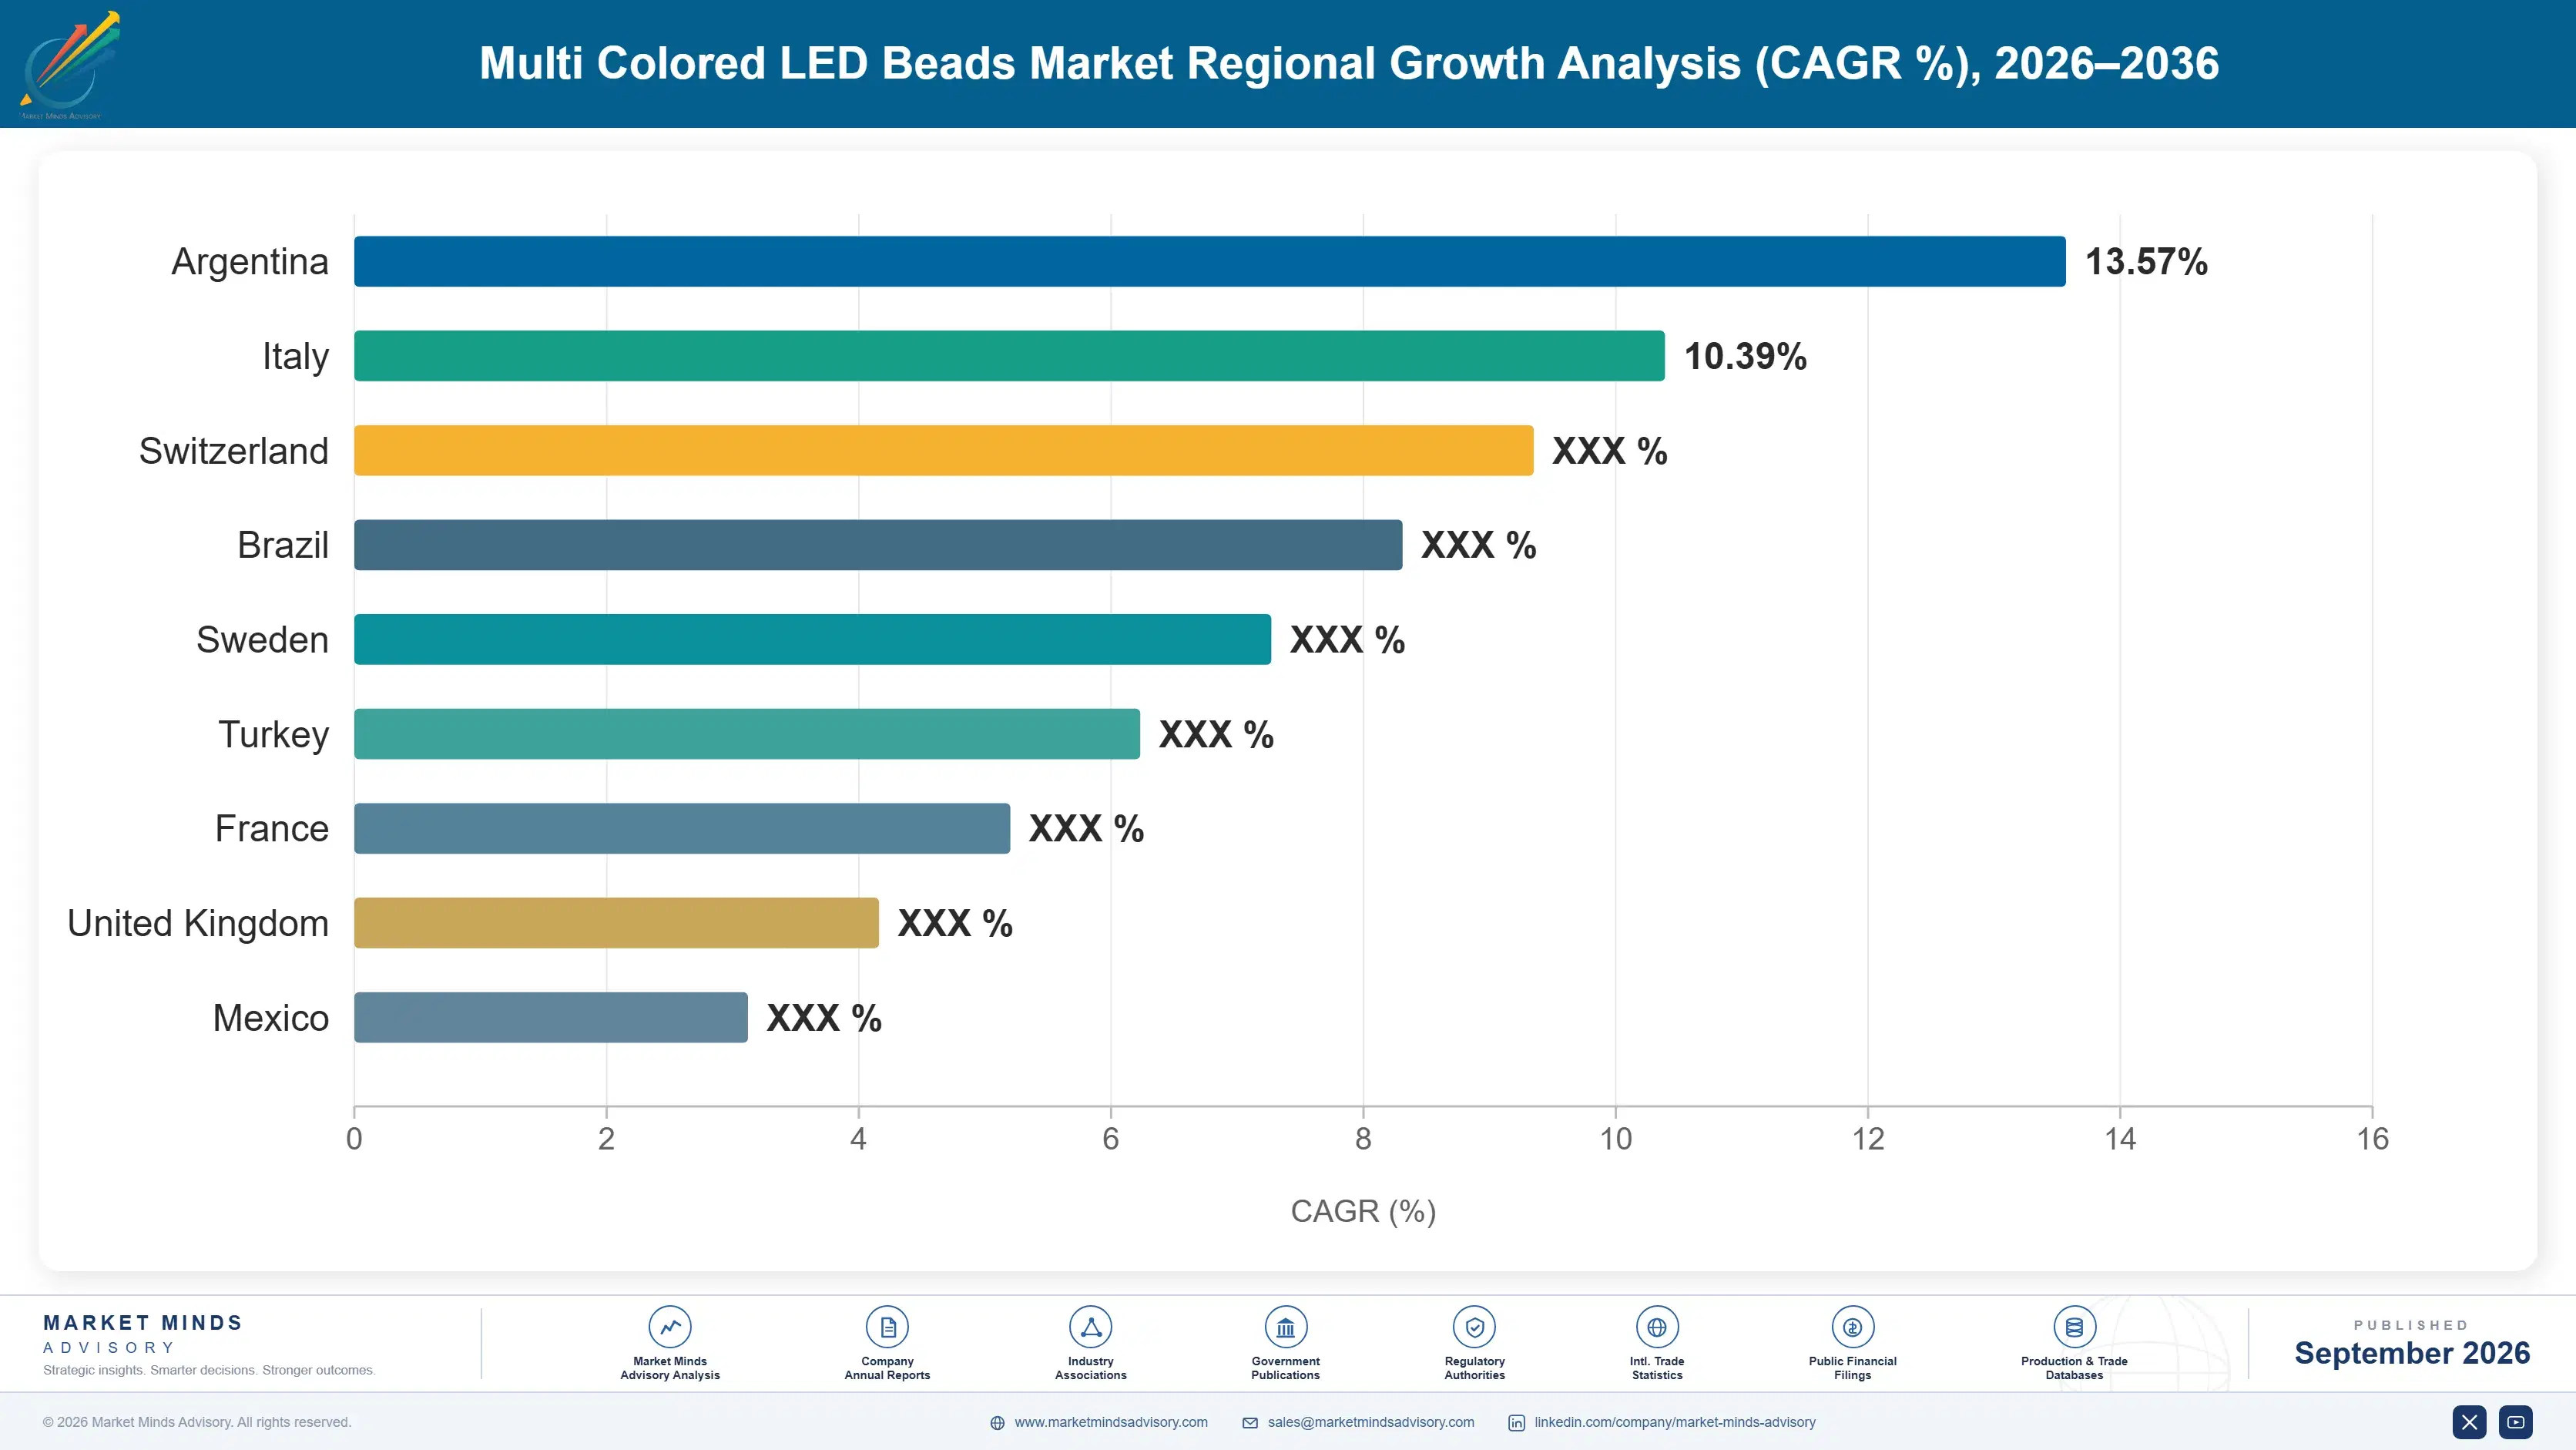
Regional Architecture and Country Demand Map

Value follows packaging capacity, and packaging capacity followed a decade of Chinese provincial subsidy. East Asia takes 58%, far outside the standard band, with China alone responsible for roughly 74% of packaged output. Everywhere else consumes rather than produces. That balance has not shifted in more than a decade.

East Asia

East Asia holds 58% of value, far above the 30% band ceiling, and the concentration is manufacturing rather than consumption. China alone accounts for roughly 74% of packaged bead output through MLS, Nationstar, HongLi Zhihui, Jufei and Refond, most of whose capacity was funded under provincial programmes during the 2010s. Taiwan contributes packaging and chip supply through Ennostar and Lextar. Japan holds the patent position and the highest value packages through Nichia. Korea runs automotive and display-grade output at Seoul Semiconductor and LG Innotek. Growth at 9.6% reflects domestic display wall and automotive demand as much as export volume. No other region has added meaningful packaging capacity since around 2015.
Share: 58% | CAGR: 9.6% (2026 to 2036)

South Asia and Pacific

Growth at 11.0% is the fastest of any region, and India accounts for most of it. Production Linked Incentive support has drawn LED packaging investment into Andhra Pradesh and Gujarat, though the capacity so far handles standard SMD parts rather than mini LED or automotive-qualified output. Domestic demand runs through decorative lighting, signage and a rapidly growing display wall installation base. Australian horticultural operations specify tunable spectrum fixtures at meaningful volume. Southeast Asian electronics assembly consumes beads into products designed elsewhere. The 12% share sits inside the standard band, which no other region in this market manages. Indian packaging capability is improving faster than most observers outside the country expect.
Share: 12% | CAGR: 11.0% (2026 to 2036)
Regional intelligence for 5 additional markets available in the complete report: North America, Western Europe, Latin America, Middle East and Africa, Eastern Europe. Contact sales@marketmindsadvisory.com.
multi-colored-led-beads-market-country-cagr-analysis-1788455015922

How To Escape The Price Deflation

Average selling price falls every year in this category and no supplier can stop it. What a supplier can do is change what it sells, where it sells it, and what it charges for consistency rather than for the component. The four levers below are all mix decisions rather than pricing ones, which is the only route available.

Sell Binning Consistency Rather Than The Component

Binning yield sits around 82% across the industry, and the beads that fall outside a tight bin get sold into applications that tolerate variation at a discount. Display wall integrators pay a premium of 20% to 40% for guaranteed single-bin supply, because a wall built from mixed bins is a warranty claim rather than an installation. Suppliers who invest in measurement, sorting and inventory management to guarantee bin continuity across a project charge for it. Those who ship whatever comes off the line compete on the price of the component, which nobody wins.
Market Impact: Commands a price premium of 20% to 40%

Qualify Packages For Automotive Interior Programmes

Automotive ambient lighting content has risen to dozens of packages per premium vehicle and continues climbing across model cycles. AEC-Q102 qualification, wider temperature range and colour stability across a vehicle life all cost engineering effort that volume packaging houses have avoided. That avoidance is the opportunity: pricing in automotive holds while the rest of the category deflates 40% a decade, and a design win lasts a platform of seven years rather than a purchase order. The cost is a qualification programme measured in quarters and a customer who audits everything.
Market Impact: Adds around 60 packages per premium vehicle sold

Move Into Integrated Driver Addressable Packages

Putting a driver inside the package raises the bead price by roughly 3 times and takes revenue that previously went to the driver supplier and the installer. Entertainment lighting, architectural facades and consumer decorative products have all converted, because a single data line replaces a wiring harness and the installation labour saving exceeds the component premium. The engineering requirement is modest: the driver silicon is available from multiple sources and the packaging change is incremental. What stops most suppliers is that it means selling a system component rather than a commodity part, which their sales organisation is not built for.
Market Impact: Raises the bead price by roughly 3 times

Fund Mini LED Placement Capability Now

Mini LED RGB packages compound at 13.2% against 8.8% for the category, and the barrier is placement equipment capable of handling dice below 200 micron at commercial yield. That capital sits between the packaging houses who have funded it and the ones still deciding, and the gap widens every quarter because process learning compounds. Pricing here holds where standard SMD pricing does not, which makes the payback calculation straightforward. The risk is that everybody at scale is making the same investment, so the window during which this is a differentiated position is finite and already narrowing.
Market Impact: This segment compounds at 13.2% every single year

Who Controls the Margin Pool

Five suppliers hold 42% of packaged unit shipments, which is low for a mature component category and reflects how little of this business is defensible. Nichia sits ahead on patent position and on colour consistency that nobody has matched at volume. ams OSRAM holds second place on automotive qualification depth rather than on cost. Below them the field runs deep and mostly Chinese. All participants here are assessed on packaged unit shipments.
Competition in the volume tiers runs almost entirely on price, and it has for a decade. Chinese packaging houses compete against each other at utilisation levels that make pricing discipline impossible. The interesting competition happens above that: automotive qualification, display-grade binning consistency and mini LED placement capability all separate suppliers in ways the datasheet does not show. Those three areas are where the entire margin in this category currently lives.

Rankings shift as Nichia's foundational patents age and as Chinese suppliers close the binning gap, both of which are happening steadily rather than suddenly. Mini LED placement capability is the near-term separator, and several Chinese producers have funded it faster than the incumbents expected. Micro LED, if it reaches volume, rewrites the supplier list entirely.
multi-colored-led-beads-market-company-positioning-matrix-1788455016448

Competitive Moat and Risk Dimensions

NICHIA

Moat: Foundational Patent Position

Nichia holds foundational patents on phosphor conversion and package construction, litigated across multiple jurisdictions and largely upheld. That position lets the company price above the volume field without competing on cost. It also shapes what competitors can build, since several obvious design approaches remain closed off, and licensing revenue supports research spending nobody else in this category can match.
NICHIA

Risk: Patent Expiry Reduces Protection

The foundational positions are aging, and each expiry opens design space to competitors waiting for it. Nichia's response has been continuous incremental patenting and a shift toward performance advantages that do not depend on legal protection. Whether colour consistency alone sustains the price position once the patent wall thins is the open question, and Chinese suppliers keep closing that gap.
AMS OSRAM

Moat: Automotive Qualification Depth

ams OSRAM has supplied automotive lighting for decades and carries qualification positions across vehicle programmes that take years to establish and last a platform life. Interior ambient lighting content rose steadily across model cycles and the company was already specified. Volume packaging houses attempting to enter face a customer base that changes suppliers reluctantly and audits everything before it does.
AMS OSRAM

Risk: Cost Base Against Asian Competition

European and Malaysian manufacturing carries a cost structure that cannot compete in the volume tiers, which confines the company to applications where qualification or specification protects it. That is a shrinking share of a growing category. Restructuring has narrowed the portfolio repeatedly, and each narrowing reduces the scale across which fixed costs can spread.

Players Tracked

Prominent Players

Nichia
ams OSRAM
Seoul Semiconductor
Lumileds
Everlight Electronics

Other Key Players

MLS Co
Nationstar Optoelectronics
HongLi Zhihui
Jufei Optoelectronics
Refond Optoelectronics
Lextar Electronics
Ennostar
Cree LED
LG Innotek
Bridgelux
Luminus Devices
Kingbright Electronic
Harvatek
Unity Opto Technology
Edison Opto

Recent Developments

JANUARY 2025

Nationstar Expands Mini LED Packaging Capacity In Guangdong

Nationstar Optoelectronics commissioned additional mini LED packaging capacity in Guangdong, an organic expansion funded from operating cash rather than any acquisition or joint venture. The investment targets display wall demand at pixel pitches below one millimetre, where placement capability rather than package cost decides which suppliers can compete.
Signal: Chinese producers are funding mini LED placement capability faster than the incumbent suppliers assumed they would.
AUGUST 2024

ams OSRAM Wins Automotive Ambient Lighting Platform Award

ams OSRAM was selected to supply addressable multi colour packages for an interior ambient lighting system across a European vehicle platform, an award decision rather than a partnership or acquisition. The programme runs from 2026 and covers multiple model variants, with package content rising against the outgoing platform.
Signal: Automotive is where pricing holds in this category, and the awards last a platform rather than a quarter.
MAY 2024

Seoul Semiconductor Releases Narrow-Band Phosphor Package Range

Seoul Semiconductor introduced a package range using narrow-band phosphor formulations that reduce rare earth material content per device while holding colour rendering performance. The release is an organic development, not a licensing arrangement, and it addresses the input cost exposure every packaging house carries on europium and yttrium pricing.
Signal: Reducing phosphor content is the only input cost lever available when the metal pricing sits elsewhere.

What Goes Into A Bead

LED die accounts for roughly 34% of package cost, sourced from chip makers in Taiwan, China and Korea. Phosphor contributes around 22%, dependent on europium, yttrium and cerium compounds processed overwhelmingly in China. Lead frame, substrate and encapsulant together add about 18%, and assembly labour plus test and binning make up the balance. None of those inputs is sourced outside Asia.
ams OSRAM Annual Report 2024 describes the input position directly: rare earth and precious metal pricing moved materially and packaging cost followed with a lag, while selling prices in the volume tiers did not. Nichia's disclosures point to the same phosphor dependency from the other side of the industry. Seoul Semiconductor Annual Report 2024 notes narrow-band phosphor development explicitly as a material cost response rather than as a performance one.

The competitive disadvantage mechanism is geographic rather than operational. A Chinese packaging house buys die, phosphor and substrate domestically at prices a European or American producer pays freight and duty on top of. That gap is worth several points of gross margin before either has made anything. Suppliers outside Asia therefore compete only where qualification, specification or supply origin protects them, which is a narrower field every year.
multi-colored-led-beads-market-cost-volatility-analysis-1788455016644

Qualify Narrow-Band Phosphors To Cut Rare Earth Content

Phosphor sits at 22% of package cost with pricing set by rare earth markets nobody in this industry influences. Narrow-band formulations deliver equivalent colour rendering using materially less europium and yttrium per device, which reduces the exposure permanently rather than hedging it. Qualification takes time and reliability testing is slow, but the saving persists across every subsequent price cycle.

Improve Binning Yield Before Cutting Material Cost

Binning yield at 82% means roughly one bead in six sells at a discount into applications that tolerate colour variation. Better measurement, sorting and process control lift the proportion reaching the premium bin, which is worth more than any material saving available. The investment is metrology equipment and process discipline rather than chemistry, and the payback runs in quarters.

Contract Die Supply Rather Than Buying Spot

LED die runs 34% of package cost and spot pricing swings with chip maker utilisation, which tracks nothing about bead demand. Annual volume agreements with Taiwanese and Chinese chip suppliers smooth that and secure allocation when capacity tightens. The commitment risk is real given this much price deflation, though the alternative is buying at the worst possible moment repeatedly.

Portfolio Architecture for Margin Defence

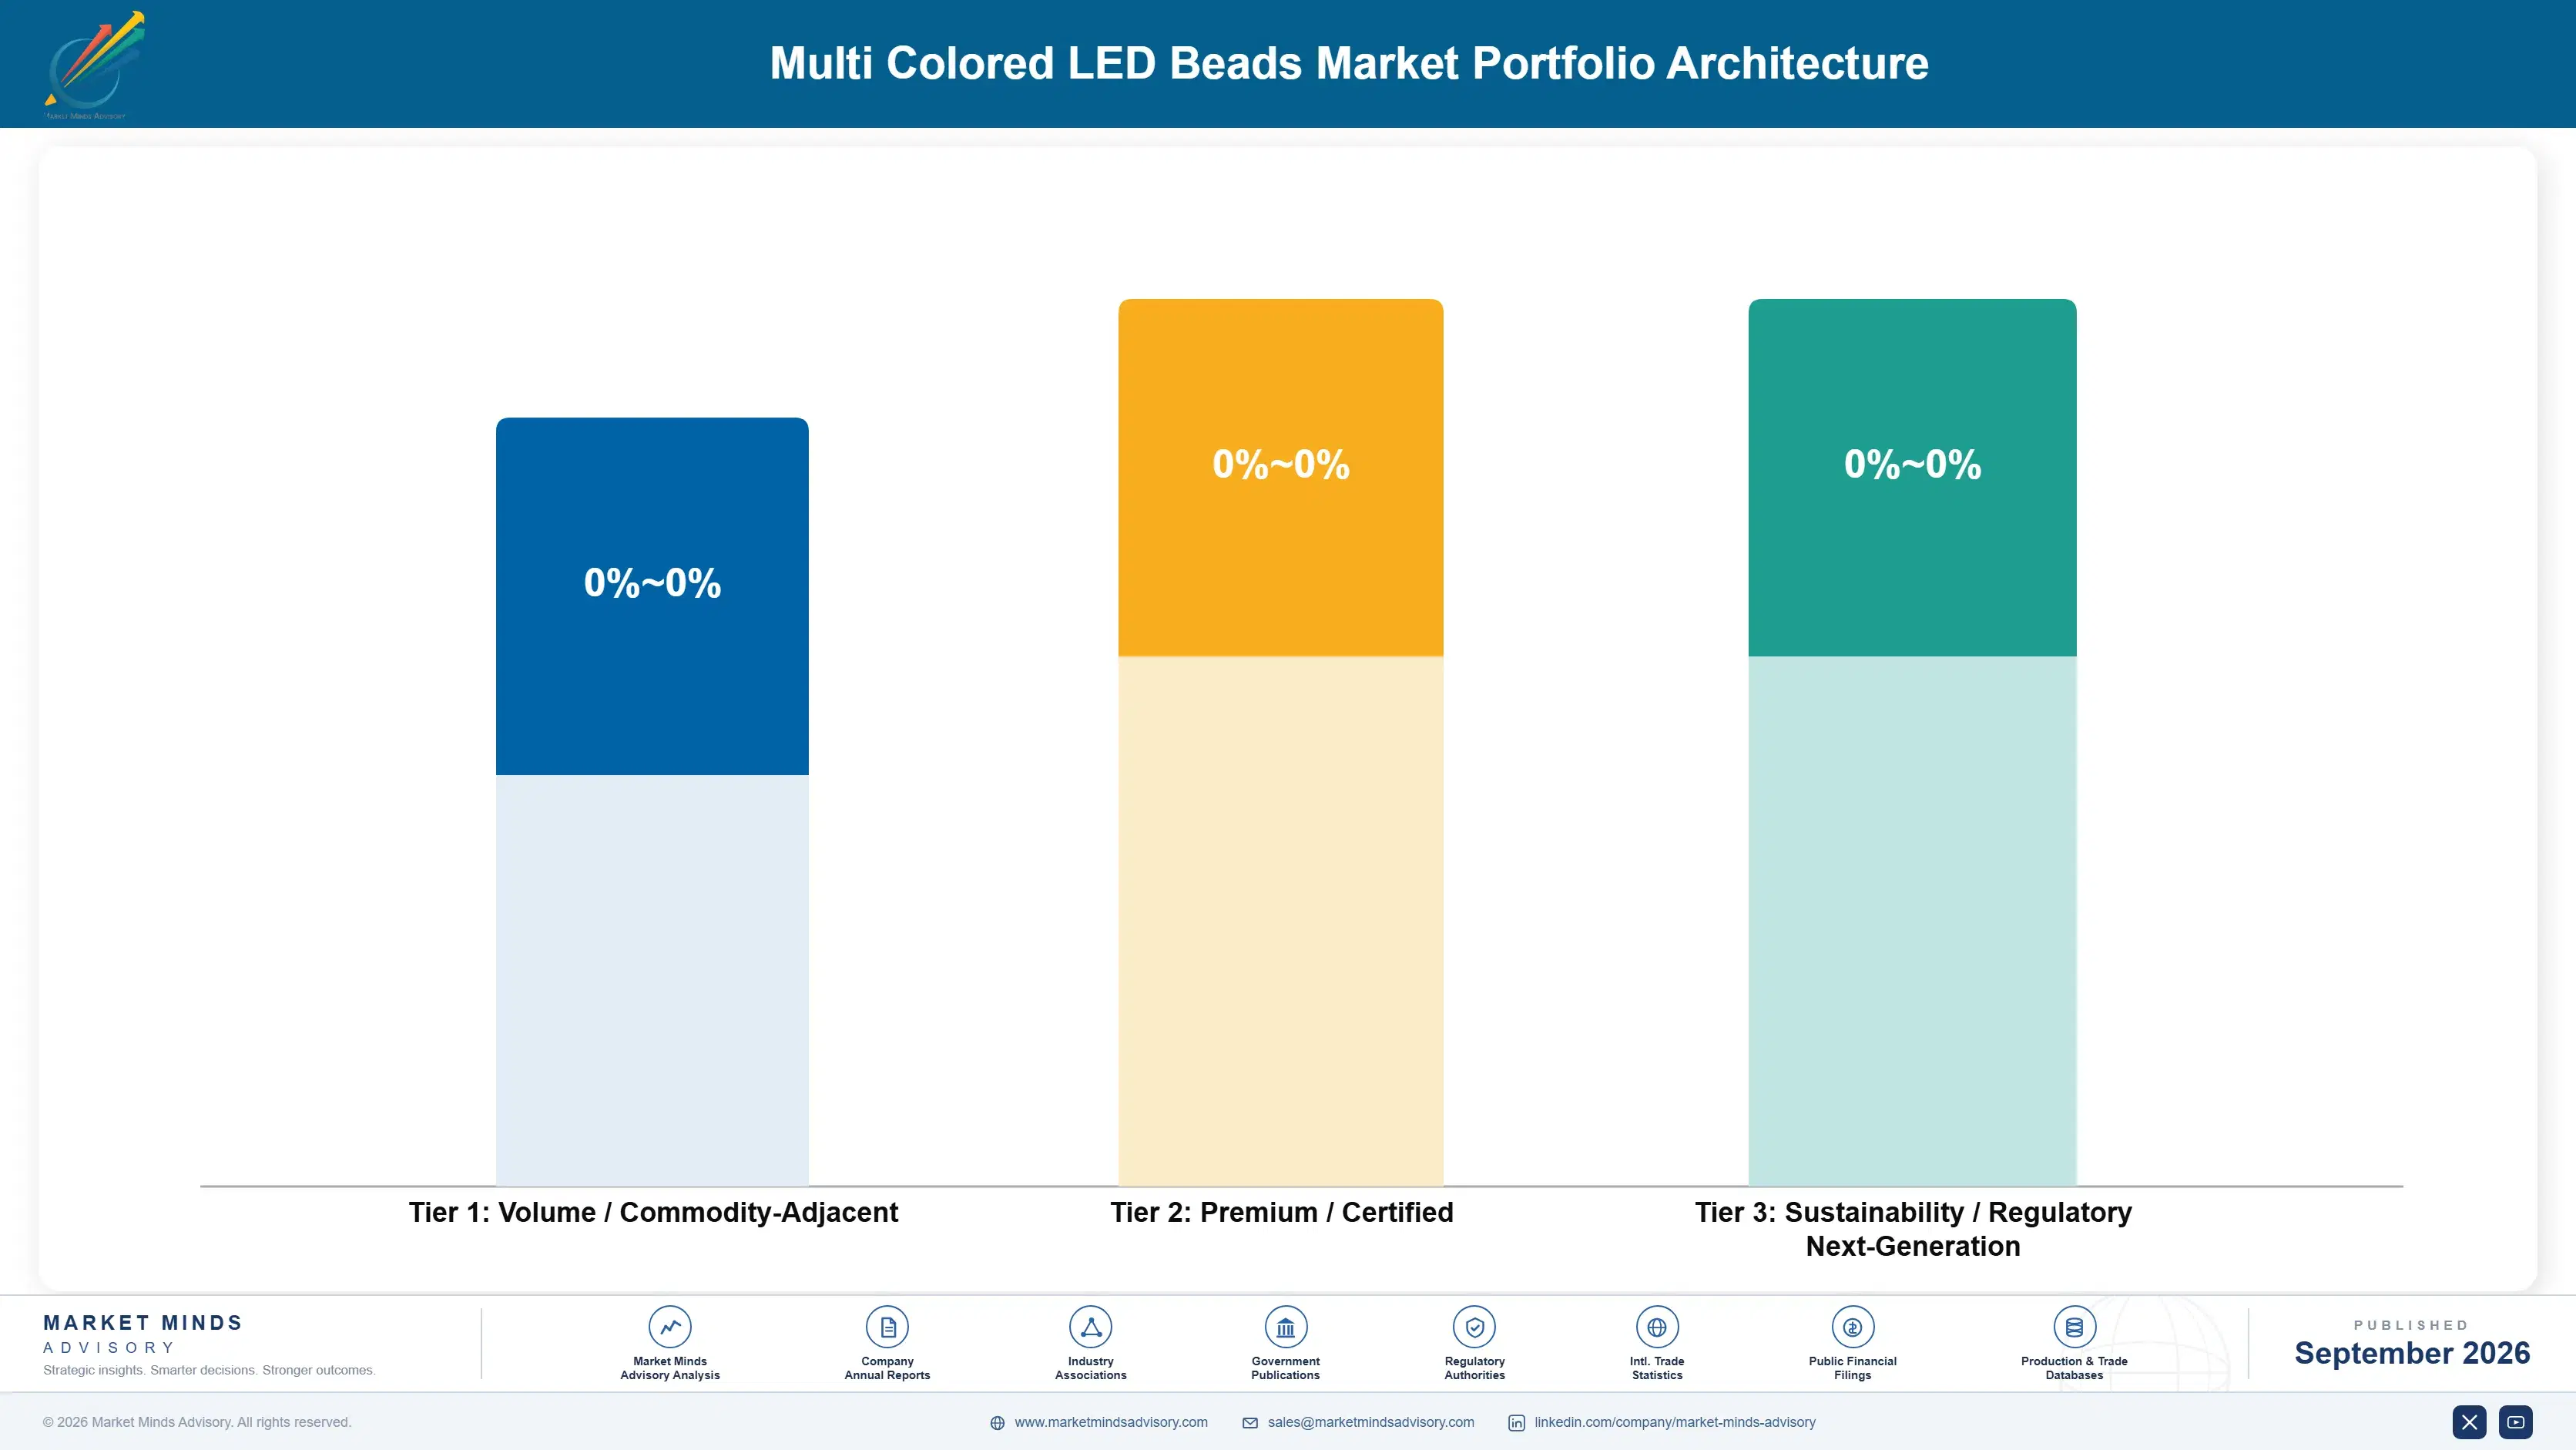
Margin architecture here is unusually flat, which is itself the finding. Standard SMD packages earn almost nothing and always will, because capacity overhang sets the price and nothing distinguishes one part from another. Automotive-qualified and display-grade binned packages earn a real premium on qualification and consistency rather than on any physical difference. The top of the range is addressable and mini LED work, where capability gaps between suppliers are still wide enough to price against.
The volume versus premium tension resolves badly for most suppliers, because the volume tier funds the factory and the premium tier funds the company. Walking away from standard SMD parts leaves lines idle at utilisation already near 76%. Staying in them consumes capacity and management attention on business that earns nothing. Suppliers handling this well run both deliberately, using volume output to hold utilisation while investing incremental capital upward.

High-value pools sit in automotive interior lighting and in display-grade mini LED, and neither is accessible without sustained investment. Automotive demands qualification effort measured in years. Mini LED demands placement equipment and process learning. Both exclude most of the field on capital rather than capability, the most durable barrier available in a category this commoditised.

Volume / Commodity-Adjacent

Standard SMD RGB and through-hole packages sold on price into decorative, signage and general lighting. The six point spread separates suppliers with domestic die supply from those importing components across a border.
Gross Margin: 8% to 14%

Premium / Certified

Automotive-qualified and display-grade binned packages where consistency and qualification carry the price. The eight point spread tracks how much of a supplier's output actually meets the tight bin rather than falling to a discount.
Gross Margin: 22% to 30%

Sustainability / Regulatory / Next-Generation

Mini LED, integrated driver addressable and tunable spectrum horticultural packages. The twelve point spread reflects how differently suppliers have funded placement equipment, so unit economics vary far more than the products do.
Gross Margin: 34% to 46%
multi-colored-led-beads-market-portfolio-architecture-1788455017157

High-value Sub-segments and Strategic Watch-out

Mini LED RGB Packages

Grows at 13.2% on fine pitch display wall arithmetic that has nothing to do with new applications appearing. The twelve point margin spread reflects placement yield differences between suppliers who funded the equipment early and those still learning. That gap narrows every year as more producers invest.
Gross Margin: 30% to 42%

Integrated Driver Addressable Packages

Grows at 10.2% and raises bead price roughly 3 times by absorbing the driver and the wiring the installer used to supply. The ten point spread reflects how few suppliers sell a system component rather than a commodity part. Most sales organisations here are not built for that conversation.
Gross Margin: 28% to 38%

Standard SMD RGB Packages

Grows at 7.6% and still carries most of the unit volume in the category. Price deflation here is permanent and nobody escapes it. The six point spread is almost entirely a domestic sourcing advantage rather than any operating difference. Suppliers keep the volume because it holds factory utilisation.
Gross Margin: 8% to 14%

Through-Hole Multi Colour Lamps

Grows at 3.2% and survives on legacy replacement and low-cost consumer products that nobody has bothered to redesign. The eight point spread reflects genuine dispersion between fully depreciated lines and those still carrying capital cost. Several suppliers would exit this if the equipment had residual value.
Gross Margin: 4% to 12%

Who Buys These And Why

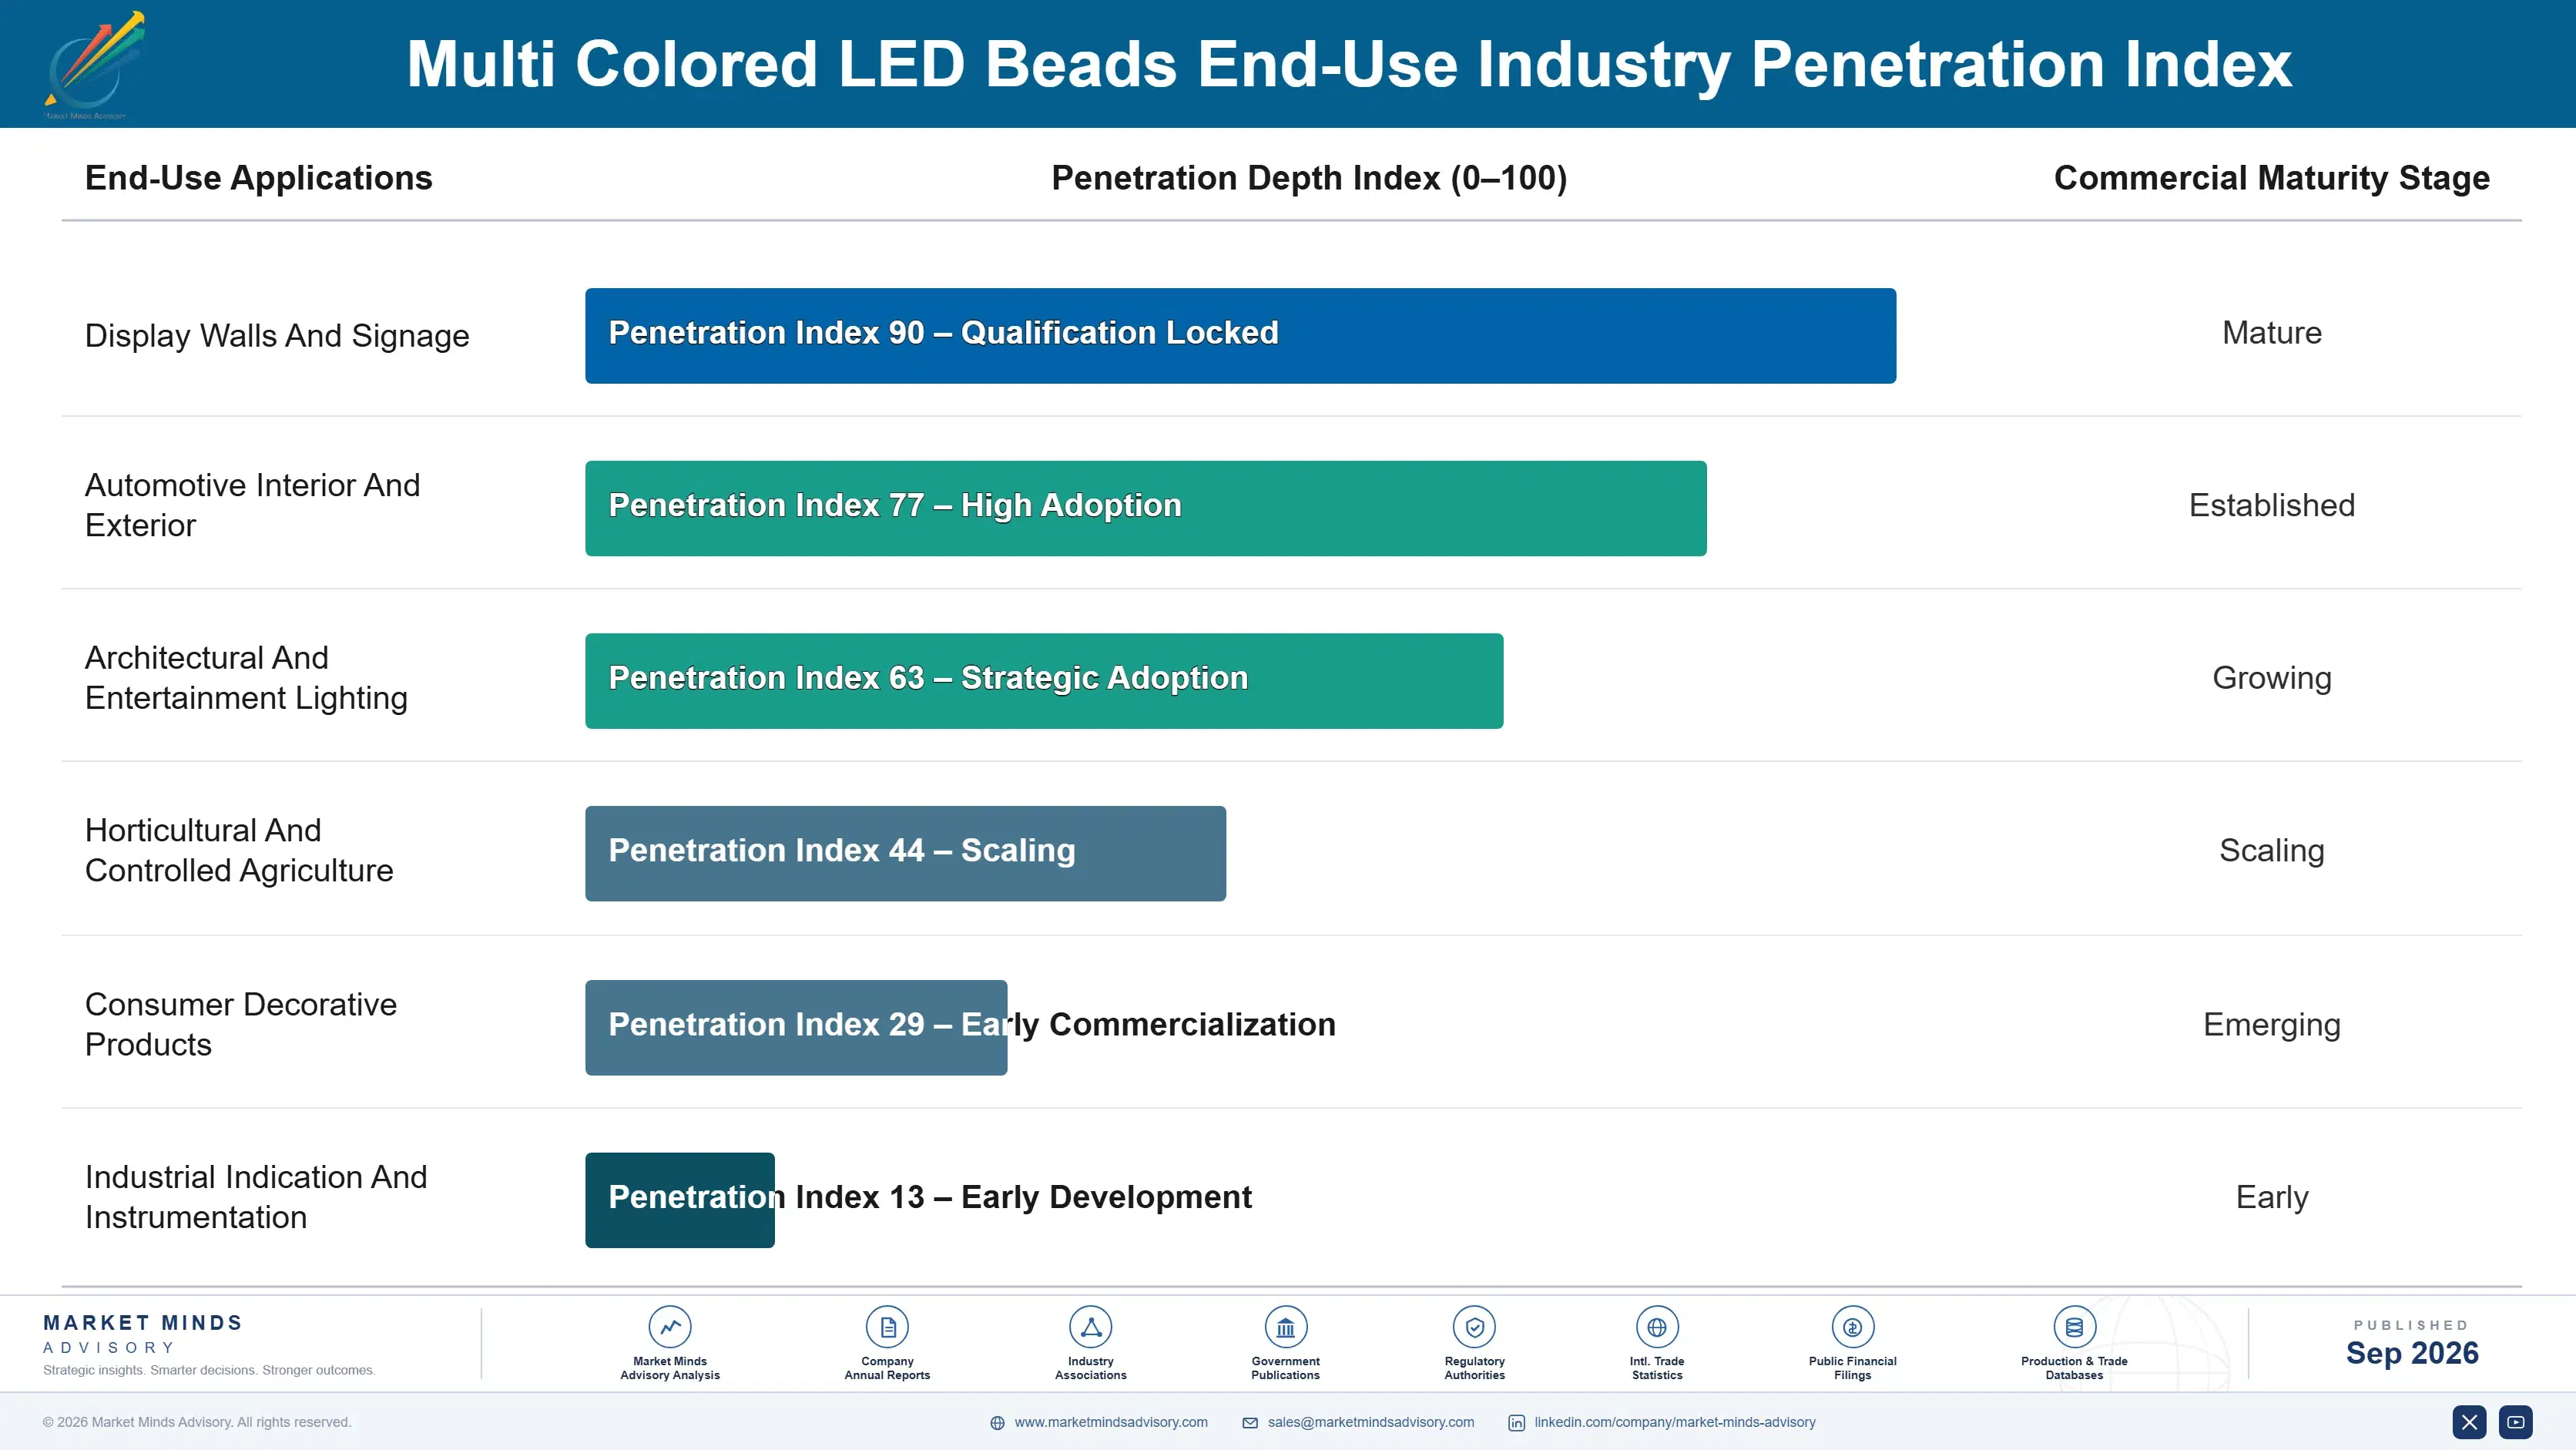
The annuity here is a bill of materials position, not a subscription. Once a bead is designed into a display wall product, a vehicle interior module or a horticultural fixture, it stays there for the product life because requalifying a colour source means re-testing the whole system. Automotive holds that position for seven years, display products for three, decorative for as long as the tooling lasts. Revenue therefore follows design-in decisions made years earlier.
Adoption depth varies enormously by vertical. Automotive is stickiest and hardest to enter: qualification measured in years, platform commitments in years more. Horticulture is nearly as sticky for a different reason, since a validated light recipe is an agronomic asset nobody changes casually. Display wall integrators switch readily between suppliers who guarantee bin continuity, never to anyone who cannot. Decorative and signage buyers switch on price every order, and always have.

The buyer profile has moved upstream. Fifteen years ago the decision sat with a fixture manufacturer buying on lumens. Today it increasingly sits with a display integrator specifying bin tolerance, a vehicle manufacturer specifying colour stability over life, or an agronomist specifying spectral ratios. Each cares about something the volume packaging houses cannot easily supply.
multi-colored-led-beads-market-end-use-penetration-index-1788455017644

What We Would Do Now

These are among the four positions where our research anticipates prominent divergence between winners and laggards over the coming forecast period. Each is grounded in the demand model, the regulatory perimeter, and the announced capacity pipeline.
01 / BINNING INVESTMENT DISCIPLINE

Treat Colour Consistency As The Product

Binning yield at 82% means roughly one bead in six leaves the line unable to command the premium price, and that gap is worth more than any material saving in the package. Display wall integrators pay 20% to 40% above standard pricing for guaranteed single-bin supply across a project, because a wall built from mixed bins becomes a warranty claim rather than an installation. Suppliers treating binning as quality control rather than as the product itself will keep competing on component price, which nobody in this category has ever won.
02 / AUTOMOTIVE QUALIFICATION PUSH

Fund AEC Qualification Before The Content Rises Further

Automotive interior ambient lighting content has climbed to dozens of packages per premium vehicle and keeps rising across model cycles, while pricing there holds against a category that deflates roughly 40% a decade. Qualification means AEC-Q102 compliance, wider temperature range and colour stability across a vehicle life, all of which the volume packaging houses have avoided funding. That avoidance is precisely the opportunity, since a platform award lasts seven years rather than a purchase order and the customer changes suppliers reluctantly.
03 / MINI LED CAPITAL TIMING

Commit Placement Equipment Capital This Cycle

Mini LED RGB packages compound at 13.2% against 8.8% for the category, and the entire barrier is placement equipment capable of handling dice below 200 micron at commercial yield. Process learning compounds, so the gap between suppliers who funded that capability and those still deciding widens every quarter rather than staying constant. The window is finite because every producer of scale is making the same investment, which means the return on committing now is materially better than the return on committing in 2028.
04 / PHOSPHOR EXPOSURE REDUCTION

Qualify Narrow-Band Formulations Before The Next Squeeze

Phosphor sits at roughly 22% of package cost and depends on europium, yttrium and cerium processed almost entirely in one country, which leaves packaging houses with no hedge and no ready substitute. Narrow-band formulations deliver equivalent colour rendering with materially less rare earth content per device, reducing the exposure permanently rather than deferring it. Qualification and reliability testing take quarters, so the work has to start before a price move rather than in response to one that is already under way.

Engagement Snapshot From the Field

A live engagement with an industry participant carrying material or product regulatory and market exposure ahead of a defining policy shift, showing how our research translates into a defensible multi-year portfolio strategy.
MARKET MINDS ADVISORY · CLIENT ENGAGEMENT SUMMARY
Multi Colored LED Beads Producer Strategic Portfolio Review and Transition Roadmap 2026·Investment Scenario on Multi Colored LED Beads Exposure Evaluation 2025-26
CLIENT PROFILE
A display wall manufacturer building fine pitch LED video products at three plants across two continents, buying multi colour beads from seven suppliers depending on plant, product line and whoever quoted lowest that quarter. Warranty claims relating to colour mismatch had risen for three consecutive years. Nobody inside the business had connected those claims to the sourcing pattern.
STRATEGIC CHALLENGE
Procurement wanted to consolidate suppliers to improve pricing while engineering wanted to tighten bin specifications, and the two objectives looked directly opposed. Nobody could quantify what colour mismatch was actually costing, because warranty claims sat in a different budget from bead purchasing. The decision required a number neither function had ever produced.
MMA APPROACH
MMA reconstructed the true cost of colour mismatch by tracing warranty claims back to production batches and their bead sourcing, then benchmarked bin tolerance capability across the seven incumbent suppliers and six alternatives. We drew on 47 expert interviews conducted in Q4 2025 across packaging houses, display integrators and binning equipment suppliers, and modelled the price premium justified by each tolerance level.
KEY FINDINGS
  1. Colour mismatch warranty cost ran to roughly 4.2% of product revenue, entirely absorbing the savings procurement had achieved through multi-sourcing (client-reported, unverified by MMA).
  2. Only three of the seven incumbent suppliers could guarantee bin continuity across a project, and two of those were the highest priced.
  3. Claims clustered in products built at the plant with the widest supplier mix, which nobody had noticed because the data sat in separate systems.
  4. A tighter bin specification carried a supplier premium of roughly 26%, well below the warranty cost it would remove (client-reported, unverified by MMA).
CLIENT PROFILE
A display wall manufacturer building fine pitch LED video products at three plants across two continents, buying multi colour beads from seven suppliers depending on plant, product line and whoever quoted lowest that quarter. Warranty claims relating to colour mismatch had risen for three consecutive years. Nobody inside the business had connected those claims to the sourcing pattern.
STRATEGIC CHALLENGE
Procurement wanted to consolidate suppliers to improve pricing while engineering wanted to tighten bin specifications, and the two objectives looked directly opposed. Nobody could quantify what colour mismatch was actually costing, because warranty claims sat in a different budget from bead purchasing. The decision required a number neither function had ever produced.
MMA APPROACH
MMA reconstructed the true cost of colour mismatch by tracing warranty claims back to production batches and their bead sourcing, then benchmarked bin tolerance capability across the seven incumbent suppliers and six alternatives. We drew on 47 expert interviews conducted in Q4 2025 across packaging houses, display integrators and binning equipment suppliers, and modelled the price premium justified by each tolerance level.
KEY FINDINGS
  1. Colour mismatch warranty cost ran to roughly 4.2% of product revenue, entirely absorbing the savings procurement had achieved through multi-sourcing (client-reported, unverified by MMA).
  2. Only three of the seven incumbent suppliers could guarantee bin continuity across a project, and two of those were the highest priced.
  3. Claims clustered in products built at the plant with the widest supplier mix, which nobody had noticed because the data sat in separate systems.
  4. A tighter bin specification carried a supplier premium of roughly 26%, well below the warranty cost it would remove (client-reported, unverified by MMA).
RECOMMENDED STRATEGY
Phase 1: Phase one: consolidate onto the three suppliers able to guarantee bin continuity, accepting the price premium against the warranty cost it removes. Phase 2: Phase two: link warranty claim data to bead sourcing records in one system, so the cost of a sourcing decision is visible when it is made. Phase 3: Phase three: qualify one additional bin-capable supplier over twelve months to restore the negotiating position without reopening the mismatch exposure.
OUTCOME
Bead spend rose by roughly 19% after consolidation while colour mismatch warranty claims fell by more than half within four quarters (client-reported, unverified by MMA). The linked data system was implemented at two of the three plants. Qualification of the fourth supplier was under way at the close of the engagement.

Frequently Asked Questions

Foundational context covering the market sizes, CAGR, scope, country, region and competition that inform every finding below. This section is provided to cover basics and most often pre-purchase conversations, answered from the MMA Primary Research Dataset.

What is the current size of the Multi Colored LED Beads Market?

Global value reaches USD 5.00 billion in 2026, measured as packaged component revenue across all multi colour bead constructions. The 2025 base is USD 4.6 billion.

How large will the Multi Colored LED Beads Market be by 2036?

Component revenue reaches USD 11.62 billion by 2036, an increase of USD 6.62 billion over the forecast period. That represents 2.32 times expansion from the 2026 base.

What is the CAGR for the Multi Colored LED Beads Market 2026 to 2036?

The base case runs at 8.8% annually, with a bull case at 10.0% if micro LED reaches volume and a bear case at 7.6% on continued price deflation.

Which segment is growing fastest?

Mini LED RGB packages grow at 13.2%, half again the market rate of 8.8%. Falling display wall pixel pitch multiplies bead count per square metre geometrically rather than linearly.

Who are the major companies in the Multi Colored LED Beads Market?

Nichia, ams OSRAM, Seoul Semiconductor, Lumileds and Everlight Electronics lead on packaged unit shipments, together holding 42%. MLS, Nationstar and HongLi Zhihui hold large volume positions.

Which country is growing fastest?

India leads at 12.4%, driven by Production Linked Incentive support for domestic LED packaging and a rapidly growing display wall installation base. Indonesia and Vietnam follow.

Report Segmentation Architecture

The full report scope spans multiple orthogonal segmentation dimensions, with cross-tabulated demand data provided for each dimension pair. Coverage extends further to regional breakdowns, trend trajectories, and the competitive detail needed to support segment-level decision-making.

By Package Construction

  • Mini LED RGB Packages
  • Chip-On-Board Multi Colour Modules
  • Standard SMD RGB Packages
  • High-Power Multi Colour Packages
  • Through-Hole Multi Colour Lamps
  • Integrated Driver Addressable Packages

By End-Use Industry

  • Display Walls And Signage
  • Automotive Interior And Exterior
  • Architectural And Entertainment Lighting
  • Horticultural And Controlled Agriculture
  • Consumer Decorative Products
  • Industrial Indication And Instrumentation

By Commercial Dimension

  • Direct Original Equipment Supply
  • Electronic Component Distribution
  • Contract Manufacturing Supply
  • Automotive Tier One Programmes
  • Lighting Fixture Manufacturers
  • Online And Catalogue Channels

By Region

  • North America
  • Western Europe
  • East Asia
  • South Asia and Pacific
  • Latin America
  • Middle East and Africa
  • Eastern Europe

Scope, Methodology, and Coverage

Every figure in this report is reproducible from documented input assumptions. The scope below maps the historical period, the forecast horizon, the segmentation dimensions, and the countries covered, alongside the underlying primary and qualitative methodology.
Historical Period
2020 to 2025
Forecast Period
2026 to 2036
Base Year
2025 (USD billions; MMA Primary Research Dataset, September 2026)
Market Definition
This report covers multi colour LED beads: packaged light emitting diode components containing two or more independently addressable emitter colours in a single housing, including RGB, RGBW and tunable white packages. It excludes single-colour LED packages, bare LED die and wafers, finished luminaires and display panels, LED driver integrated circuits sold separately, and the phosphor and substrate materials supplied into packaging.
Quantitative Units
USD millions, packaged component revenue basis; packaged unit shipments; average selling price in USD per bead; binning yield as percentage of output.
Segmentation Dimensions
Package construction; end-use industry; commercial channel dimension; geography across seven regions.
Regions Covered
North America, Western Europe, East Asia, South Asia and Pacific, Latin America, Middle East and Africa, Eastern Europe
Countries Covered
China, Japan, South Korea, Taiwan, India, Malaysia, Vietnam, Singapore, Australia, United States, Mexico, Germany, France, Netherlands, Italy, United Kingdom, Poland, Czechia, Brazil, Saudi Arabia.
Key Companies Profiled
Nichia, ams OSRAM, Seoul Semiconductor, Lumileds, Everlight Electronics, MLS Co, Nationstar Optoelectronics, HongLi Zhihui, Jufei Optoelectronics, Refond Optoelectronics, Lextar Electronics, Ennostar, Cree LED, LG Innotek, Bridgelux.
Quantitative Methodology
Primary survey, n=3,800 respondents, Q4 2025, six countries; demand-side model with trade association cross-validation
Qualitative Methodology
47 expert interviews, Q4 2025; applied to validate demand model assumptions, identify emerging dynamics, and assess competitive positioning
Report Format
PDF and XLSX data workbook (Word format preview document)
Publisher
Market Minds Advisory
Report Code
MMA-2026-TEC-251
Published
September 2026
Contact
sales@marketmindsadvisory.com | www.marketmindsadvisory.com

Purchase the full Multi Colored LED Beads Market Report (2026 to 2036).

This report sizes the global multi colour LED bead market from 2026 to 2036 across six package constructions, six end-use industries and seven regions. It sets out why binning yield and package mix rather than manufacturing cost determine which suppliers earn a return, with cost composition sourced to company annual reports. Regional analysis explains East Asia's 58% position, China's 74% share of packaged output, and why no region outside Asia has added capacity in a decade. Competitive assessment covers 20 named suppliers on packaged unit shipments, with development tracking and four revenue lever analyses. An anonymised display wall manufacturer sourcing engagement is included.
Binning yield economics modelled across every tier
Six package constructions sized through to 2036
Seven region value mapped to packaging capacity
Twenty named suppliers assessed on packaged shipments
Four revenue levers with quantified margin impact
Anonymised display wall manufacturer sourcing engagement included

Built For The People Who Decide

From boardroom strategy to bench-side execution, this report is read cover-to-cover by leaders shaping the next decade of their industry, turning demand scenarios, market dynamics and valuation benchmarks into decisions.
CXOs/ Presidents/ VPs/ Managers
M&A and Corporate Development
Strategy Teams and R&D Heads
Procurement and Product Directors
Regulatory and Compliance Leaders
Investor Relations and Equity Analysts