Market Minds Advisory
Mosquito Trap Market

Mosquito Trap Market: Mosquito Trap Market. Smart Connected Traps Push Vector Control Beyond Passive Chemical Attractant Systems

Rising vector-borne disease awareness and app-connected monitoring technology are pulling mosquito trap demand toward smart systems that command premium pricing over passive chemical attractant devices across most global consumer markets.

Lead Analyst

Published

September 2026

Make Smarter Decisions with Customized Research Insights

Request a free sample report and evaluate market opportunities, growth trends, and competitive dynamics relevant to your business needs.

2025 MARKET VALUE$1.4BMarket Size 2025
2036 FORECAST VALUE$3.4BBase Case , 2026 to 2036
CAGR 2026 TO 20368.5 %Bull 9.8% / Bear 7.2%
INCREMENTAL OPPORTUNITY$1.9BNet 10- year value creation
EXPANSION MULTIPLE2.26x2036 value over 2026 base
Strategic Levers
M&A Pipeline
Regional Outlook
Country Rankings
Competitive Intelligence
Segmental Deep-dive
Call-Us : 91 93563 13602

Executive Snapshot and Market Trajectory.

Mosquito traps have moved past basic zapper technology toward smart connected systems, with app-based monitoring now driving most incremental category revenue growth in premium residential retail channels. Retailers are reallocating shelf space toward these connected releases accordingly, a shift unseen just a few years ago.
Smart connected traps and suction-based systems are pulling budget away from basic electric zappers, particularly among consumers seeking documented capture data over generic attractant marketing language. Direct-to-consumer specialty brands are capturing disproportionate share of this shift, often ahead of legacy mass-market incumbents still anchored to passive chemical attractant technology. Adoption is broadening quickly across both residential and light commercial buyers in nearly every major regional market tracked this year.
Competitive intensity centers on established pest control conglomerates defending share against fast-growing specialty smart device brands built entirely around connected mobile applications and outdoor sensor networks. Regulatory scrutiny of chemical attractant safety claims is tightening in several major markets, forcing reformulation investment across the category's premium tier. Brands moving fastest on transparent capture data disclosure are positioned to capture share from slower-moving legacy competitors over the next several product cycles. This shift should accelerate further.
Market Definition
The mosquito trap market covers UV light attractant, CO2-emitting, electric zapper, chemical attractant, suction and smart connected devices designed to capture or kill mosquitoes outdoors. It excludes chemical repellent sprays and lotions, indoor insect screens, and general pesticide products not specifically designed as trapping devices.
Base Year Value
$1.4B in 2025 (MMA Primary Research Dataset, September 2026)
Forecast Period
2026 to 2036, eleven discrete annual values
CAGR
8.5% base case. Bull 9.8%. Bear 7.2%.
Fastest Growth Segment
Smart Connected Traps: 13.0% CAGR
Fastest Growth Country
India: 11.0% CAGR
Fastest Growth Region
South Asia and Pacific: 10.7% CAGR
Largest Region
North America: 28% of 2025 global value
Market Leaders
Spectrum Brands, Woodstream, Bite Shield, Mosquito Magnet and Thermacell lead the category. Source: MMA Primary Research Dataset, July 2026.
Primary Survey
n=3,800 procurement and R&D decision-makers, Q4 2025, six countries
Methodology
Demand-side build-up, cross-validated against public data, 47 expert interviews

Mosquito Trap Market Forecast Scenarios

mosquito-trap-market-size-forecast-scenario-1790016105484
Between 2020 and 2025 the mosquito trap category grew at a steady 7.5 percent historical pace, accelerating as vector-borne disease awareness expanded following high-profile outbreak coverage and increased outdoor recreation spending during and after pandemic-era lockdowns. Direct-to-consumer smart device brands captured outsized share during this period as connected home adoption expanded. Mass retailers restocked basic zapper assortments even as smart connected traps began capturing early adopter attention online.
The base case assumes continued migration from basic electric zappers toward smart connected and suction-based systems, sustained vector-borne disease awareness driving preventive purchasing behavior, and expanding specialty retail footprint in emerging markets where disease burden remains elevated. These three mechanisms together support an 8.5 percent forecast CAGR through 2036, with smart connected traps carrying the bulk of incremental category growth. Legacy basic zapper lines continue generating steady baseline revenue, cushioning overall category volatility.
The bull case centers on faster-than-expected regulatory mandates requiring vector control measures in high-risk residential zones. The bear case assumes economic pressure pushes budget-conscious consumers back toward cheaper basic zapper formats, compressing the premium smart connected segment that currently anchors most category value growth. Faster mainstream adoption would push category growth toward the upper end of the forecast range.

Connectivity Redefines Trap Category Value

Mosquito traps span an unusually wide sophistication range within a single pest control category, with average prices varying nearly tenfold between basic zappers and premium smart connected systems. This spread gives manufacturers wide latitude to trade consumers up as disease awareness and technology literacy deepen over time. Manufacturers price entry zappers low, using them as a gateway toward higher-margin smart lines over later purchase cycles.
CATEGORY CONCENTRATION41% CR5Top five brands hold combined category revenue share currently
AVERAGE SELLING PRICE$65.00Blended price across zapper, suction and smart connected formats
TOP PRODUCING COUNTRYChina, 31%Leading manufacturing origin country by export shipment volume
SMART FORMAT PENETRATION22%Share of category sales from app-connected smart trap devices
SMART TRAP REPEAT RATE47%Share of buyers repurchasing smart traps within three years
SENSOR AND ELECTRONICS SHARE28% of COGSSensor and electronics component share of production cost
China anchors global manufacturing for the category, while American and European sensor technology houses increasingly license connectivity chemistry to manufacturers across this production hub rather than developing comparable capability independently. Specialty outdoor living retail continues taking share from general hardware channels as consumers seek curated, higher-touch shopping guidance. This pattern should persist while sensor technology development remains concentrated among a small number of specialized innovators.
Repeat purchase economics favor smart connected traps over basic zappers, since safety-conscious buyers replenish attractant cartridges and sensor components at a materially higher rate once they commit to app-based monitoring routines. Capture data transparency and attractant refill economics now function as genuine differentiators, since informed buyers evaluate ongoing cost as closely as upfront pricing itself. Manufacturers investing in transparent capture testing report higher trust than competitors relying on internal claims.
"Capture data transparency is quietly becoming the category's real competitive battleground while generic attractant claims fade into background noise for informed buyers. Brands slow to publish verified capture performance are ceding their most valuable customer relationships to faster-moving specialty challengers."
Senior Analyst, Consumer Durables and Outdoor Living Practice · MMA Residential and Commercial Outdoor Pest Control Devices Practice · September 2026

Market Trends

Smart Connected Traps Replace Passive Zapper Formats

Consumers are increasingly choosing app-connected smart traps that report capture counts and mosquito species data over passive zapper formats making generic effectiveness claims, addressing a recognized gap between marketed performance and actual documented capture results. Manufacturers responding fastest to this shift are expanding smart trap product lines well beyond their original passive assortments, reallocating research budget toward sensor accuracy and connectivity reliability infrastructure. Specialty retailers report smart trap sales now outpacing passive zapper growth by a wide margin across most major suburban markets tracked this year. This transition is reshaping shelf space allocation at major outdoor living retailers nationwide.
Market Impact: Expands premium buyer base 21 percent
Vector-Borne Disease Awareness Drives Preventive Purchasing

Consumer awareness of vector-borne disease risk, amplified by public health messaging and social media coverage of regional outbreaks, has pushed households toward preventive trap purchasing rather than reactive purchasing only after noticing a mosquito problem. Brands publishing transparent capture and disease vector data see measurably faster adoption curves for new product launches than those relying solely on generic pest control marketing claims. This shift has compressed the credibility gap between established and newer entrant smart brands considerably. Brands lacking a credible transparency strategy are increasingly struggling to gain visibility against faster-moving specialty challengers in the premium tier.
Market Impact: Adds 380 new specialty store locations

Market Opportunities and Growth Drivers

Outdoor Living Investment Expands Trap Buyer Base

Rising residential investment in outdoor living spaces, including decks, patios and backyard entertainment areas, is expanding the addressable base for mosquito trap purchases as consumers prioritize year-round outdoor usability over previously mosquito-affected seasons. This growth disproportionately benefits premium smart trap manufacturers positioned to serve design-conscious outdoor living investment, since these consumers are willing to pay materially more for aesthetically integrated devices. Manufacturers building dedicated outdoor living retail partnerships report stronger long-term customer relationships than those relying solely on seasonal price competition. This dynamic is expected to sustain elevated demand growth for aesthetically designed devices throughout the forecast period.
Market Impact: Concentrates 70 percent in Q2

Specialty Retail Expansion Widens Category Access

Specialty outdoor living and pest control retail chains are expanding store counts across secondary cities in emerging markets, bringing curated smart trap assortments to consumers previously limited to basic general hardware selections. This expansion gives premium and mid-tier brands physical shelf access they could not previously secure outside major metropolitan flagship locations. Retailers report mosquito trap sales per square foot rising faster than most other outdoor living subcategories as disease awareness converts browsers into repeat buyers across an expanding footprint. This growing physical footprint also supports in-store demonstration and installation guidance that online-only channels cannot replicate as effectively.
Market Impact: Delays launches 3 to 5 months

Market Restraints and Challenges

Seasonal Demand Concentration Constrains Annual Revenue

Mosquito trap demand concentrates heavily within a limited warm-weather sales window in most temperate markets, constraining year-round revenue predictability and forcing manufacturers to manage inventory and production capacity around a compressed seasonal peak. The root cause is that mosquito activity itself follows temperature-driven seasonal patterns that manufacturers cannot influence through marketing or product design alone. This friction complicates capital planning and workforce scheduling, though manufacturers are mitigating impact by expanding into year-round tropical and subtropical markets where mosquito activity persists across all seasons. Some manufacturers now expand product lines into complementary outdoor categories to smooth revenue across quieter months.
Market Impact: Cuts perceived effectiveness complaints 30 percent

Chemical Attractant Safety Claims Face Scrutiny

Regulators in several major markets have tightened substantiation requirements for chemical attractant safety and effectiveness claims, citing consumer complaints about products making unsubstantiated marketing statements without documented capture performance data. The root cause is that many existing product labels used generic effectiveness language without disclosing actual capture rates or testing methodology, forcing relabeling work across a meaningful share of the category. Manufacturers are mitigating this exposure by publishing third-party capture testing ahead of any mandated disclosure requirement. Some manufacturers are also investing in blockchain-based testing traceability to preempt further regulatory tightening.
Market Impact: Lifts preventive purchase adoption 27 percent
3 additional market trends, 4 additional growth drivers, and 3 additional restraints and challenges are covered in the full report. Contact sales@marketmindsadvisory.com to access the complete intelligence.

Segment CAGR and Growth Architecture

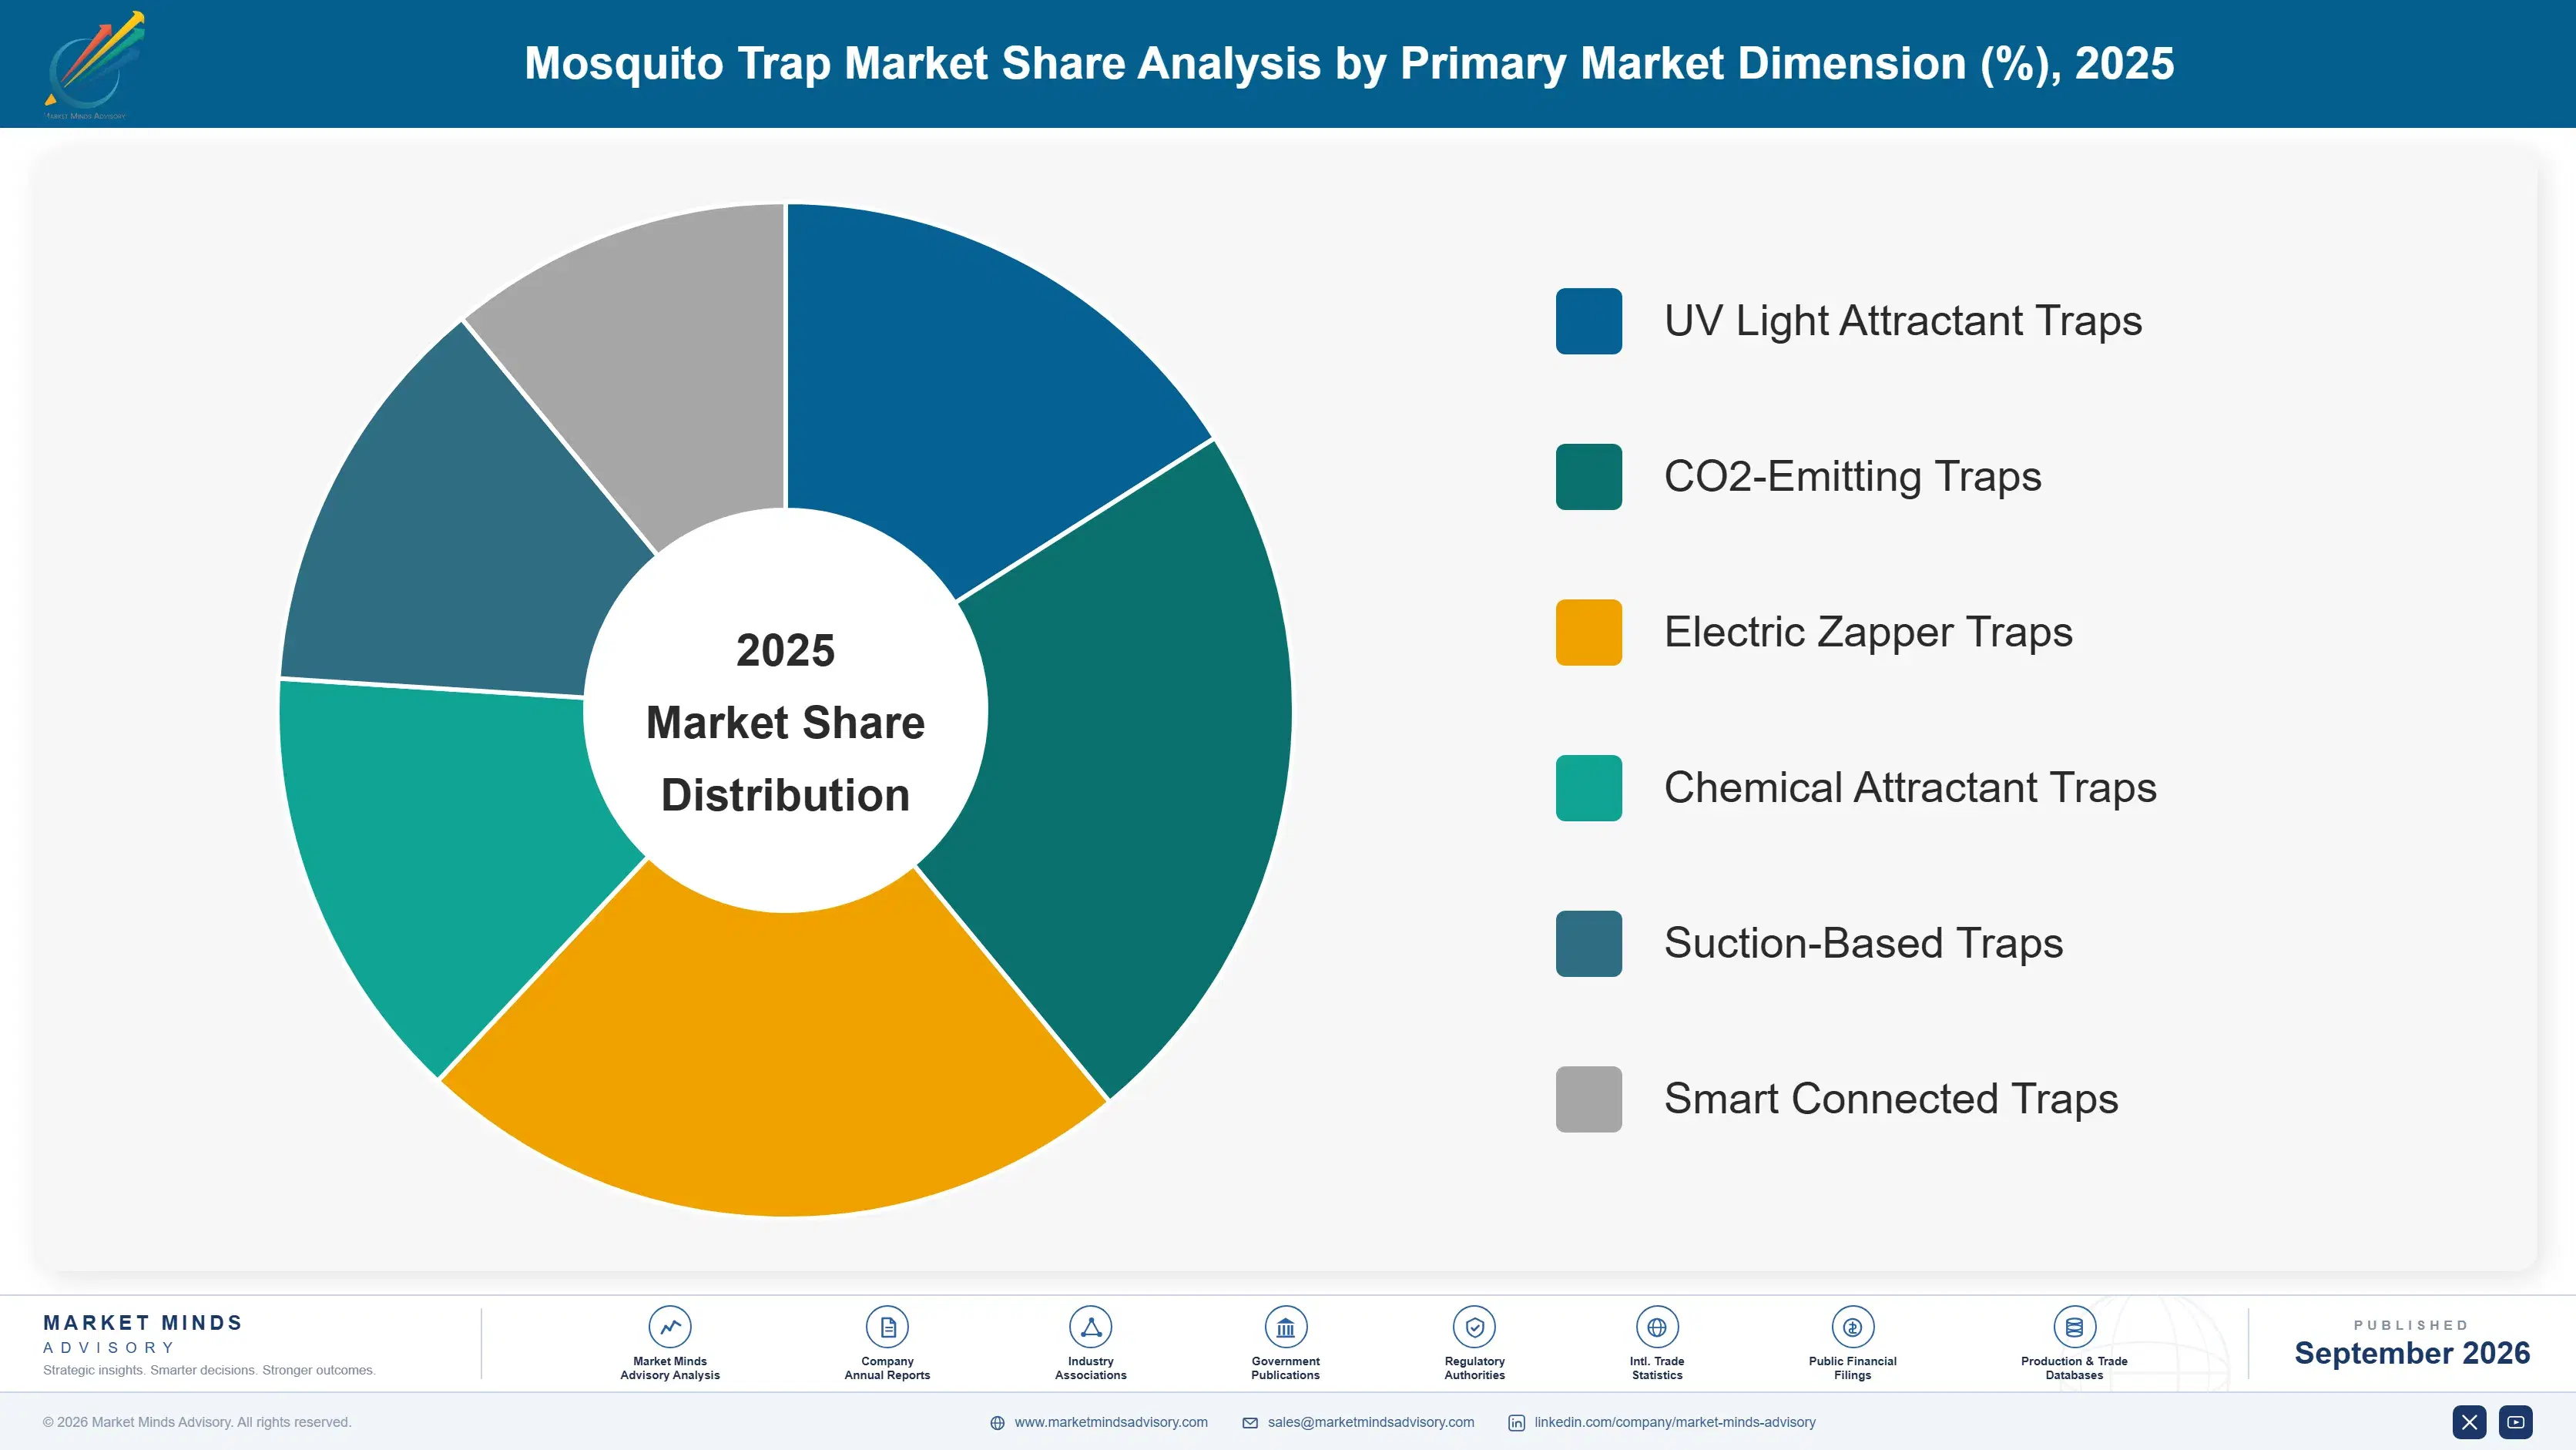
Mosquito traps break into six technology-type segments spanning UV light attractant, CO2-emitting, electric zapper, chemical attractant, suction and smart connected devices, each carrying distinct margin profiles, replenishment cycles and retail positioning within the broader outdoor pest control category. Classification follows a single technology-format logic throughout, avoiding any mixing with distribution channel, power source or installation location.
mosquito-trap-market-market-share-analysis-1790016106019

Smart Connected Traps

Smart connected traps represent the fastest-growing segment, delivering app-based monitoring, capture counting and species identification that passive trap formats cannot provide reliably. Growth here reflects genuine functional expansion beyond basic capture toward data-driven pest management rather than simple category upsizing, since many buyers previously accepted uncertainty about trap effectiveness as an unavoidable limitation before connected sensors demonstrated otherwise. Manufacturers are racing to expand sensor reliability and battery longevity, since connectivity dependability remains the primary purchase driver for this rapidly growing consumer segment currently expanding fastest across most major suburban markets tracked. Specialty retailers increasingly dedicate standalone shelf sections to this segment alone, a shift unseen just a few years ago.
CAGR 13.0%

Suction-Based Traps

Suction-based traps form the second-fastest-growing segment, combining continuous vacuum capture with attractant lures that trap live mosquitoes for extended monitoring rather than instant kill technology that zappers provide. This segment benefits directly from growing consumer interest in humane and low-chemical pest control methods, since suction capture avoids the visible kill mechanism that some households find unappealing. Retailers report suction trap sales performing particularly well among environmentally conscious consumers, capturing buyers who eventually expand into broader smart connected and premium attractant purchases. Premium suction lines bundling extended battery life with weather-resistant housing are emerging as a durable subcategory carrying materially higher price points than basic suction alternatives. Early data suggests attach rates for these premium suction systems are climbing steadily.
CAGR 9.5%
Full segment breakdown across 6 segments available in the complete report.

Regional Architecture and Country Demand Map

North America leads global mosquito trap demand through strong outdoor living culture and dense specialty retail penetration nationwide today, while East Asia sustains large durable manufacturing scale and South Asia and Pacific accelerates fastest on elevated regional disease burden and rapidly rising preventive purchasing behavior.

North America

The United States accounts for the overwhelming majority of regional mosquito trap demand, anchored by dense specialty outdoor living retail chains and a well-established direct-to-consumer smart device brand network serving highly engaged, technology-literate consumers. Canada tracks similar consumption patterns at smaller absolute scale. American consumers were early adopters of app-connected trap technology, giving domestic brands a head start on sensor integration that international competitors are still working to close. Retail media advertising spend on outdoor living and pest control content continues concentrating heavily in this region, reinforcing product discovery patterns already well established nationwide. Retailer loyalty programs targeting repeat smart trap buyers have become a genuine competitive differentiator across the region's largest specialty chains.
Share: 28% | CAGR: 9.5% (2026 to 2036)

Western Europe

Germany, France and the United Kingdom drive the bulk of Western European mosquito trap demand, supported by growing outdoor living investment and increasing awareness of imported vector-borne disease risk from international travel. The region's regulatory environment around chemical attractant safety has slowed some product launches relative to less restrictive markets, contributing to comparatively modest regional growth. British and French outdoor living brands maintain strong domestic loyalty despite growing competition from faster-moving international challengers. Nordic countries show above-average adoption of low-chemical suction trap formats, reflecting regional consumer preference for environmentally conscious pest control. Slower regulatory approval for novel chemical attractant formulations means European consumers often gain access to new formats well after they debut in less restrictive markets.
Share: 19% | CAGR: 7.0% (2026 to 2036)
Regional intelligence for 5 additional markets available in the complete report: East Asia, South Asia and Pacific, Latin America, Middle East and Africa, Eastern Europe. Contact sales@marketmindsadvisory.com.
mosquito-trap-market-country-cagr-analysis-1790016106539

Smart Trap Margin Expansion Playbook

Manufacturers capture disproportionate margin by trading consumers up from basic zappers toward smart connected and suction systems, publishing capture performance data that supports premium pricing, and building attractant refill subscription programs that lock in recurring revenue across each household routine overall. This combination of trade-up mechanics and subscription retention compounds meaningfully over multiple cycles.

Smart Trap Trade-Up Programs Lift Basket Value

Manufacturers running structured trade-up programs, sampling smart connected traps to loyal zapper buyers through loyalty app promotions, report meaningfully higher conversion into the higher-margin smart category than passive in-store merchandising alone achieves. This approach works because zapper buyers already trust the brand's build quality, lowering the perceived risk of trying an unfamiliar connected format for the first time. Brands running these programs report conversion rates near 20 percent within the first year of program launch. Manufacturers scaling this approach across their full loyalty base report the strongest incremental margin gains of any single initiative tested this year.
Market Impact: Lifts smart category conversion by 20 percent overall

Capture Data Publishing Supports Premium Pricing

Publishing third-party capture rate and effectiveness data supports premium pricing that unsubstantiated competitor claims cannot sustain, since informed buyers increasingly demand evidence before paying smart-tier prices. This approach also strengthens retailer negotiating position, since specialty retailers increasingly favor brands with credible published data over those relying on marketing claims alone. Brands publishing capture data report price premiums of 22 to 32 percent over comparable unsubstantiated competitor products. Manufacturers investing early in substantiation build a credibility moat that unsubstantiated competitors find increasingly difficult to close over time. Early adopters report the strongest gains.
Market Impact: Adds a 22 to 32 percent price premium

Attractant Refill Subscriptions Reduce Customer Churn

Subscription replenishment programs for attractant cartridges and sensor components reduce customer churn by removing the friction of remembering to repurchase before existing trap effectiveness declines. Manufacturers report subscription customers generating meaningfully higher lifetime value than one-time purchasers, since the recurring billing relationship also increases exposure to complementary product cross-sell opportunities within the same brand catalog over time. Retention rates for subscription customers reportedly exceed 61 percent after the first full year. Manufacturers are extending subscription options to filter and housing replacement as well, seeking similar retention gains across the broader catalog.
Market Impact: Raises subscriber customer lifetime value by 36 percent

Bundled Outdoor Living Sets Increase Order Value

Selling coordinated trap, lighting and outdoor accessory sets under a single backyard living package increases average order value and introduces consumers to complementary products they might not otherwise discover through single-item browsing behavior. Bundled sets also reduce per-unit marketing spend relative to individual product campaigns while increasing the likelihood that a buyer completes their entire outdoor living setup within one brand rather than mixing competitor products. Manufacturers report bundle attach rates reaching roughly 28 percent among first-time premium category buyers. Manufacturers coordinating bundle timing with seasonal promotions report even stronger conversion than bundles sold without accompanying marketing support.
Market Impact: Raises bundled average order value by 28 percent

Who Controls the Margin Pool

Spectrum Brands and Woodstream lead the mosquito trap market with a combined revenue share that outpaces the broader field of legacy regional challengers, reflecting years of accumulated brand distribution scale and retail relationships that newer entrants cannot easily replicate. The gap between these two leaders and third-ranked Bite Shield remains wide on a revenue basis, the consistent yardstick applied throughout this competitive assessment.
Current competitive activity centers on expanding smart connected product lines, publishing third-party capture performance studies, and building direct-to-consumer subscription programs that capture recurring attractant refill revenue previously ceded to retail intermediaries. Manufacturers are also investing in transparent testing methodology disclosure, since capture data credibility has become a genuine competitive differentiator rather than a marketing afterthought across the broader category.

Emerging pressure comes from independent smart device startups securing niche sensor technology partnerships that larger manufacturers consider too small to pursue, and from regional Asian manufacturers entering Western markets directly through e-commerce. Rankings could shift meaningfully if a major pest control conglomerate acquires a specialist smart trap brand to close its connectivity technology gap, a move several industry observers consider increasingly likely given current competitive pressure.
mosquito-trap-market-company-positioning-matrix-1790016107062

Competitive Moat and Risk Dimensions

SPECTRUM BRANDS

Moat: Multi-Brand Retail Scale

Spectrum Brands' ownership of multiple pest control and outdoor living brands gives it retail shelf presence across nearly every mass and specialty channel simultaneously. This distribution breadth lets the company capture trade-up revenue as consumers move between its own brand tiers over time. Retailers favor Spectrum's proven category management expertise across every major mass and specialty channel simultaneously.
SPECTRUM BRANDS

Risk: Slower Smart Segment Response

Spectrum Brands' scale advantages have not translated as effectively into the fast-growing smart connected segment, where smaller agile brands have moved faster on sensor technology innovation. Closing this gap requires either internal development investment or acquisition of specialist smart device brands. Spectrum has begun acquiring smaller smart device brands to close this gap more quickly than internal development alone.
WOODSTREAM

Moat: Established Pest Control Heritage

Woodstream's decades-long heritage in pest control products, spanning traps and outdoor pest management devices, gives it credibility that newer digitally native entrants struggle to replicate quickly. This heritage extends to established retail buyer relationships built over generations of category leadership. Long-tenured retail buyers reinforce consumer trust in Woodstream's category leadership specifically.
WOODSTREAM

Risk: Legacy Product Line Dependence

Woodstream's revenue base remains weighted toward legacy passive trap formats that face increasing substitution pressure from smart connected alternatives gaining consumer preference. A prolonged shift toward connected devices would require substantial internal reformulation investment. Woodstream has begun testing hybrid smart-enabled sub-lines to control this exposure without abandoning its core passive product heritage.

Players Tracked

Prominent Players

Spectrum Brands
Woodstream
Bite Shield
Mosquito Magnet
Thermacell

Other Key Players

Bird-X
Dynatrap
Gardner Manufacturing
Aspectek
Katchy
Vensmile
Executioner
Raid Outdoor
Bug-A-Salt
Solar Guard
Aeroguard
Gnat Stop
Skeeter Vac
Trapstar
Bugzooka

Recent Developments

MARCH 2026

Spectrum Brands Launches Expanded Smart Trap Line

Spectrum Brands launched an expanded smart connected trap line covering app-based monitoring and capture alert features, addressing a gap identified through customer feedback on limited connectivity. The launch includes published third-party capture testing compliant with updated claims standards. Analysts expect competitors to follow with comparable connected product launches.
Signal: Confirms smart connectivity as a genuine competitive battleground across the category Rivals are expected to expand connectivity features soon.
NOVEMBER 2025

Woodstream Acquires Sensor Technology Startup

Woodstream acquired a sensor technology startup specializing in mosquito detection chemistry, integrating proprietary connectivity capability directly into its existing product development pipeline. The acquisition strengthens Woodstream's smart feature innovation timeline ahead of planned expansion into additional connected categories next year. Integration completes within two quarters.
Signal: Signals growing manufacturer investment in owned sensor technology capability Competitors without similar capability risk falling behind on innovation speed.
JULY 2025

Bite Shield Signs Retail Exclusive Agreement

Bite Shield signed a multi-year exclusive distribution agreement with a major specialty outdoor living retailer covering its full smart trap product line across all store locations. The agreement excludes competing retailers from carrying the same product line for the agreement's duration. Analysts view this as a template for future negotiations.
Signal: Highlights growing use of retail exclusivity as a differentiation strategy Smaller manufacturers may struggle to secure comparable exclusive retail terms.

Sensor and Electronics Supply Concentration

Plastic housing, sensor electronics and attractant chemicals together account for roughly 28 percent of mosquito trap production cost, with the majority of sensor and electronics component supply originating from manufacturers concentrated in China and Taiwan. Battery and connectivity module components add further concentrated exposure to a smaller set of specialized electronics suppliers. This geographic concentration leaves the category exposed to regional trade and export policy shifts.
Semiconductor and sensor component supply tightened during 2021 through 2022, documented in company annual reports across the consumer electronics sector, pushed lead times on connectivity modules out by several weeks and forced several manufacturers to delay planned smart trap launches tied to seasonal release calendars. Pricing on affected components rose noticeably during the tightening before stabilizing through 2023 as alternative sourcing came online. Diversified manufacturers weathered the tightening with shorter delays than single-source competitors.

Smaller independent brands carry disproportionately higher input cost exposure because they lack the purchase volume to negotiate favorable component pricing that larger manufacturers secure through long-term supply agreements. This disadvantage compounds when a launch deadline forces smaller brands into spot-market component purchasing at premium prices, while established manufacturers with forward-contracted supply avoid the same exposure entirely during identical tightening conditions.
mosquito-trap-market-cost-volatility-analysis-1790016107258

Qualifying Secondary Electronics Suppliers

Manufacturers are qualifying secondary sensor and electronics suppliers outside their traditional concentrated base, reducing single-source dependency risk ahead of future tightening cycles. This diversification adds modest upfront qualification cost but meaningfully shortens recovery time when supply tightens again. Manufacturers report qualification timelines of three to five months, a worthwhile tradeoff against the multi-month delays experienced during the last tightening.

Forward Contracting Seasonal Component Needs

Larger manufacturers increasingly lock in multi-quarter forward supply contracts for sensor and connectivity components ahead of major seasonal launch windows, trading pricing flexibility for delivery certainty. This approach proved valuable during the prior tightening cycle across the category. Several manufacturers extended existing supplier relationships into multi-year agreements following the 2021 through 2022 tightening, prioritizing certainty over marginal cost savings.

Standardizing Sensor Module Designs

Design teams are standardizing sensor and connectivity modules across multiple product lines, reducing the total number of unique components a manufacturer must source and qualify for any given seasonal launch. This also lowers overall reformulation risk. This standardization also shortens new product development timelines since design teams reuse qualified modules rather than sourcing new components for every launch.

Portfolio Architecture for Margin Defence

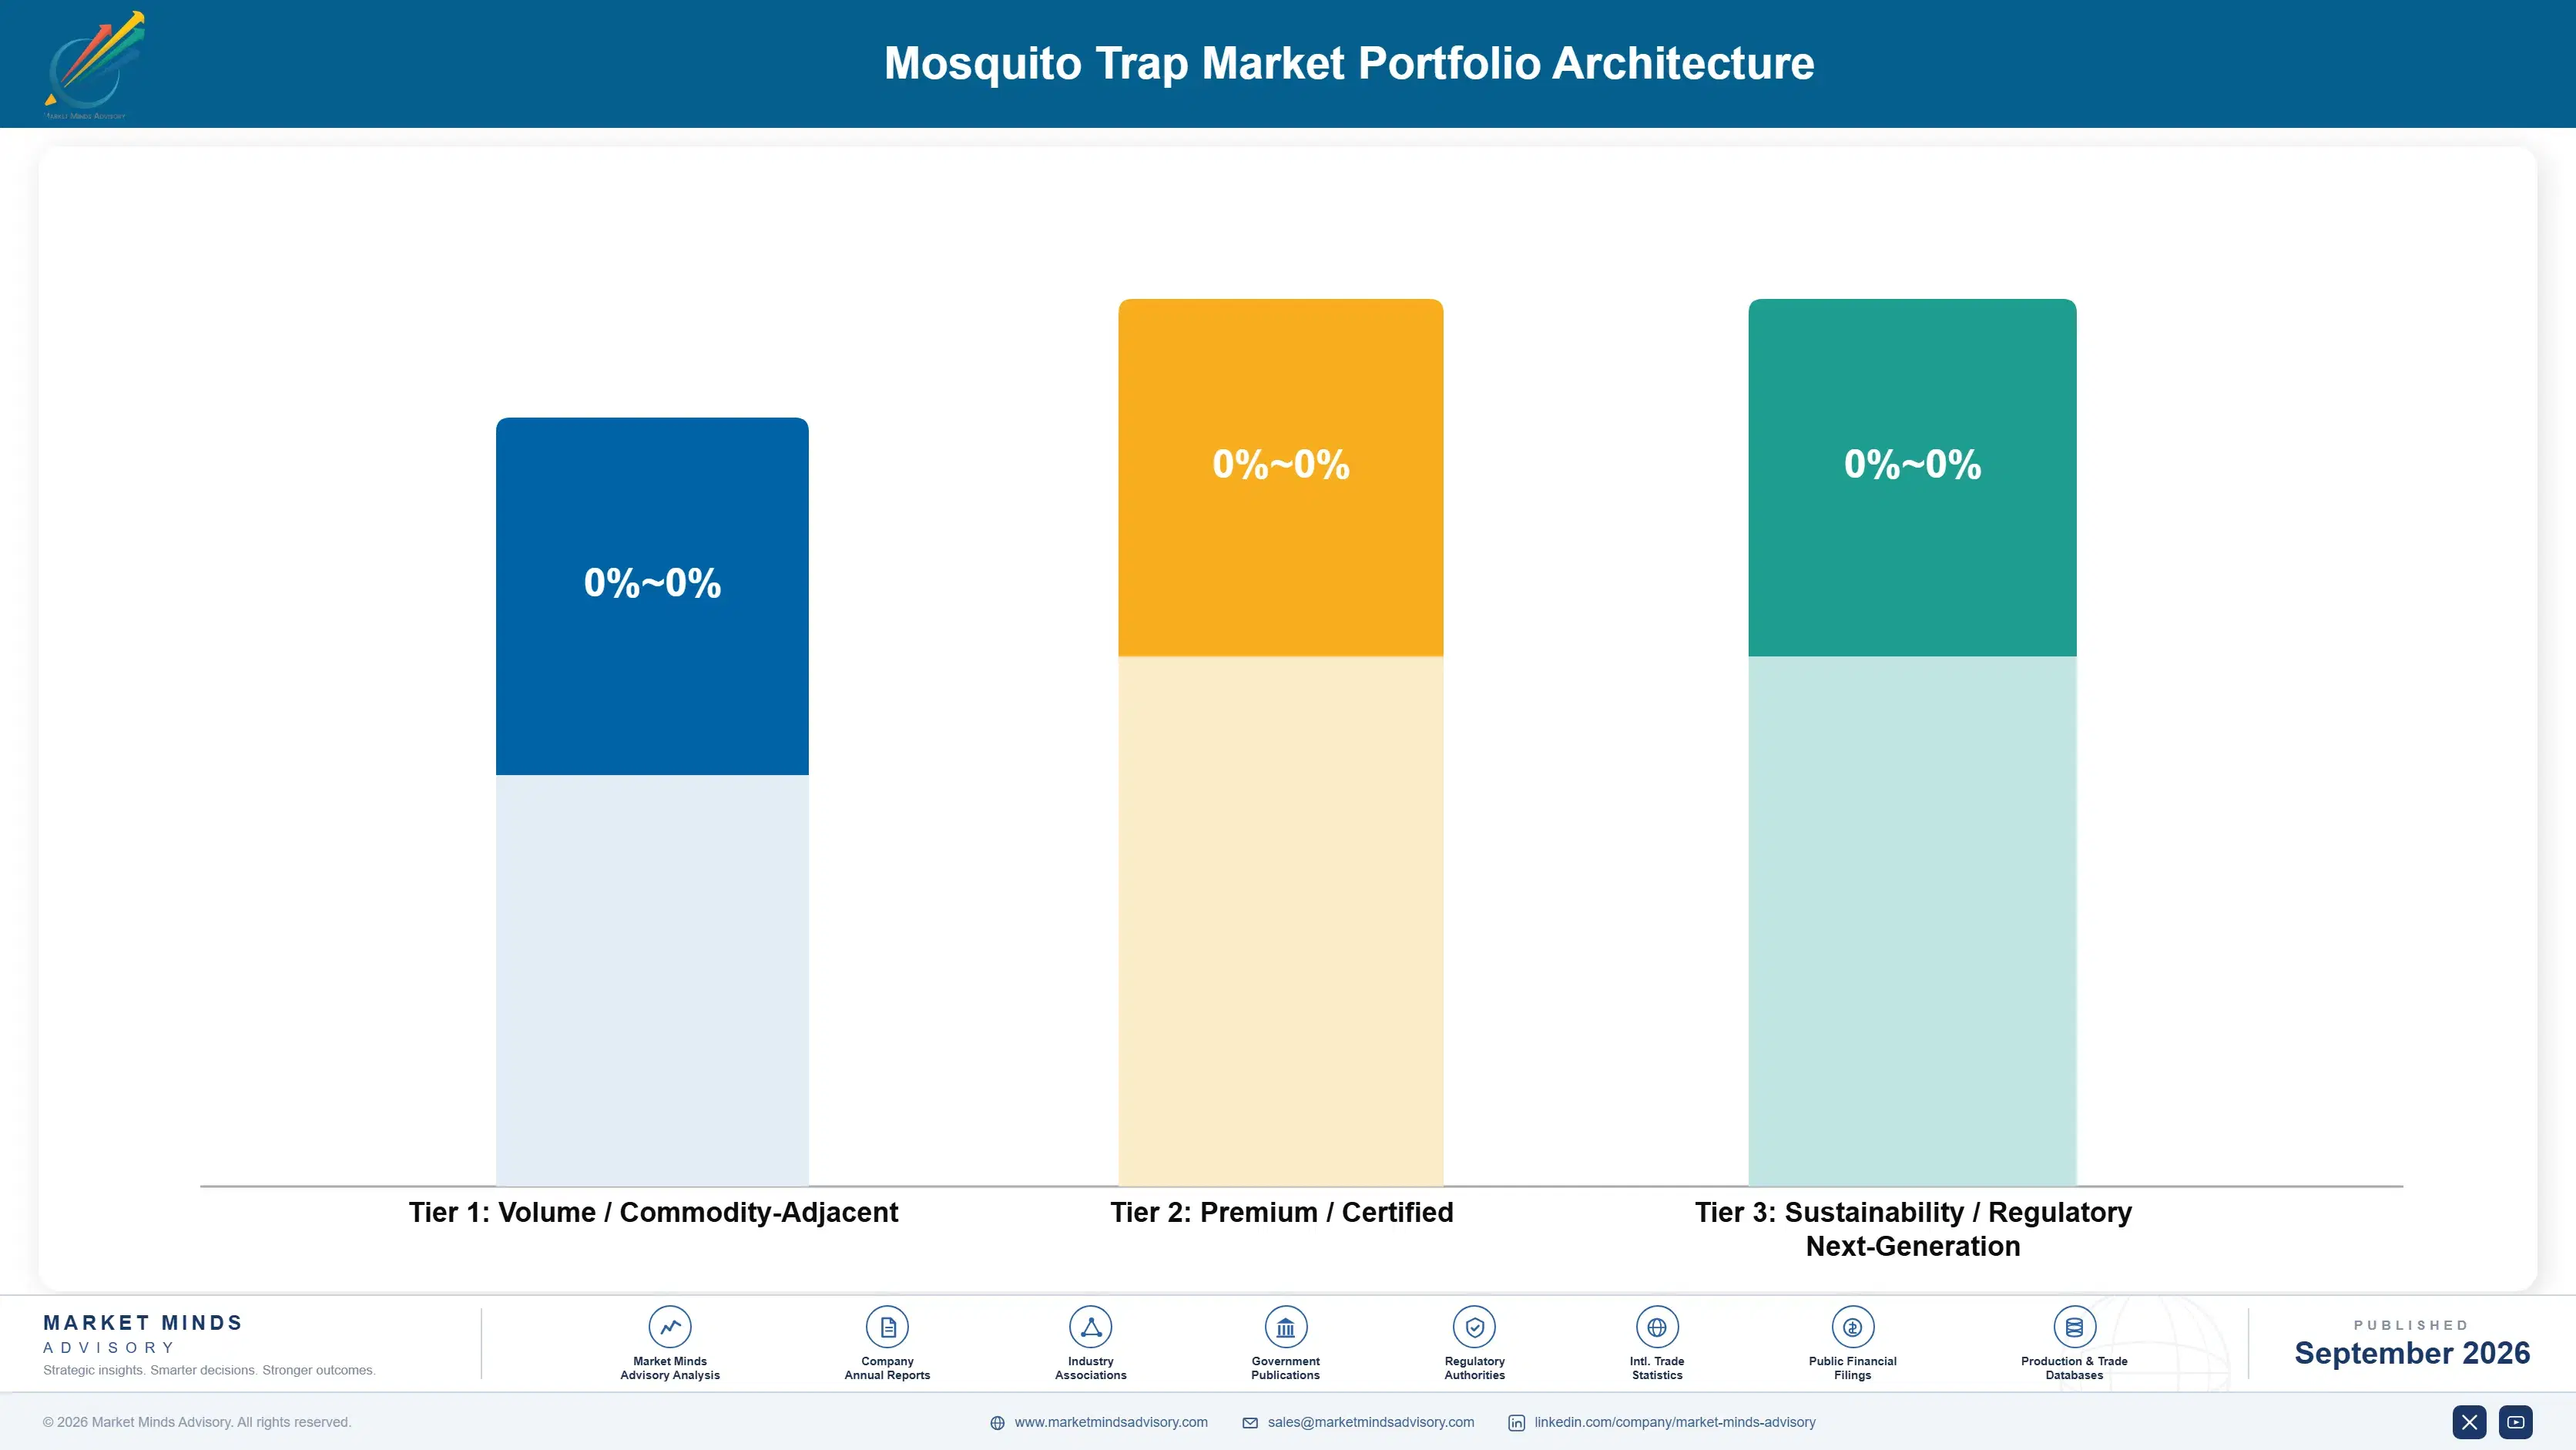
Gross margin economics diverge sharply across the three tiers structuring this market, from thin-margin volume zappers competing largely on price to premium smart connected and suction systems where sensor technology and specialty retail positioning support wider margins. Sustainability-focused low-chemical products occupy a smaller but expanding third tier as environmental claims increasingly matter to younger buyers.
Manufacturers face a persistent tension between chasing volume share in commodity zapper assortments, where competition is fiercest and margins thinnest, and concentrating capital on premium certified smart products that deliver superior returns per unit sold but require ongoing sensor technology investment. Most established players now allocate a growing share of new product development budget toward the premium tier.

High-value margin pools concentrate overwhelmingly in smart connected traps and bundled outdoor living sets, where sensor technology and specialty retail exclusivity command sustained premium pricing that commodity zappers simply cannot replicate. Manufacturers capturing the largest share of these pools tend to be those with the deepest sensor expertise and fastest product development cycles synchronized to outdoor living trend cycles. This dynamic is expected to intensify as more challengers pursue sensor technology investment across the category.

Volume / Commodity-Adjacent

Generic zapper and basic attractant traps sold at accessible price points through mass retail channels, competing primarily on price against private-label alternatives. These products rely on high unit volume and broad retail distribution rather than sensor exclusivity to sustain profitability.
Gross Margin: 18 to 26 percent

Premium / Certified

Smart connected and suction systems carrying verified capture performance, sold through specialty outdoor living retail at sustained premium pricing. Buyers in this tier are willing to pay significantly more for verified capture performance and connectivity reliability.
Gross Margin: 38 to 48 percent

Sustainability / Regulatory / Next-Generation

Low-chemical and recyclable-material trap systems meeting emerging environmental disclosure standards, appealing to sustainability-conscious younger consumers. This tier remains small today but is expanding as environmental disclosure expectations shift among younger buyers over time.
Gross Margin: 40 to 50 percent
mosquito-trap-market-portfolio-architecture-1790016107754

High-value Sub-segments and Strategic Watch-out

Smart Connected Trap Systems

Sensor-enabled smart traps command the highest per-unit margins in the category, combining connectivity exclusivity with strong capture data economics. Manufacturers with the strongest sensor expertise capture the largest share of this margin pool consistently over time. This concentration should persist through the forecast period. Retailers dedicate growing shelf space.
Gross Margin: 44 to 54 percent

Bundled Outdoor Living Sets

Matched trap, lighting and accessory sets deliver strong margins with moderate but steadily expanding growth as buyers seek complete solutions. Attach rates continue climbing as manufacturers expand matched product lines across a growing number of outdoor categories. Growth here should outpace the standard catalog segment.
Gross Margin: 34 to 42 percent

Standard Zapper and Attractant Traps

The volume core of the category, standard zapper and attractant traps sustaining steady baseline demand across mainstream retail channels. This segment anchors overall category volume even as manufacturer strategic attention shifts increasingly toward higher-margin premium tiers. Absolute volume keeps rising as margin share slowly declines.
Gross Margin: 18 to 26 percent

Seasonal Demand Concentration Pressure

Compressed seasonal sales windows represent a strategic watch-out, constraining year-round revenue predictability and complicating capacity planning. Manufacturers are investing in tropical market expansion to offset this seasonal constraint before it compounds further. Left unchecked, this trend limits year-round revenue predictability. Manufacturers report meaningful geographic diversification progress.
Gross Margin: not applicable

Seasonal Maintenance Revenue Architecture

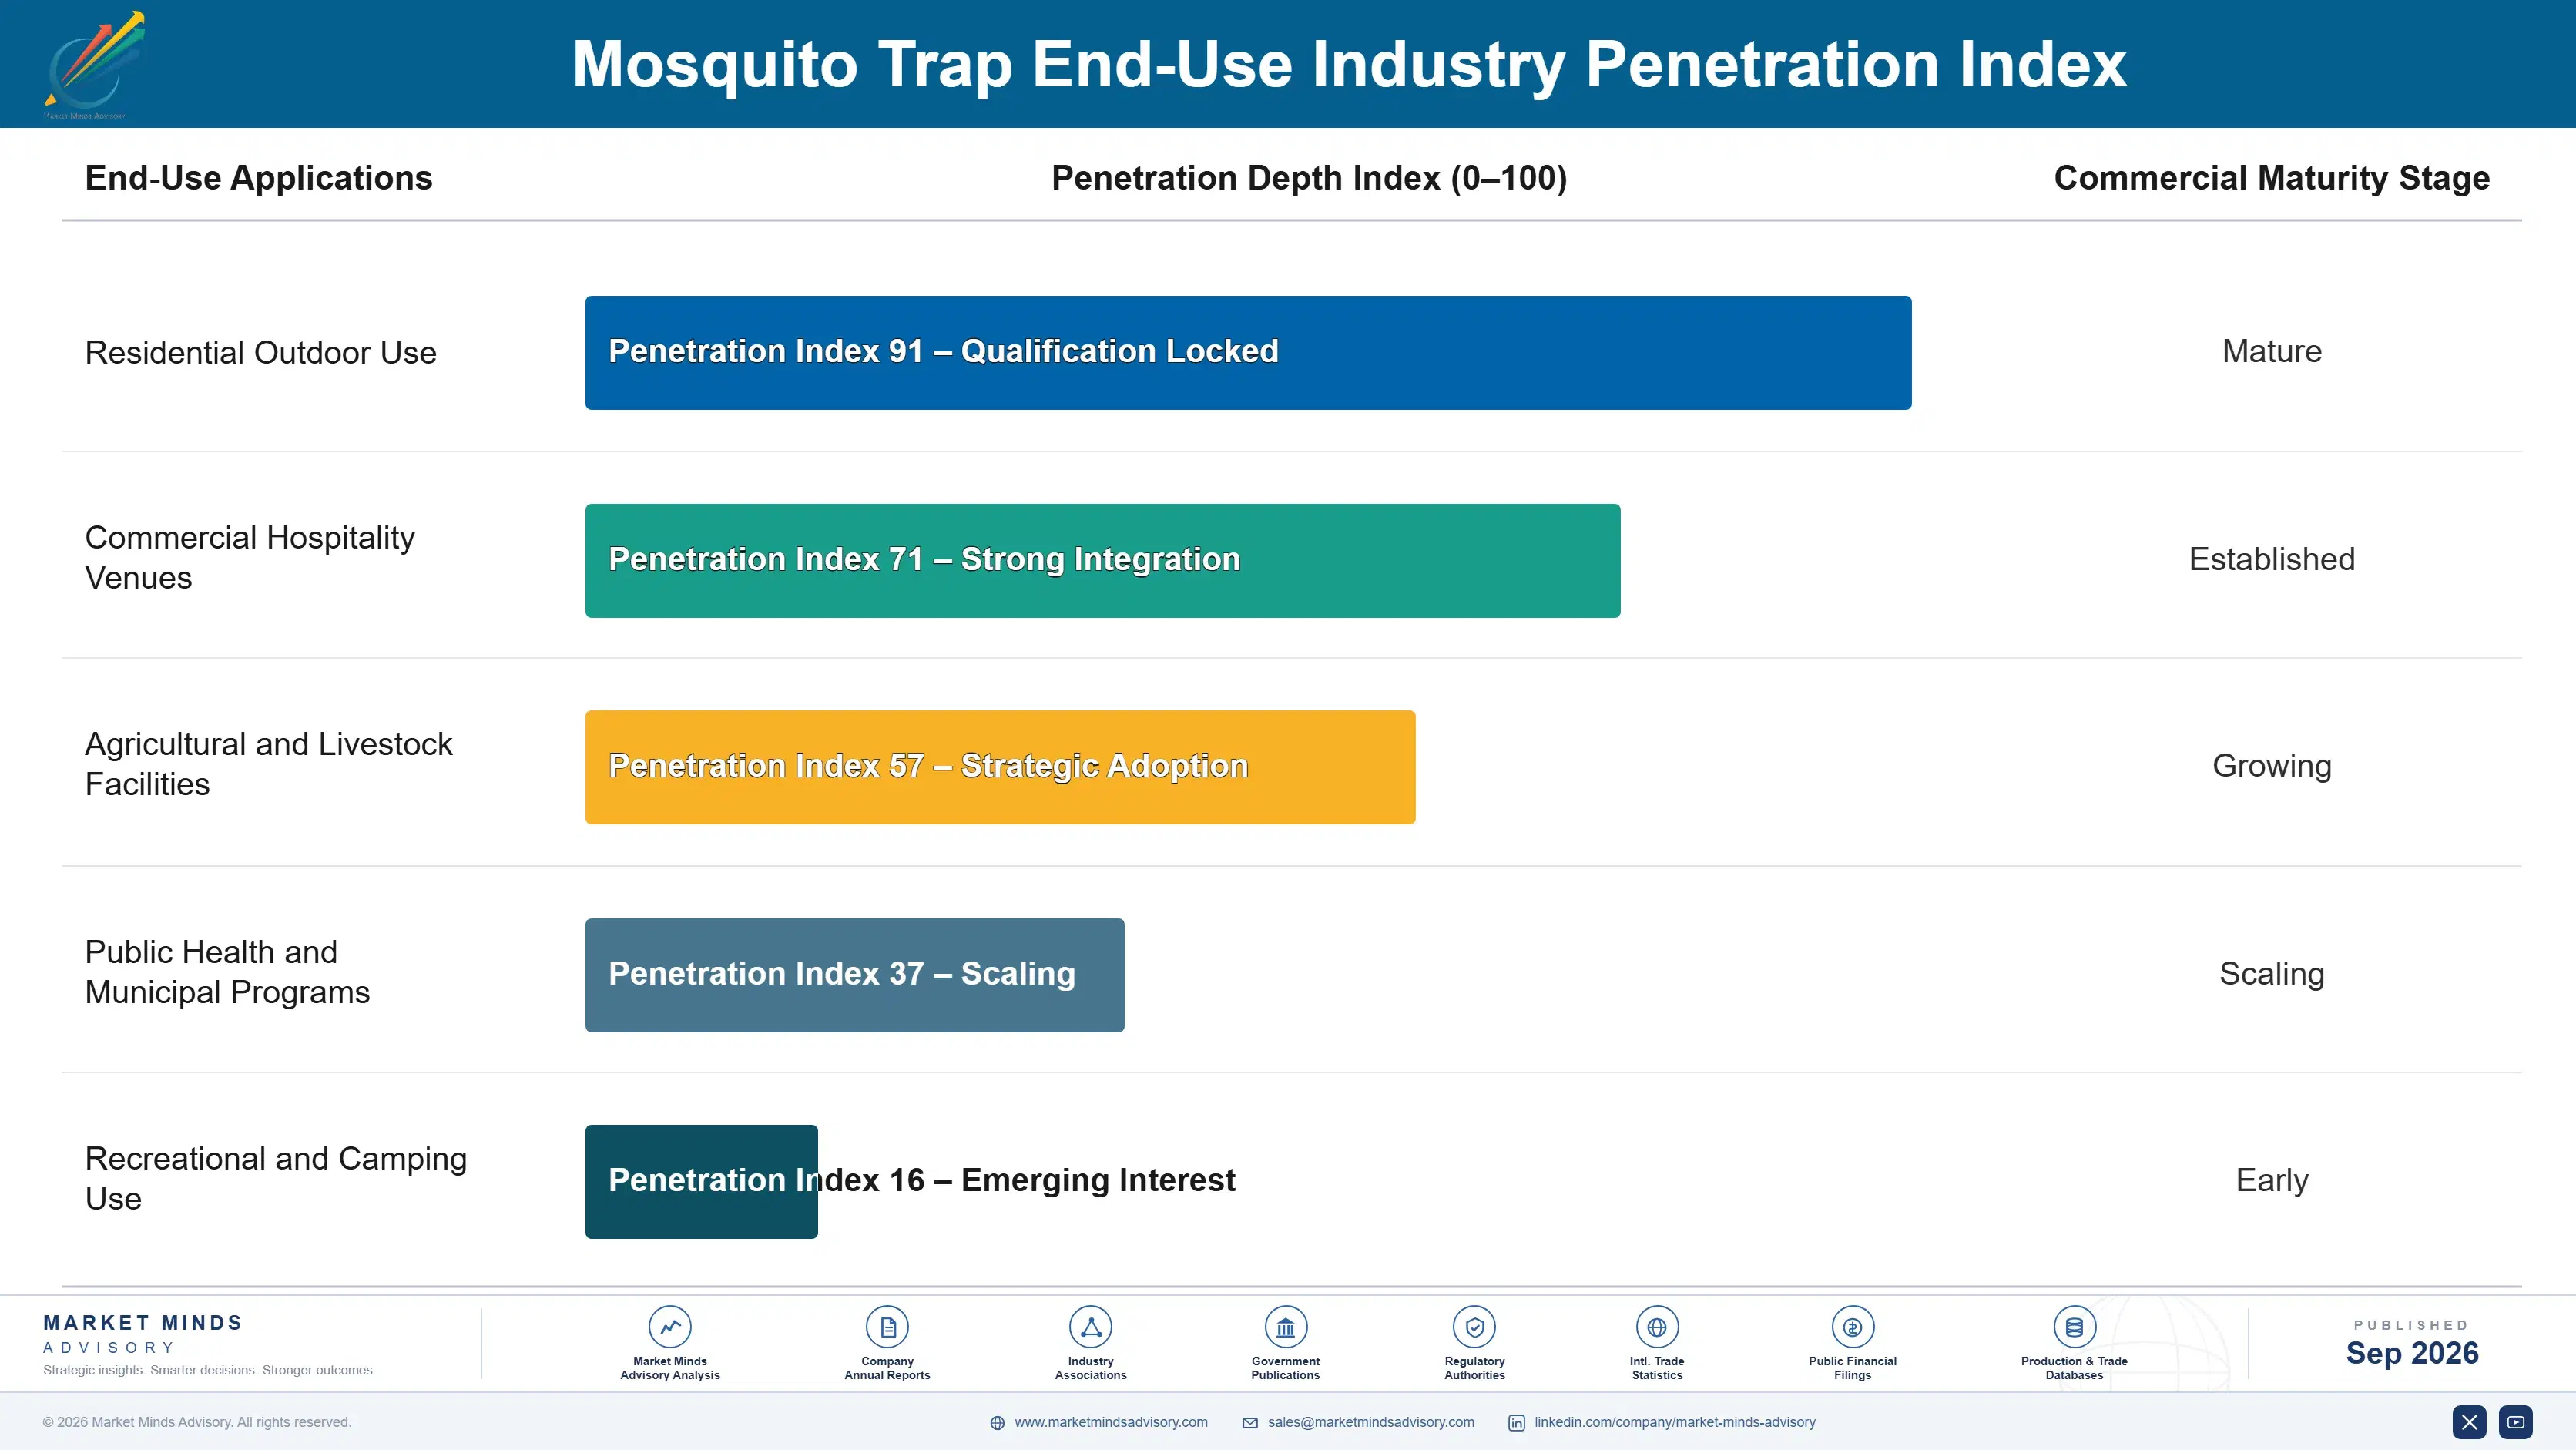
Mosquito trap demand behaves less like a one-time purchase and more like a recurring seasonal commitment, since attractant cartridges and sensor components require regular replacement throughout each mosquito season regardless of the initial device purchase decision. This repeat-purchase pattern gives manufacturers a revenue annuity that basic zapper sales alone cannot generate, anchored to genuine seasonal maintenance needs rather than one-off transactional demand.
Adoption depth varies meaningfully by end-use vertical: households in high-disease-burden regions integrate trap usage deeply into daily outdoor safety routines, while households in lower-risk temperate regions experiment more casually, activating traps only during peak summer months. Commercial hospitality and outdoor dining venues occupy a distinct segment entirely, prioritizing guest comfort and pest control compliance over cost considerations. Manufacturers increasingly build product lines specifically calibrated to these distinct usage intensity and disease risk segments.

Generational shifts are reshaping the buyer profile underlying this category. Younger consumers who grew up with connected home technology treat app-based capture monitoring as an expected baseline feature rather than a premium add-on, driving purchase decisions that skew toward connectivity over pure kill mechanism specification. Older buyers, by contrast, weigh simplicity and proven reliability more heavily and remain comparatively resistant to unfamiliar smart features.
mosquito-trap-market-end-use-penetration-index-1790016108272

Smart Pest Control Strategic Priorities

These are among the four positions where our research anticipates prominent divergence between winners and laggards over the coming forecast period. Each is grounded in the demand model, the regulatory perimeter, and the announced capacity pipeline.
01 / SMART PORTFOLIO EXPANSION

Prioritize Sensor Technology Development Investment

Manufacturers should prioritize expanding sensor and connectivity development over incremental basic zapper line extensions, since smart connected traps carry both the fastest growth rate and the widest margin in the category. Early movers on reliable sensor technology are already capturing disproportionate share among safety-conscious households who value documented capture performance over marginal design differences alone. Delaying this investment risks ceding the category's most valuable customer relationships to faster-moving specialty challengers already building sensor expertise competitors will find difficult to replicate quickly.
02 / CAPTURE DATA TRANSPARENCY

Publish Third-Party Capture Performance Data

Manufacturers still relying on generic effectiveness marketing claims are missing the meaningful premium pricing power that published capture performance data consistently commands across comparable competing product formulations and technologies. Building dedicated testing partnerships with recognized laboratories captures pricing that unsubstantiated competitor products cannot sustain, while strengthening negotiating position with retailers seeking genuine differentiation from competing brands. Brands slow to act risk losing preferred shelf placement and co-marketing support to faster-moving competitors already pursuing this strategy across multiple specialty retail partners simultaneously.
03 / SEASONAL REVENUE DIVERSIFICATION

Expand Into Tropical and Subtropical Markets

Manufacturers concentrated primarily in temperate seasonal markets are exposed to revenue concentration risk that year-round tropical and subtropical demand patterns do not share to the same degree at all. Building distribution and manufacturing presence across South Asia and Pacific and Latin American markets now positions manufacturers to capture consistent year-round demand before competitors establish comparable local relationships there. This diversification strategy also meaningfully reduces overall category exposure to any single region's seasonal weather patterns, demand timing and regulatory environment considerably.
04 / SUBSCRIPTION REVENUE MODELS

Build Attractant Subscription Infrastructure Immediately

Manufacturers without subscription replenishment programs for attractant cartridges and sensor components are missing a meaningful retention and lifetime value opportunity that competitors are already capturing across the category. Building this infrastructure now, well ahead of broader category adoption, secures recurring revenue relationships before competitors normalize subscription as the expected purchasing model for premium smart trap products across every major market. Early movers also gain first-party usage data that sharpens future product development decisions considerably more effectively than competitors relying solely on retail point-of-sale data.

Engagement Snapshot From the Field

A live engagement with an industry participant carrying material or product regulatory and market exposure ahead of a defining policy shift, showing how our research translates into a defensible multi-year portfolio strategy.
MARKET MINDS ADVISORY · CLIENT ENGAGEMENT SUMMARY
Mosquito Trap Producer Strategic Portfolio Review and Transition Roadmap 2026·Investment Scenario on Mosquito Trap Exposure Evaluation 2025-26
CLIENT PROFILE
The client is a mid-tier pest control manufacturer generating annual revenue in the low hundreds of millions of dollars (client-reported, unverified by MMA), competing primarily in basic zapper categories against larger established brands with deeper sensor technology expertise and broader specialty retail distribution. The client sought an independent assessment of its smart trap entry strategy ahead of its next fiscal year planning cycle.
STRATEGIC CHALLENGE
The client had no sensor-enabled products and was losing shelf space and technology-conscious customers to specialty competitors with established connectivity expertise. Leadership needed a category entry strategy that could compete credibly without years of accumulated sensor research that larger specialists had already invested. Board-level pressure to close this gap within one year added urgency to the engagement.
MMA APPROACH
MMA conducted primary interviews with sensor technology engineers and specialty retail buyers to identify viable partnership and licensing paths into connectivity technology the client could pursue without ground-up development. The engagement modeled expected returns under multiple entry structures against the client's existing distribution capacity and brand positioning. Findings were validated against MMA's proprietary primary research dataset covering technology licensing terms across the sector.
KEY FINDINGS
  1. Sensor platform licensing from established connectivity technology providers offered a faster path to market than ground-up development, cutting time to launch by roughly a year (client-reported, unverified by MMA).
  2. Specialty retailers showed willingness to grant trial shelf space to new smart entrants when paired with committed marketing spend and demonstration units.
  3. Direct-to-consumer subscription infrastructure delivered a faster path to smart trap credibility than pursuing broad retail distribution immediately upon launch. This channel investment paid back within the first year.
  4. Bundled outdoor living sets outperformed standalone smart trap launches on both margin and customer retention metrics across comparable competitor product lines (client-reported, unverified by MMA).
CLIENT PROFILE
The client is a mid-tier pest control manufacturer generating annual revenue in the low hundreds of millions of dollars (client-reported, unverified by MMA), competing primarily in basic zapper categories against larger established brands with deeper sensor technology expertise and broader specialty retail distribution. The client sought an independent assessment of its smart trap entry strategy ahead of its next fiscal year planning cycle.
STRATEGIC CHALLENGE
The client had no sensor-enabled products and was losing shelf space and technology-conscious customers to specialty competitors with established connectivity expertise. Leadership needed a category entry strategy that could compete credibly without years of accumulated sensor research that larger specialists had already invested. Board-level pressure to close this gap within one year added urgency to the engagement.
MMA APPROACH
MMA conducted primary interviews with sensor technology engineers and specialty retail buyers to identify viable partnership and licensing paths into connectivity technology the client could pursue without ground-up development. The engagement modeled expected returns under multiple entry structures against the client's existing distribution capacity and brand positioning. Findings were validated against MMA's proprietary primary research dataset covering technology licensing terms across the sector.
KEY FINDINGS
  1. Sensor platform licensing from established connectivity technology providers offered a faster path to market than ground-up development, cutting time to launch by roughly a year (client-reported, unverified by MMA).
  2. Specialty retailers showed willingness to grant trial shelf space to new smart entrants when paired with committed marketing spend and demonstration units.
  3. Direct-to-consumer subscription infrastructure delivered a faster path to smart trap credibility than pursuing broad retail distribution immediately upon launch. This channel investment paid back within the first year.
  4. Bundled outdoor living sets outperformed standalone smart trap launches on both margin and customer retention metrics across comparable competitor product lines (client-reported, unverified by MMA).
RECOMMENDED STRATEGY
Phase 1: Phase one: license proven sensor connectivity technology from an established provider rather than pursuing costly ground-up development internally, preserving capital. Phase 2: Phase two: launch through select specialty retail partners with demonstration support to build early smart trap category credibility and awareness. Phase 3: Phase three: expand into bundled outdoor living sets once initial smart credibility is established with early adopter customers and retail partners.
OUTCOME
Within eighteen months of implementation, the client launched a full smart-connected trap line and grew smart-attributable revenue to 18 percent of total brand revenue (client-reported, unverified by MMA), while specialty retail distribution expanded to cover most major national chains previously unavailable to the brand. Leadership credited the licensing-first approach with materially compressing time to market.

Frequently Asked Questions

Foundational context covering the market sizes, CAGR, scope, country, region and competition that inform every finding below. This section is provided to cover basics and most often pre-purchase conversations, answered from the MMA Primary Research Dataset.

What is the current size of the Mosquito Trap Market?

The global mosquito trap market was valued at 1.4 billion dollars in 2025. This figure covers UV light, CO2-emitting, electric zapper, chemical attractant, suction and smart connected devices worldwide.

How large will the Mosquito Trap Market be by 2036?

The market is projected to reach 3.43 billion dollars by 2036. This represents a 2.26 times expansion over the eleven year forecast period from 2026 through 2036.

What is the CAGR for the Mosquito Trap Market 2026 to 2036?

The market is forecast to grow at a compound annual growth rate of 8.5 percent between 2026 and 2036. Bull and bear scenarios range between 7.2 and 9.8 percent respectively.

Which segment is growing fastest?

Smart connected traps are growing fastest, at a 13.0 percent CAGR, roughly 1.53 times the overall market growth rate. This segment benefits from rising vector-borne disease awareness and connectivity adoption.

Who are the major companies in the Mosquito Trap Market?

Spectrum Brands, Woodstream, Bite Shield, Mosquito Magnet and Thermacell lead the market, together holding an estimated 41 percent combined share. Spectrum Brands and Woodstream hold the largest combined revenue share among the five.

Which country is growing fastest?

India is growing fastest, at an 11.0 percent CAGR, driven by elevated disease burden and rising disposable income. This closely tracks the broader South Asia and Pacific regional growth rate.

Report Segmentation Architecture

The full report scope spans multiple orthogonal segmentation dimensions, with cross-tabulated demand data provided for each dimension pair. Coverage extends further to regional breakdowns, trend trajectories, and the competitive detail needed to support segment-level decision-making.

By Primary Market Dimension

  • UV Light Attractant Traps
  • CO2-Emitting Traps
  • Electric Zapper Traps
  • Chemical Attractant Traps
  • Suction-Based Traps
  • Smart Connected Traps

By End-Use Industry

  • Residential Outdoor Use
  • Commercial Hospitality Venues
  • Agricultural and Livestock Facilities
  • Public Health and Municipal Programs
  • Recreational and Camping Use

By Commercial Dimension

  • Individual Consumer Purchase
  • Subscription Refill Programs
  • Bundled Outdoor Living Sets
  • Institutional Bulk Supply

By Region

  • North America
  • Western Europe
  • East Asia
  • South Asia and Pacific
  • Latin America
  • Middle East and Africa
  • Eastern Europe

Scope, Methodology, and Coverage

Every figure in this report is reproducible from documented input assumptions. The scope below maps the historical period, the forecast horizon, the segmentation dimensions, and the countries covered, alongside the underlying primary and qualitative methodology.
Historical Period
2020 to 2025
Forecast Period
2026 to 2036
Base Year
2025 (USD billions; MMA Primary Research Dataset, September 2026)
Market Definition
The mosquito trap market covers UV light attractant, CO2-emitting, electric zapper, chemical attractant, suction and smart connected devices designed to capture or kill mosquitoes outdoors. It excludes chemical repellent sprays and lotions, indoor insect screens, and general pesticide products not specifically designed as trapping devices.
Quantitative Units
USD Billion
Segmentation Dimensions
Technology type, end-use application, commercial model, region
Regions Covered
North America, Western Europe, East Asia, South Asia and Pacific, Latin America, Middle East and Africa, Eastern Europe
Countries Covered
United States, Canada, Germany, France, United Kingdom, China, Japan, South Korea, India, Australia, Brazil, Mexico, United Arab Emirates, Saudi Arabia, South Africa, Poland, Russia
Key Companies Profiled
Spectrum Brands, Woodstream, Bite Shield, Mosquito Magnet, Thermacell, Bird-X, Dynatrap, Gardner Manufacturing, Aspectek, Katchy, Vensmile, Executioner, Raid Outdoor, Bug-A-Salt, Solar Guard, Aeroguard, Gnat Stop, Skeeter Vac, Trapstar, Bugzooka
Quantitative Methodology
Primary survey, n=3,800 respondents, Q4 2025, six countries; demand-side model with trade association cross-validation
Qualitative Methodology
47 expert interviews, Q4 2025; applied to validate demand model assumptions, identify emerging dynamics, and assess competitive positioning
Report Format
PDF and XLSX data workbook (Word format preview document)
Publisher
Market Minds Advisory
Report Code
MMA-2026-CON-402
Published
September 2026
Contact
sales@marketmindsadvisory.com | www.marketmindsadvisory.com

Purchase the full Mosquito Trap Market Report (2026 to 2036).

This report provides a comprehensive assessment of the global mosquito trap market, covering market sizing, segmentation, competitive positioning and regional demand patterns through 2036. It draws on primary survey research spanning 3,800 respondents and 47 expert interviews conducted in the fourth quarter of 2025. The analysis examines sensor technology economics, capture data adoption cycles and emerging subscription revenue models reshaping brand strategy. Readers gain a structured view of where competitive advantage concentrates and how it is likely to shift going forward. The report also flags where established manufacturers face the greatest risk of disruption from faster-moving specialty smart device brands.
Ten-year global market sizing and forecast
Six-segment MECE market breakdown and framework
Seven-region demand and growth pattern analysis
Competitive benchmarking across twenty profiled companies
Smart trap revenue model and lever assessment
Anonymized client licensing engagement case study

Built For The People Who Decide

From boardroom strategy to bench-side execution, this report is read cover-to-cover by leaders shaping the next decade of their industry, turning demand scenarios, market dynamics and valuation benchmarks into decisions.
CXOs/ Presidents/ VPs/ Managers
M&A and Corporate Development
Strategy Teams and R&D Heads
Procurement and Product Directors
Regulatory and Compliance Leaders
Investor Relations and Equity Analysts