Market Minds Advisory
Monocrystalline Solar Cell Market

Monocrystalline Solar Cell Market: Monocrystalline Solar Cell Market: Technology Transition Reshapes Manufacturing Economics

TOPCon and heterojunction technology transitions are rewriting monocrystalline cell manufacturing economics, reshaping which producers can compete on efficiency rather than scale alone across every major consuming market this decade and beyond.

Lead Analyst

Published

October 2026

Make Smarter Decisions with Customized Research Insights

Request a free sample report and evaluate market opportunities, growth trends, and competitive dynamics relevant to your business needs.

2025 MARKET VALUE$42.0BMarket Size 2025
2036 FORECAST VALUE$126.0BBase Case , 2026 to 2036
CAGR 2026 TO 203610.5 %Bull 11.8% / Bear 9.2%
INCREMENTAL OPPORTUNITY$79.6BNet 10- year value creation
EXPANSION MULTIPLE2.71x2036 value over 2026 base
Strategic Levers
M&A Pipeline
Regional Outlook
Country Rankings
Competitive Intelligence
Segmental Deep-dive
Call-Us : 91 93563 13602

Executive Snapshot and Market Trajectory.

TOPCon and heterojunction cell technology has moved from pilot production to mainstream manufacturing fast enough that producers still running older PERC lines are losing utility-scale contracts on efficiency alone. Buyers with early allocation are capturing projects slower rivals cannot. today. now.
Utility-scale procurement remains the dominant commercial force shaping cell demand, pulled forward by continued renewable capacity auctions across major markets. East Asian manufacturers supply the overwhelming majority of global cell output while India's domestic manufacturing incentive program builds meaningful capacity outside China for the first time at real scale. Capacity utilization gaps between TOPCon and legacy PERC lines are already stretching margin differentials at several major producers this cycle. now.
Competition spans a genuinely concentrated field where five Chinese producers hold well over half of global revenue, and smaller challengers compete hard on specialized bifacial and building-integrated designs rather than commodity volume. Expanding agrivoltaic deployment and tightening efficiency standards are pulling more of the replacement cycle toward next-generation cell architectures every year. Established PERC-focused brands that delay technology transition risk ceding utility specification share to newer entrants permanently. Buyers now expect bifacial gain documentation.
Market Definition
This report covers monocrystalline silicon photovoltaic cells used in utility-scale, residential, commercial and specialized solar applications, including PERC, TOPCon and heterojunction cell architectures. It excludes polycrystalline silicon cells, thin-film photovoltaic technologies and finished module assembly sold separately from cell production.
Base Year Value
$42.0B in 2025 (MMA Primary Research Dataset, October 2026)
Forecast Period
2026 to 2036, eleven discrete annual values
CAGR
10.5% base case. Bull 11.8%. Bear 9.2%.
Fastest Growth Segment
Agrivoltaic and Floating Solar Cells: 14.7% CAGR
Fastest Growth Country
India: 12.5% CAGR
Fastest Growth Region
South Asia and Pacific: 12.5% CAGR
Largest Region
East Asia: 72% of 2025 global value
Market Leaders
LONGi Green Energy, JinkoSolar Holding, Trina Solar, JA Solar Technology, Canadian Solar Inc. Source: MMA Primary Research Dataset, July 2026.
Primary Survey
n=3,800 procurement and R&D decision-makers, Q4 2025, six countries
Methodology
Demand-side build-up, cross-validated against public data, 47 expert interviews

Monocrystalline Solar Cell Market Forecast Scenarios

monocrystalline-solar-cell-market-size-forecast-scenario-1790920283075
Between 2020 and 2025 the monocrystalline solar cell market grew at a 9.0 percent annual rate, propelled by sustained utility-scale deployment growth and a first wave of PERC-to-TOPCon technology conversion across major Chinese manufacturing bases. Polysilicon price volatility during 2022 briefly compressed margins across the supply chain. Producers with diversified feedstock sourcing weathered that volatility more comfortably than single-source competitors.
The base case assumes 10.5 percent annual growth through 2036, built on three mechanisms: continued utility-scale renewable auction growth across major consuming markets, accelerating heterojunction and TOPCon technology adoption replacing legacy PERC capacity, and expanding agrivoltaic and floating solar deployment opening new land-constrained markets. Building-integrated photovoltaic applications add a smaller fourth tailwind as architects increasingly specify solar-active facade materials in new commercial construction. This fourth driver remains smaller than the other three but is growing steadily each year.
A bull case near 11.8 percent hinges on faster-than-expected technology transition pulling replacement demand forward across major manufacturing bases. The bear risk, closer to 9.2 percent, is slower utility-scale auction activity if trade policy disputes disrupt established cross-border supply chains. Neither scenario assumes a sudden reversal of existing renewable procurement mandates already enacted across major consuming governments worldwide.

Technology Transition Redraws Manufacturing Economics

TOPCon cell architecture now ships in a majority of new production capacity, a reversal from just three years ago when PERC designs still dominated nearly every manufacturing base outside premium heterojunction pilot lines. Conversion economics increasingly determine which producers remain competitive on efficiency-adjusted pricing. Price premiums for TOPCon designs over legacy PERC equivalents have narrowed considerably as production volume scales industry-wide across major manufacturing bases.
MARKET CONCENTRATIONCR5 58%Top five producers together hold this combined output share
AVERAGE SELLING PRICE$0.04/wattBlended figure across PERC and TOPCon cell grades
TOP PRODUCING COUNTRYChina 81%Share of global cell output from domestic manufacturing plants
CAPACITY UTILIZATION76%Average rate across major cell manufacturing facilities currently
TRADE INTENSITY64%Share of cells crossing a border before final module assembly
POLYSILICON COST SHARE35%Portion of unit cost from refined polysilicon feedstock
Manufacturing remains overwhelmingly concentrated in China, where polysilicon, wafer and cell production cluster around integrated manufacturing hubs that smaller regional producers cannot easily replicate. India's domestic manufacturing incentive program is building meaningful capacity outside China for the first time at real commercial scale. Freight costs matter less for compact cell shipments bundled with module assembly destined for distant installation markets.
Utility buyers increasingly specify bifacial gain and temperature coefficient performance rather than nameplate efficiency alone, since a cell's real-world energy yield depends heavily on these secondary characteristics in actual deployment conditions. This has pushed several major producers toward bundled performance warranty and degradation guarantee offerings. Warranty claim rates have fallen as producers gain more experience with next-generation cell architecture durability specifically.
"Nameplate efficiency stopped being the only specification that mattered years ago, and producers still competing purely on headline wattage are losing utility contracts to competitors selling documented bifacial yield instead."
Senior Analyst, Solar Technology Practice · MMA Energy Practice · October 2026

Market Trends

TOPCon Architecture Becomes Default Utility-Scale Specification

Utility-scale buyers increasingly default to TOPCon cell architecture over legacy PERC designs, driven by meaningfully higher conversion efficiency and better bifacial gain performance that improves real-world energy yield across large installation portfolios. Roughly 68 percent of new utility-scale cell procurement specified TOPCon architecture in 2025, up from under 25 percent three years earlier, as buyers prioritize the yield improvement these designs provide. This shift is reshaping capacity investment decisions across nearly every major manufacturing base serving utility customers specifically. Producers still running older PERC-only lines without a TOPCon conversion roadmap are losing utility specification share faster than expected.
Market Impact: Grew 16 percent in 2025

Indian Manufacturing Incentive Program Builds Capacity Outside China

India's production-linked incentive program is building substantial domestic cell manufacturing capacity for the first time at commercial scale, reducing the country's historical dependence on Chinese cell imports for its own renewable auction programs. Domestic Indian cell capacity grew roughly 45 percent in 2025 alone, the fastest expansion rate of any non-Chinese manufacturing base globally as the incentive program reaches its planned capacity targets ahead of schedule this cycle. International manufacturers are increasingly partnering with Indian producers to serve this rapidly expanding domestic capacity base directly. Adoption continues expanding steadily across most major Indian states.
Market Impact: Grew 24 percent in 2025

Market Opportunities and Growth Drivers

Utility-Scale Renewable Auctions Sustain Volume Demand

Continued utility-scale renewable energy auctions across major consuming markets sustain substantial volume demand for monocrystalline cells, as grid operators continue procuring new solar capacity to meet decarbonization targets set by their respective governments. Auction-tied cell demand grew roughly 16 percent in 2025, outpacing general residential and commercial demand growth meaningfully as large-scale procurement programs continue expanding across multiple major consuming regions this year and next. Suppliers serving this niche increasingly offer volume pricing tiers tailored specifically to large multi-gigawatt utility procurement programs across major consuming regions worldwide. Growth here shows no sign of slowing.
Market Impact: 35 percent cost from polysilicon

Agrivoltaic Deployment Expands Dual-Use Land Applications

Agricultural operators increasingly deploy monocrystalline cells in combined solar and farming configurations that preserve agricultural productivity while generating electricity, opening new land-constrained markets that traditional ground-mount installations cannot access. Agrivoltaic cell orders grew roughly 24 percent in 2025, reflecting the broader land-use efficiency trend across several major agricultural regions pursuing dual revenue streams this decade and beyond. Agricultural cooperatives increasingly view dual-use deployment as a competitive differentiator against purely ground-mount installations across their land holdings nationwide. Momentum continues building steadily across most major agricultural markets worldwide this coming year. Indeed.
Market Impact: Tariffs add 18 percent to costs

Market Restraints and Challenges

Polysilicon Price Volatility Compresses Manufacturer Margins

Polysilicon represents roughly 35 percent of cell unit cost, and price swings in refined polysilicon markets pass through to cell pricing faster than downstream module buyers can adjust their own procurement contracts. The root cause is concentrated polysilicon refining capacity serving the entire global solar supply chain, leaving cell producers exposed to supply disruptions at just a handful of major refineries. Margin compression during 2022's polysilicon price surge forced several smaller producers to defer planned capacity expansion. Larger producers are extending vertical integration to control this exposure. going forward. going forward.
Market Impact: 68 percent of orders now TOPCon

Trade Policy Disputes Disrupt Cross-Border Supply Chains

Trade policy disputes between major consuming governments and Chinese manufacturers have periodically disrupted established cross-border supply chains, forcing buyers to requalify alternative sourcing arrangements on short notice. The root cause is geopolitical tension around manufacturing concentration that predates the current trade dispute cycle by years. Tariff actions have added costs averaging roughly 18 percent on affected import volumes. Buyers are responding by diversifying sourcing toward non-Chinese manufacturing bases where available. Early diversification results suggest meaningful supply chain resilience improvement for buyers who moved proactively on this front. going forward this cycle.
Market Impact: Grew 45 percent in 2025
3 additional market trends, 2 additional growth drivers, and 4 additional restraints and challenges are covered in the full report. Contact sales@marketmindsadvisory.com to access the complete intelligence.

Segment CAGR and Growth Architecture

The market splits into six application segments defined by end-use deployment context. Agrivoltaic and building-integrated segments lead near-term growth while utility and residential segments anchor the steady volume manufacturers depend on through the cycle currently overall. Utility-scale, residential and commercial industrial applications round out the remaining four segments by scale. now overall. indeed. too.
monocrystalline-solar-cell-market-market-share-analysis-1790920283388

Agrivoltaic and Floating Solar Cells

Combined solar and agricultural or water-surface deployment configurations have moved from an experimental niche to a genuine commercial category as land-constrained markets seek dual-use installations that preserve agricultural productivity or reservoir function while generating electricity. Agricultural cooperatives and water utilities increasingly view this deployment model as a competitive differentiator against purely ground-mount installations requiring dedicated land acquisition. LONGi Green Energy and JinkoSolar lead supply into this segment given their established project engineering relationships across multiple agricultural and water management markets. Growth here is expected to keep outpacing every other segment through the forecast window. Certification backlogs remain the primary constraint on how fast broader dual-use adoption can proceed across markets.
CAGR 14.7%

Building-Integrated Photovoltaic Cells

Architects increasingly specify solar-active facade and roofing materials that integrate cell technology directly into building envelope components, replacing conventional cladding with electricity-generating surfaces across new commercial construction. These installations typically specify customized cell dimensions and aesthetic finishes rather than the standardized rectangular panels common in ground-mount and rooftop applications. Trina Solar and Canadian Solar hold strong positions here given their established architectural partnership relationships. Demand growth tracks the broader green building certification boom alongside genuine cell-specific adoption momentum. Research institutions and government buildings show a similar pattern, specifying solar-active facade components for new public infrastructure projects across several major metropolitan markets worldwide. Growth continues here steadily across most regions. now.
CAGR 12.6%
Full segment breakdown across 7 segments available in the complete report.

Regional Architecture and Country Demand Map

East Asia's integrated polysilicon-to-cell manufacturing base concentrates the overwhelming majority of global output, a pattern no other region approaches given decades of coordinated industrial policy and capital investment specific to China's solar manufacturing base. India's incentive program is the most significant challenge to this concentration emerging anywhere globally.

North America

United States manufacturing remains limited relative to East Asia's scale, reflecting decades of concentrated investment that domestic cell producers have struggled to match despite federal manufacturing incentives announced in recent years. Utility-scale deployment demand remains strong regardless of where cells are manufactured, pulled forward by continued renewable procurement across major utility territories. Canadian demand follows a similar but smaller pattern, concentrated in utility-scale projects serving provincial renewable targets. Mexico trails both neighbors considerably on manufacturing capacity currently underway nationwide. Utility-sponsored resilience programs in several states are beginning to subsidize domestic production facilities. This pattern remains consistent across most major metropolitan utility markets currently underway nationwide today. Investment continues. now. too.
Share: 10% | CAGR: 10.0% (2026 to 2036)

Western Europe

Germany, Spain and Italy anchor regional demand, though domestic cell manufacturing capacity remains thin relative to installation volume, leaving the region dependent on East Asian imports for the large majority of cell supply. European Union manufacturing resilience initiatives are beginning to fund limited domestic capacity, though scale remains modest compared to Asian production hubs. Utility-scale and rooftop residential demand both continue growing steadily across most member states. Scandinavian markets add a smaller but notable premium rooftop contribution given high per-capita renewable adoption there. Southern Europe leads on utility-scale irradiance advantages. Italy and Spain round out the region's remaining demand reasonably well across most categories currently. Investment remains steady. now. too.
Share: 6% | CAGR: 9.0% (2026 to 2036)
Regional intelligence for 5 additional markets available in the complete report: East Asia, South Asia and Pacific, Latin America, Middle East and Africa, Eastern Europe. Contact sales@marketmindsadvisory.com.
monocrystalline-solar-cell-market-country-cagr-analysis-1790920283718

Capturing Value Beyond Commodity Cell Pricing

Three commercial moves let producers capture more value from the technology transition than cell sales alone would deliver. Each targets a different point in the buyer relationship, from performance warranties to dual-use project engineering services available today. Producers that execute on all three simultaneously tend to outgrow peers still selling only commodity cell volume.

Bifacial Performance Warranty Programs for Utility Buyers

Offering extended performance warranties that guarantee documented bifacial gain and degradation rates over the project lifetime removes the uncertainty that otherwise deters utility buyers from paying a premium for next-generation cell architecture. Utility buyers increasingly compare these guarantees directly against standard warranty terms lacking any comparable performance assurance. Producers offering this structure report winning roughly 21 percent more utility-scale contracts than competitors without comparable guarantees. Several producers are now expanding this warranty structure to cover building-integrated applications as well. Early feedback from utility buyers has been consistently positive across most major procurement programs.
Market Impact: Wins roughly 21 percent more utility deals now

Agrivoltaic Project Engineering Consulting Services for Developers

Providing agrivoltaic and floating solar project engineering consulting services to agricultural cooperatives and water utilities navigating dual-use deployment design positions producers as trusted technical advisors rather than commodity cell suppliers competing purely on price. This relationship frequently converts into long-term cell supply contracts once the project developer completes its first successful installation. Producers offering this consulting approach report winning roughly 18 percent more dual-use project contracts. This consulting approach also simplifies the developer's broader permitting and land-use application process considerably. Momentum continues building across most major agricultural and water management markets currently.
Market Impact: Wins roughly 18 percent more project deals now

Priority Allocation Agreements for Technology Transition Buyers

Offering priority production allocation agreements to utility buyers willing to commit capital to next-generation TOPCon and heterojunction capacity ahead of actual project need lets producers capture demand certainty while buyers secure access to scarce advanced manufacturing capacity ahead of competitors facing the same technology transition queue. Producers offering this structure report capturing roughly 15 percent more advance orders than competitors. This structure also deepens the commercial relationship beyond a simple transactional purchase order arrangement. Adoption continues expanding steadily across most major technology transition programs worldwide. Momentum remains strong nationwide across most major consuming markets.
Market Impact: Captures roughly 15 percent more advance orders now

Who Controls the Margin Pool

Five Chinese producers hold roughly 58 percent of global revenue, a genuinely concentrated field that reflects decades of coordinated manufacturing scale-up and vertical integration few competitors outside China have matched. The gap between the leader and challengers is meaningful, since integrated polysilicon-to-cell capacity increasingly determines cost competitiveness more than brand alone. Market share shifts gradually as integration and technology leadership deepen, rather than through dramatic consolidation events.
Competitive activity currently centers on three dimensions: bifacial performance warranty programs that remove utility buyer uncertainty, agrivoltaic project engineering consulting that captures dual-use deployment contracts, and priority allocation agreements for technology transition buyers. Several producers are also expanding heterojunction capacity to defend efficiency leadership. Several producers have also expanded secondary polysilicon sourcing this cycle to protect production schedules from allocation shortages.

Emerging pressure is coming from Indian manufacturers entering a market previously dominated entirely by Chinese producers, winning domestic contracts on incentive eligibility even where their manufacturing scale lags established names considerably. Rankings could shift meaningfully over the next five years if these challengers close the cost competitiveness gap that currently protects incumbent Chinese positions. Established Chinese leaders are responding by committing to Indian joint ventures to defend market access.
monocrystalline-solar-cell-market-company-positioning-matrix-1790920284087

Competitive Moat and Risk Dimensions

LONGI GREEN ENERGY

Moat: Integrated Manufacturing Scale Depth

LONGi Green Energy's fully integrated polysilicon-to-module manufacturing base gives it cost advantages that non-integrated competitors cannot easily replicate across major production regions. This scale lets it undercut international competitors meaningfully on price while maintaining respectable margins, reinforcing its position as the world's largest cell producer by volume.
LONGI GREEN ENERGY

Risk: Thin Non-Chinese Manufacturing Presence

LONGi Green Energy's manufacturing footprint outside China remains limited relative to the scale needed to fully capture India's rapidly expanding domestic incentive-eligible demand. As trade policy disputes keep disrupting established supply chains, this gap could widen the revenue difference versus better-positioned non-Chinese competitors. LONGi is expanding Indian partnerships to address this exposure.
JINKOSOLAR HOLDING

Moat: Global Distribution Network Reach

JinkoSolar Holding's extensive global distribution network gives it market access that smaller regional producers cannot easily replicate across dozens of consuming countries simultaneously. This reach lets it serve utility buyers across multiple continents without switching supplier relationships, winning share on reliability and logistics convenience alone.
JINKOSOLAR HOLDING

Risk: Limited Agrivoltaic Engineering Depth

JinkoSolar Holding's dedicated agrivoltaic project engineering offering remains less developed than specialized dual-use deployment competitors, limiting its share of this fast-growing niche segment specifically. As agrivoltaic demand keeps expanding, this gap could cap its overall segment diversification relative to more broadly positioned competitors. JinkoSolar has not yet announced a dedicated response to close this gap.

Players Tracked

Prominent Players

LONGi Green Energy
JinkoSolar Holding
Trina Solar
JA Solar Technology
Canadian Solar Inc

Other Key Players

Hanwha Q Cells
First Solar Inc
Risen Energy
Suntech Power
GCL System Integration
Shunfeng Photovoltaic
Tongwei Solar
Astronergy
Boviet Solar
Meyer Burger Technology
REC Group
Qcells North America
Waaree Energies
Adani Solar
Vikram Solar

Recent Developments

JANUARY 2026

LONGi Launches Bifacial Warranty Program

LONGi Green Energy launched a new extended performance warranty program for its TOPCon cell line, targeting large utility customers seeking documented bifacial gain guarantees over project lifetimes. The launch includes a bundled degradation monitoring service offered at no additional cost. Distributors expect strong uptake across multiple utility accounts.
Signal: Signals LONGi's push to build recurring warranty revenue ahead of competitors still selling cells alone without comparable guarantees
AUGUST 2025

JinkoSolar Expands Heterojunction Production Capacity

JinkoSolar Holding announced an organic capacity expansion at its domestic Chinese manufacturing facility to add heterojunction cell production lines, targeting rising demand from premium utility and commercial customers. The expansion reaches full output within twelve months, ahead of the original schedule. Demand remains strong across most major premium customer segments.
Signal: Signals anticipated growth in premium heterojunction cell demand across multiple consuming markets simultaneously this decade going forward
APRIL 2026

Trina Solar Signs Agrivoltaic Engineering Partnership

Trina Solar signed a multi-year engineering consulting partnership with a major agricultural cooperative network covering dual-use deployment design across several thousand hectares. The agreement does not constitute a joint venture, and Trina expects to extend it to additional cooperatives within two years. Trina expects continued interest from additional cooperative networks.
Signal: Signals growing producer interest in bundled engineering and cell supply relationships across agrivoltaic deployment markets across the continent

Polysilicon Feedstock Exposure Across Producers

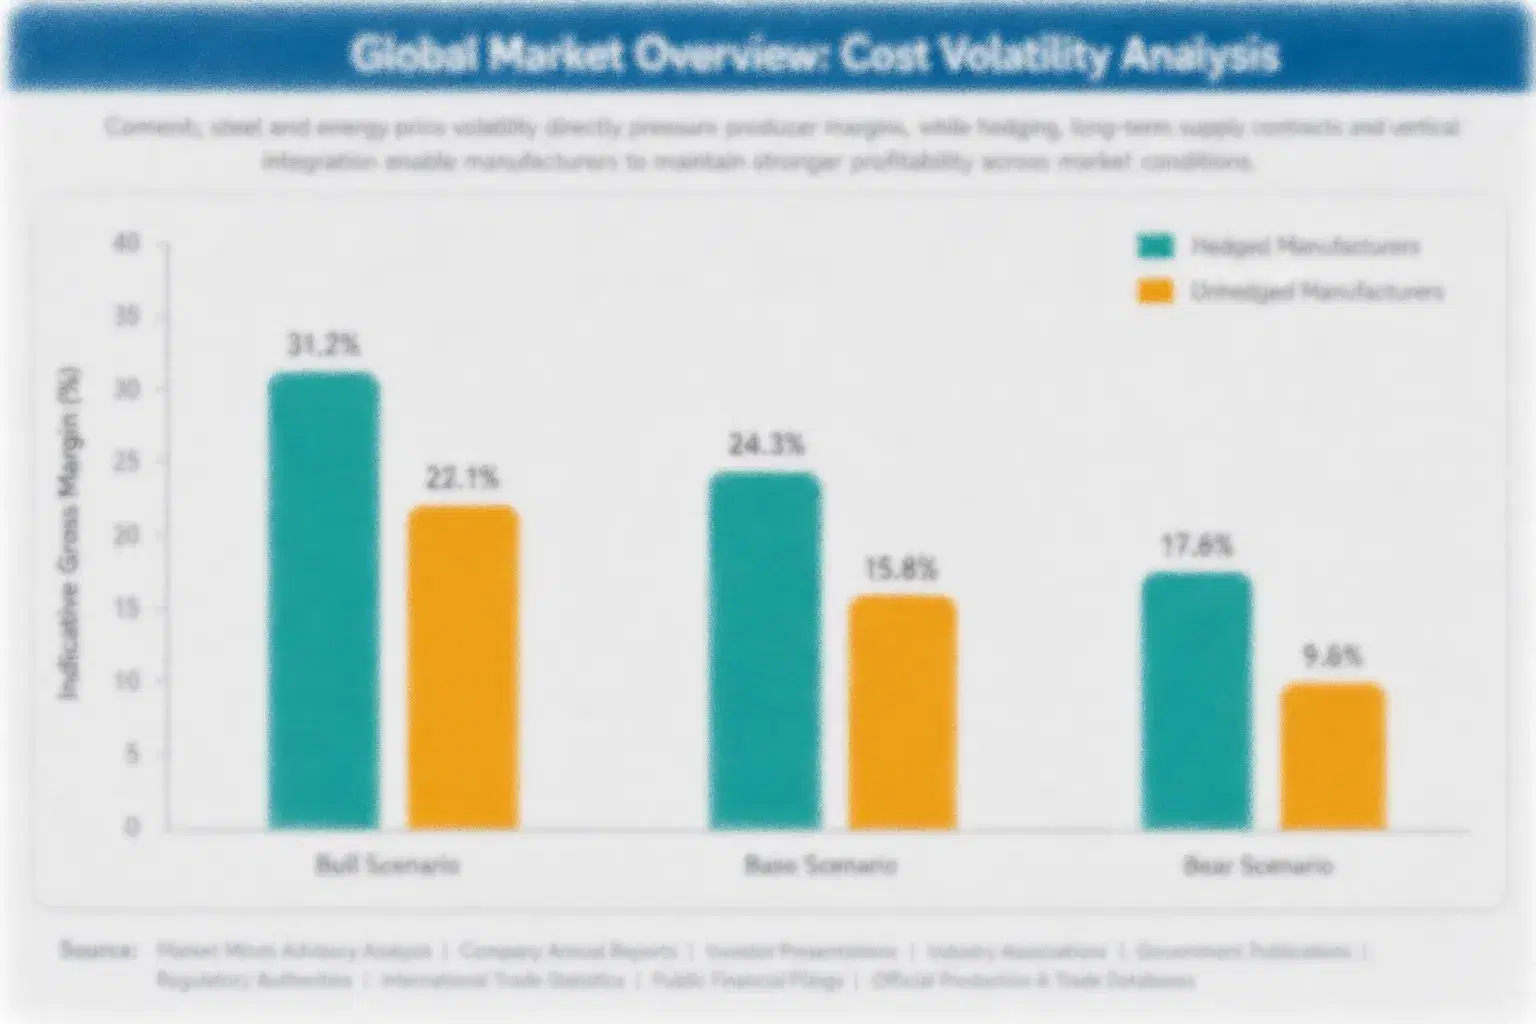
Refined polysilicon feedstock represents roughly 35 percent of unit cost for monocrystalline cells, sourced primarily from a concentrated group of Chinese and a handful of international polysilicon refiners that supply the entire global solar industry. This concentration leaves cell producers exposed whenever polysilicon supply tightens or major refineries face disruption. Silver paste and aluminum frame components carry comparatively minor price risk by comparison with polysilicon specifically.
Polysilicon prices surged sharply through 2022, an episode the International Energy Agency's critical minerals reporting linked partly to rapid capacity expansion outpacing available refining capability industry-wide. Mid-sized cell producers without hedging programs absorbed higher input costs for roughly a year before prices moderated, compressing margins on fixed-price module contracts signed before the surge. Several producers renegotiated supply terms during this period to pass through a portion of the increase.

Smaller regional producers carry proportionally higher cost exposure than LONGi Green Energy, JinkoSolar and other integrated leaders who negotiate volume discounts directly with polysilicon refiners. This gap widens further for producers without long-term supply contracts, who pay spot market premiums during tight periods that erode their already thinner margins substantially. This dynamic rewards scale in a market where volume discounts compound meaningfully over time.
monocrystalline-solar-cell-market-cost-volatility-analysis-1790920284400

Multi-Year Polysilicon Supply Agreements

Leading producers lock in polysilicon pricing through multi-year agreements with refinery partners, trading some pricing flexibility for budget certainty across large multi-gigawatt orders spanning several fiscal years. This approach shields project economics from spot market swings during periods like the 2022 surge. Several producers have already extended these agreements further into their forward order book this cycle.

Vertical Integration Into Polysilicon Refining

Manufacturers are vertically integrating into polysilicon refining capacity to reduce dependence on external suppliers entirely. This approach requires substantial capital investment but meaningfully reduces exposure to any single refiner's capacity constraints or pricing decisions during future shortage periods. Several major producers have already completed this integration across their primary manufacturing bases today. Adoption continues expanding.

Portfolio Architecture for Margin Defence

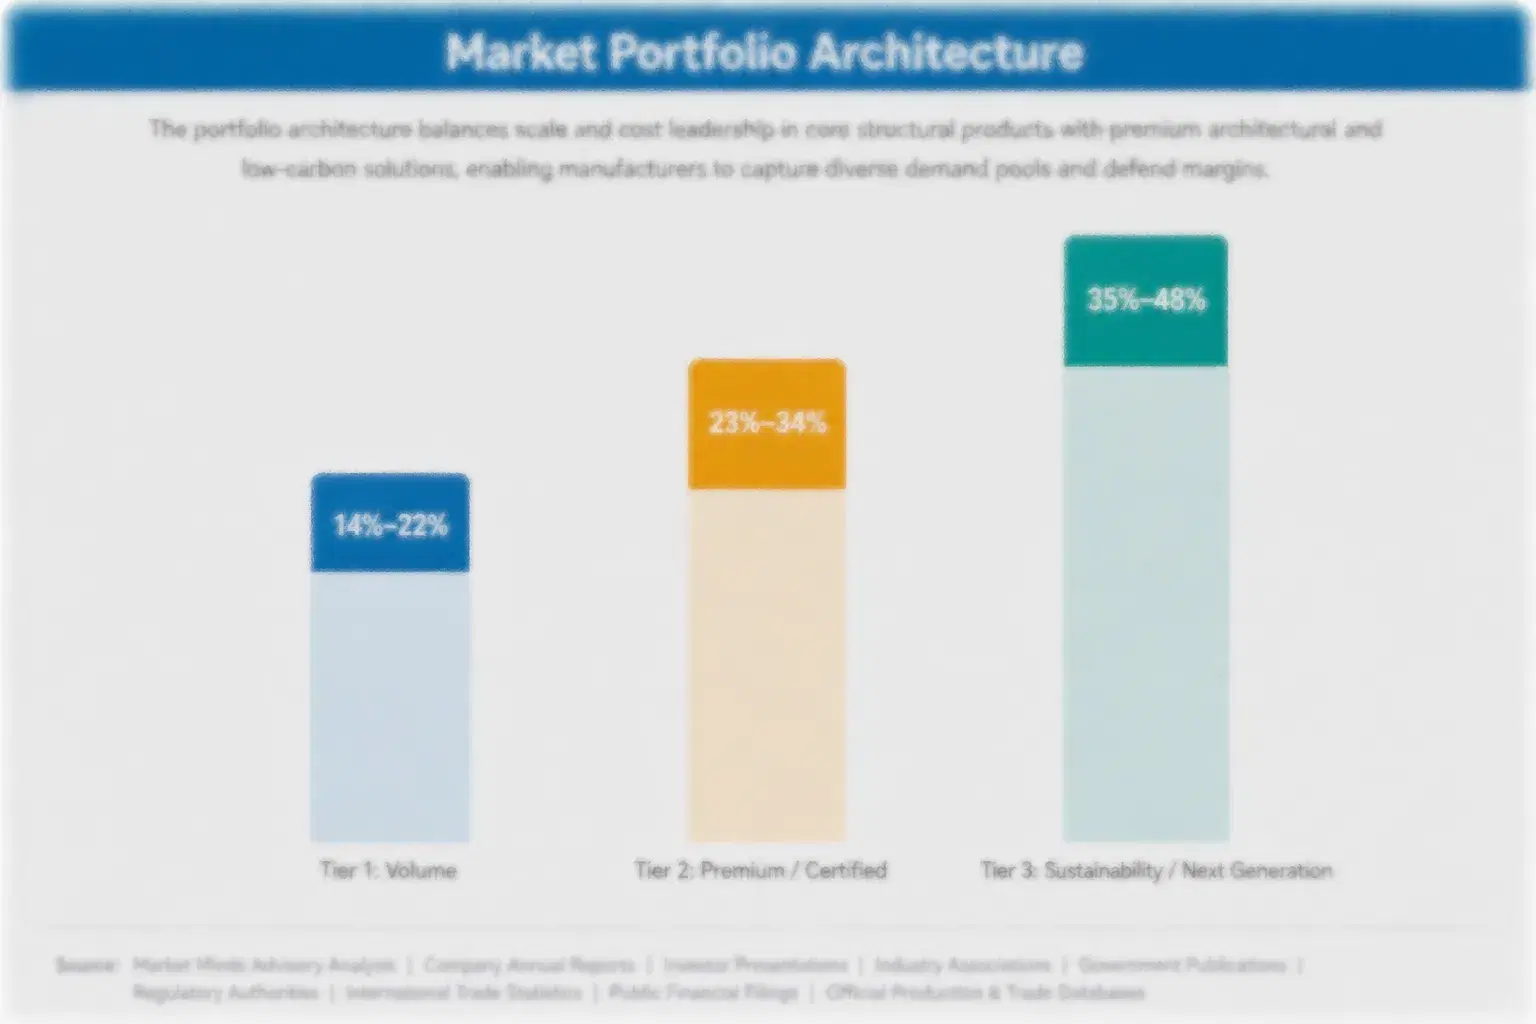
The market splits into three tiers with distinct margin economics. Volume and commodity-adjacent PERC cells serving standard utility applications carry gross margins of 8 to 14 percent, reflecting intense price competition and chronic overcapacity across most Chinese manufacturing bases. Premium and certified TOPCon cells command 16 to 24 percent margins on efficiency capability. Mid-tier producers sit uncomfortably between these two poles.
Sustainability, regulatory, and next-generation designs, meaning heterojunction cells bundled with performance warranties, reach 22 to 32 percent margins, reflecting technology scarcity and utility buyers' willingness to pay for guaranteed bifacial yield. The volume versus premium tension is real: budget-conscious buyers push for the cheapest PERC option while premium utility buyers pay for efficiency and documented warranty assurance. Brands that serve both camps well tend to maintain separate conventional and premium product lines.

High-value pools concentrate most heavily in heterojunction cells and bundled performance warranty services, where technology scarcity sustains pricing power that standard PERC cells no longer offer producers competing on cost alone. Brands positioned early in next-generation technology capture disproportionate share of this margin pool. This pool expands faster than any other tier across the forecast period.

Volume / Commodity-Adjacent

Standard PERC cells for commodity utility applications competing primarily on unit price against chronic manufacturing overcapacity, with margins thin as a result. Replacement cycles here remain tied closely to general utility procurement activity levels.
Gross Margin: 8-14%

Premium / Certified

TOPCon cells carrying documented efficiency certification that utility tenders specify explicitly, commanding pricing premiums from buyers who value proven yield performance. Certification requirements vary somewhat by market but rarely change year to year.
Gross Margin: 16-24%

Sustainability / Regulatory / Next-Generation

Heterojunction cells bundled with performance warranties where technology scarcity and recurring assurance revenue sustain the strongest margins as commodity cells become increasingly undifferentiated. These designs also carry the fastest unit growth of any tier across the forecast.
Gross Margin: 22-32%
monocrystalline-solar-cell-market-portfolio-architecture-1790920284746

High-value Sub-segments and Strategic Watch-out

Agrivoltaic and Floating Solar Cells

The fastest-growing and highest-value segment, driven by land-use efficiency demand and engineering consulting revenue pulling buyers away from standard ground-mount cells entirely. Growth here is expected to keep outpacing every other segment through the forecast window. Several major developers have already shifted default specification toward this category.
Gross Margin: MMA Estimate, July 2026.

Building-Integrated Photovoltaic Cells

High-value and still growing well above the market average, anchored by green building certification demand across new commercial construction. Trina Solar and Canadian Solar remain the names most closely associated with this segment specifically. Growth tracks the broader green building certification boom closely across most regions.
Gross Margin: MMA Estimate, July 2026.

Utility-Scale Solar Cells

The volume core of the market, serving established utility buyers across every major consuming region. Growth is steady but margin-constrained as overcapacity keeps pricing pressure elevated across most manufacturing bases. Established utility suppliers depend heavily on this steady baseline for core revenue. Pricing pressure remains steady here.
Gross Margin: MMA Estimate, July 2026.

Residential Rooftop Solar Cells

A strategic watch-out segment where adoption pace depends heavily on net metering policy that varies considerably by jurisdiction. Demand could accelerate quickly if more governments restore favorable residential incentive structures. Policy shifts in major consuming governments could change this calculus meaningfully. Demand varies considerably by region.
Gross Margin: MMA Estimate, July 2026.

Technology Certification Anchors Supply Relationships

Cell demand carries annuity-like characteristics once a utility buyer certifies a specific producer's TOPCon or heterojunction technology for its procurement framework, since switching suppliers means repeating a lengthy bankability and performance qualification process. This gives incumbent producers revenue visibility that spans multiple procurement cycles rather than single transactions. Suppliers that skip this step compete purely on price. Suppliers that invest in certification continuity defend share more effectively than price-only competitors.
Adoption stickiness and depth vary meaningfully by end-use vertical. Utility buyers rarely switch suppliers once bankability is established, given the financing continuity requirements lenders enforce strictly, while residential installers remain more willing to switch brands since individual projects are evaluated separately. Commercial buyers sit between these two extremes. Misjudging a buyer's category costs producers bids they should win.

A generational shift in buyer profiles is underway as project finance and technical due diligence teams, rather than traditional procurement managers, increasingly lead cell supplier selection given the bankability stakes involved. These buyers evaluate producers on documented degradation history and warranty enforceability rather than headline price alone, reshaping how producers pitch new utility relationships. Producers slow to adapt their sales approach risk losing ground to more responsive specialist competitors.
monocrystalline-solar-cell-market-end-use-penetration-index-1790920285043

Where Cell Value Concentrates Next

These are among the four positions where our research anticipates prominent divergence between winners and laggards over the coming forecast period. Each is grounded in the demand model, the regulatory perimeter, and the announced capacity pipeline.
01 / TECHNOLOGY TRANSITION INVESTMENT

Accelerate TOPCon conversion before PERC becomes obsolete

TOPCon cell architecture already commands 68 percent of new utility-scale procurement, and producers still running legacy PERC-only lines are losing specification battles to competitors who converted earlier across most major manufacturing bases worldwide. Manufacturers without a clear conversion roadmap risk losing utility relationships permanently as bifacial yield requirements tighten further across nearly every major market. Early technology investment pays off disproportionately here, compounding with each new procurement cycle as momentum keeps building steadily across the broader industry each quarter now.
02 / INDIAN MANUFACTURING POSITIONING

Build Indian partnerships before incentive windows close

India's domestic cell manufacturing capacity grew roughly 45 percent in 2025, representing the most significant challenge to China's manufacturing concentration emerging anywhere globally right now and likely for years to come. Producers without established Indian partnerships risk losing access to this incentive-eligible demand pool entirely as domestic capacity targets approach completion. The window to establish this position is narrowing as more producers recognize the opportunity and move decisively to secure positions ahead of slower-moving rivals in this fast-moving market too.
03 / POLYSILICON INTEGRATION STRATEGY

Vertically integrate before the next price surge

Polysilicon represents 35 percent of unit cost, and the 2022 price surge compressed margins severely for producers without adequate hedging or vertical integration already in place across their supply chain and forward contracts spanning multiple fiscal years. Producers that complete integration now will protect margins during the next volatility event, while those that delay will face the same compression repeatedly across future cycles. Demand keeps rising industry-wide, raising the stakes of this decision considerably for every mid-sized producer still weighing the investment.
04 / BIFACIAL WARRANTY PROGRAM SCALING

Scale warranty programs ahead of hesitant competitors

Bifacial performance warranty programs already win roughly 21 percent more utility contracts among buyers seeking documented yield assurance, removing the uncertainty that otherwise deters premium pricing for next-generation cell architecture broadly. Producers that delay building this capability will find it harder to catch up once buyer expectations around warranty guarantees become standard across the broader utility market. The window to establish this expectation gap is narrowing quickly across nearly every utility market nationwide and abroad this cycle and beyond too.

Engagement Snapshot From the Field

A live engagement with an industry participant carrying material or product regulatory and market exposure ahead of a defining policy shift, showing how our research translates into a defensible multi-year portfolio strategy.
MARKET MINDS ADVISORY · CLIENT ENGAGEMENT SUMMARY
Monocrystalline Solar Cell Producer Strategic Portfolio Review and Transition Roadmap 2026·Investment Scenario on Monocrystalline Solar Cell Exposure Evaluation 2025-26
CLIENT PROFILE
A mid-sized regional utility developer planning several gigawatts of new utility-scale solar capacity across multiple states engaged MMA to evaluate cell technology and supplier options ahead of procurement commitments, given the client's limited prior experience navigating the PERC-to-TOPCon transition across several candidate suppliers during an active bidding window ahead of key financing deadlines. (client-reported, unverified by MMA).
STRATEGIC CHALLENGE
The developer needed to decide whether to commit to legacy PERC cells at lower upfront pricing or pay a premium for TOPCon technology offering better long-term yield, while also navigating trade policy uncertainty affecting several candidate suppliers' cross-border supply chains and delivery timelines across multiple candidate suppliers. (client-reported, unverified by MMA).
MMA APPROACH
MMA's research team modeled lifetime energy yield across both cell technologies using primary interviews with comparable utility developers that had already completed similar procurement decisions, cross-referencing findings against current bifacial gain and degradation data. The team built a total cost of ownership comparison weighing upfront price against twenty-year yield projections.
KEY FINDINGS
  1. TOPCon cells offered roughly 9 percent better lifetime energy yield than comparable PERC cells, based on documented bifacial gain and degradation rate data.
  2. The TOPCon price premium over PERC had narrowed to roughly 6 percent, down from over 15 percent just two years earlier as production volume scaled industry-wide.
  3. Suppliers offering bifacial performance warranties commanded a modest additional premium but reduced the developer's financing risk meaningfully with lenders across most financing arrangements industry-wide.
  4. Trade policy exposure varied significantly by supplier, with two candidates carrying meaningfully higher tariff risk than the others based on current sourcing patterns.
CLIENT PROFILE
A mid-sized regional utility developer planning several gigawatts of new utility-scale solar capacity across multiple states engaged MMA to evaluate cell technology and supplier options ahead of procurement commitments, given the client's limited prior experience navigating the PERC-to-TOPCon transition across several candidate suppliers during an active bidding window ahead of key financing deadlines. (client-reported, unverified by MMA).
STRATEGIC CHALLENGE
The developer needed to decide whether to commit to legacy PERC cells at lower upfront pricing or pay a premium for TOPCon technology offering better long-term yield, while also navigating trade policy uncertainty affecting several candidate suppliers' cross-border supply chains and delivery timelines across multiple candidate suppliers. (client-reported, unverified by MMA).
MMA APPROACH
MMA's research team modeled lifetime energy yield across both cell technologies using primary interviews with comparable utility developers that had already completed similar procurement decisions, cross-referencing findings against current bifacial gain and degradation data. The team built a total cost of ownership comparison weighing upfront price against twenty-year yield projections.
KEY FINDINGS
  1. TOPCon cells offered roughly 9 percent better lifetime energy yield than comparable PERC cells, based on documented bifacial gain and degradation rate data.
  2. The TOPCon price premium over PERC had narrowed to roughly 6 percent, down from over 15 percent just two years earlier as production volume scaled industry-wide.
  3. Suppliers offering bifacial performance warranties commanded a modest additional premium but reduced the developer's financing risk meaningfully with lenders across most financing arrangements industry-wide.
  4. Trade policy exposure varied significantly by supplier, with two candidates carrying meaningfully higher tariff risk than the others based on current sourcing patterns.
RECOMMENDED STRATEGY
Phase 1: Select a TOPCon supplier offering a bifacial performance warranty to maximize lifetime yield and reduce financing risk. This matched the pattern MMA observed across comparable developers. Phase 2: Prioritize suppliers with diversified manufacturing footprints to reduce exposure to ongoing trade policy disputes. This reduced exposure meaningfully. for the broader portfolio. Phase 3: Negotiate a multi-year supply agreement locking in current pricing ahead of anticipated further TOPCon premium compression. This locked in favorable economics.
OUTCOME
The client selected a TOPCon supplier offering a bifacial warranty and proceeded with procurement across its planned capacity on schedule. Lifetime yield projections have tracked close to MMA's modeled estimate through the first operational year, and the client has expressed interest in applying a similar framework to future procurement cycles. (client-reported, unverified by MMA).

Frequently Asked Questions

Foundational context covering the market sizes, CAGR, scope, country, region and competition that inform every finding below. This section is provided to cover basics and most often pre-purchase conversations, answered from the MMA Primary Research Dataset.

What is the current size of the Monocrystalline Solar Cell Market?

The Monocrystalline Solar Cell Market was valued at 42.0 billion dollars in 2025. Growth is anchored by utility-scale deployment and the ongoing TOPCon technology transition.

How large will the Monocrystalline Solar Cell Market be by 2036?

The market is projected to reach 125.96 billion dollars by 2036, up from 42.0 billion in 2025. That represents a 2.71 times expansion over the eleven-year forecast window.

What is the CAGR for the Monocrystalline Solar Cell Market 2026 to 2036?

The market is forecast to grow at a 10.5 percent compound annual rate. This compares to a historical rate of 9.0 percent between 2020 and 2025.

Which segment is growing fastest?

Agrivoltaic and Floating Solar Cells lead at a 14.7 percent CAGR, roughly 1.40 times the overall market rate. Land-use efficiency demand drives this accelerating pace.

Who are the major companies in the Monocrystalline Solar Cell Market?

LONGi Green Energy, JinkoSolar, Trina Solar, JA Solar, and Canadian Solar lead the field. Together the top five hold roughly 58 percent of global revenue share.

Which country is growing fastest?

India leads country-level growth at a 12.5 percent CAGR. Its production-linked domestic manufacturing incentive program is the primary driver behind this rapidly accelerating pace overall.

Report Segmentation Architecture

The full report scope spans multiple orthogonal segmentation dimensions, with cross-tabulated demand data provided for each dimension pair. Coverage extends further to regional breakdowns, trend trajectories, and the competitive detail needed to support segment-level decision-making.

By Application Type

    By End-Use Industry

      By Commercial Dimension

        By Region

        • North America
        • Western Europe
        • East Asia
        • South Asia and Pacific
        • Latin America
        • Middle East and Africa
        • Eastern Europe

        Scope, Methodology, and Coverage

        Every figure in this report is reproducible from documented input assumptions. The scope below maps the historical period, the forecast horizon, the segmentation dimensions, and the countries covered, alongside the underlying primary and qualitative methodology.
        Historical Period
        2020 to 2025
        Forecast Period
        2026 to 2036
        Base Year
        2025 (USD billions; MMA Primary Research Dataset, October 2026)
        Market Definition
        This report covers monocrystalline silicon photovoltaic cells used in utility-scale, residential, commercial and specialized solar applications, including PERC, TOPCon and heterojunction cell architectures. It excludes polycrystalline silicon cells, thin-film photovoltaic technologies and finished module assembly sold separately from cell production.
        Quantitative Units
        USD Billion, CAGR 2026-2036
        Segmentation Dimensions
        By Application Type, By End-Use Industry, By Commercial Dimension, By Region
        Regions Covered
        North America, Western Europe, East Asia, South Asia and Pacific, Latin America, Middle East and Africa, Eastern Europe
        Countries Covered
        China, United States, India, Japan, Germany, South Korea, Vietnam, Brazil, Australia, and 15 additional markets
        Key Companies Profiled
        LONGi Green Energy, JinkoSolar Holding, Trina Solar, JA Solar Technology, Canadian Solar Inc, and 15 additional companies
        Quantitative Methodology
        Primary survey, n=3,800 respondents, Q4 2025, six countries; demand-side model with trade association cross-validation
        Qualitative Methodology
        47 expert interviews, Q4 2025; applied to validate demand model assumptions, identify emerging dynamics, and assess competitive positioning
        Report Format
        PDF and XLSX data workbook (Word format preview document)
        Publisher
        Market Minds Advisory
        Report Code
        MMA-2026-ENE-367
        Published
        October 2026
        Contact
        sales@marketmindsadvisory.com | www.marketmindsadvisory.com

        Purchase the full Monocrystalline Solar Cell Market Report (2026 to 2036).

        The full Monocrystalline Solar Cell Market report extends this summary with complete segment-level data tables, country-level sizing across twenty-five markets, and detailed supplier benchmarking across all twenty profiled companies named in this overview. It includes primary survey findings from 3,800 respondents across six countries and 47 expert interviews conducted in the fourth quarter of 2025, each sourced and documented separately throughout. Buyers receive editable data files alongside the narrative report, supporting direct use in internal planning models. Analysts remain available for a follow-up briefing call to walk through the findings in more depth.
        Complete seven-region sizing and forecast tables
        Twenty company competitive benchmarking profiles included
        Five-year historical and eleven-year forecast data
        Segment-level CAGR and margin detail included
        Primary survey and expert interview data files
        Editable Excel data appendix fully included

        Built For The People Who Decide

        From boardroom strategy to bench-side execution, this report is read cover-to-cover by leaders shaping the next decade of their industry, turning demand scenarios, market dynamics and valuation benchmarks into decisions.
        CXOs/ Presidents/ VPs/ Managers
        M&A and Corporate Development
        Strategy Teams and R&D Heads
        Procurement and Product Directors
        Regulatory and Compliance Leaders
        Investor Relations and Equity Analysts