Market Minds Advisory
Monitoring Tool Market

Monitoring Tool Market: Monitoring Tool Market. AI-Driven AIOps, Consolidation, and Correlation Economics.

Enterprises are consolidating infrastructure, application, and log monitoring onto unified AI-driven observability platforms as distributed cloud architectures multiply alert volume, even as tool sprawl keeps large organisations locked into fragmented legacy tools.

Lead Analyst

Published

September 2026

Make Smarter Decisions with Customized Research Insights

Request a free sample report and evaluate market opportunities, growth trends, and competitive dynamics relevant to your business needs.

2025 MARKET VALUE$15.0BMarket Size 2025
2036 FORECAST VALUE$47.3BBase Case , 2026 to 2036
CAGR 2026 TO 203611.0 %Bull 12.3% / Bear 9.8%
INCREMENTAL OPPORTUNITY$30.6BNet 10- year value creation
EXPANSION MULTIPLE2.84x2036 value over 2026 base
Strategic Levers
M&A Pipeline
Regional Outlook
Country Rankings
Competitive Intelligence
Segmental Deep-dive
Call-Us : 91 93563 13602

Executive Snapshot and Market Trajectory.

Monitoring tool software is shifting from siloed infrastructure and application point solutions toward unified AI-driven observability platforms that correlate signals across the entire technology stack automatically, letting IT operations teams cut alert fatigue while accelerating incident resolution across expanding distributed cloud architectures. Buyers increasingly treat this shift as necessary.
Demand concentrates around large enterprises operating complex distributed cloud and hybrid infrastructure, with North American technology and financial services organisations the largest buyers as domestic cloud infrastructure investment continues outpacing other markets by a meaningful margin. Cloud-native observability platforms are increasingly displacing legacy on-premises point tools across these flagship accounts. That concentration is unlikely to loosen soon given how deeply embedded these buying centres already are within the largest IT operations organisations.
Competitive character splits between established monitoring vendors defending decades-long infrastructure and network tool relationships and newer cloud-native observability platforms built specifically for AI-driven anomaly detection that legacy point-solution architectures were never designed to support at comparable correlation depth. This divide shapes nearly every competitive contract decision now underway, and tightening incident response expectations reinforce how buyers weigh vendor correlation depth against newer platform speed.
Market Definition
This report covers software platforms for monitoring, correlating, and analysing infrastructure, application, network, and log data, spanning on-premises, cloud, and AI-driven AIOps systems. Security information and event management, IT service management ticketing, and network hardware are excluded.
Base Year Value
$15.0B in 2025 (MMA Primary Research Dataset, September 2026)
Forecast Period
2026 to 2036, eleven discrete annual values
CAGR
11.0% base case. Bull 12.3%. Bear 9.8%.
Fastest Growth Segment
AI-Driven AIOps and Anomaly Detection Platforms: 17.2% CAGR
Fastest Growth Country
India: 15.0% CAGR
Fastest Growth Region
South Asia and Pacific: 13.0% CAGR
Largest Region
North America: 31% of 2025 global value
Market Leaders
Datadog Inc, Dynatrace Inc, Splunk Inc, New Relic Inc, Elastic NV. Source: MMA Analysis based on company annual reports.
Primary Survey
n=3,800 procurement and R&D decision-makers, Q4 2025, six countries
Methodology
Demand-side build-up, cross-validated against public data, 47 expert interviews

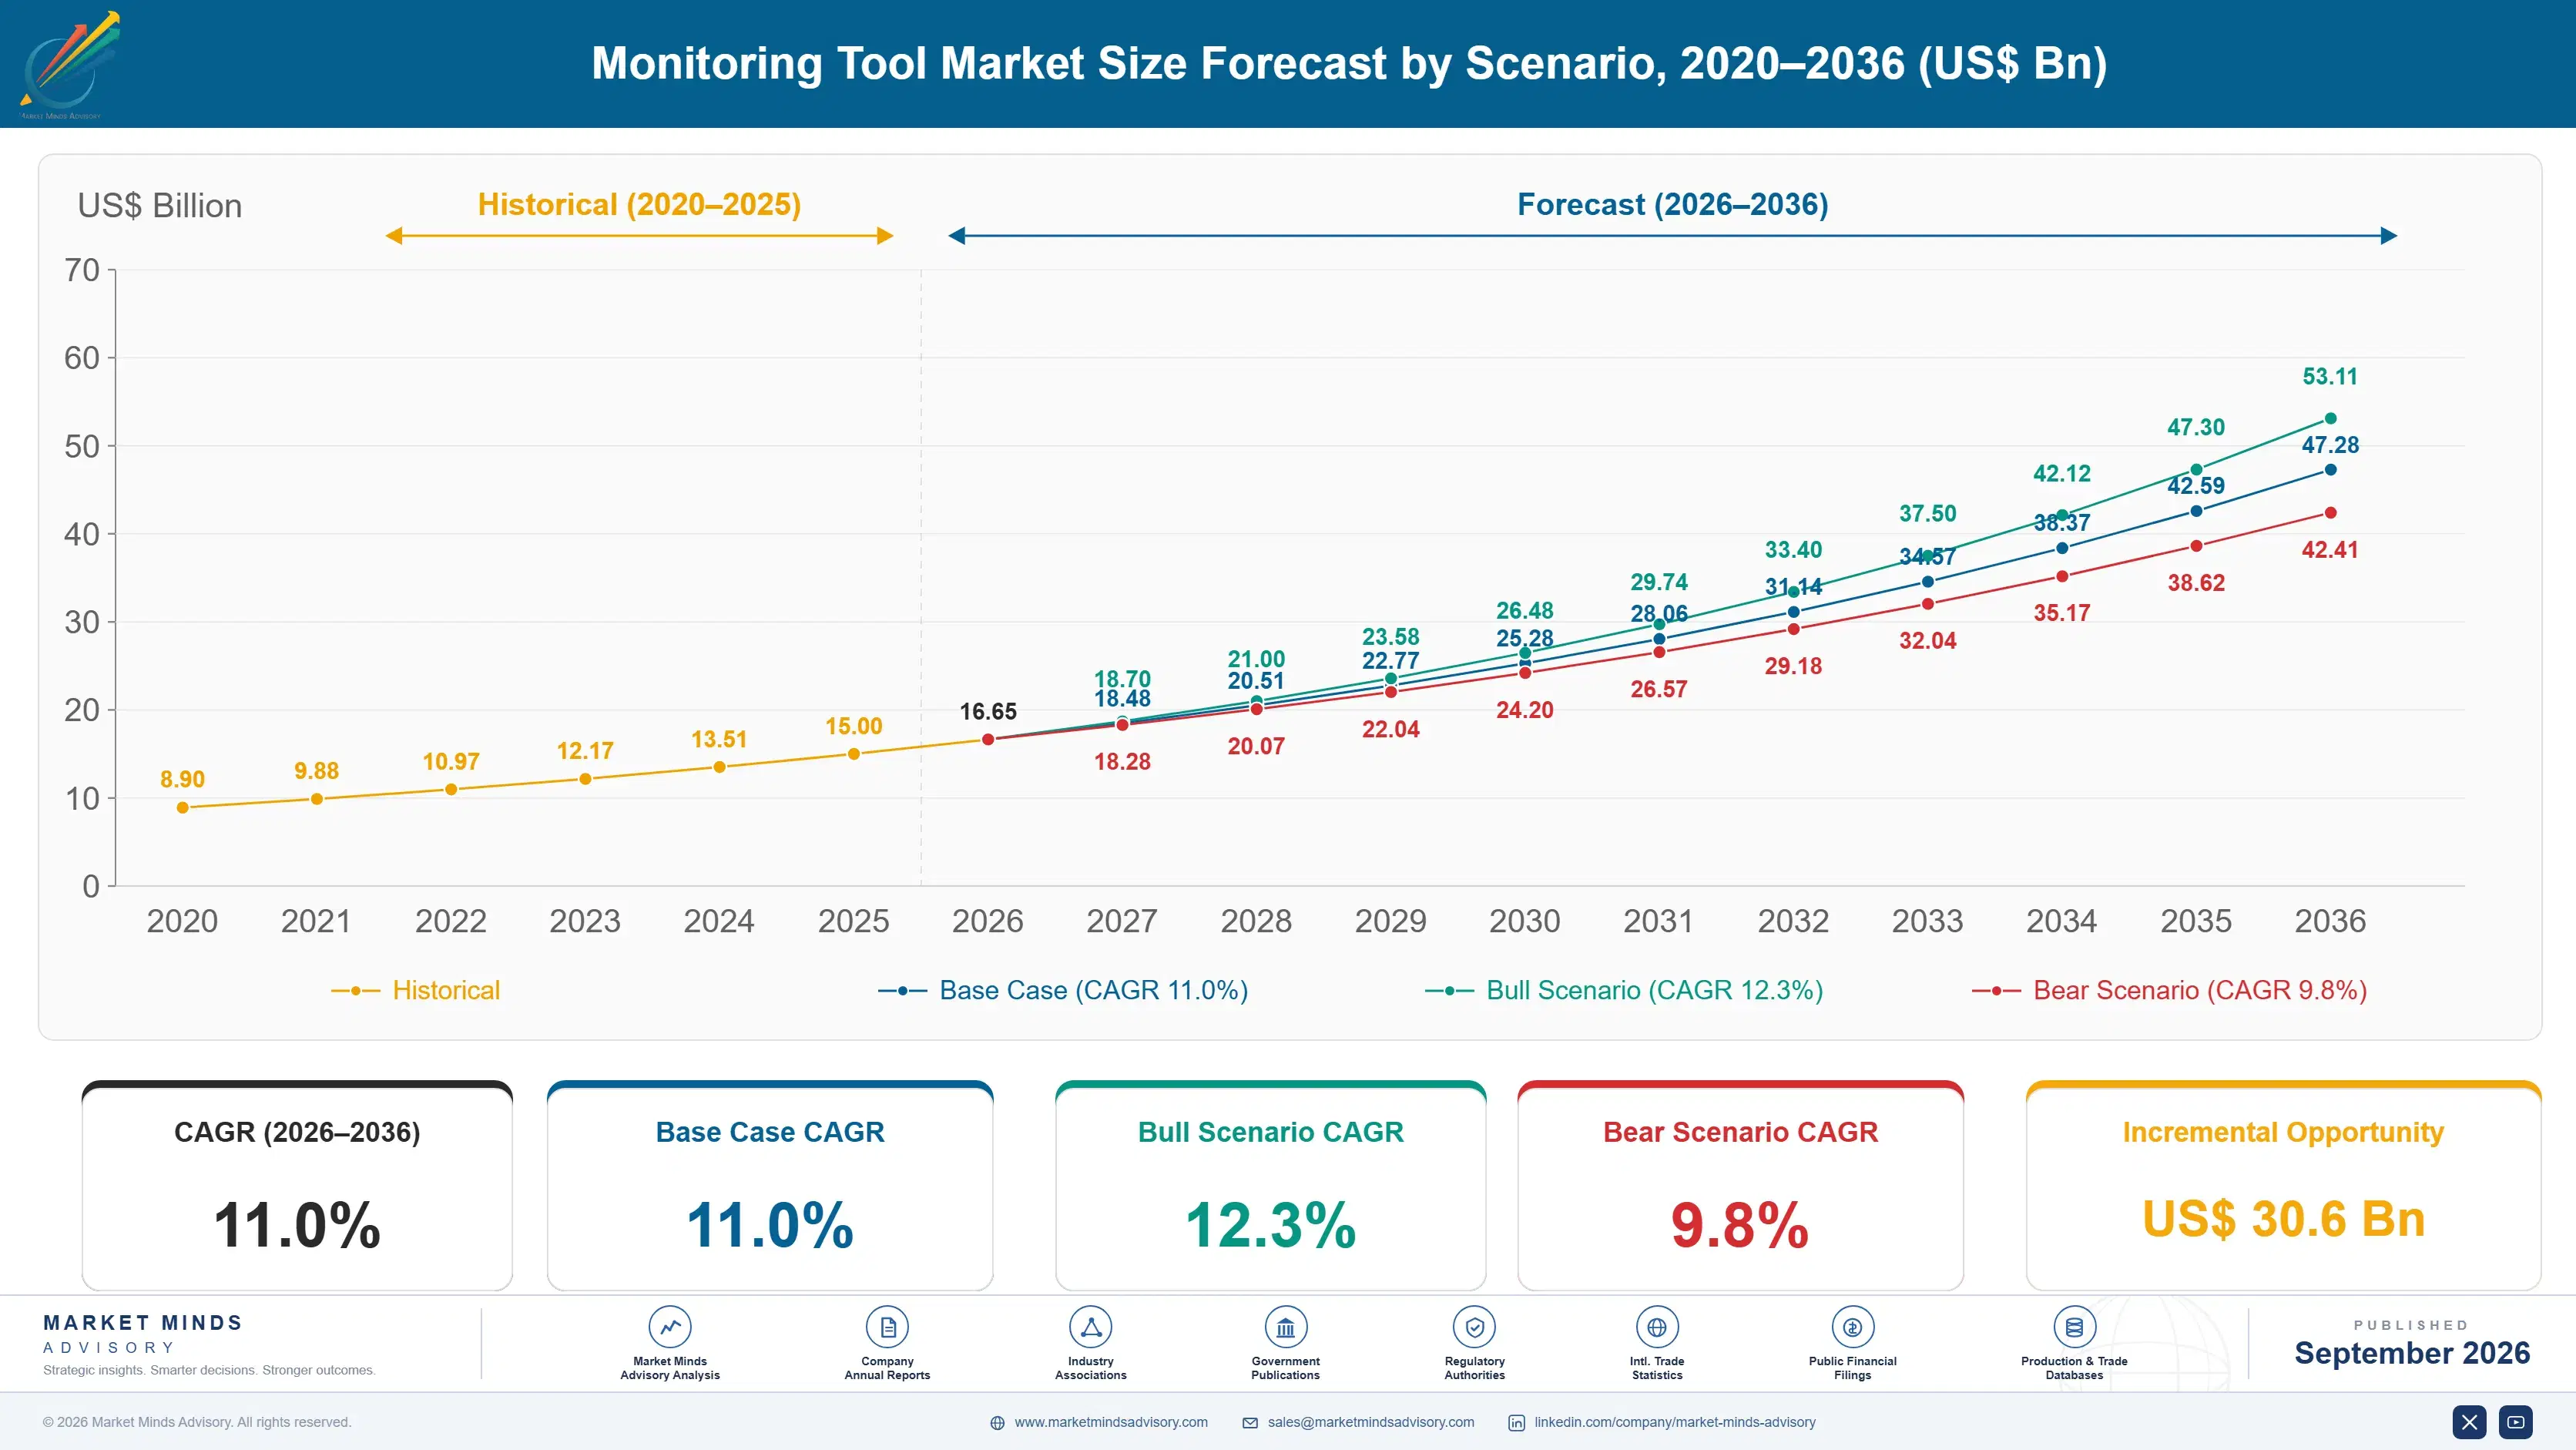
Monitoring Tool Market Forecast Scenarios

monitoring-tool-market-size-forecast-scenario-1788503491968
Between 2020 and 2025, monitoring tool software grew steadily as enterprises expanded cloud migration investment alongside continued pressure to cut mean time to resolution across increasingly complex distributed infrastructure environments. Cloud infrastructure maturity and expanding AI analytics capability both reinforced this steady multi-year adoption curve across most enterprise IT operations segments. Vendor consolidation also reshaped the competitive landscape considerably during this period.
The base case assumes continued momentum from three mechanisms: enterprises expanding AI-driven anomaly detection adoption to replace manual alert triage, IT operations teams integrating unified observability platforms to cut tool sprawl across fragmented point solutions, and distributed cloud architecture complexity increasingly demanding automated correlation that legacy manual dashboards cannot practically support at global scale. These three mechanisms reinforce each other, since correlation needs justify platform consolidation, and consolidation in turn makes AI-driven analytics economically practical to deploy at scale.
A bull scenario assumes faster AI adoption pulls forward platform value considerably beyond current alerting-focused deployment into broader predictive incident prevention, while the principal bear risk is tool sprawl and integration cost deterring large enterprises from consolidating entrenched point solutions despite clear efficiency advantages. Both scenarios hinge on how quickly consolidation frameworks mature across major enterprise IT operations environments.

AI-Driven AIOps and Consolidation Economics

Monitoring tool software sits downstream of both enterprise cloud transformation budgets and evolving incident response expectations, and pricing increasingly reflects AI-driven correlation depth rather than raw metric collection functionality alone across most enterprise buyer contracts. Contract renewal negotiations increasingly reference validated resolution-time benchmarks directly rather than treating them as a secondary consideration. Vendors that can demonstrate both capabilities together increasingly set the pricing benchmark other platforms are measured against.
MARKET CONCENTRATION30%share held by five largest global platform vendors
AVERAGE LICENSE PRICE$4,400typical annual platform license price per monitored host
CLOUD DEPLOYMENT SHARE68%share of platforms deployed on cloud infrastructure and rising
IT OPERATIONS TEAM UTILISATION89%IT operations teams booked above normal delivery capacity
AI-ENABLED CONTRACTS33%share of contracts including AI anomaly detection component
MEAN TIME TO RESOLUTION18 minutesminutes typical mean time to resolution after deployment
Buyers increasingly specify cloud deployment and AI-driven anomaly detection as standard for new platform procurement, pushing legacy point-solution vendors toward smaller mid-market segments while cloud-native platform vendors hold pricing power on flagship enterprise contracts. IT operations teams report sustained project booking well above typical delivery capacity, reflecting the pace of this shift across large enterprise technology organisations.
Over the next decade, expect continued AI analytics expansion and tightening incident response requirements to keep integrated platform demand elevated, favouring vendors who can deliver correlation depth as reliably as they win enterprise platform contracts. Vendors lagging on AI anomaly detection capability risk losing consideration on the largest enterprise contracts entirely. Contracts increasingly reference resolution speed directly as a procurement scoring criterion.
"Nobody replaces a monitoring stack because the dashboard looks nicer. They replace it because on-call engineers are drowning in false alerts, and that fatigue math is what is reshaping which vendors win the largest enterprise contracts."
Director, IT Operations and Observability Technology Practice · MMA Technology Practice · September 2026

Market Trends

AI-Driven Anomaly Detection Extends Platforms Beyond Alerting

Monitoring platforms are increasingly embedding AI-driven anomaly detection that identifies unusual system behaviour and predicts incidents before they trigger service outages, extending platform value considerably beyond the reactive alerting role earlier generation infrastructure and application tools provided to enterprise IT operations organisations. Platform vendors report AI anomaly detection feature adoption growing meaningfully across large enterprise accounts, reflecting IT operations leadership demand for tools that actively prevent incidents rather than passively reporting metrics for later manual review. That gap is widening each quarter as predictive monitoring becomes standard operating practice across large distributed enterprises.
Market Impact: Cuts resolution time 32pts

Distributed Cloud Complexity Drives Unified Observability Consolidation

Enterprises operating increasingly distributed microservices and multi-cloud architecture face expanding alert volume that fragmented point solutions cannot correlate reliably, converting what was previously a tolerable tool sprawl problem into an increasingly urgent platform consolidation priority across most large enterprise IT operations programmes. Enterprises report consolidation procurement increasingly tied to broader cloud transformation planning, giving platform vendors a demand driver linked to infrastructure modernisation strategy rather than discretionary tooling budget alone. This dynamic is expected to intensify as distributed architecture complexity continues expanding across most major cloud programmes. Vendors report this shift accelerating faster than most infrastructure planning teams originally.
Market Impact: Raises regulated demand 19pts

Market Opportunities and Growth Drivers

Incident Cost Pressure Accelerates Automated Correlation Adoption

Enterprises managing high transaction volumes across distributed cloud infrastructure face considerably higher revenue loss from prolonged outages than automated correlation platforms can prevent, converting what was previously a back-office IT operations consideration into an increasingly central business continuity priority across most large enterprise incident response programmes. Enterprises report automation procurement increasingly tied to broader business continuity planning, giving platform vendors a demand driver linked to revenue protection mandates rather than discretionary technology budget alone. This dynamic is expected to persist as outage costs continue rising faster than manual response capacity can scale.
Market Impact: Delays consolidation 6-10 months

Regulatory Uptime Requirements Elevate Continuous Monitoring Investment

Enterprises in financial services and healthcare face expanding regulatory requirements for demonstrable system availability and incident reporting, increasing the operational rigor that manual monitoring processes struggle to satisfy reliably without dedicated platform support across expanding regulated infrastructure environments. Enterprises report platform procurement increasingly tied to broader regulatory compliance planning, giving vendors a demand driver linked to uptime reporting mandates rather than discretionary efficiency spending alone. This dynamic is expected to persist as enterprises continue expanding regulated infrastructure footprint in response to ongoing compliance enforcement. This dynamic is expected to intensify as compliance enforcement continues tightening across major regulated jurisdictions.
Market Impact: Leaves 24 percent of roles unfilled

Market Restraints and Challenges

Tool Sprawl and Integration Cost Delay Platform Consolidation

Large enterprises with deeply embedded legacy monitoring point solutions face considerably more complex integration challenges than smaller organisations adopting unified observability platforms for the first time, often extending consolidation timelines well beyond what vendors plan around when pursuing competitive displacement opportunities at established enterprise accounts. The commercial impact shows up as delayed revenue recognition for vendors who have invested competitive displacement sales effort well ahead of any confirmed consolidation completion at prospective enterprise customers. Vendors are responding by building specialised migration tooling to compress the effective consolidation timeline before full platform cutover occurs.
Market Impact: Lifts AI-enabled platform share by 18pts

Specialised Observability Talent Shortage Constrains Vendor Capacity

Platform vendors face a persistent shortage of engineers with combined expertise in distributed systems architecture and AI-driven analytics, constraining how quickly vendors can build new capability or take on additional enterprise consulting engagements even as customer demand continues expanding across most major accounts. Smaller regional vendors without established university recruiting pipelines carry the largest exposure to this constraint, while larger vendors increasingly acquire smaller specialist firms specifically to secure engineering talent rather than pursuing pure technology or customer base acquisition alone. That gap is widening each hiring cycle as demand continues to outpace available specialist supply.
Market Impact: Expands consolidation-driven contracts by 20 percent
3 additional market trends, 4 additional growth drivers, and 2 additional restraints and challenges are covered in the full report. Contact sales@marketmindsadvisory.com to access the complete intelligence.

Segment CAGR and Growth Architecture

Segmentation follows core monitoring functionality, from infrastructure and network tools through application performance and log analytics to AI-driven observability platforms, keeping signal collection distinct from the correlation and services layered around it. Commercial services around implementation and consulting sit apart as a distinct dimension entirely, never blended into the core functionality categories above entirely.
monitoring-tool-market-market-share-analysis-1788503492550

AI-Driven AIOps and Anomaly Detection Platforms

AI-driven AIOps platforms that correlate signals across infrastructure, applications, and logs automatically are capturing an expanding share of total platform spending as enterprises shift budget from manual dashboard review toward predictive incident prevention across most large distributed enterprise programmes. Vendors report platform deployment timelines running considerably faster than legacy point-solution installation given the reduced integration effort cloud-native AIOps architecture requires, delivering stronger recurring revenue once deployed since subscription pricing generates predictable multi-year customer relationships. Adoption remains concentrated among enterprises with the engineering resources to tune correlation models effectively, but the addressable market is expanding as vendors build simplified AIOps packages suited to smaller enterprise budgets. Expect this segment to keep outpacing the broader market as distributed architecture complexity continues.
CAGR 17.2%

Cloud-Native Full-Stack Observability Platforms

Cloud-native full-stack platforms combining infrastructure, application, and log monitoring into a single unified interface are growing as enterprises increasingly value consolidated visibility over the fragmented point-solution architecture legacy monitoring stacks historically required across most large enterprise IT operations organisations. This segment benefits from the same consolidation trend driving broader AIOps adoption, since unified cloud deployment typically provides the data consistency AI correlation requires more efficiently than fragmented point solutions can economically support at comparable enterprise scale. Vendors require sophisticated distributed systems and cloud engineering expertise to serve this segment at qualified enterprise scale, a capability barrier that favours established platform vendors with dedicated engineering investment over smaller providers lacking comparable technical depth. Growth here trails AIOps platforms slightly since.
CAGR 14.6%
Full segment breakdown across 6 segments available in the complete report.

Regional Architecture and Country Demand Map

North America leads on concentrated cloud infrastructure and IT operations investment, with East Asia following behind on expanding enterprise cloud migration and digital infrastructure investment across the region. South Asia and Pacific and Western Europe fill out the remaining meaningful share behind these two anchor regions.

North America

United States technology and financial services enterprises anchor substantial regional demand, with continued cloud transformation investment expanding the addressable base of organisations requiring unified observability platforms across both large enterprise and expanding mid-market accounts. Major cloud platform vendors headquartered in the region sustain deep engineering relationships with IT operations organisations that smaller international competitors have struggled to displace despite years of competitive effort. Government agency uptime requirements across the region sustain steady platform demand tied to regulatory compliance distinct from the faster-growing AI-driven category now driving overall market growth. Average licence pricing stays firm given established vendor relationships and the resolution-speed track record leading platform providers have built across multiple enterprise infrastructure generations.
Share: 31% | CAGR: 12.0% (2026 to 2036)

Western Europe

German and British technology enterprises, alongside France's concentrated financial services and telecommunications infrastructure base, anchor substantial regional demand as European Union digital operational resilience regulation increasingly requires demonstrable incident monitoring and reporting capability for large enterprise IT organisations. Domestic platform vendors compete against North American and Asian platforms for these enterprise contracts, drawing on established relationships with financial services and telecommunications institutions built over many years of prior on-premises tool deployment. Research into regulatory compliance requirements across the region sustains steady platform demand comparable to other established enterprise software markets globally. Growth trails North America given the region's more measured cloud transformation investment pace relative to the aggressive automation scaling underway across major American technology organisations.
Share: 22% | CAGR: 9.5% (2026 to 2036)
Regional intelligence for 5 additional markets available in the complete report: East Asia, South Asia and Pacific, Latin America, Middle East and Africa, Eastern Europe. Contact sales@marketmindsadvisory.com.
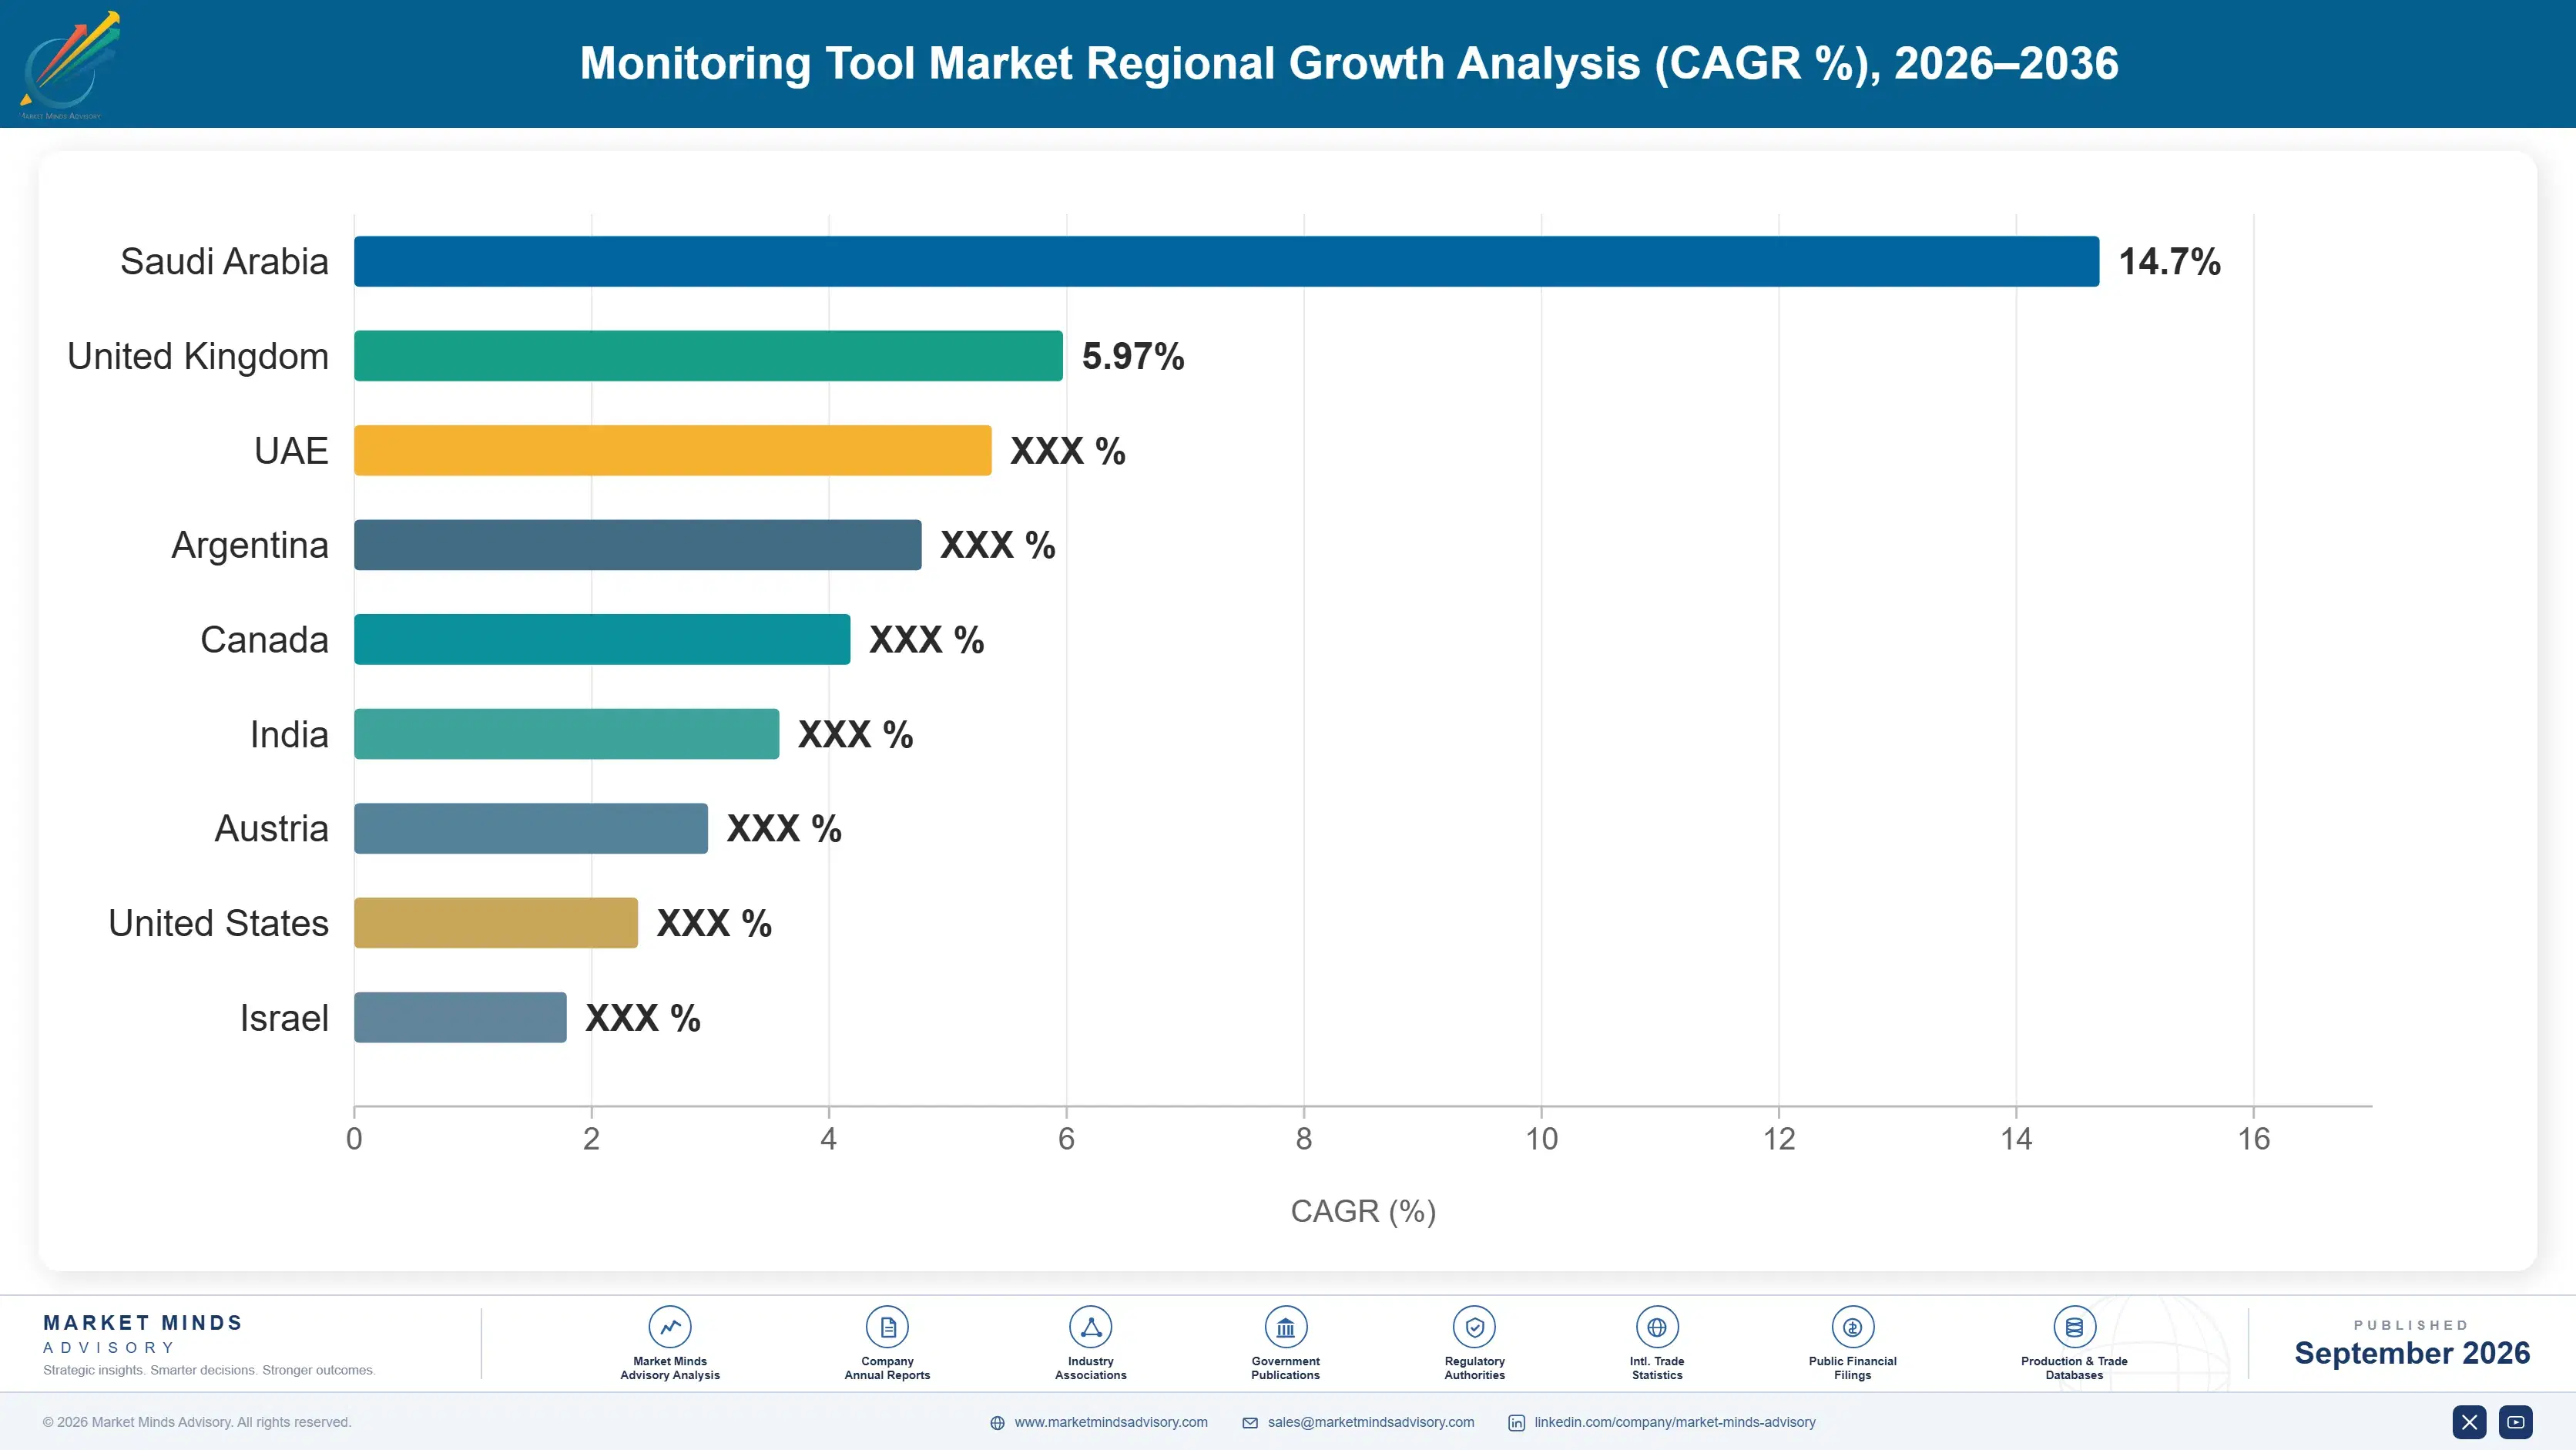
monitoring-tool-market-country-cagr-analysis-1788503493107

Correlation Depth, Consolidation Speed, and Prevention Accuracy

Vendors hold pricing power where AI correlation depth, fast legacy tool consolidation capability, and predictive prevention accuracy combine, letting qualified players capture margin beyond standard metric collection that commodity platforms cannot easily replicate across large enterprises Vendors combining all three consistently outperform single-capability rivals on renewal terms on every major account and expansion cycles.

Building AI-Driven Predictive Incident Prevention Capability

Building AI-driven predictive incident prevention that identifies unusual system behaviour before outages occur positions vendors to capture the fastest-growing AIOps-enabled segment that standard reactive alerting platforms cannot address without comparable machine learning and distributed systems investment across the required specialist expertise. Vendors who have already built this capability report winning a growing share of large enterprise contracts specifically because predictive prevention delivers measurable downtime reduction that reactive alerting alone cannot match, with AIOps-enabled platforms commanding roughly 26 to 32 percent pricing premium over standard monitoring subscriptions. This premium has held steady across the past several contract renewal cycles.
Market Impact: Commands roughly a 26 to 32 percent premium

Building Unified Full-Stack Consolidation Capability Now

Building unified full-stack consolidation capability that replaces fragmented point solutions with a single correlated platform directly addresses the sector's central competitive dynamic where consolidation speed increasingly determines which vendors can compete for the largest enterprise IT operations contracts across distributed cloud accounts. Vendors who have already built this capability report winning a growing share of enterprise contracts specifically because unified consolidation removes a meaningful tool-sprawl barrier customers value highly, with consolidated platforms commanding roughly 2 to 3 times the contract value of comparable point-solution sales. This gap continues widening as consolidation expertise becomes harder to replicate quickly.
Market Impact: Wins contracts worth 2 to 3 times point-solution value

Building Specialised Legacy Migration Tooling Capability

Investing in specialised migration tooling that compresses the timeline required to consolidate legacy monitoring point solutions onto unified platforms positions vendors to capture displacement opportunities that competitors relying on manual migration processes cannot address competitively against enterprises facing complex multi-tool infrastructure. Vendors who have already built this capability report winning a growing share of displacement contracts specifically because faster migration reduces the operational disruption risk customers weigh heavily during platform transition decisions, with specialised tooling reducing migration timelines by roughly 4 to 6 months relative to standard manual approaches. This approach has already proven effective at several major vendors.
Market Impact: Cuts migration timeline by 4 to 6 months

Who Controls the Margin Pool

Concentration sits moderate at a cr5 near 30 percent measured on global qualified subscription and licensing revenue, with a meaningful gap separating established observability vendors holding deep infrastructure and application tool relationships from a fragmented tail of smaller platform providers competing mainly within narrower mid-market or open-source-adjacent segments. That gap has held steady across the past several years of competitive activity.
Current competitive activity centres on three dimensions: building AI-driven predictive incident prevention to capture the fastest-growing AIOps-enabled segment, developing unified full-stack consolidation capability to serve enterprises facing tool sprawl across fragmented point solutions, and investing in specialised legacy migration tooling to accelerate displacement of entrenched monitoring stacks at established enterprise accounts. Vendors weak in any one of these three dimensions are increasingly losing consideration on the largest contracts.

Emerging pressure comes from open-source observability projects and cloud hyperscaler native tooling expanding into functionality previously the exclusive domain of specialist commercial vendors, which could compress margins on standard mid-market contracts while established specialists defend share through deeper AI correlation and consolidation specialisation these newer entrants have not yet matched. How quickly hyperscaler tooling closes the correlation expertise gap will determine whether rankings shift meaningfully over the next several years.
monitoring-tool-market-company-positioning-matrix-1788503493627

Competitive Moat and Risk Dimensions

DATADOG INC

Moat: Deep full-stack integration breadth

Datadog has built the broadest integrated observability platform among major vendors, letting its monitoring solution connect natively across infrastructure, application, log, and security signals that enterprise customers already operate across their distributed cloud environments. This integration depth gives Datadog an advantage in contracts specifically where customers increasingly value platform compatibility over standalone point-solution functionality alone.
DATADOG INC

Risk: Exposure to cloud spending cycles

A meaningful share of Datadog's monitoring revenue ties to broader enterprise cloud infrastructure spending cycles, which move with technology budget conditions and can slow sharply during periods of cloud cost optimisation affecting new customer acquisition and existing customer expansion opportunities across the enterprise customer base.
DYNATRACE INC

Moat: AI-driven root cause automation depth

Dynatrace has invested heavily in AI-driven root cause analysis technology that automatically identifies the source of incidents rather than requiring manual correlation across dashboards, giving it automation depth advantages that competitors with less mature AI engines have struggled to match within comparable accuracy and speed standards.
DYNATRACE INC

Risk: Narrower open-source community presence

Dynatrace's comparatively closed proprietary platform architecture means it has a narrower open-source developer community presence than competitors who have built dedicated open-standard integrations over several product generations, potentially disadvantaging it in contracts where customers prioritise open integration flexibility over deep proprietary automation depth alone, particularly among developer-led buying teams.

Players Tracked

Prominent Players

Datadog Inc
Dynatrace Inc
Splunk Inc
New Relic Inc
Elastic NV

Other Key Players

SolarWinds Corporation
Broadcom Inc
IBM Corporation
Grafana Labs
Sumo Logic Inc
LogicMonitor Inc
Catchpoint Systems Inc
Zabbix SIA
Nagios Enterprises LLC
Paessler AG
Icinga GmbH
Zoho Corporation
Site24x7 Inc
ServiceNow Inc
Progress Software Corporation

Recent Developments

MARCH 2026

Datadog Launches AI-Driven Predictive Incident Prevention Module

Datadog Inc launched a new AI-driven predictive incident prevention module integrated into its observability platform, targeting large enterprise customers seeking to identify unusual system behaviour and prevent outages before they trigger service disruption. The module draws on statistical models trained across a large library of prior validated infrastructure incident records.
Signal: Confirms established vendors are prioritising AI investment specifically to defend enterprise contract share against newer challengers.
DECEMBER 2025

Dynatrace Signs Multi-Year Enterprise Agreement With Global Bank

Dynatrace Inc signed a multi-year cloud platform agreement with a global banking enterprise, securing qualified deployment position across the organisation's expanding distributed infrastructure spanning multiple regional data centre operations. Terms were not disclosed, though the agreement covers deployment across several regional data centre operations over the contract term.
Signal: Shows AI-driven vendors are winning large enterprise contracts directly against established incumbent point-solution vendors, a notable shift in buyer preference.
AUGUST 2025

Elastic Expands Observability Engineering Team Capacity

Elastic NV expanded its observability engineering team capacity across its global research organisation, responding to rising demand from enterprise customers seeking faster unified platform deployment amid persistent talent constraints affecting the broader industry. The expansion follows sustained demand growth from customers pursuing faster unified platform deployment timelines.
Signal: Signals established vendors are investing in engineering capacity to defend contract share from newer competitors, a defensive move.

Cloud Infrastructure and Talent Cost Exposure

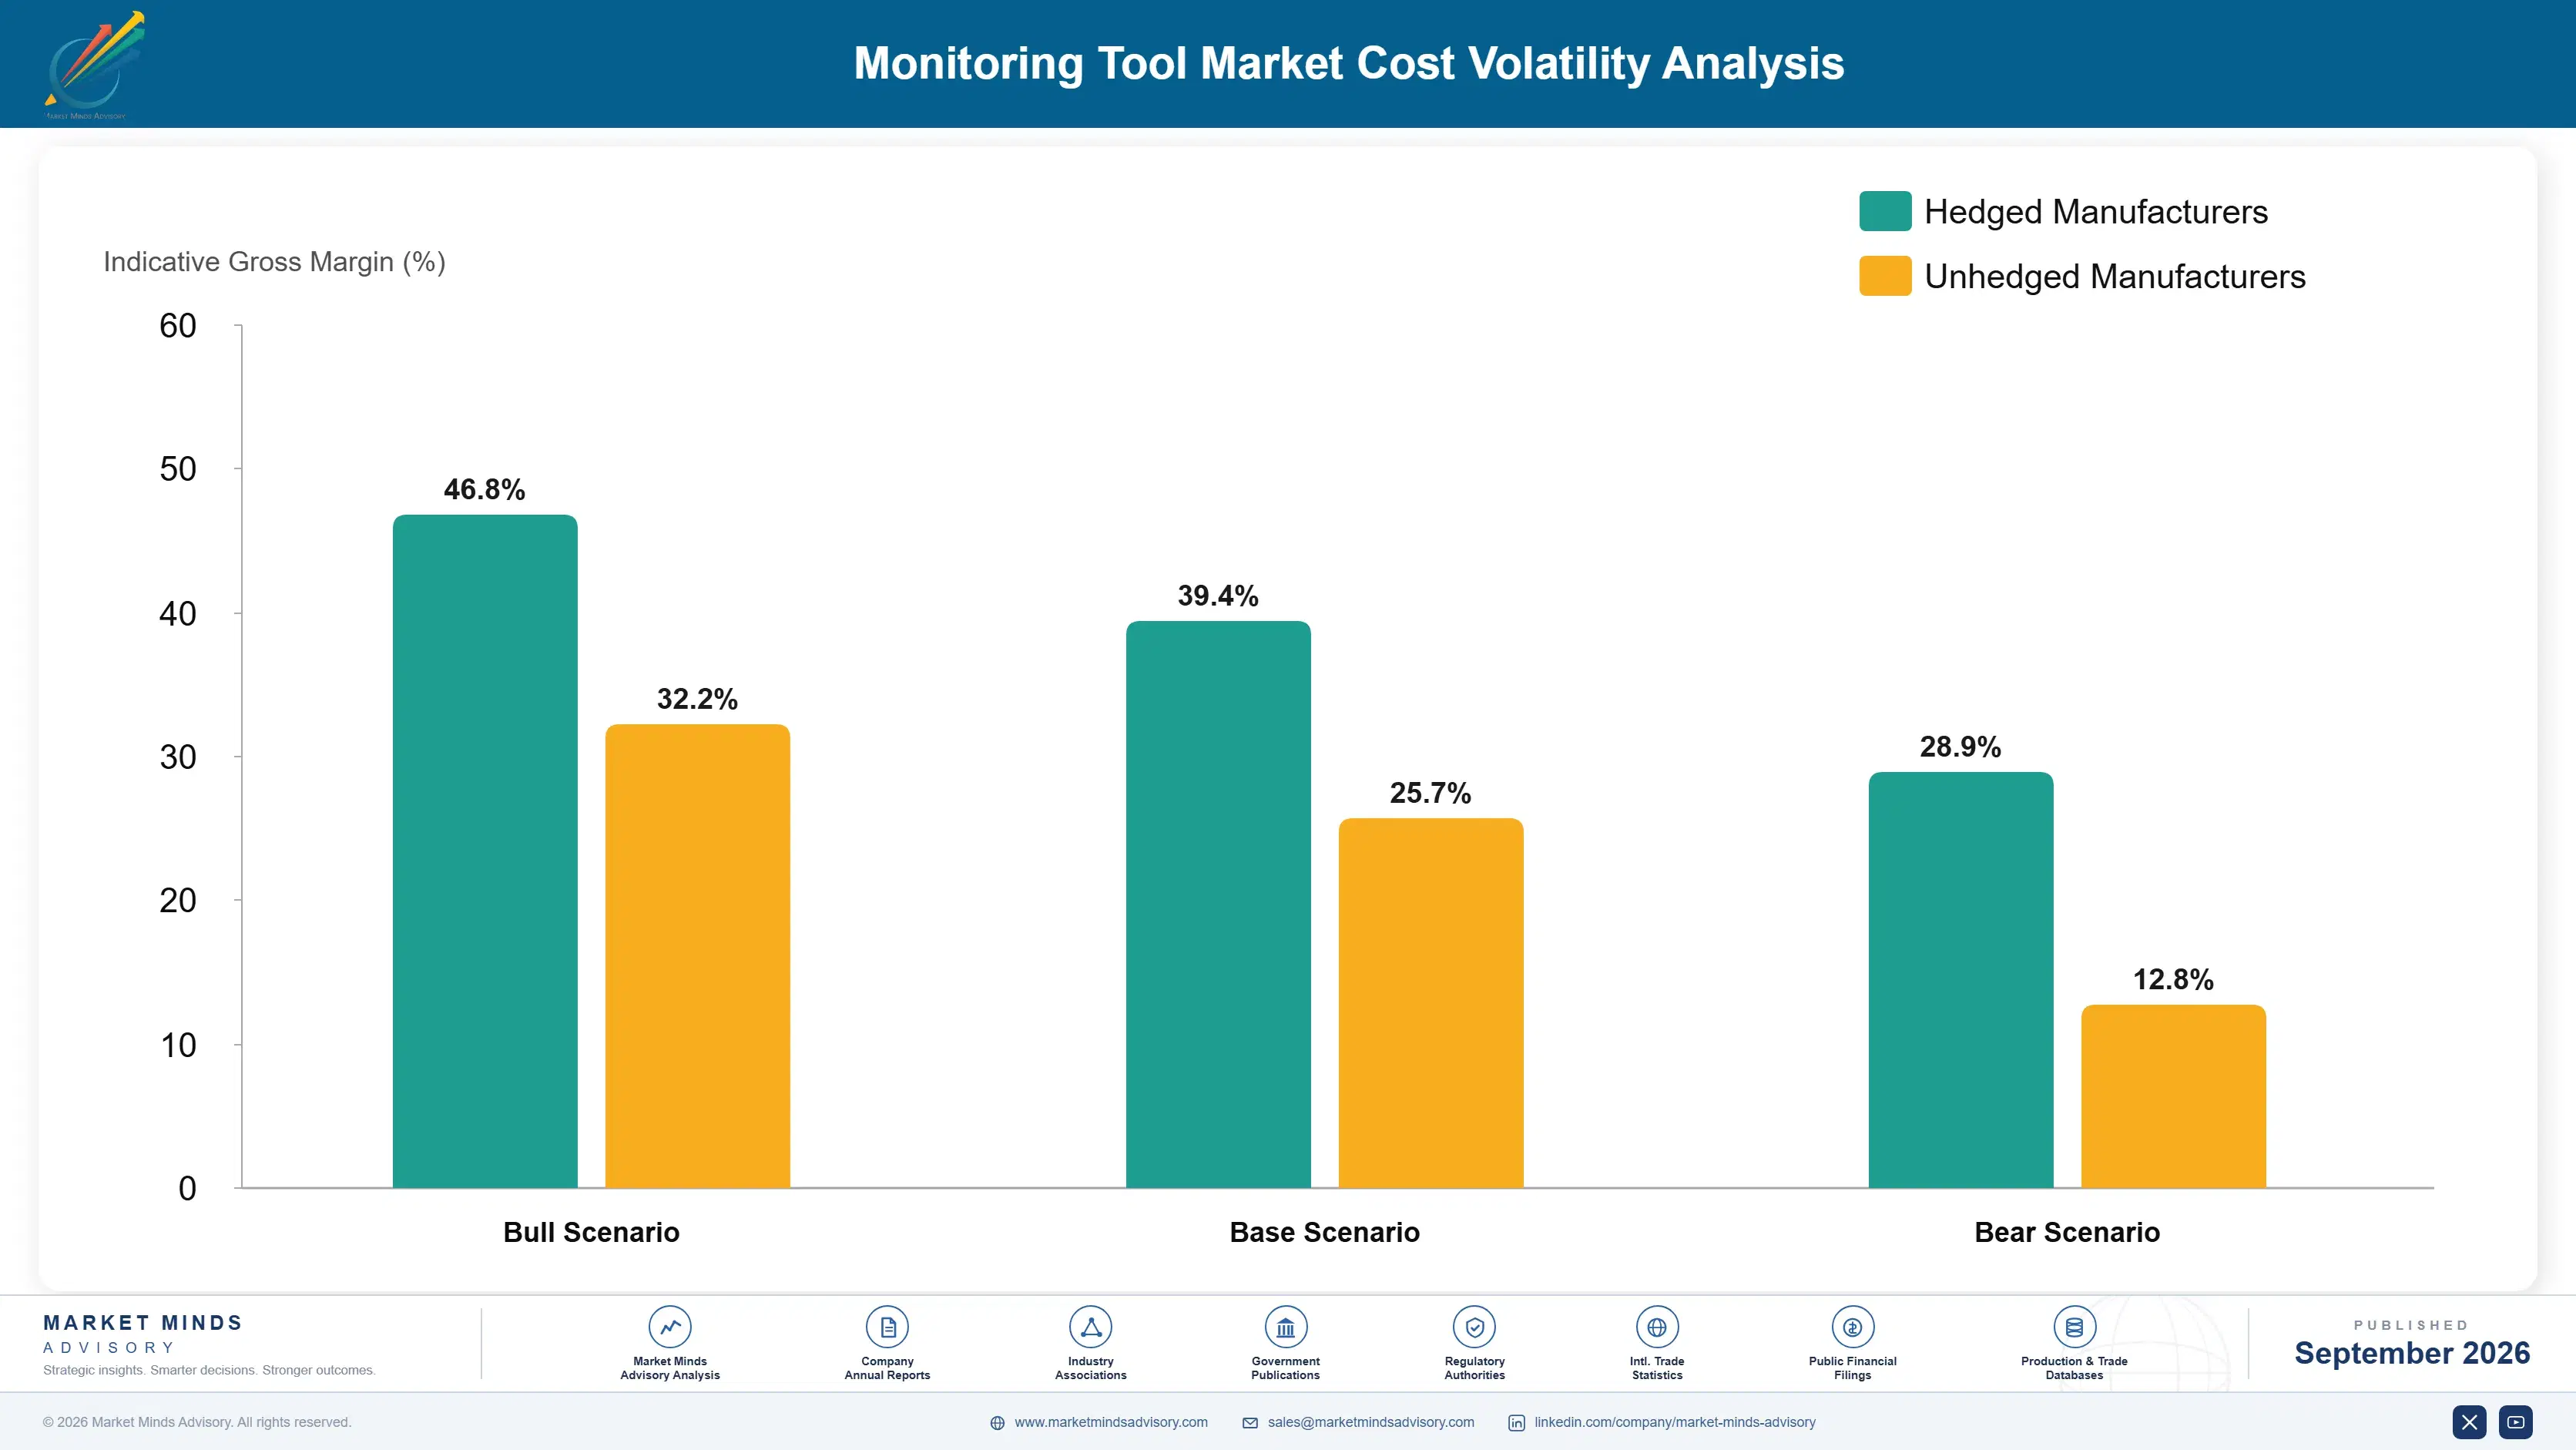
Cloud computing infrastructure and specialised engineering talent together typically account for a meaningful share of platform vendor operating cost, with infrastructure cost weighted heavily toward log ingestion and AI correlation processing and talent cost weighted toward combined distributed systems and machine learning expertise. Vendors serving large enterprise customers face the largest processing volumes given the scale of signal ingestion and retention requirements demand.
Cloud infrastructure pricing shifted meaningfully during a 2024 data center capacity tightening cycle tracked across major cloud provider and platform vendor annual reports, compressing margins within a single fiscal year and prompting several vendors to restructure customer pricing models around usage-based rather than flat subscription tiers. Several vendors publicly disclosed the resulting margin pressure in subsequent quarterly filings covering the affected period. Several smaller vendors reported the sharpest margin impact given their limited negotiating leverage with cloud providers.

Smaller vendors without negotiated enterprise cloud infrastructure agreements or established university recruiting pipelines carry the largest exposure to this pressure, while larger vendors with established cloud provider relationships and predictable engineering pipelines can better absorb these cost pressures across a broader customer base. Vendors serving primarily mid-market customers on thin subscription margins face the sharpest relative exposure to this.
monitoring-tool-market-cost-volatility-analysis-1788503493827

Multi-Year Cloud Infrastructure Provider Agreements

Larger vendors are negotiating multi-year cloud infrastructure agreements with favourable committed-use pricing rather than relying on standard on-demand rates, smoothing cost volatility and protecting margin on fixed-price customer contracts signed years in advance of delivery, particularly during periods of sustained demand growth, particularly during periods of sustained demand growth across major cloud regions across most contract tiers.

University Recruiting Pipeline Investment for Talent

Vendors are building dedicated university recruiting pipelines targeting engineers with combined distributed systems and machine learning expertise, reducing reliance on costly lateral hiring and building sustainable delivery capacity across successive graduating engineering cohorts, helping stabilise recruiting costs across successive hiring seasons, helping stabilise recruiting costs across successive graduating cohorts within a few hiring seasons.

Usage-Based Pricing Models Passing Through Costs

Several vendors are restructuring subscription pricing around usage-based tiers that pass through underlying infrastructure cost variability directly to customers, reducing vendor exposure to cloud pricing volatility while maintaining predictable margin across the enterprise customer base broadly. A handful of larger vendors have resisted this shift, preferring flat pricing for competitive reasons across the customer base broadly.

Portfolio Architecture for Margin Defence

Portfolio economics split across three tiers running from commodity-adjacent standard metric collection through certified enterprise-grade systems to next-generation AI-driven AIOps platforms, with gross margin widening meaningfully at each successive tier as correlation depth and prevention complexity increase across the range. Vendors typically enter through the certified tier and expand upward as they build AIOps and consolidation engineering depth. This progression mirrors patterns seen across other.
Volume still concentrates in the certified enterprise-grade tier where most current large enterprise contracts sit today, but the AIOps platform tier is growing faster and increasingly determines which vendors win the largest multi-year distributed infrastructure agreements across major technology and financial services accounts. This tension between defending volume and chasing premium contracts increasingly shapes vendor product roadmaps. Vendors that can move customers up this tier structure over time.

High-value margin pools concentrate specifically around AI-driven AIOps platforms and consolidation-driven deployments, where distributed systems complexity and specialist expertise keep standard metric collection competitors from competing effectively on price alone across the largest enterprise accounts. Building presence in both pools simultaneously is increasingly the strategy leading vendors pursue. Vendors without meaningful presence in either pool increasingly struggle to defend pricing on renewal.

Volume / Commodity-Adjacent Tier

Standard metric collection tools meeting baseline mid-market infrastructure monitoring specifications, sold mainly on price into smaller enterprise contracts without extensive correlation requirements. Renewal rates here run lower than higher tiers given weaker switching costs.
Gross Margin: 18%-24%

Premium / Certified Tier

Certified enterprise-grade systems meeting large-scale distributed infrastructure monitoring standards, commanding meaningful price premiums over standard tools given the correlation barrier competitors must clear first. Buyers in this tier weigh resolution-speed track record heavily during vendor selection.
Gross Margin: 32%-38%

Sustainability / Regulatory / Next-Generation Tier

AI-driven AIOps platforms sold into flagship distributed enterprise contracts, carrying the widest margins given prevention complexity and scarce qualified engineering capacity. This tier is growing fastest as buyers prioritise predictive prevention over standard reactive alerting.
Gross Margin: 42%-50%
monitoring-tool-market-portfolio-architecture-1788503494355

High-value Sub-segments and Strategic Watch-out

AI-Driven Predictive Prevention Enterprise Platforms

Predictive prevention platforms serving flagship distributed enterprise contracts command the widest margins in the category as organisations shift toward continuous incident prevention, though the qualified vendor pool remains small given the technology investment this segment requires today. Vendors here can charge substantially more given the scarcity of rivals.
Gross Margin: 44%-50%

Unified Full-Stack Consolidation Platforms

Unified platforms serving full-stack tool consolidation grow steadily as enterprises continue expanding distributed cloud complexity, commanding solid premiums over standard tools though not yet matching predictive platform margins across most current contracts. This pool is expected to expand steadily as more enterprises complete consolidation programmes.
Gross Margin: 34%-40%

Standard Certified Mid-Market Monitoring Platforms

Standard certified platforms serving mainstream mid-market enterprises remain the largest volume pool by a wide margin, carrying moderate but stable margins as continued cloud transformation investment guarantees multi-year subscription visibility across established relationships. This remains the segment most vendors depend on for predictable near-term revenue.
Gross Margin: 24%-30%

Legacy On-Premises Point Solution Tools

Legacy on-premises tools sold into smaller enterprise contracts without cloud or AI requirements face the greatest margin compression risk as unified cloud platforms gradually displace standalone point solutions across new procurement decisions industry-wide. Vendors still selling exclusively into this segment face a shrinking addressable customer base.
Gross Margin: 12%-18%

Adoption Depth and Contract Renewal Cycles

Monitoring tool revenue behaves like a multi-year annuity tied to enterprise cloud transformation cycles, since a deployed platform typically retains its position across the full multi-year contract term once initial infrastructure onboarding and IT operations team training clears successfully within a given organisation's observability programme. Multi-year contract terms are increasingly standard across the largest distributed enterprise accounts today. Multi-year contract terms are increasingly standard across the largest distributed enterprise accounts today.
Adoption depth varies meaningfully by customer tier: large distributed enterprises integrate qualified vendors deeply into multi-year infrastructure and application observability relationships spanning several platform generations, while smaller mid-market organisations often switch providers more frequently based on subscription pricing competitiveness alone without comparable long-term partnership commitments established. Regional shared service centres sit somewhere between these two extremes, valuing flexibility over the deepest possible integration. This flexibility preference is expected to persist.

A generational shift is underway as IT operations engineers who managed manual dashboard review for decades give way to teams expecting AI-driven correlation by default, accelerating platform adoption faster than the underlying contract renewal cycle alone would suggest across most established distributed enterprise organisations today. This generational change is reinforcing the broader shift toward predictive prevention already underway.
monitoring-tool-market-end-use-penetration-index-1788503494853

Where Vendors Should Focus Investment Next

These are among the four positions where our research anticipates prominent divergence between winners and laggards over the coming forecast period. Each is grounded in the demand model, the regulatory perimeter, and the announced capacity pipeline.
01 / AIOPS CAPABILITY INVESTMENT

Build AI-Driven Predictive Prevention Now

Large distributed enterprises increasingly treat predictive incident prevention as a baseline procurement expectation rather than a differentiator, and vendors without this capability risk losing competitive bids regardless of metric collection functionality offered against better-integrated alternatives already available in the market. Vendors who have already built predictive capability report winning a growing share of enterprise contracts specifically because it delivers measurable downtime reduction that reactive alerting alone cannot match. MMA advises treating AIOps investment as a near-term competitive prerequisite, not a future roadmap item.
02 / CONSOLIDATION STRATEGY PRIORITY

Build Unified Full-Stack Platforms Ahead of Demand

Expanding distributed cloud complexity is expanding consolidation demand faster than most vendors have prepared for, meaning demand for unified platform capability will keep expanding regardless of near-term fluctuations in overall enterprise technology budget cycles. Vendors who invest in consolidation ahead of this expansion are positioned to win contracts that fragmented point-solution competitors simply cannot serve, a durable engineering advantage rather than a temporary pricing edge. MMA recommends treating consolidation as a multi-year commitment justified by clear architecture complexity trends already underway.
03 / MIGRATION TOOLING INVESTMENT

Build Legacy Migration Capability for Displacement

Legacy point-solution displacement represents a meaningfully larger addressable opportunity than new mid-market customer acquisition alone, but integration complexity keeps many established enterprises locked into fragmented tools regardless of demonstrated advantages competing unified alternatives could otherwise deliver. Vendors who have already built specialised migration tooling report winning a growing share of displacement contracts specifically because faster migration reduces the operational disruption risk customers weigh heavily during platform transition decisions. MMA sees migration capability as an increasingly important prerequisite for winning the largest displacement opportunities going forward.
04 / CLOUD INFRASTRUCTURE COST MANAGEMENT

Negotiate Multi-Year Cloud Agreements Before the Next Cycle

Cloud infrastructure cost volatility has already compressed margins at vendors without favourable committed-use agreements, and this exposure grows as more vendors sign fixed-price multi-year contracts without matching infrastructure cost protection built into contract terms from the outset. Negotiating multi-year cloud infrastructure agreements ahead of the next pricing cycle protects margin through the full contract term regardless of subsequent infrastructure cost swings. MMA sees infrastructure cost management as a prerequisite for vendors pursuing the largest enterprise framework agreements, not merely a defensive measure.

Engagement Snapshot From the Field

A live engagement with an industry participant carrying material or product regulatory and market exposure ahead of a defining policy shift, showing how our research translates into a defensible multi-year portfolio strategy.
MARKET MINDS ADVISORY · CLIENT ENGAGEMENT SUMMARY
Monitoring Tool Producer Strategic Portfolio Review and Transition Roadmap 2026·Investment Scenario on Monitoring Tool Exposure Evaluation 2025-26
CLIENT PROFILE
The client is a global financial services firm managing multiple regional IT operations centres and approached MMA following persistent tool sprawl across its legacy point-solution monitoring stack, reportedly costing over 8 million dollars in delayed incident resolution annually (client-reported, unverified by MMA) tied to fragmented alert data and slow cross-team collaboration. The organisation operates across seven regional data centres and had grown substantially through recent acquisition activity.
STRATEGIC CHALLENGE
Leadership needed an evidence-based business case justifying investment in a unified AI-driven observability platform across multiple regional data centres, but internal IT operations and finance teams disagreed sharply on realistic resolution-time improvement assumptions and appropriate consolidation timeline expectations for the transition. Leadership also needed confidence that consolidation would not disrupt active incident response operations already underway across sites.
MMA APPROACH
MMA benchmarked comparable financial services platform consolidation programmes, modelled resolution-time improvement against historical fragmentation and delay costs, and built a phased consolidation framework prioritising the highest-value data centres by both alert volume and cross-team collaboration frequency. The framework explicitly sequenced consolidation to minimise disruption to active incident response operations throughout the transition.
KEY FINDINGS
  1. Data centres with the highest cross-team collaboration frequency accounted for a disproportionate share of documented resolution delays relative to their share of overall alert volume.
  2. Unified platform consolidation reduced modelled duplicated alert triage effort substantially based on comparable financial services consolidation data reviewed across similar organisational structures.
  3. Prioritising consolidation by collaboration frequency rather than data centre size alone improved the projected resolution speed return meaningfully within the proposed phased consolidation structure.
  4. Bundling AI-driven predictive prevention with the consolidation contract shortened projected value realisation timeline versus a traditional separately procured platform and analytics approach.
CLIENT PROFILE
The client is a global financial services firm managing multiple regional IT operations centres and approached MMA following persistent tool sprawl across its legacy point-solution monitoring stack, reportedly costing over 8 million dollars in delayed incident resolution annually (client-reported, unverified by MMA) tied to fragmented alert data and slow cross-team collaboration. The organisation operates across seven regional data centres and had grown substantially through recent acquisition activity.
STRATEGIC CHALLENGE
Leadership needed an evidence-based business case justifying investment in a unified AI-driven observability platform across multiple regional data centres, but internal IT operations and finance teams disagreed sharply on realistic resolution-time improvement assumptions and appropriate consolidation timeline expectations for the transition. Leadership also needed confidence that consolidation would not disrupt active incident response operations already underway across sites.
MMA APPROACH
MMA benchmarked comparable financial services platform consolidation programmes, modelled resolution-time improvement against historical fragmentation and delay costs, and built a phased consolidation framework prioritising the highest-value data centres by both alert volume and cross-team collaboration frequency. The framework explicitly sequenced consolidation to minimise disruption to active incident response operations throughout the transition.
KEY FINDINGS
  1. Data centres with the highest cross-team collaboration frequency accounted for a disproportionate share of documented resolution delays relative to their share of overall alert volume.
  2. Unified platform consolidation reduced modelled duplicated alert triage effort substantially based on comparable financial services consolidation data reviewed across similar organisational structures.
  3. Prioritising consolidation by collaboration frequency rather than data centre size alone improved the projected resolution speed return meaningfully within the proposed phased consolidation structure.
  4. Bundling AI-driven predictive prevention with the consolidation contract shortened projected value realisation timeline versus a traditional separately procured platform and analytics approach.
RECOMMENDED STRATEGY
Phase 1: Phase 1 (Months 1 to 3): Consolidate the highest-collaboration data centres first, bundled with AI-driven predictive prevention included from the outset. Phase 2: Phase 2 (Months 4 to 9): Extend consolidation across remaining priority data centres identified through the collaboration-based prioritisation framework developed during scoping. Phase 3: Phase 3 (Months 10 to 14): Retire the legacy point-solution monitoring stack entirely once all data centres complete the consolidation transition successfully.
OUTCOME
The client approved a fourteen-month consolidation programme following the engagement, with Phase 1 data centre consolidation reportedly reducing mean time to resolution by roughly 39 percent against the prior baseline (client-reported, unverified by MMA), supporting the case for full organisation consolidation continuation. Leadership credited the phased structure with maintaining operational continuity throughout the transition period.

Frequently Asked Questions

Foundational context covering the market sizes, CAGR, scope, country, region and competition that inform every finding below. This section is provided to cover basics and most often pre-purchase conversations, answered from the MMA Primary Research Dataset.

What is the current size of the Monitoring Tool Market?

The global monitoring tool market reached approximately 15.0 billion dollars in 2025. North American technology and financial services enterprises anchor a substantial share of global demand within this total.

How large will the Monitoring Tool Market be by 2036?

MMA projects the market reaching approximately 47.28 billion dollars by 2036 under the base case scenario. AI-driven AIOps adoption and distributed cloud complexity both support this trajectory.

What is the CAGR for the Monitoring Tool Market 2026 to 2036?

The base case CAGR is 11.0 percent across the forecast period. Bull and bear scenarios range between roughly 9.8 and 12.3 percent depending on AI adoption pace and tool sprawl consolidation speed.

Which segment is growing fastest?

AI-driven AIOps and anomaly detection platforms lead at 17.2 percent CAGR, well above the overall market rate. Enterprises shifting budget toward continuous incident prevention is the primary driver behind this growth.

Who are the major companies in the Monitoring Tool Market?

Leading vendors include Datadog Inc, Dynatrace Inc, Splunk Inc, New Relic Inc, and Elastic NV. Combined, the top five hold roughly 30 percent of global qualified subscription and licensing revenue.

Which country is growing fastest?

India leads among major markets at approximately 15.0 percent CAGR, driven by its rapidly expanding enterprise software services sector. Continued global capability centre expansion reinforces this pace across the country.

Report Segmentation Architecture

The full report scope spans multiple orthogonal segmentation dimensions, with cross-tabulated demand data provided for each dimension pair. Coverage extends further to regional breakdowns, trend trajectories, and the competitive detail needed to support segment-level decision-making.

By Core Functionality Type

  • Infrastructure Monitoring Software
  • Application Performance Monitoring Software
  • Network Monitoring Software
  • Log Management and Analytics Software
  • Cloud-Native Full-Stack Observability Platforms
  • AI-Driven AIOps and Anomaly Detection Platforms

By End-Use Industry

  • Technology and Software
  • Financial Services and Banking
  • Healthcare and Life Sciences
  • Retail and E-Commerce
  • Government and Public Sector

By Commercial Dimension

  • Enterprise Subscription Contracts
  • Mid-Market Licensing
  • Managed Service Agreements
  • Implementation and Consulting Services

By Region

  • North America
  • Western Europe
  • East Asia
  • South Asia and Pacific
  • Latin America
  • Middle East and Africa
  • Eastern Europe

Scope, Methodology, and Coverage

Every figure in this report is reproducible from documented input assumptions. The scope below maps the historical period, the forecast horizon, the segmentation dimensions, and the countries covered, alongside the underlying primary and qualitative methodology.
Historical Period
2020 to 2025
Forecast Period
2026 to 2036
Base Year
2025 (USD billions; MMA Primary Research Dataset, September 2026)
Market Definition
This report covers software platforms for monitoring, correlating, and analysing infrastructure, application, network, and log data across on-premises, cloud, and hybrid environments, including AI-driven AIOps and anomaly detection systems used by enterprise IT operations organisations. It excludes standalone security information and event management software focused primarily on threat detection, general IT service management ticketing software unrelated to monitoring workflow, and network hardware not bundled with monitoring software licensing.
Quantitative Units
USD billions (current prices); active monitored host and container licenses
Segmentation Dimensions
By Core Functionality Type; By End-Use Industry; By Commercial Dimension; By Region
Regions Covered
North America, Western Europe, East Asia, South Asia and Pacific, Latin America, Middle East and Africa, Eastern Europe
Countries Covered
USA, China, India, Japan, South Korea, Germany, France, UK, Canada, Australia, Brazil, Mexico, Indonesia, Vietnam, Singapore, UAE, Saudi Arabia, South Africa, Nigeria, Turkey, Poland, Czech Republic, Netherlands, Italy, Spain, Sweden, Switzerland, Argentina, Colombia, and additional markets relevant to this sector
Key Companies Profiled
Datadog Inc, Dynatrace Inc, Splunk Inc, New Relic Inc, Elastic NV, SolarWinds Corporation, Broadcom Inc, IBM Corporation, Grafana Labs, Sumo Logic Inc, LogicMonitor Inc, Catchpoint Systems Inc, Zabbix SIA, Nagios Enterprises LLC, Paessler AG, Icinga GmbH, Zoho Corporation, Site24x7 Inc, ServiceNow Inc, Progress Software Corporation
Quantitative Methodology
Primary survey, n=3,800 respondents, Q4 2025, six countries; demand-side model with trade association cross-validation
Qualitative Methodology
47 expert interviews, Q4 2025; applied to validate demand model assumptions, identify emerging dynamics, and assess competitive positioning
Report Format
PDF and XLSX data workbook (Word format preview document)
Publisher
Market Minds Advisory
Report Code
MMA-2026-TEC-581
Published
September 2026
Contact
sales@marketmindsadvisory.com | www.marketmindsadvisory.com

Purchase the full Monitoring Tool Market Report (2026 to 2036).

The full MMA report delivers granular segmentation across six functionality tiers, seven-region demand and pricing forecasts through 2036, and a detailed competitive assessment of twenty profiled vendors including AI correlation capability and consolidation positioning. It includes a dedicated enterprise AIOps adoption tracker covering major cloud transformation markets, plus quarterly cloud infrastructure cost pass-through analysis. Buyers receive editable data tables supporting internal capacity planning and vendor evaluation models across their full deployment portfolio. A dedicated appendix profiles operational resilience regulation timelines across major jurisdictions, with commentary on how requirements are expected to evolve through the forecast period.
Seven-region demand and pricing forecasts to 2036
Twenty-vendor AI correlation capability status tracker
Enterprise cloud transformation adoption pipeline tracker
Quarterly cloud infrastructure cost pass-through model
Segment-level margin benchmarking across all tiers
Editable capacity planning and vendor evaluation tables

Built For The People Who Decide

From boardroom strategy to bench-side execution, this report is read cover-to-cover by leaders shaping the next decade of their industry, turning demand scenarios, market dynamics and valuation benchmarks into decisions.
CXOs/ Presidents/ VPs/ Managers
M&A and Corporate Development
Strategy Teams and R&D Heads
Procurement and Product Directors
Regulatory and Compliance Leaders
Investor Relations and Equity Analysts