Market Minds Advisory
Molded Fiber End Caps Market

Molded Fiber End Caps Market: Displacing Expanded Polystyrene Corner Protection Across Appliance, Electronics and Furniture Transit

Corner protection has become a regulatory question rather than an engineering one, and molded fiber is taking expanded polystyrene volume wherever a producer responsibility fee or a state ban makes foam expensive to keep using.

Lead Analyst

Bilal Shaikh

Published

September 2026

Make Smarter Decisions with Customized Research Insights

Request a free sample report and evaluate market opportunities, growth trends, and competitive dynamics relevant to your business needs.

2025 MARKET VALUE$0.9BMarket Size 2025
2036 FORECAST VALUE$2.1BBase Case , 2026 to 2036
CAGR 2026 TO 20368.6 %Bull 9.8% / Bear 7.4%
INCREMENTAL OPPORTUNITY$1.2BNet 10- year value creation
EXPANSION MULTIPLE2.28x2036 value over 2026 base
Strategic Levers
M&A Pipeline
Regional Outlook
Country Rankings
Competitive Intelligence
Segmental Deep-dive
Call-Us : 91 93563 13602

Executive Snapshot and Market Trajectory

Nobody switched away from expanded polystyrene because molded fiber protects better. They switched because foam corner blocks became a regulatory liability, and the packaging engineer was told to find something that would not attract a fee or a ban. Damage rates came up later, once compliance had decided the material.
Type 3 thermoformed precision end caps compound at 12.9%, exactly 1.50 times the market, because they hold tolerances tight enough to replace foam on flat panel televisions and appliance corners where a loose fit means a damaged unit. East Asia takes 34% of consumption, well above the usual band, and the reason is simple: end caps are fitted at the packing line, and the packing lines are there. Fitting happens where the boxing happens.
This is a fragmented market, with the five largest suppliers holding only 26% between them. Freight economics reinforce that, since an end cap is mostly air and expensive to move any distance at all. Tooling costs little against injection moulding, so a converter with a forming line and a customer within reach competes perfectly well against companies many times its size. Protection performance barely enters the discussion now.
Market Definition
The market covers molded pulp end caps, corner blocks and edge protectors used to immobilise and cushion products during transit, spanning thick-wall, transfer-molded, thermoformed precision and processed or coated fiber types. Molded fiber food service items, egg and produce packaging, and protective packaging made from expanded foam, corrugated board or inflatable film all fall outside scope.
Base Year Value
$0.9B in 2025 (MMA Primary Research Dataset, August 2026)
Forecast Period
2026 to 2036, eleven discrete annual values
CAGR
8.6% base case. Bull 9.8%. Bear 7.4%.
Fastest Growth Segment
Type 3 Thermoformed Precision End Caps: 12.9% CAGR
Fastest Growth Country
Vietnam: 11.6% CAGR
Fastest Growth Region
South Asia and Pacific: 10.8% CAGR
Largest Region
East Asia: 34% of 2025 global value
Market Leaders
Huhtamaki, Sonoco Products Company, UFP Technologies, Keiding Inc., Henry Molded Products. Source: MMA Analysis based on company annual reports.
Primary Survey
n=3,800 procurement and R&D decision-makers, Q4 2025, six countries
Methodology
Demand-side build-up, cross-validated against public data, 47 expert interviews

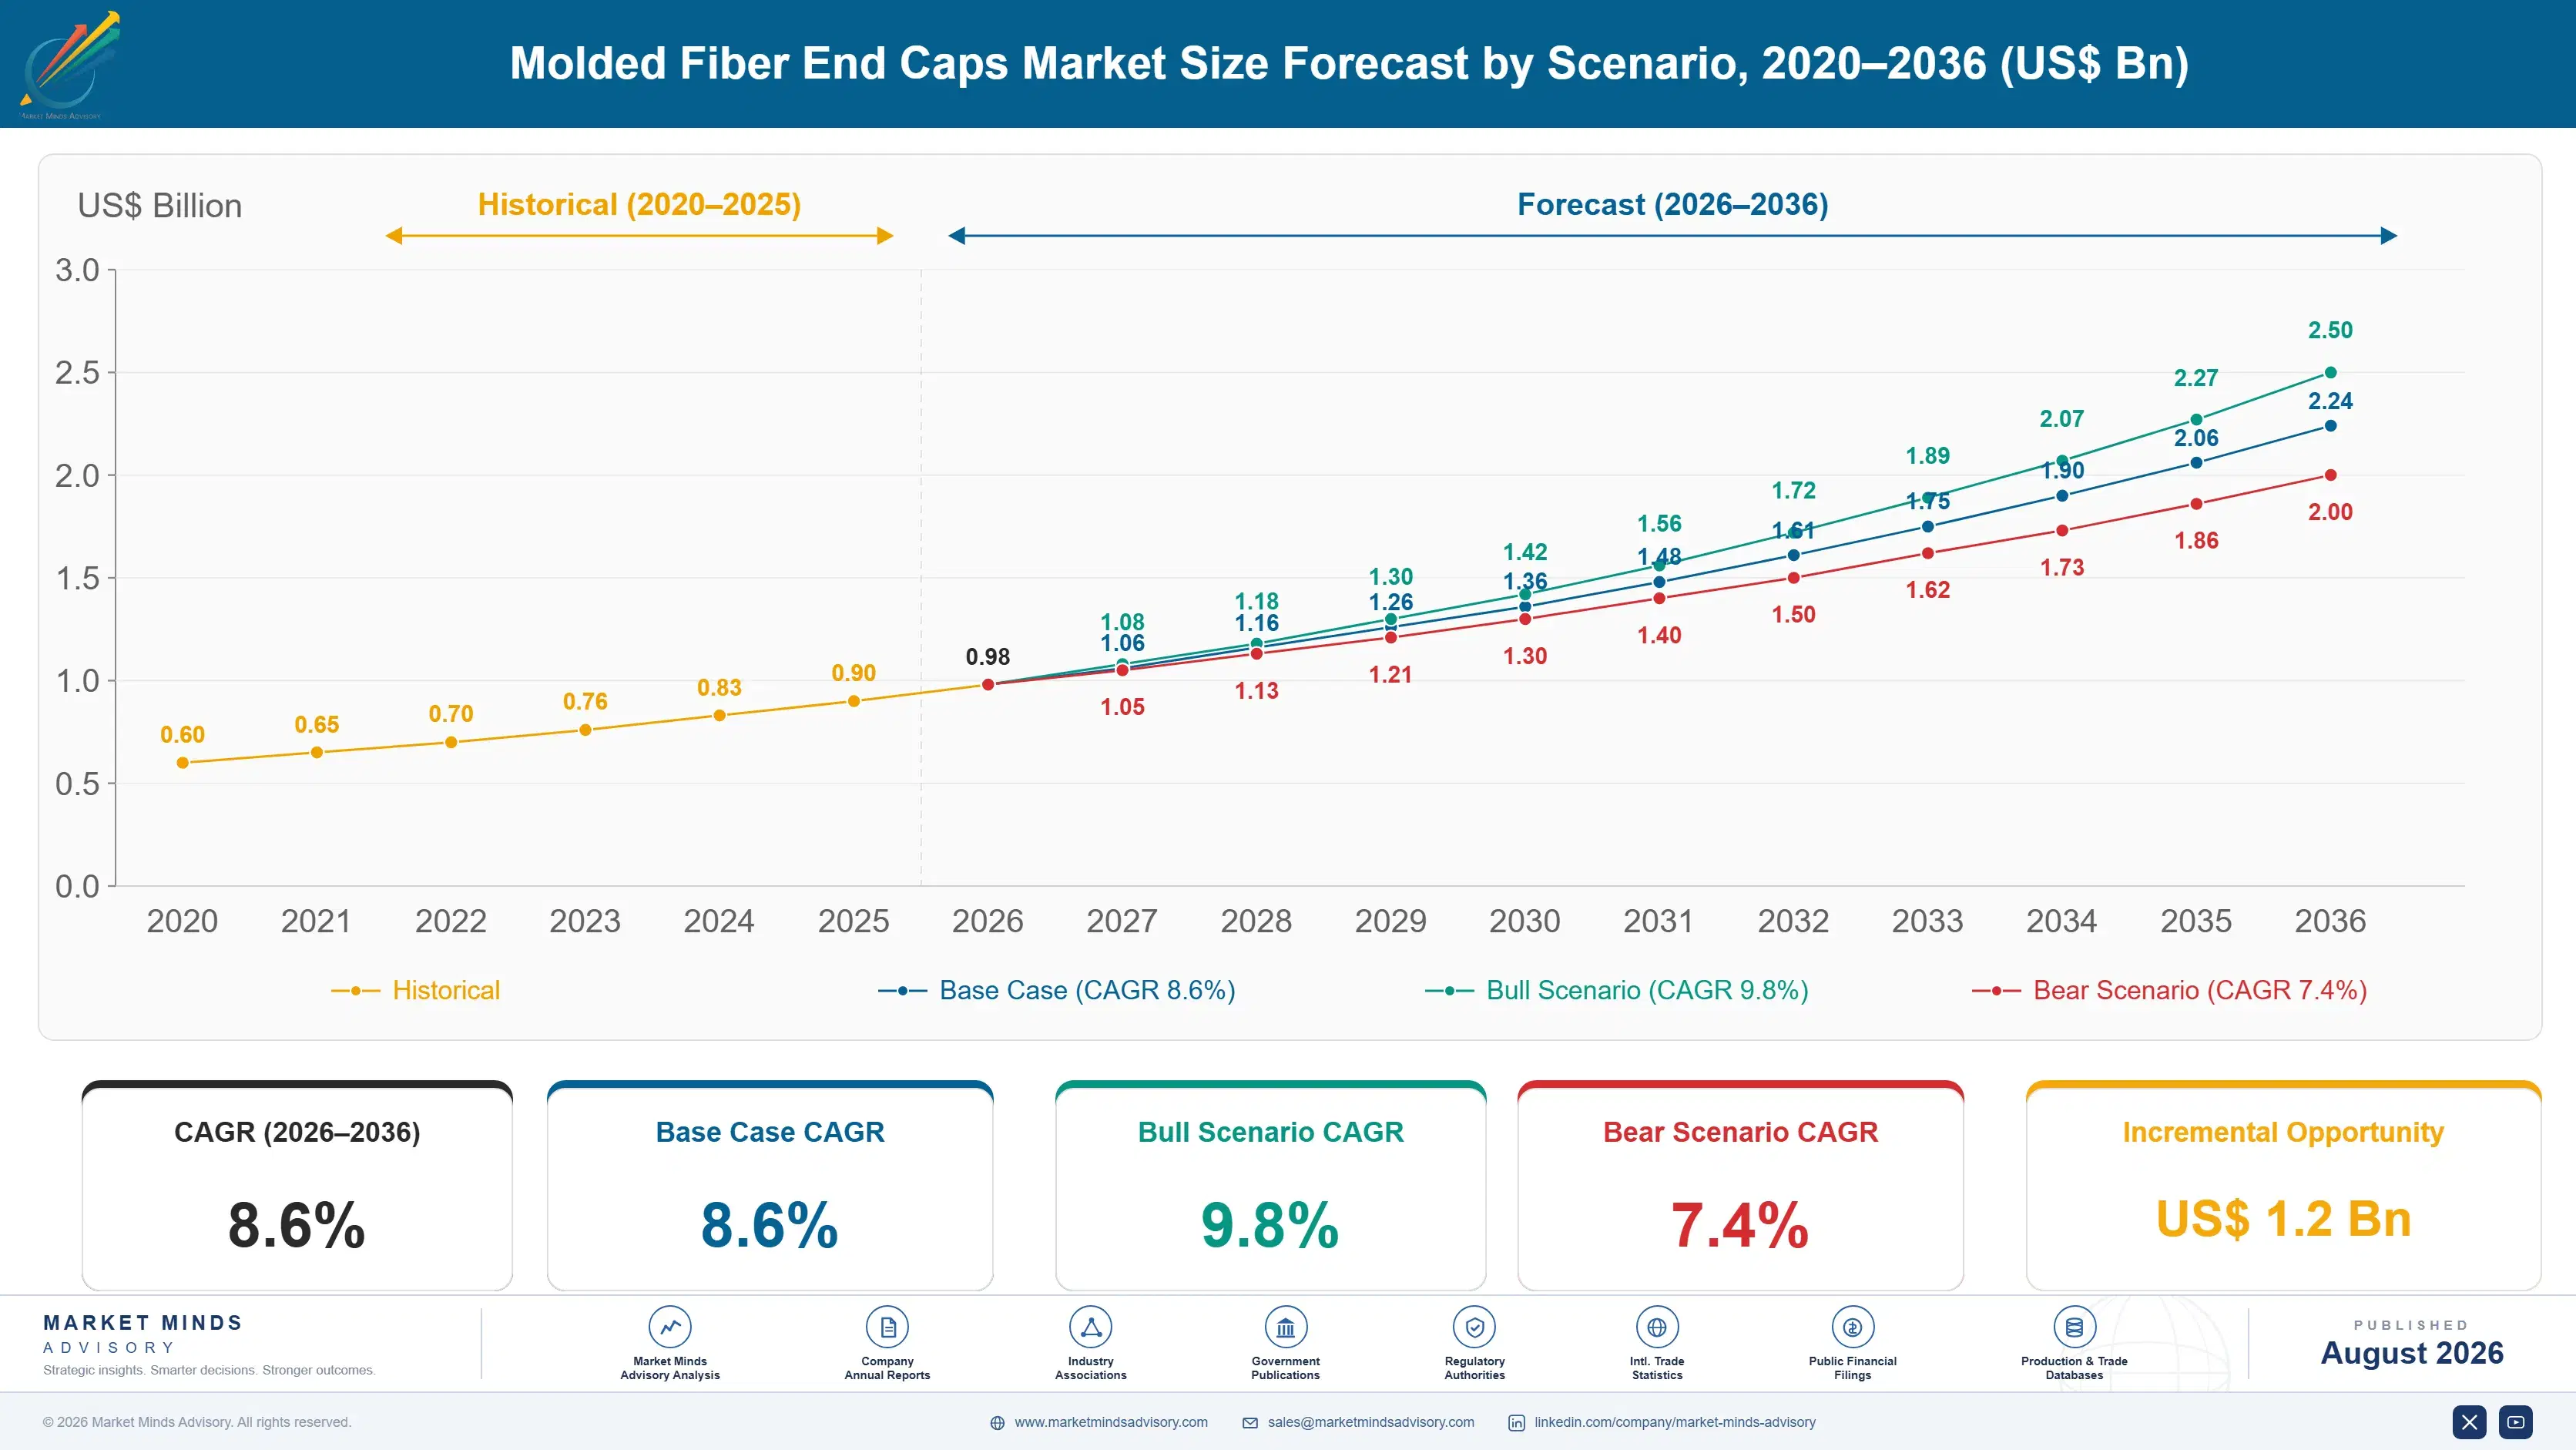
Molded Fiber End Caps Market Forecast Scenarios

molded-fiber-end-caps-market-size-forecast-scenario-1787307264344
Growth across 2020 to 2025 ran at an implied 7.2% and came in two distinct waves. Pandemic-era appliance and electronics shipping lifted protective packaging volume through 2021, then the genuine driver arrived: European producer responsibility fee schedules and a widening set of United States state foam restrictions made expanded polystyrene expensive to keep specifying. Regulation, not performance, moved the volume.
The base case at 8.6% rests on three mechanisms. Extended producer responsibility fee schedules across European Union member states price foam packaging well above fiber, and the gap widens as modulation tightens. Brand plastic reduction commitments at appliance and electronics manufacturers convert into packaging specification changes on a two to three year cycle. And thermoforming has closed enough of the precision gap that fiber now qualifies for products it could not protect a decade ago.
The bull case at 9.8% follows from the European Packaging and Packaging Waste Regulation tightening foam restrictions further, which would force conversion on schedule rather than on commercial judgement. The bear case at 7.4% assumes recovered paper pricing stays elevated and drying energy costs remain high, narrowing the cost gap that makes fiber attractive against foam in the first place.

Why a Corner Block Became a Compliance Decision

An end cap is a strange thing to sell. It costs a few cents, it is thrown away within days of manufacture, and the person specifying it cares about exactly one number: how many units arrive damaged. For forty years expanded polystyrene answered that question better than anything else, at a price nothing else approached. Then the question changed.
TOP FIVE CONCENTRATION26%Combined share held by the five largest global suppliers
FOAM DISPLACEMENT RATE6.2 points annuallyAnnual share transfer from expanded polystyrene to fiber alternatives
RECOVERED PAPER SHARE31% of COGSFurnish input as proportion of total manufacturing cost
DRYING ENERGY INTENSITY1.4 MWh per tonneThermal energy required to dry formed pulp parts
ECONOMIC SHIPPING RADIUS450 kmDistance beyond which freight overwhelms delivered part value
TOOLING QUALIFICATION TIME11 weeksTypical lead time from design freeze to production release
What changed was who pays for disposal. European producer responsibility schemes now modulate fees by material recyclability, and foam sits at the expensive end of every schedule. Several United States states restrict it outright. A packaging engineer facing a fee schedule and a corporate plastic reduction target does not run a protection comparison; they run a compliance comparison, and fiber wins that one before testing starts.
The remaining argument is technical, and it is being settled by process rather than by material. Thick-wall molded fiber never held tolerance well enough for a flat panel television corner. Thermoformed fiber does, with smooth surfaces and wall thickness control that approaches injection moulding. That single process advance opened applications fiber had been locked out of entirely. Material chemistry had almost nothing to do with it.
"The engineering case for molded fiber over foam was weak in 1995 and it is only moderately better now. What actually changed is that somebody put a price on the disposal, and once that happened the protection debate stopped mattering to anyone making the specification decision."
Director, Protective Packaging and Transit Materials Practice · MMA Protective a

Market Trends

Producer Responsibility Fee Modulation Prices Foam Out of Specification

European Union member state producer responsibility schemes now modulate fees by material recyclability, and expanded polystyrene attracts penalty rates across France, Italy, the Netherlands and Spain. The European Commission's Packaging and Packaging Waste Regulation tightens the framework further. Molded fiber enters the recovered paper stream and attracts the lowest fee bands available. For a manufacturer shipping millions of units annually the fee differential alone justifies conversion before any protection or freight comparison is run at all, which has moved specification decisions out of engineering entirely. Compliance functions now sit in the specification meeting.
Market Impact: Live programmes at 44% of manufactu
Thermoforming Opens Applications Thick-Wall Fiber Could Never Serve

Type 3 thermoformed fiber holds wall thickness and dimensional tolerance far tighter than conventional thick-wall pulp moulding, with smooth surfaces on both faces. That precision matters for flat panel displays, appliance fascias and electronics where a loose corner fit transmits shock to the product rather than absorbing it. The segment compounds at 12.9% against a market at 8.6%. Tooling costs more and cycle times run longer, but the applications it opened were previously closed to fiber at any price, which makes the comparison straightforward. Converters without the capability cannot quote that work at all.
Market Impact: Single-state rules converting 100%

Market Opportunities and Growth Drivers

Brand Plastic Reduction Commitments Convert Into Specification Changes

Appliance and electronics manufacturers have published packaging plastic reduction targets with dates attached, and those commitments reach the packaging engineer as a specification instruction rather than an aspiration. Foam corner blocks are among the most visible plastic components in a transit pack and among the easiest to substitute. Conversion programmes typically run on a two to three year cycle covering tooling, drop testing and line qualification, and roughly 44% of large appliance manufacturers have a live conversion programme underway at present. Corner blocks are usually the first component addressed, because substitution is straightforward and the visibility is high.
Market Impact: Freight uneconomic beyond 450 kilom

United States State Foam Restrictions Force Regional Conversion

A widening set of United States states now restricts expanded polystyrene packaging, and manufacturers shipping nationally cannot economically maintain two packaging specifications across a single distribution network. The practical effect is that a restriction covering one large state converts national volume rather than state volume. That asymmetry accelerated conversion well beyond what the restricted population alone would suggest. Retail customers have reinforced it, with several major chains writing foam exclusions into supplier packaging requirements independently of any state action. That reinforcement matters, because a retail exclusion covers shipped volume rather than a geographic population
Market Impact: Drying at 1.4 MWh per tonne

Market Restraints and Challenges

Freight Economics Cap the Economic Shipping Radius

An end cap is mostly air, and a truckload carries very little billable weight. The root cause is geometric rather than commercial: the part must occupy the void it protects, so it cannot be shipped densely without nesting compromises that damage protective performance. Beyond roughly 450 kilometres freight overwhelms delivered part value entirely. Suppliers mitigate by building regional plants close to packing lines and by designing nestable geometries, though nesting depth trades directly against the cushioning stroke the part can deliver. Neither response removes the constraint entirely. Geometry sets the limit, not commercial effort.
Market Impact: Fee differentials covering 6.2 poin

Drying Energy Cost Undermines the Price Gap Against Foam

Forming a pulp part leaves it saturated, and driving that water off consumes roughly 1.4 megawatt hours of thermal energy per tonne. The root cause is that pulp moulding is a wet process by definition and no dry forming route exists at commercial scale. European gas price movement since 2022 pushed conversion costs up sharply and narrowed the cost advantage over foam considerably. Suppliers are mitigating through heat recovery, higher-consistency forming and, at a few sites, biomass or electric drying with contracted renewable supply. Payback periods have shortened considerably. None of it eliminates the load.
Market Impact: Precision fiber compounding at 12.9
4 additional market trends, 3 additional growth drivers, and 2 additional restraints and challenges are covered in the full report. Contact sales@marketmindsadvisory.com to access the complete intelligence.

Segment CAGR and Growth Architecture

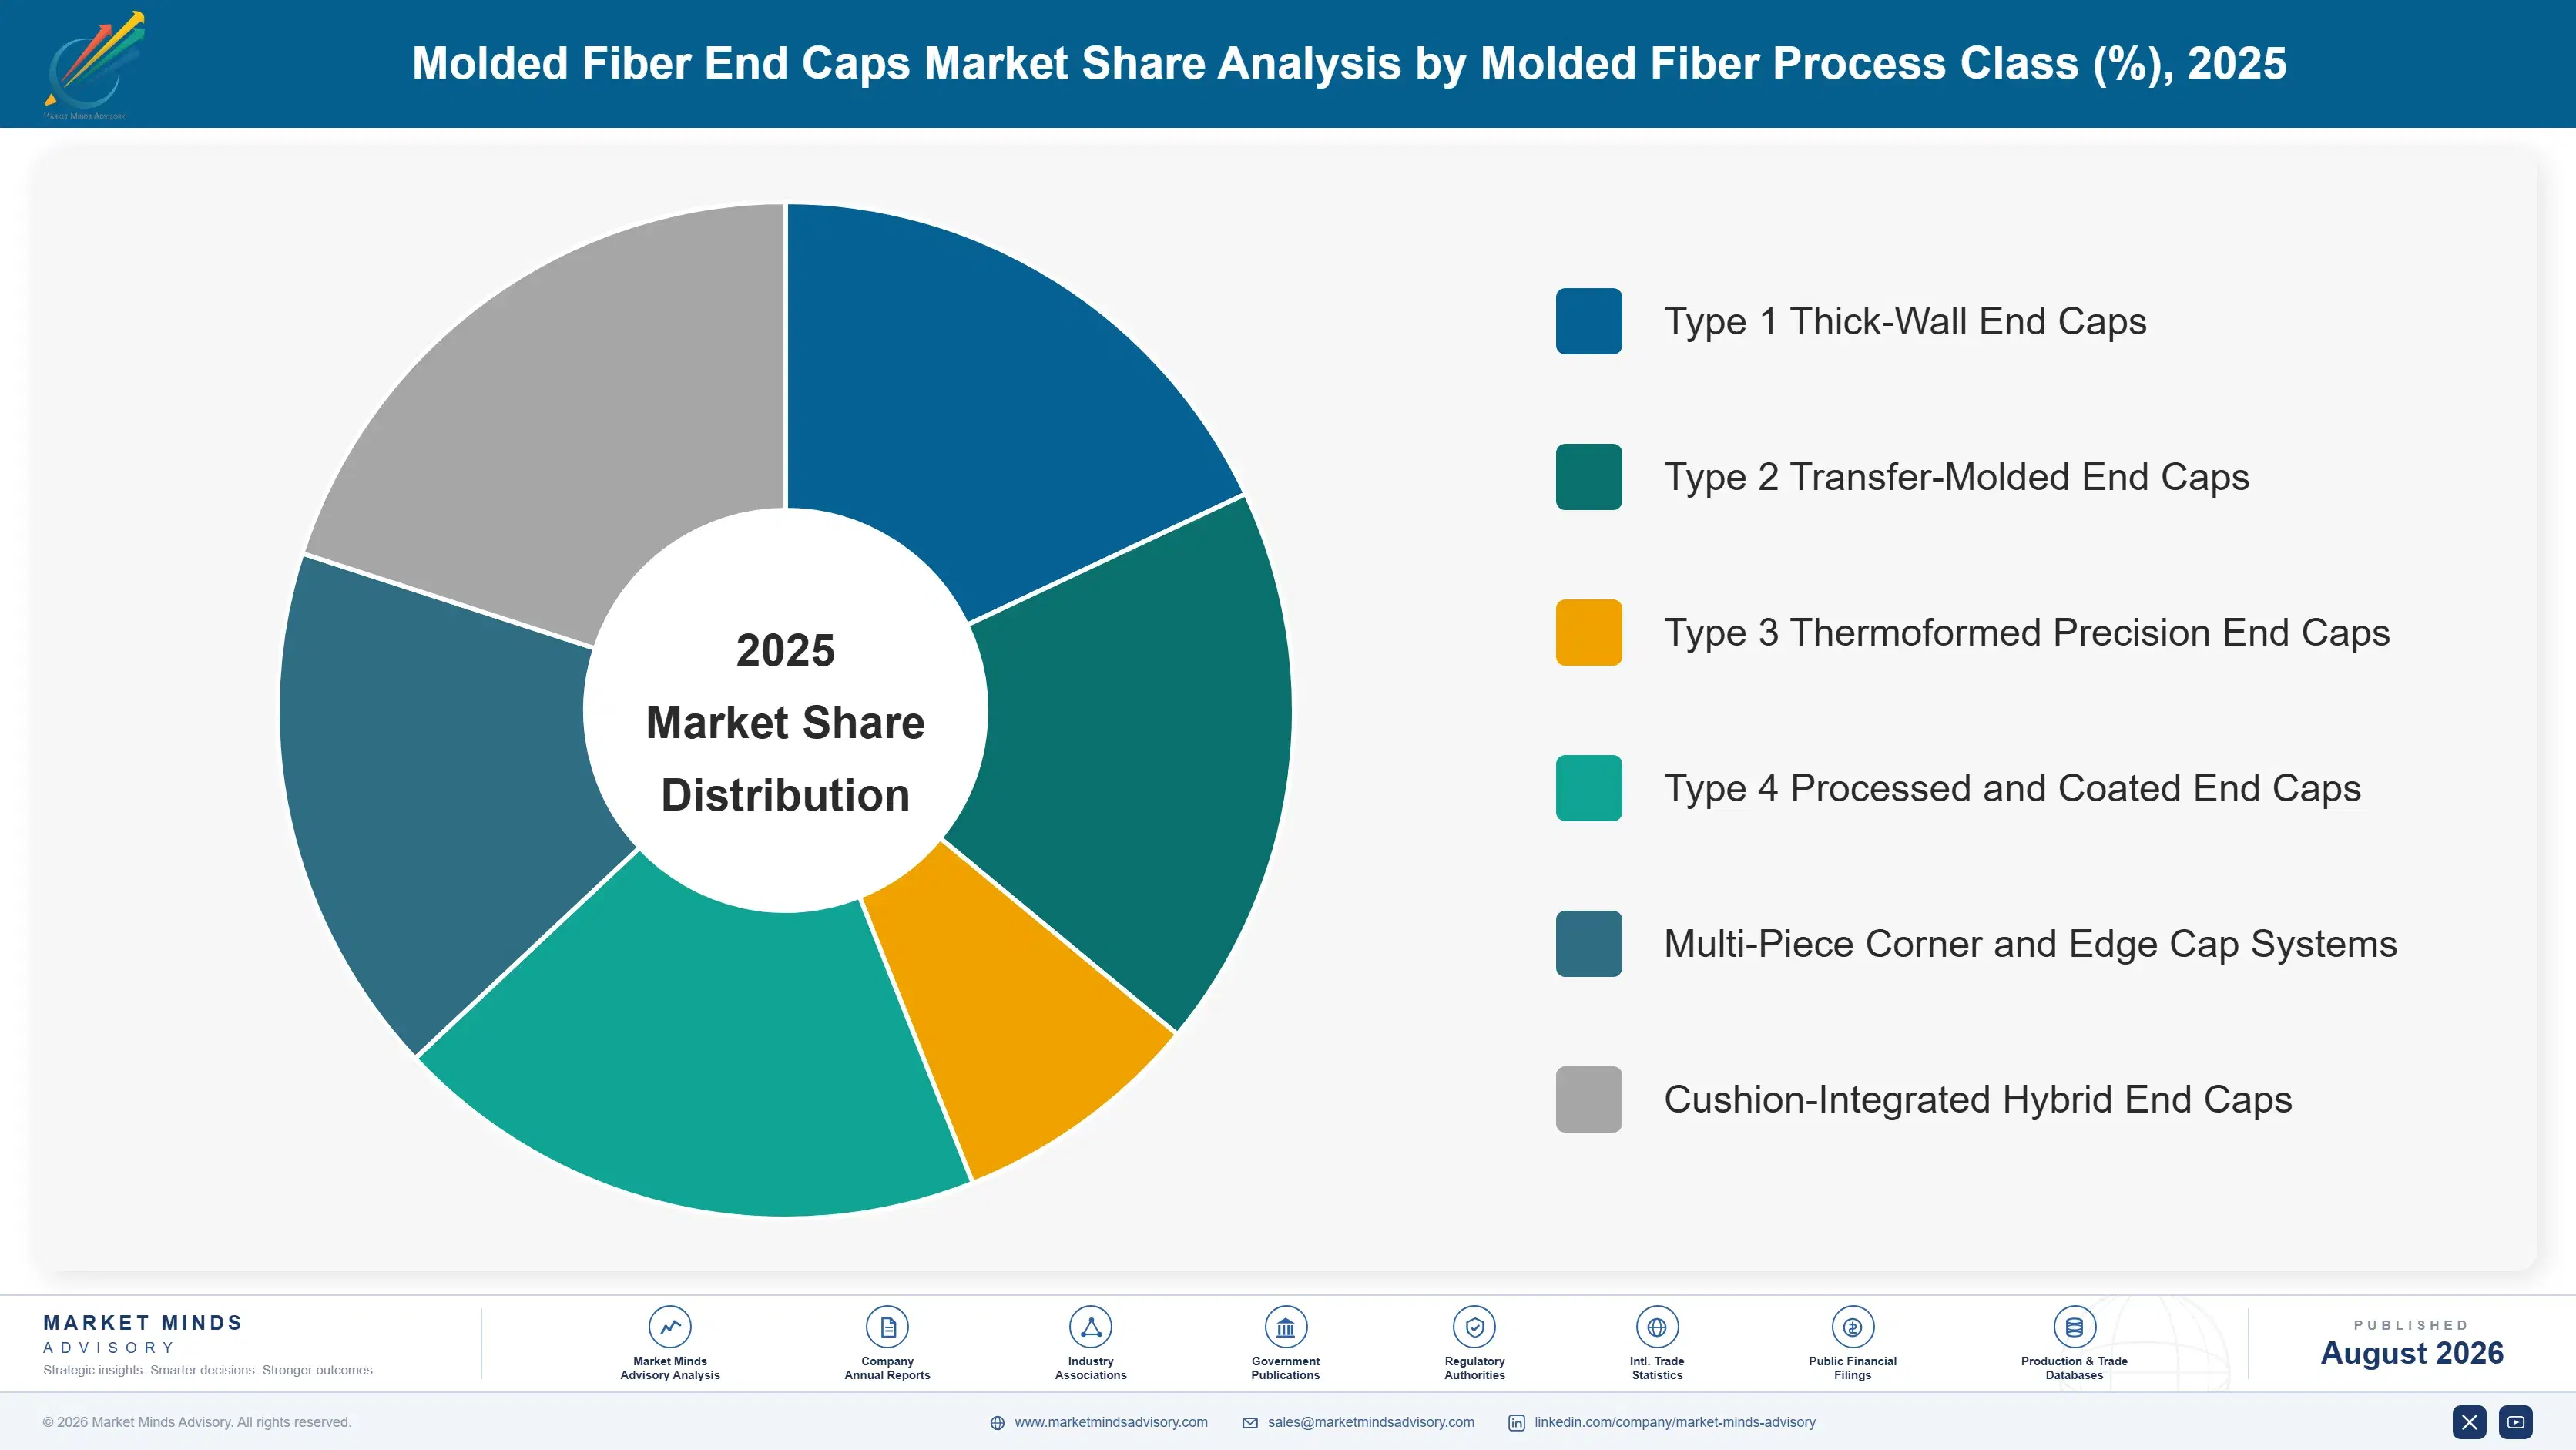
Segmentation follows molded fiber process class, which is the standard industry classification and the dimension that determines wall precision, surface finish, tooling cost and therefore which applications a part can serve. A converter's process capability rather than its scale decides which enquiries it can quote, and pricing across the classes varies by several multiples.
molded-fiber-end-caps-market-market-share-analysis-1787307264880

Type 3 Thermoformed Precision End Caps

Thermoformed precision parts compound at 12.9%, exactly 1.50 times the market rate, because they solved the problem that kept fiber out of high-value electronics. Heated matched tooling produces controlled wall thickness, smooth surfaces on both faces and dimensional tolerance approaching injection moulded parts. A flat panel television corner needs that precision: a loose fit transmits handling shock straight into the panel instead of absorbing it. Tooling investment runs several times higher than thick-wall equivalents and cycle times are longer, so unit prices sit well above the volume tiers. The applications concerned were previously unavailable to fiber at any price, which makes the economics defensible to a packaging engineer. Qualification lasts the product's whole production life.
CAGR 12.9%

Type 4 Processed and Coated End Caps

Processed and coated parts grow at 10.4% by adding barrier and performance properties that bare pulp cannot deliver. Moisture resistance matters most: a fiber end cap that absorbs humidity in a container crossing the tropics loses compressive strength exactly when the load needs it. Coatings and additives address that, along with flame retardancy for certain electrical goods and anti-static treatment for electronics. The complication is recyclability, since a coating that survives ocean transit may also survive the repulper and attract precisely the producer responsibility penalty the conversion was meant to avoid. Water-based and enzymatically removable coatings are the active development area across the supplier base. Documented repulpability is what customers now ask for first.
CAGR 10.4%
Full segment breakdown across 6 segments available in the complete report.

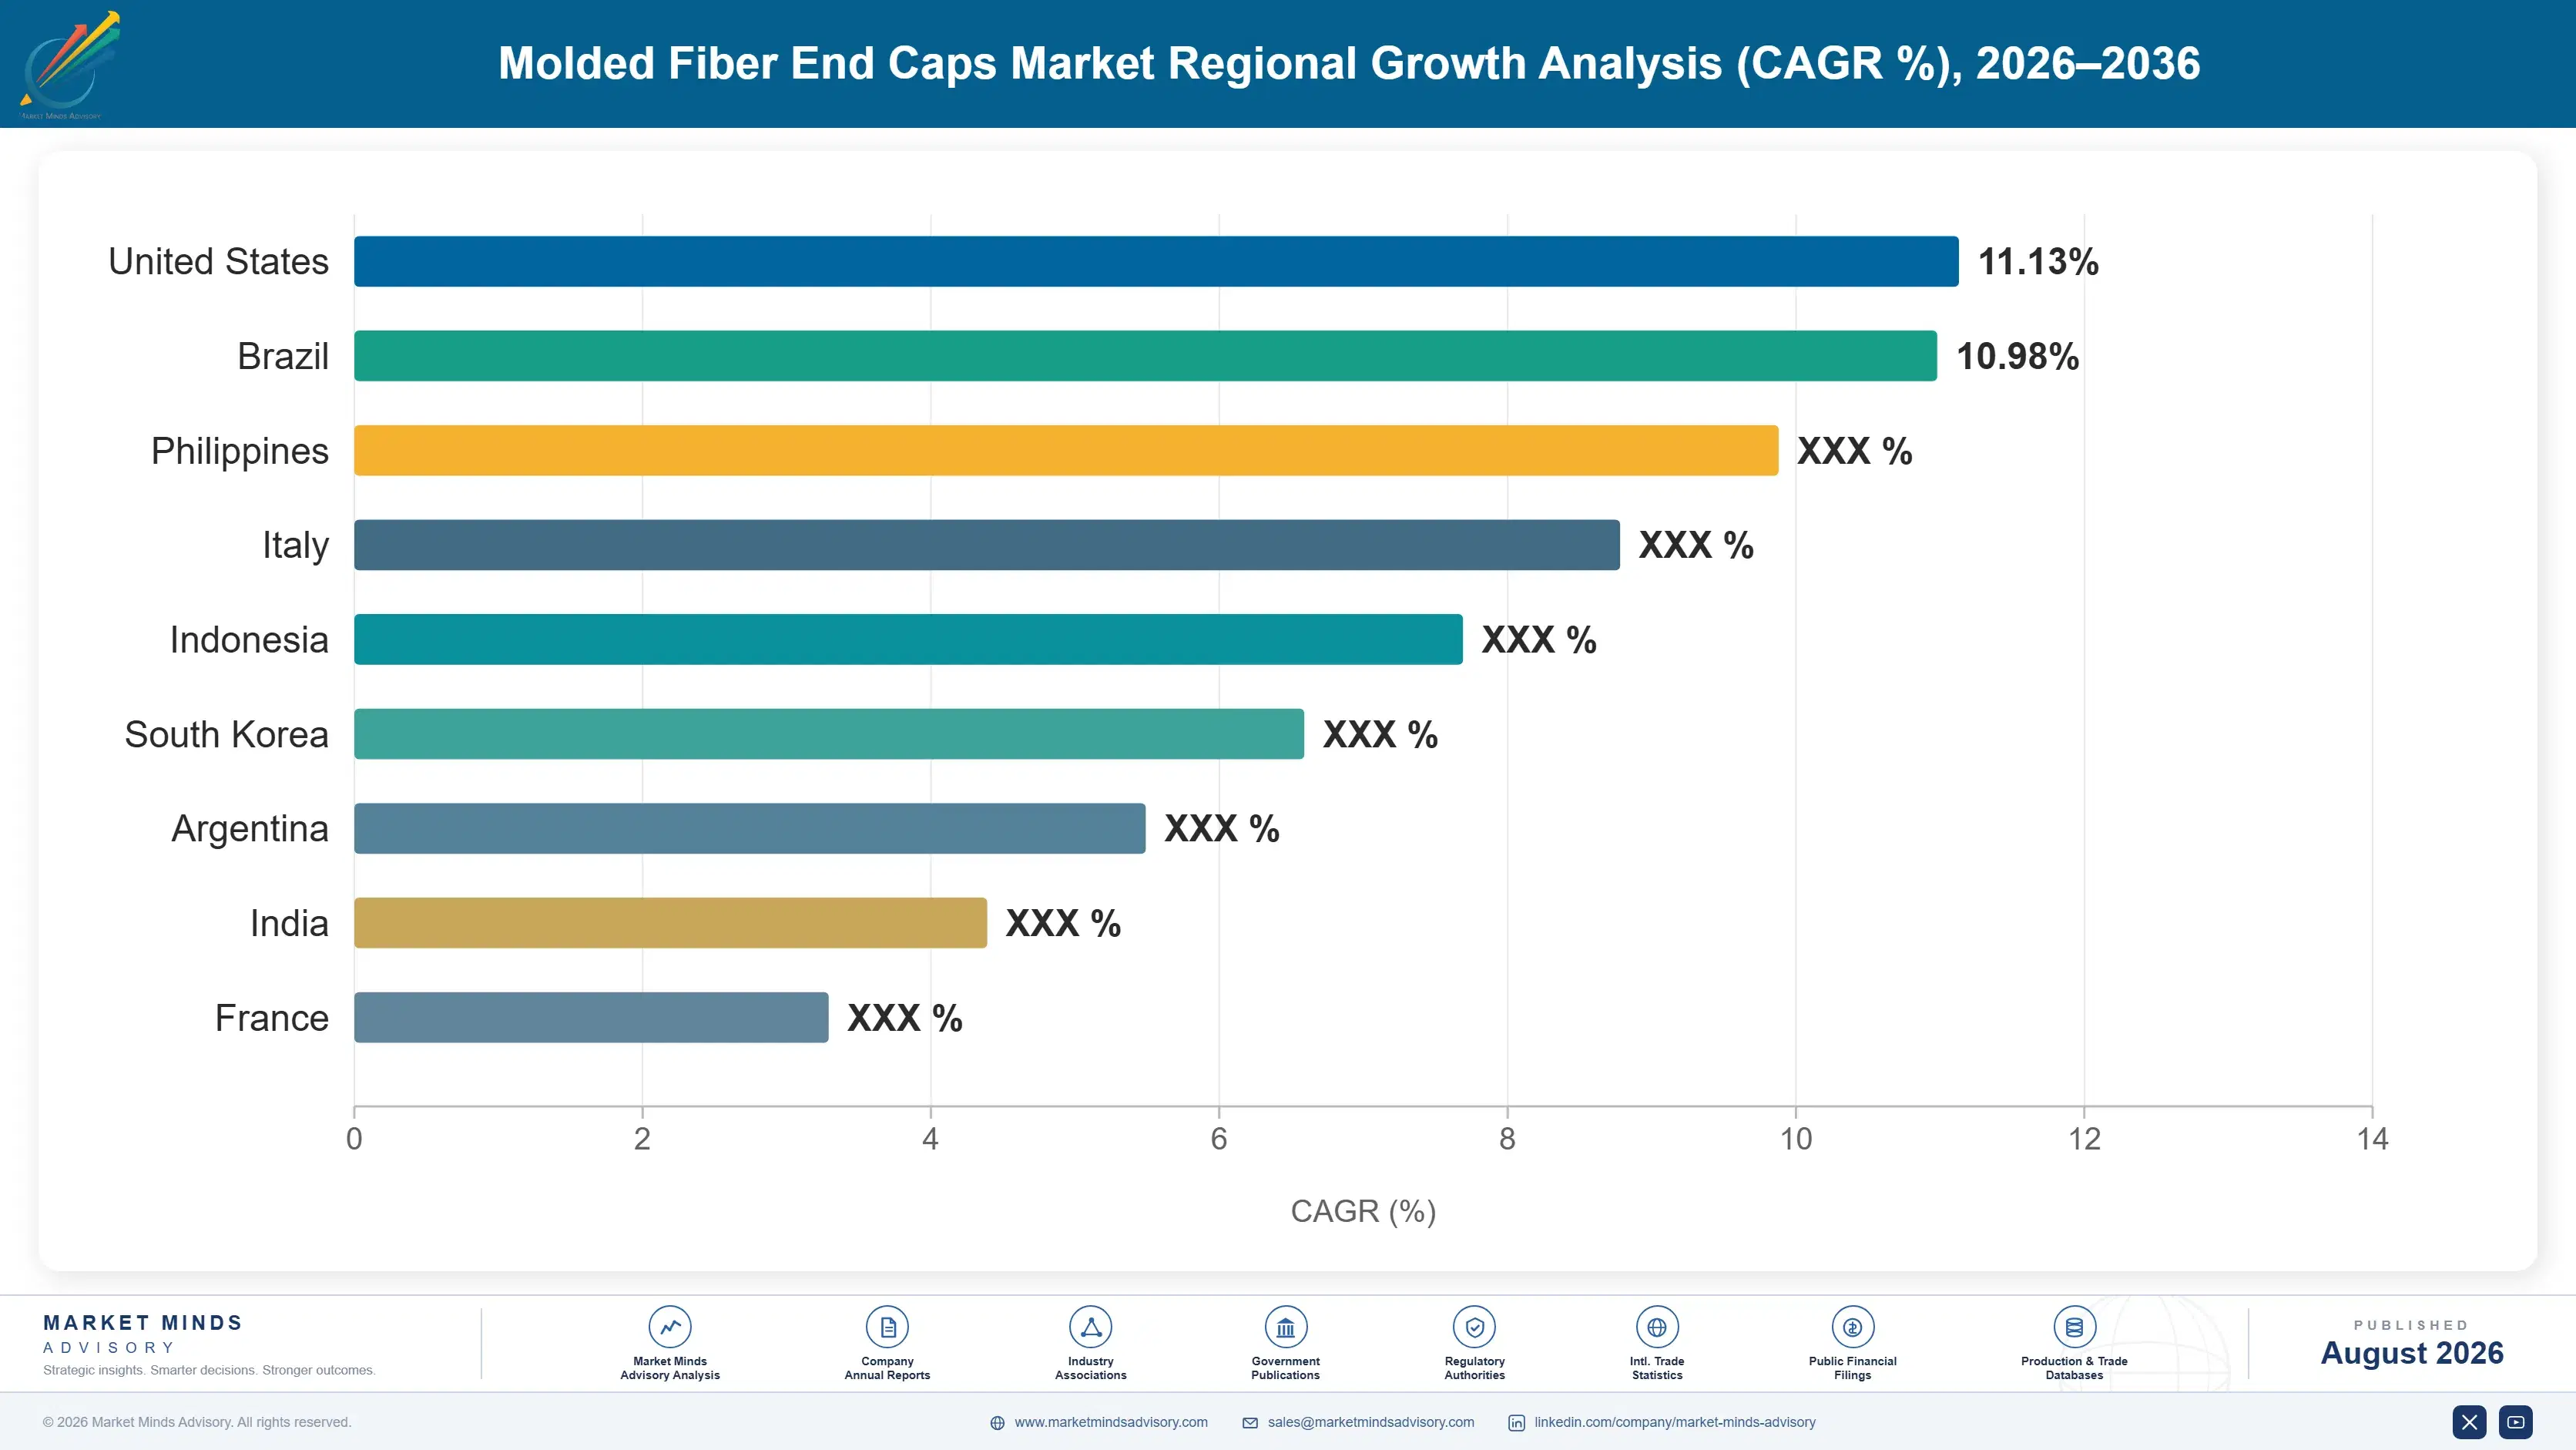
Regional Architecture and Country Demand Map

Consumption follows packing lines rather than end consumers, because an end cap is fitted where the product is boxed and never travels separately. That places demand alongside appliance, electronics and furniture assembly rather than alongside the households eventually receiving the goods. Assembly geography is therefore the map to read.

East Asia

East Asia takes 34% of global consumption. Note: this exceeds the standard regional band because end caps are fitted at the packing line rather than at destination, and appliance, television and electronics assembly is concentrated in China and Korea to a degree no other packaging category matches. Chinese appliance manufacturers ship globally, and the corner protection travels with the product from a Guangdong or Anhui packing line. Domestic pulp moulding capacity is extensive and highly fragmented, with hundreds of regional converters competing on tooling turnaround and price. Export customers increasingly specify fiber to satisfy European and North American producer responsibility exposure at the destination end. Growth of 9.8% reflects that export-driven specification pressure more than domestic regulation.
Share: 34% | CAGR: 9.8% (2026 to 2036)

North America

North America holds 24% of consumption and grows at 9.0%, the fastest of the three developed regions. State-level expanded polystyrene restrictions are the mechanism, and their effect is disproportionate: a manufacturer shipping nationally cannot maintain separate packaging specifications by state, so a restriction covering one large market converts the entire national volume. Major retail chains have written foam exclusions into supplier packaging requirements independently, reinforcing the same direction. Furniture and appliance assembly across the southeastern United States and northern Mexico generates most of the demand, with regional converters supplying inside the 450 kilometre economic radius. Tooling turnaround rather than unit price is the usual basis of supplier selection here. Damage rate remains the veto.
Share: 24% | CAGR: 9.0% (2026 to 2036)
Regional intelligence for 5 additional markets available in the complete report: Western Europe, South Asia and Pacific, Latin America, Middle East and Africa, Eastern Europe. Contact sales@marketmindsadvisory.com.
molded-fiber-end-caps-market-country-cagr-analysis-1787307265406

Making Money on a Part Worth Pennies

End caps sell for cents, ship badly and get thrown away immediately, which rules out most conventional packaging strategies. What works instead is holding positions where process capability, proximity or specification control keeps a competitor from quoting at all. Four such positions carry the margin available in this market. None of them turn on scale.

Invest in Thermoforming Capability Ahead of Demand

Type 3 precision parts compound at 12.9% and command unit prices several times thick-wall equivalents, because they serve applications no conventional pulp moulding can address. The capability gap is real: heated matched tooling, tighter process control and longer cycle times are a different manufacturing discipline rather than an upgrade. Converters holding it quote enquiries their regional competitors cannot touch, and gross margins run 15 to 22 points above the volume tiers. The investment is substantial and the payback depends on winning electronics and display work, which is precisely where the conversion pressure is strongest.
Market Impact: Precision parts carrying 15 to 22 p

Build Plants Inside the Freight Radius of Packing Lines

Beyond roughly 450 kilometres, freight overwhelms the delivered value of a part that is mostly air. That constraint is a barrier as much as a limitation, since it means a converter located near a cluster of packing lines cannot be undercut from a distance regardless of the competitor's unit cost. Following appliance and electronics assembly into Vietnam, India, Mexico and Eastern Europe secures positions that survive on geography alone. Capital requirements per plant are modest against injection moulding, which makes a distributed footprint genuinely achievable for mid-sized converters. Distant competitors simply cannot reach.
Market Impact: Geography protecting every single u

Solve Coating Recyclability Before Customers Ask

Coated Type 4 parts grow at 10.4% because bare pulp loses compressive strength when it absorbs humidity in tropical container transit. The problem is that a coating durable enough to survive that journey may also survive the repulper, attracting exactly the producer responsibility penalty the conversion was meant to avoid. Suppliers offering water-based or enzymatically removable coatings with documented repulpability sell into that gap at a premium of roughly 18 to 25% over uncoated equivalents. The development work is genuine chemistry rather than formulation adjustment, and few regional converters will attempt it.
Market Impact: Repulpable coatings priced 18 to 25

Compress Tooling Turnaround to Win Conversion Programmes

Conversion programmes at appliance and electronics manufacturers run on two to three year cycles covering design, drop testing and line qualification, and roughly 44% of large appliance makers have one live now. Tooling lead time of around eleven weeks sits on the critical path of every one. Converters that compress that to six weeks through in-house tool making and rapid iteration win programmes on schedule rather than on price, and programme wins lock in volume for the product's entire production life. The investment is in tool room capability and design engineering rather than forming capacity.
Market Impact: Cutting an 11 week lead time to six

Who Controls the Margin Pool

The five largest suppliers hold 26% between them, measured on molded fiber protective packaging revenue, the basis used consistently throughout this section. That is unusually fragmented, and freight economics explain most of it. A converter within 450 kilometres of a packing line cannot be undercut from further away, so regional scale substitutes for global scale. Regional density beats global reach here.
Competition runs on three dimensions. Process capability decides which enquiries a converter can quote at all, since thermoformed precision work is a different discipline from thick-wall moulding. Tooling turnaround decides who wins conversion programmes running against fixed launch dates. And proximity to packing lines decides the freight cost that sits inside every quoted price. Price matters, but rarely decides on its own.

Pressure is arriving from two directions. Chinese converters have built extensive capacity and compete aggressively wherever export packing lines sit within their radius. Separately, corrugated and paper cushioning suppliers including Sealed Air and Ranpak address the same foam displacement demand with different technology. Rankings will shift toward whoever pairs thermoforming capability with a distributed plant footprint. Very few hold both today, and the ones building toward it are mid-sized regional converters rather than the recognised international names.
molded-fiber-end-caps-market-company-positioning-matrix-1787307265933

Competitive Moat and Risk Dimensions

HUHTAMAKI

Moat: Global footprint and process breadth

Huhtamaki operates molded fiber capacity across multiple regions, which matters more here than in most packaging categories because freight economics prevent serving a customer from a distant plant. That distributed footprint lets the company follow multinational appliance and electronics customers into new assembly geographies, and its process range covers both volume thick-wall and higher-precision work.
HUHTAMAKI

Risk: Cost position against regional converters

Corporate overhead and quality system cost sit above what a regional pulp moulding operation carries, and in a market where the part costs cents that difference is visible in every quotation. Local converters with adequate process capability and shorter tooling turnaround win volume work on price and speed. Defending against them requires genuine process differentiation.
SONOCO PRODUCTS COMPANY

Moat: Protective packaging system selling

Sonoco sells protective packaging as an engineered system rather than as individual components, combining fiber parts with corrugated, tubes and cushioning under a single design and testing relationship. That position gets the company into the drop testing conversation early, where the specification is actually written, rather than quoting against a drawing someone else has already finalised.
SONOCO PRODUCTS COMPANY

Risk: Molded fiber capacity concentration

Molded fiber capacity is weighted toward North America, which limits participation in East Asian and South Asian demand where 45% of global consumption now sits and where growth runs fastest. Serving those regions requires building capacity inside the freight radius rather than exporting into them, and that investment competes for capital against better-established business lines.

Players Tracked

Prominent Players

Huhtamaki
Sonoco Products Company
UFP Technologies
Keiding Inc.
Henry Molded Products

Other Key Players

Brodrene Hartmann
Omni-Pac Group
Pactiv Evergreen
Sabert Corporation
EnviroPAK Corporation
ProtoPak Engineering
Western Pulp Products
FiberCel Packaging
Nippon Molding
Guangzhou Nanya Pulp Molding
Hangzhou Xinsheng Pulp Molding Technology
Zhejiang Zhongxin Environmental Protection Technology
Dolco Packaging
Sealed Air
Ranpak

Recent Developments

JANUARY 2025

European fee modulation widens the foam and fiber cost gap

Producer responsibility fee schedules across several European Union member states increased modulation penalties on expanded polystyrene packaging for the 2025 compliance year. These were regulatory fee adjustments rather than commercial developments, and they widened the specification cost gap that drives conversion decisions. Modulation is scheduled to tighten again.
Signal: Disposal cost rather than protective perfo
MAY 2025

Thermoformed fiber qualifies for flat panel display corner protection

Display manufacturers completed drop test qualification of thermoformed fiber corner protection on large format panels, an application thick-wall pulp moulding had never satisfied. This was product qualification rather than a corporate transaction, and it opened a volume pool previously closed to fiber. Thick-wall parts had failed repeatedly.
Signal: Process advance rather than material chang
SEPTEMBER 2025

Converters add drying heat recovery against European energy costs

Several European molded fiber producers commissioned heat recovery and alternative drying installations, responding to gas costs that had compressed conversion margins since 2022. These were organic capital investments rather than acquisitions or joint ventures, targeting the single largest energy line in the process. Gas exposure had become the binding constraint.
Signal: Drying energy has become the cost variable

Furnish, Water and the Cost of Drying

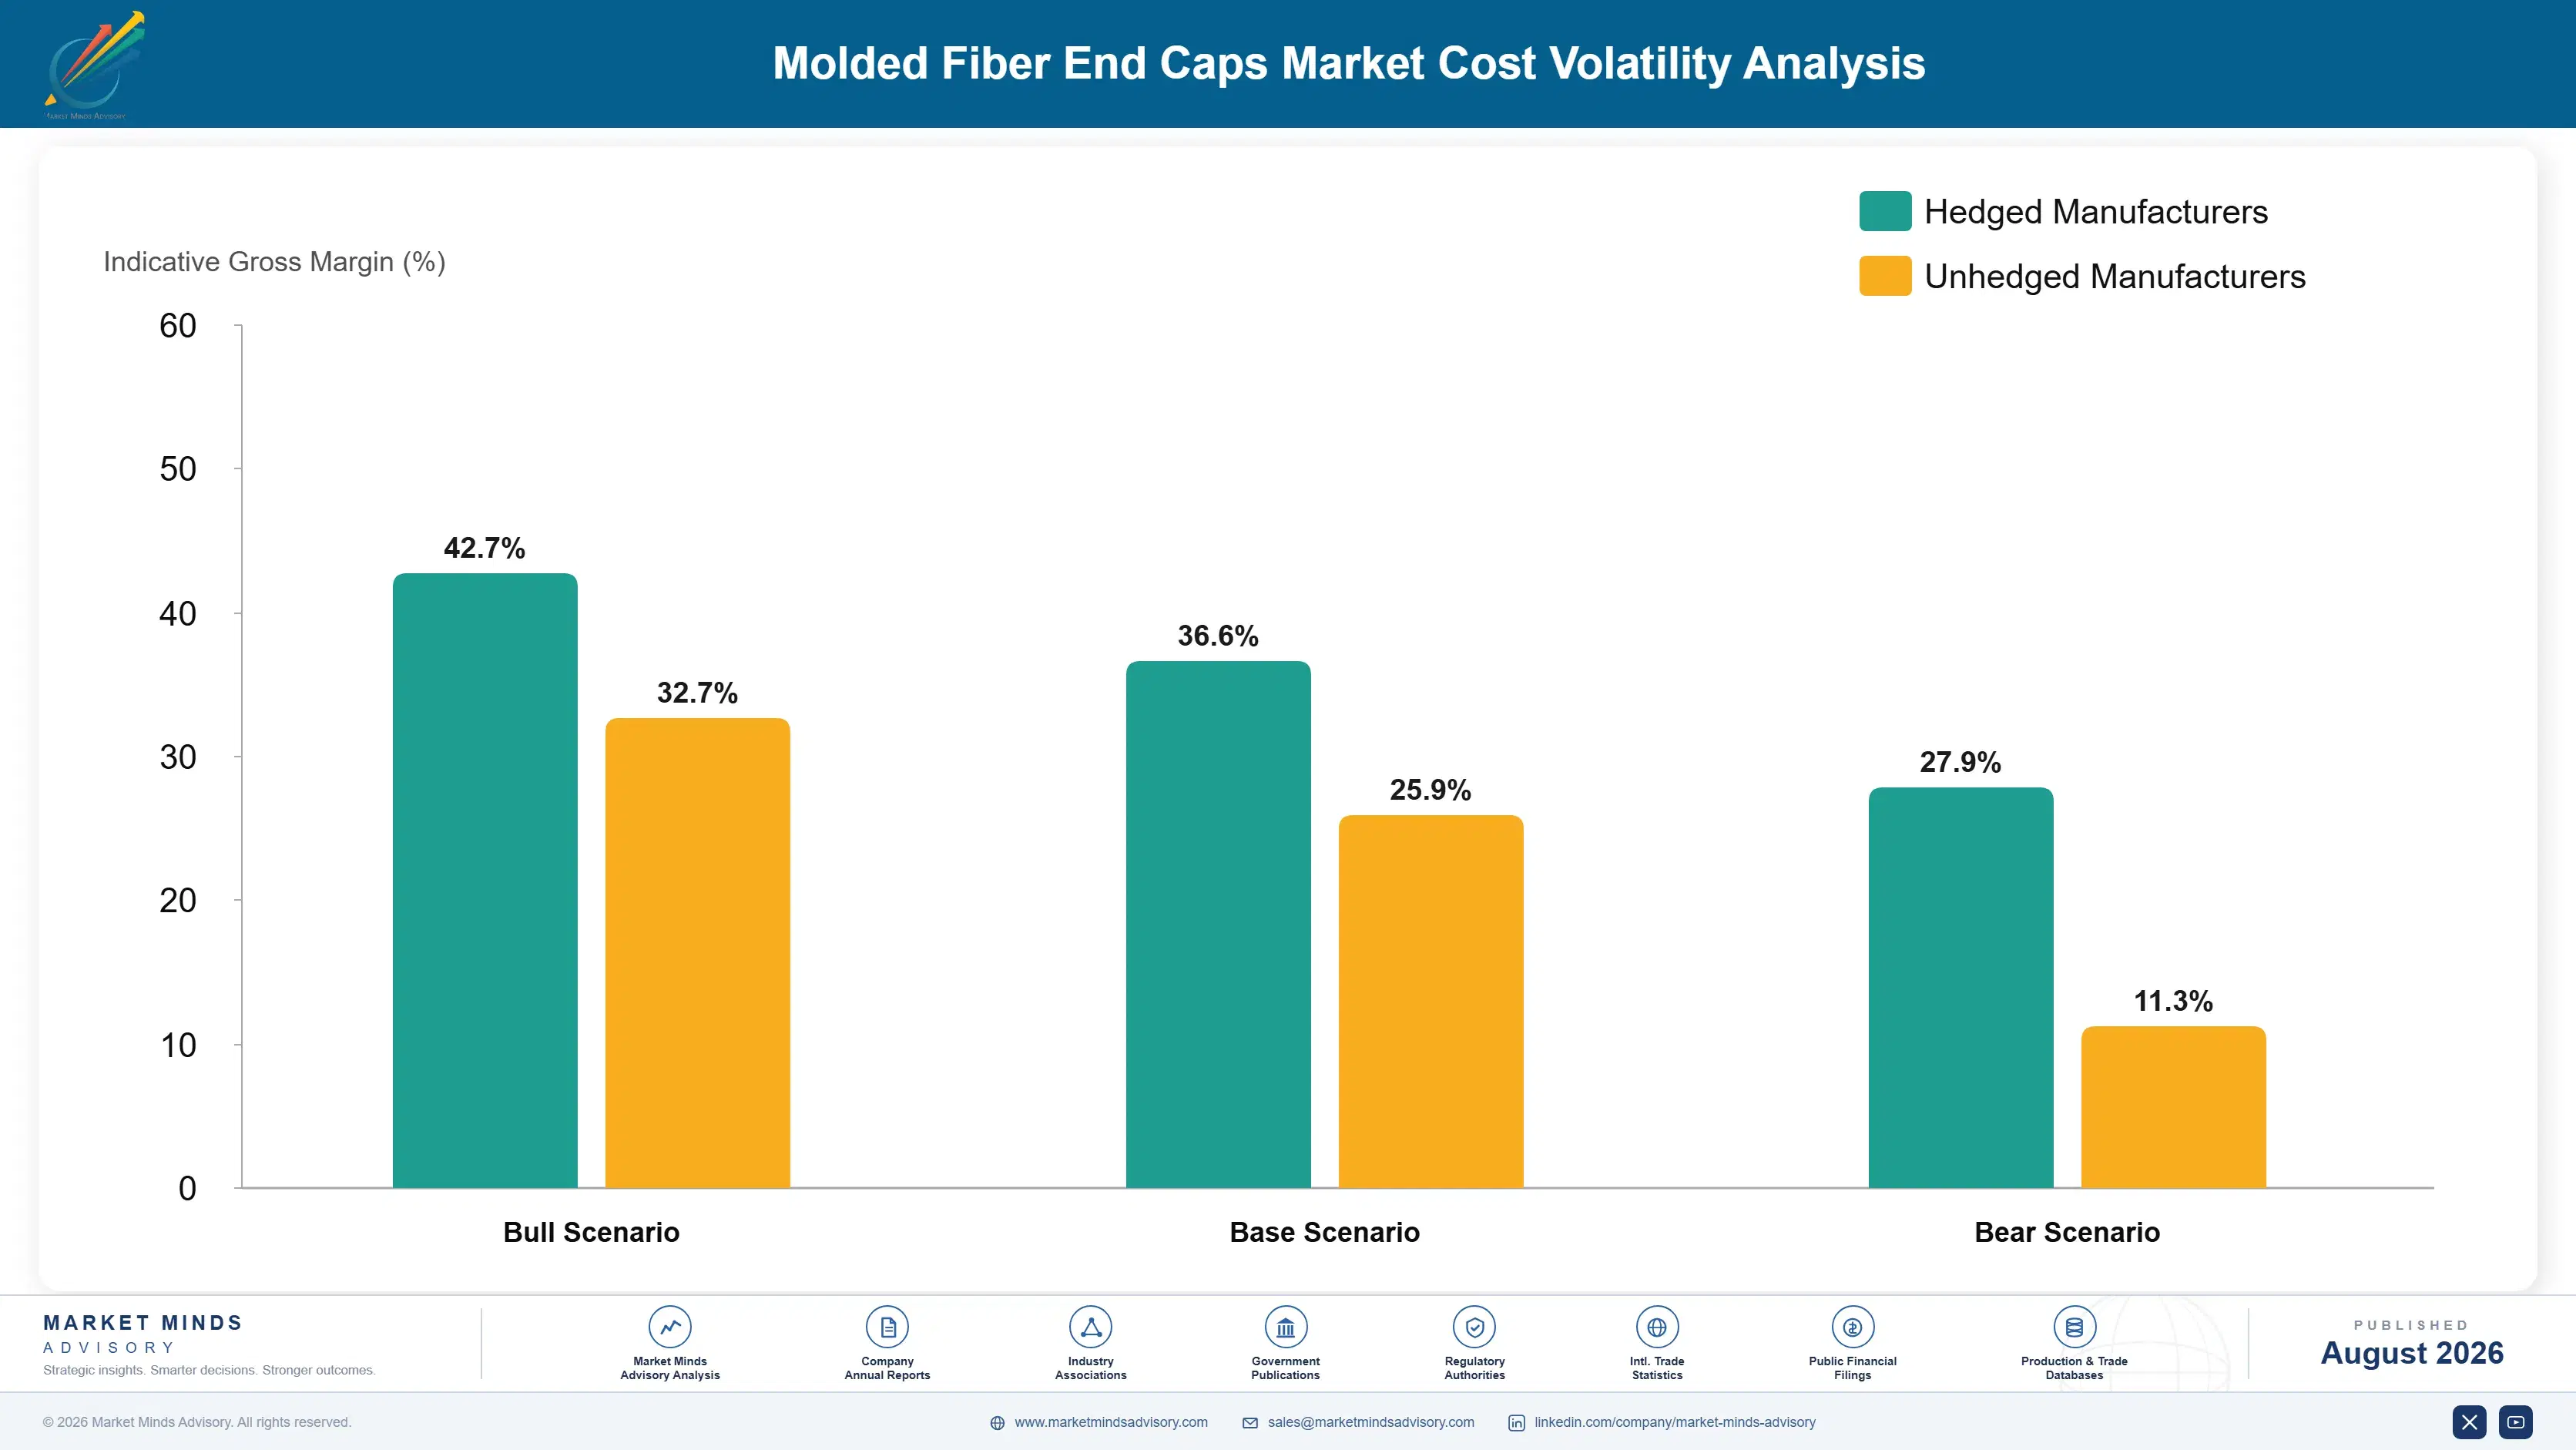
Recovered paper furnish accounts for roughly 31% of cost of goods, sourced from regional collection systems rather than international trade because the material is bulky and low in value. Energy runs a further 27%, dominated by the thermal load of drying formed parts. Labour, tooling amortisation and packaging make up most of the remainder, with water treatment a small but regulated line.
European natural gas disruption from 2022 onward hit this process harder than most packaging categories, since drying consumes roughly 1.4 megawatt hours of thermal energy per tonne of finished product. International Energy Agency reporting on European gas supply through that period tracks the underlying movement. Molded fiber converters reported conversion cost increases that compressed margins for several quarters, and company annual reports covering European packaging operations disclose the effect directly.

Exposure divides by energy source and scale. A converter drying on natural gas with no heat recovery carries the full volatility and cannot pass it through, because the customer is comparing against a foam part whose input is petrochemical and moved differently. Producers running biomass, heat recovery or contracted renewable electricity hold a cost position competitors cannot match,
molded-fiber-end-caps-market-cost-volatility-analysis-1787307266130

Heat recovery and higher-consistency forming to cut drying load

Recovering exhaust heat from dryers and forming parts at higher pulp consistency both reduce the water that must be evaporated, which is the single largest energy line in the process. Neither requires new forming technology. Payback periods on heat recovery installations have shortened considerably since European gas prices moved, making the investment straightforward to justify.

Regional furnish contracting to stabilise recovered paper supply

Recovered paper is bulky, low in value and traded regionally rather than globally, which makes local collection relationships more valuable than international purchasing scale. Converters contracting directly with municipal and commercial collection systems secure both price stability and furnish consistency, the latter mattering as much as cost because furnish variation shows up directly in part strength.

Alternative drying energy sources contracted on long terms

Biomass drying, electric drying with contracted renewable supply and combined heat and power installations all remove exposure to spot gas pricing. Capital cost is significant and the choice depends heavily on regional energy market structure. The competitive value goes beyond cost stability, since customers with their own emissions reduction commitments increasingly ask converters what fuel dries their parts.

Portfolio Architecture for Margin Defence

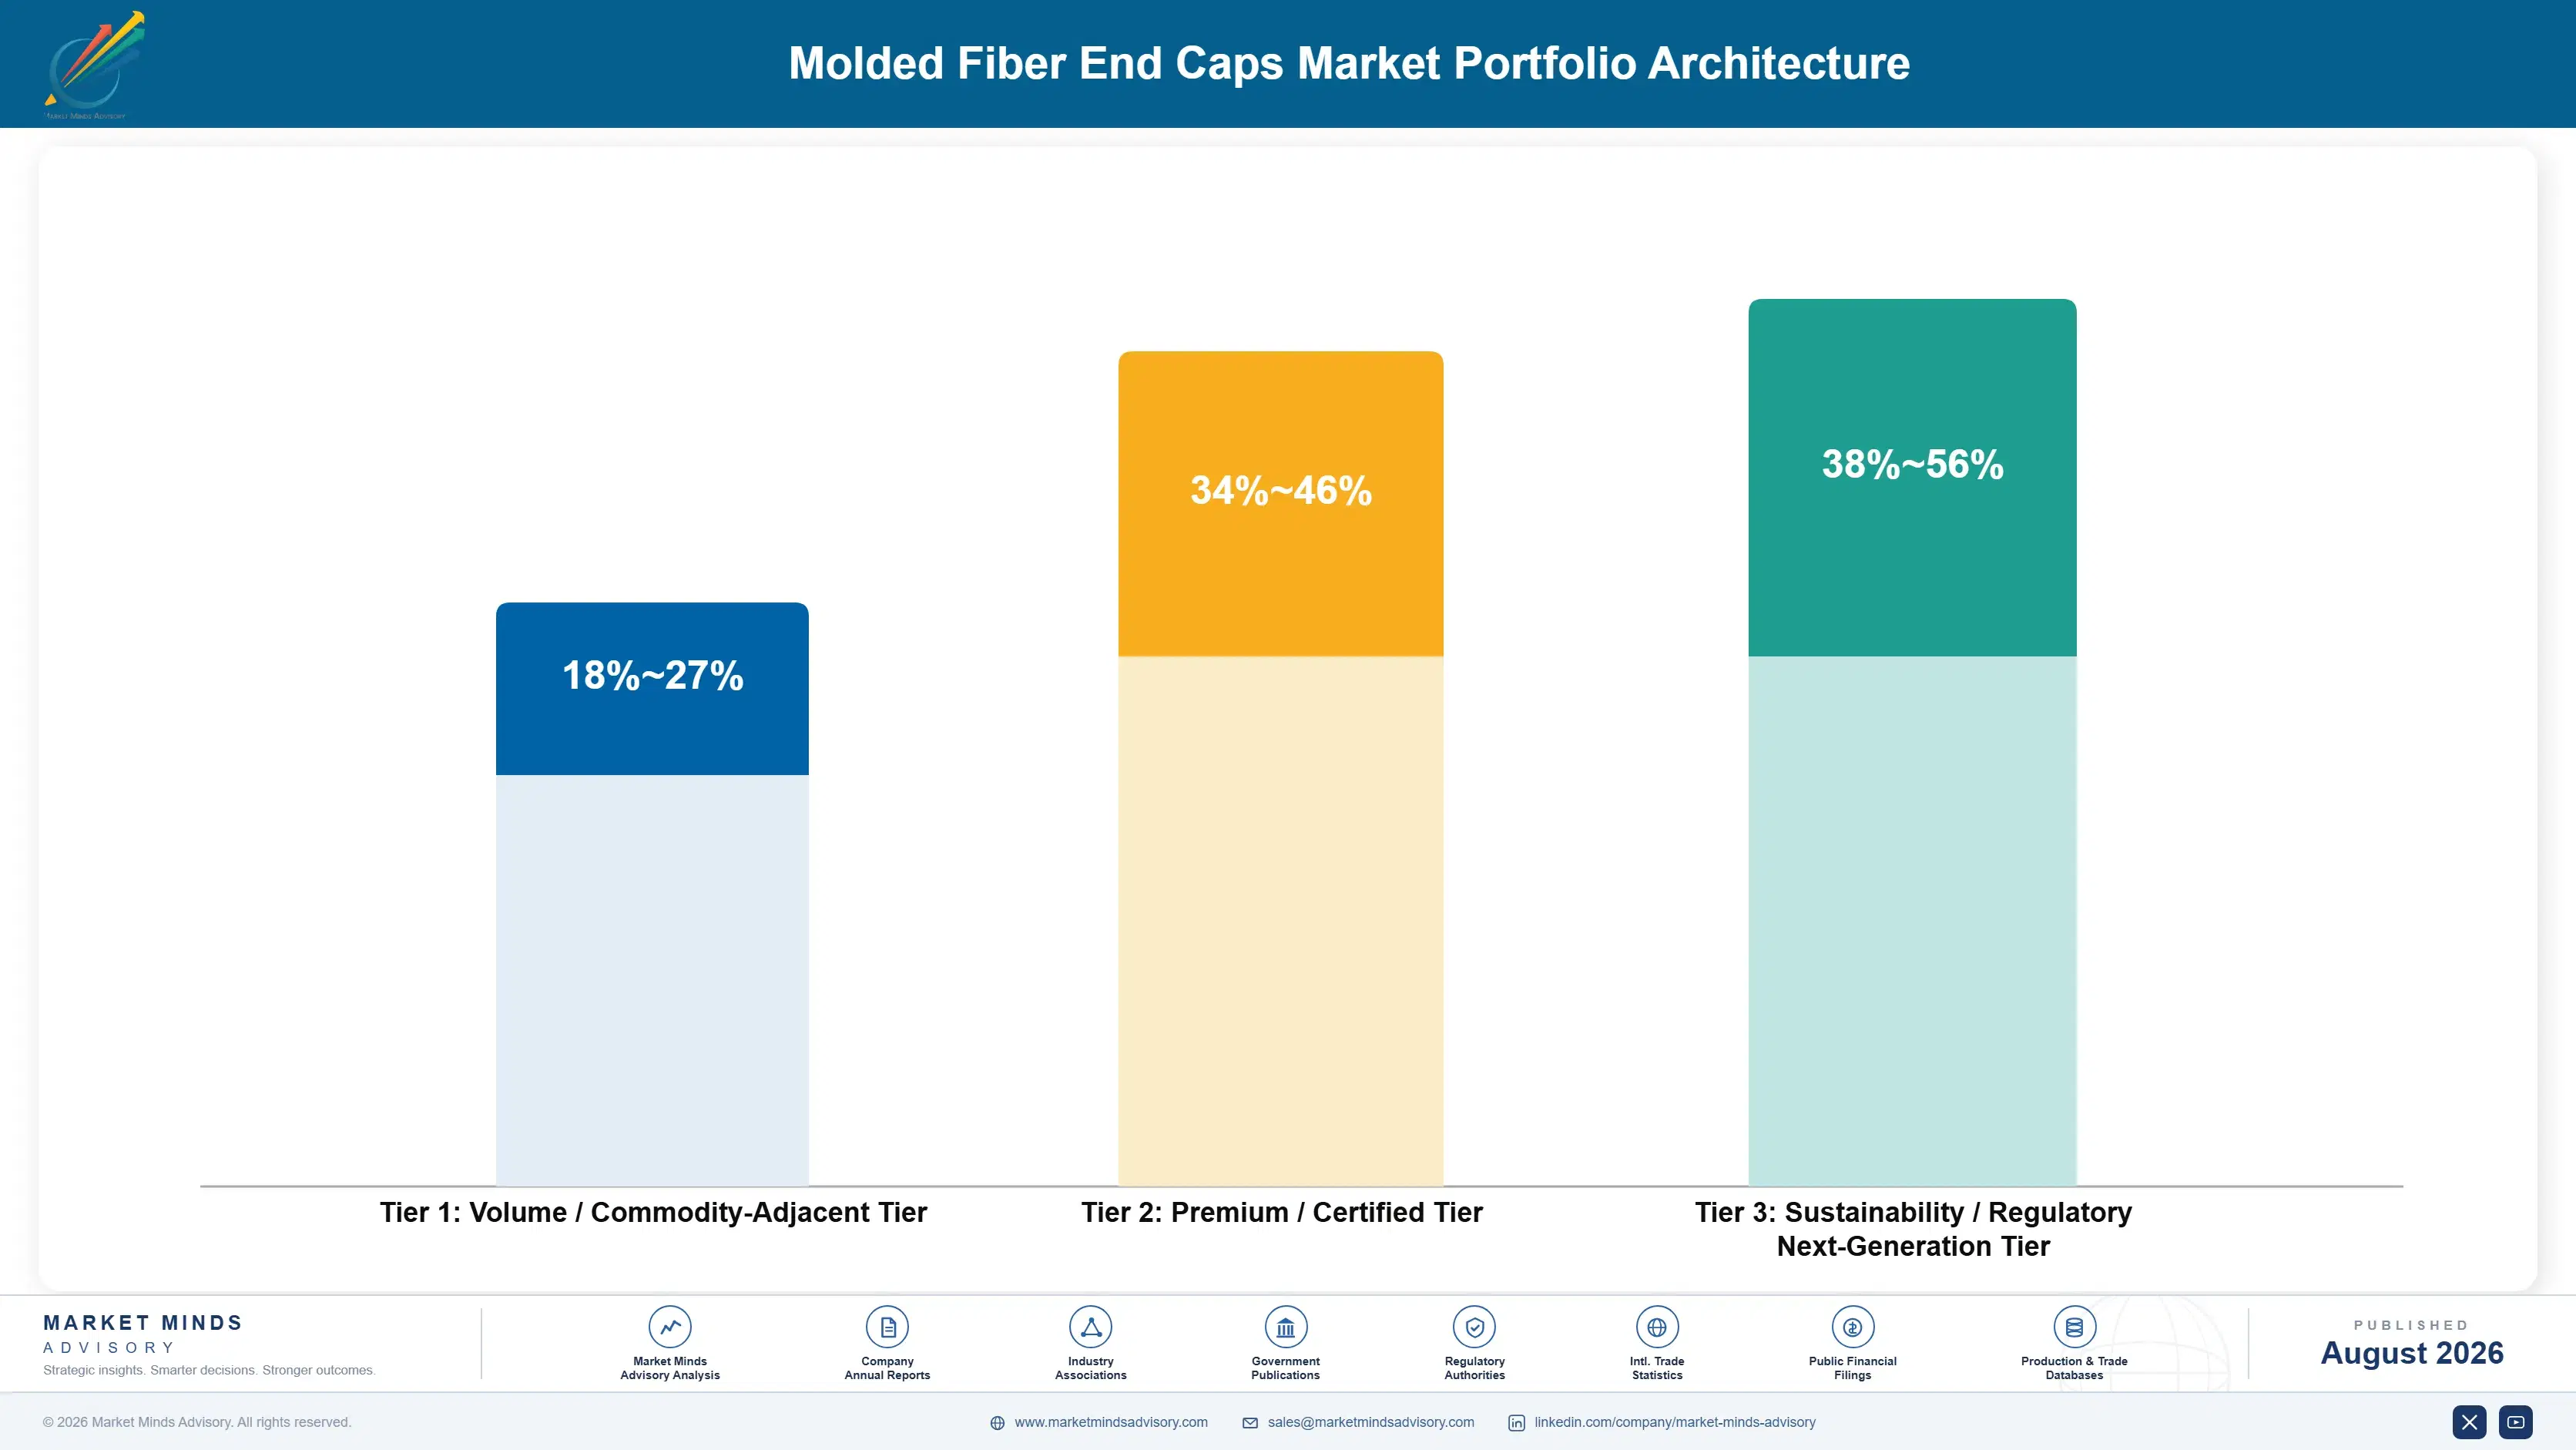
The portfolio separates on process capability rather than on end market. Thick-wall and transfer-molded parts are quotable by any regional converter with a forming line, and margins reflect that openness. Coated and processed parts require chemistry capability and repulpability documentation. Thermoformed precision parts require different tooling, different process control and a tool room, and comparatively few converters hold all three. Capability rather than customer decides the ladder.
The tension is that volume tiers fill the forming lines and carry the drying overhead, which is largely fixed. A converter that chases precision work exclusively finds its energy cost per part rising across the whole plant. Most successful operators run volume work to hold utilisation and treat precision capability as the margin layer sitting on top of it. Utilisation and margin have to be run together, since the drying plant does not care which class of part passes through it.

High-value pools concentrate where a protection requirement is genuinely demanding and a regulatory requirement is genuinely binding at the same time. Flat panel displays, premium appliances and export electronics all qualify. Each requires precision or coating capability, and each rewards proximity to the packing line. Both conditions have to hold simultaneously.

Volume / Commodity-Adjacent Tier

Type 1 thick-wall and Type 2 transfer-molded end caps and corner blocks for furniture, white goods and general transit. Quotable by any regional converter with a forming line, and won on price and tooling turnaround rather than capability.
Gross Margin: 18-27%

Premium / Certified Tier

Type 3 thermoformed precision parts and multi-piece systems for displays, electronics and premium appliances. Requires heated matched tooling, tighter process control and a tool room, which limits the field of converters able to quote at all.
Gross Margin: 34-46%

Sustainability / Regulatory / Next-Generation Tier

Type 4 coated and processed parts with documented repulpability, moisture barrier and anti-static performance. The wide margin range reflects sharply differing coating chemistries and the premium that verified recyclability documentation commands with regulated customers.
Gross Margin: 38-56%
molded-fiber-end-caps-market-portfolio-architecture-1787307266638

High-value Sub-segments and Strategic Watch-out

Thermoformed Display and Electronics Protection

Compounding at 12.9% into applications thick-wall fiber could never serve, since a loose corner fit transmits handling shock straight into a panel. Tooling and process requirements keep the quoting field narrow, and qualified suppliers hold positions for a product's full production life. Requalification almost never happens.
Gross Margin: 36-46%

Repulpable Coated Transit Protection

Growing at 10.4% on tropical container transit requirements that bare pulp cannot meet once it absorbs humidity. Coatings carrying documented repulpability command roughly 18 to 25% premiums, and the chemistry involved deters most regional converters from attempting entry. The chemistry is genuine development work. Few regional converters attempt entry.
Gross Margin: 40-56%

Standard Thick-Wall Corner Protection

The volume core at 6.4%, quotable by any converter with a forming line and won on tooling turnaround and delivered price. Run to hold forming line utilisation and carry the fixed drying overhead that everything else in the plant depends on. Margin comes from elsewhere.
Gross Margin: 18-27%

Paper Cushioning Substitution

The watch-out. Corrugated inserts and paper cushioning systems address the same foam displacement demand with entirely different technology and no drying energy burden. Where protection requirements are moderate, they compete directly and their cost structure is less exposed to gas prices. Protection demands decide where the line falls.
Gross Margin: 22-38%

Why Programme Wins Last Years

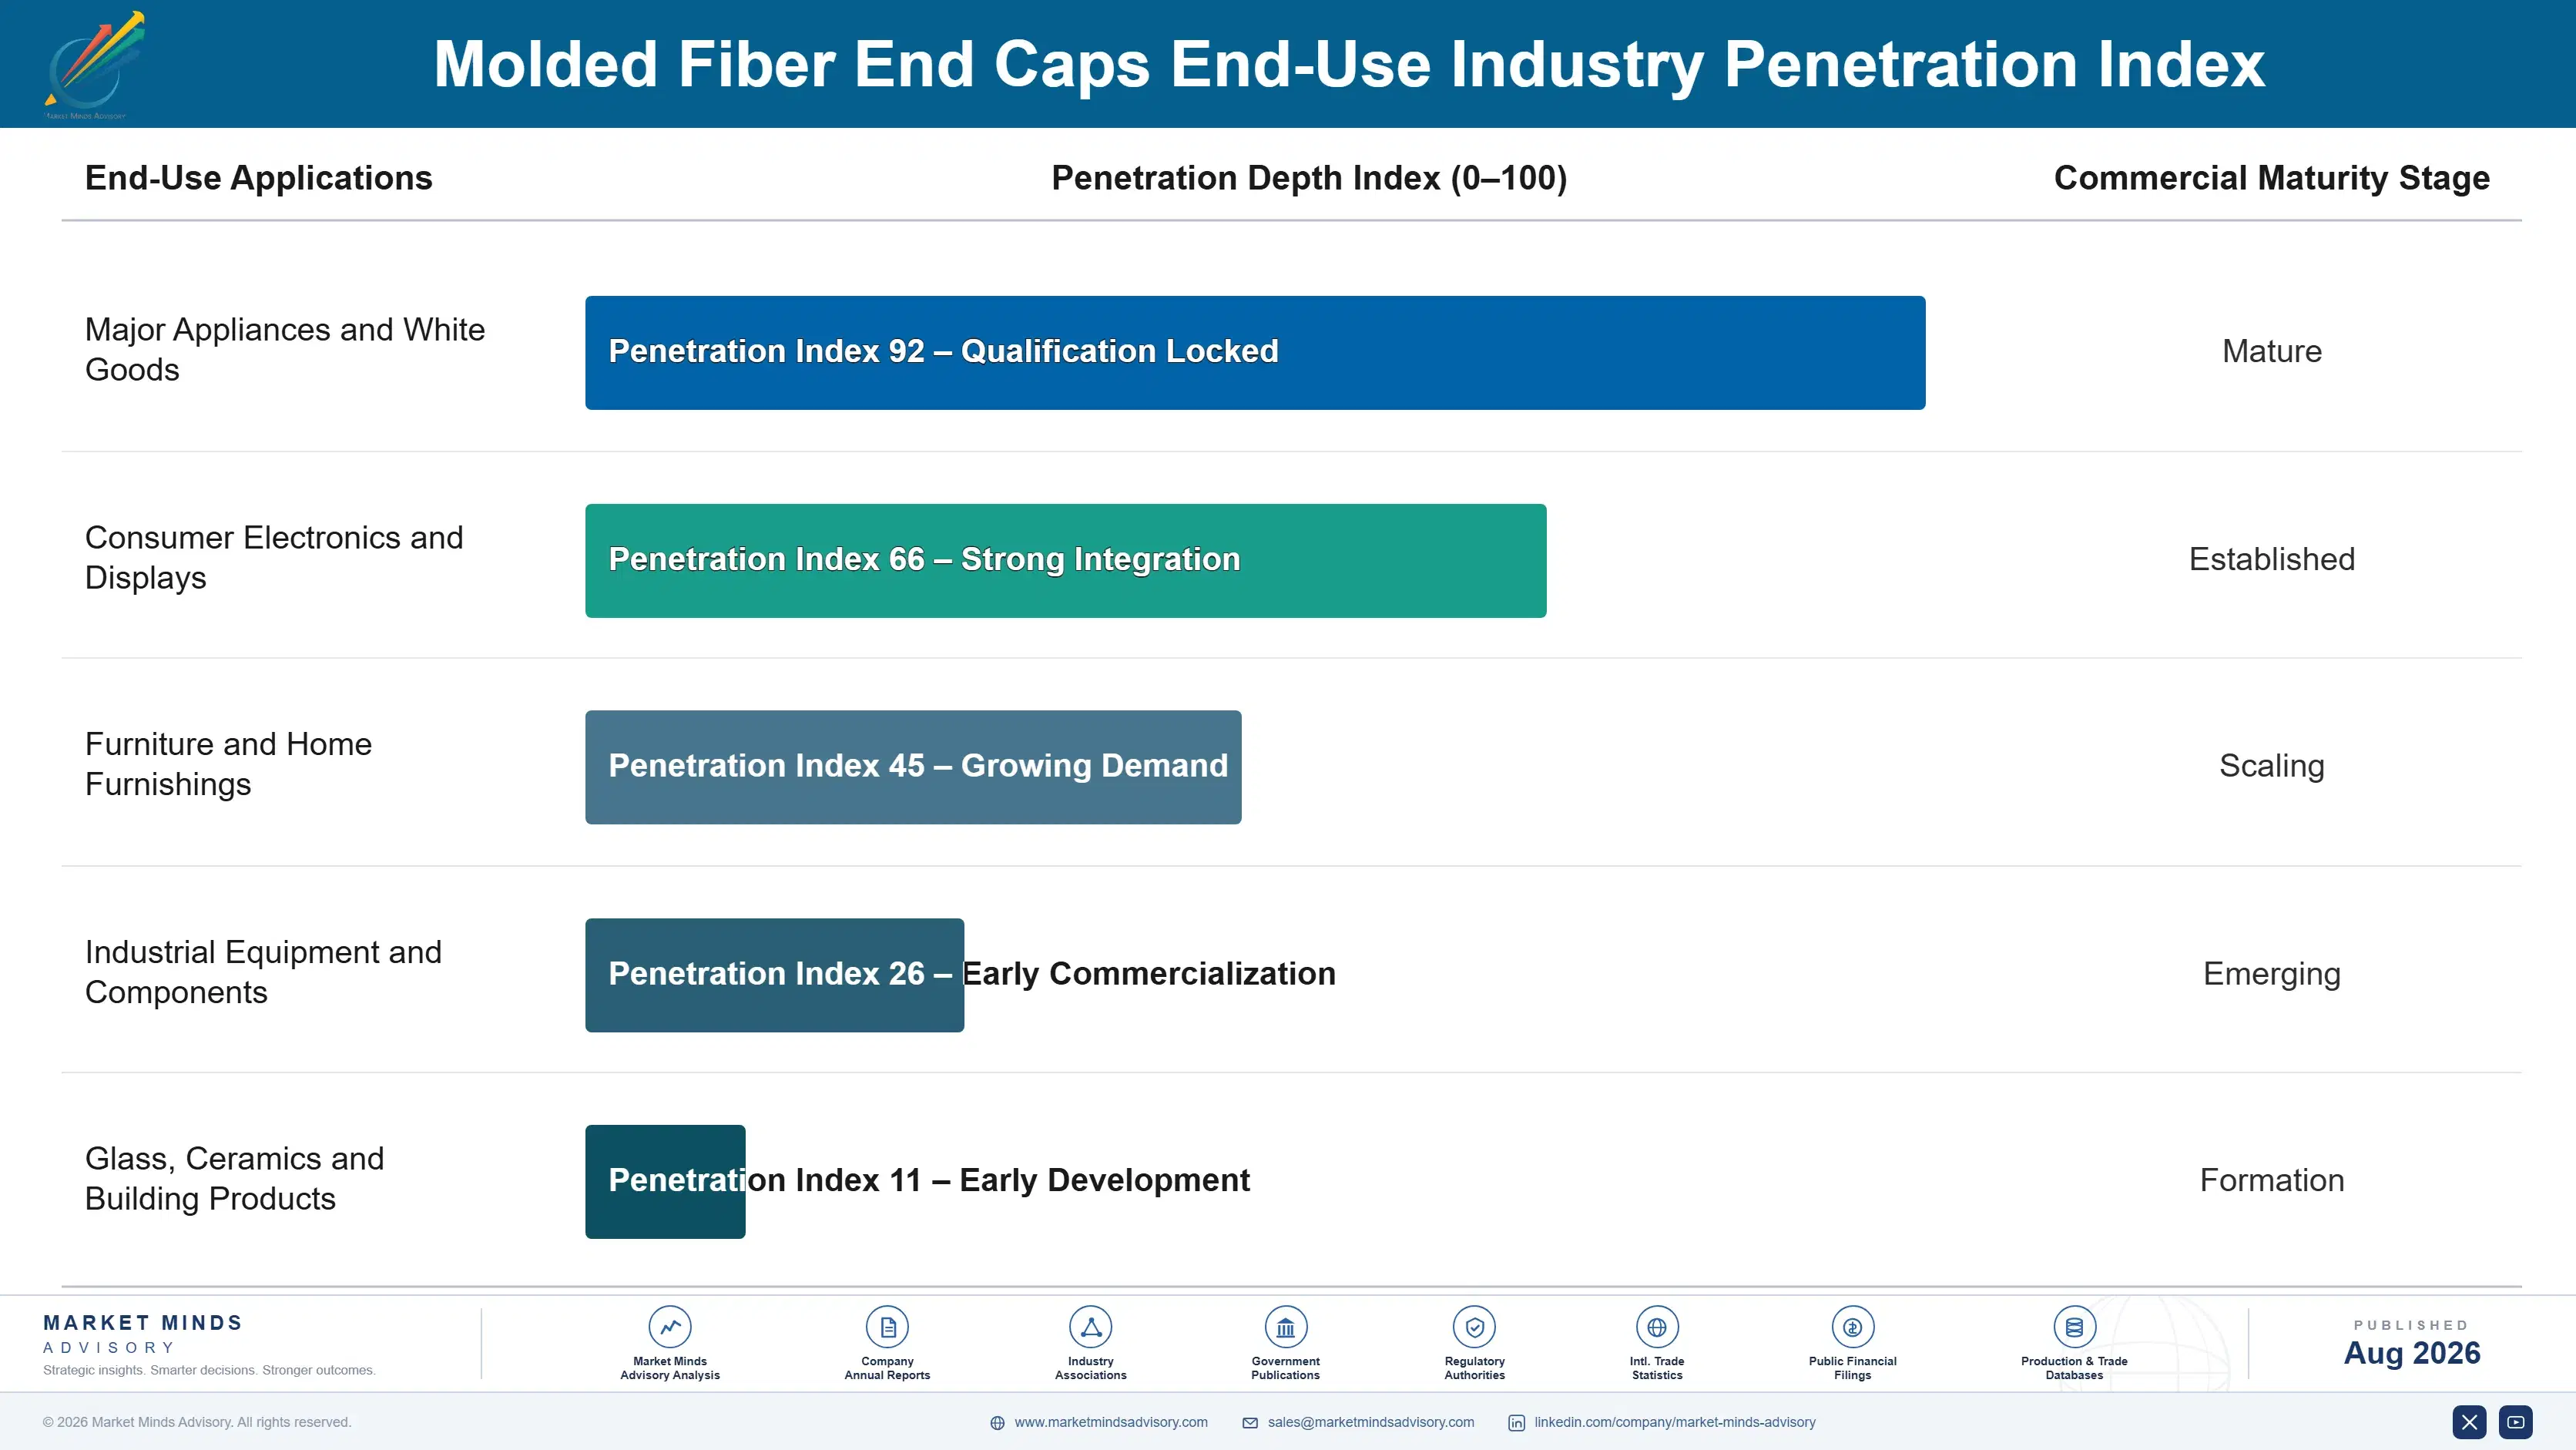
Demand here is programme-based rather than transactional, and that makes it far stickier than the unit price suggests. An end cap is qualified against a specific product through drop testing, its tooling is cut for that geometry, and the specification then holds for the product's entire production life. Reopening it means retesting, which nobody does without cause. A programme win is effectively an annuity running three to seven years.
Depth varies considerably by vertical. Display and electronics manufacturers buy deepest, specifying precision parts against tight protection requirements and qualifying suppliers rigorously. Appliance makers buy in high volume on moderate specifications and switch more readily on price. Furniture manufacturers sit at the shallow end, often using generic corner geometries that any converter can supply. Export-oriented assemblers of every kind buy against destination regulation rather than their own.

The specifying population has shifted. Corner protection used to be decided by a packaging engineer weighing damage rates against cost. Increasingly it is decided jointly with a sustainability or compliance function holding a producer responsibility budget, and that participant does not weigh protection at all. That changes which argument wins.
molded-fiber-end-caps-market-end-use-penetration-index-1787307267126

Where Fiber Conversion Pays

These are among the four positions where our research anticipates prominent divergence between winners and laggards over the coming forecast period. Each is grounded in the demand model, the regulatory perimeter, and the announced capacity pipeline.
01 / REGULATORY COST ARBITRAGE

Disposal fees rather than protection performance are driving every conversion

European producer responsibility schemes modulate fees by recyclability and expanded polystyrene sits at the penalty end of every schedule, while a widening set of United States states restricts it outright. A packaging engineer facing that fee structure now runs a compliance comparison first and a protection comparison only afterwards. Suppliers still selling on cushioning performance are answering a question that nobody in the specification chain is asking any longer, and roughly 6.2 share points transfer away from foam every year.
02 / PROCESS CAPABILITY INVESTMENT

Thermoforming opens volume that thick-wall moulding can never reach

Type 3 precision parts compound at 12.9%, exactly 1.50 times the market, because heated matched tooling holds the dimensional tolerances that flat panel displays and premium appliance corners genuinely require. This is a genuinely different manufacturing discipline rather than an equipment upgrade, and comparatively few converters anywhere hold it alongside a working tool room. Gross margins run 15 to 22 points above the volume tiers, and a qualified supplier keeps that position for the product's entire production life without facing a rebid.
03 / FREIGHT RADIUS POSITIONING

Geography protects volume that no cost advantage can take away

An end cap is mostly air, and beyond roughly 450 kilometres the freight bill overwhelms the delivered value of the part entirely. That single constraint explains why the five largest suppliers hold only 26% of a global market, and why regional converters compete perfectly well against far larger international names. Following appliance and electronics assembly into Vietnam, India, Mexico and Eastern Europe therefore secures positions that are defended by simple geometry rather than by process capability or by unit price.
04 / DRYING ENERGY EXPOSURE

How you dry parts now decides whether fiber beats foam on cost

Pulp moulding is a wet process by definition, and driving that water off consumes roughly 1.4 megawatt hours of thermal energy per tonne, and there is no dry forming alternative available anywhere at commercial scale. European gas price movement since 2022 compressed converter margins for several quarters and narrowed the price gap against foam considerably in the process. Producers running heat recovery, biomass or contracted renewable electricity hold a durable cost advantage that gas-fired competitors simply cannot close through operational efficiency alone.

Engagement Snapshot From the Field

A live engagement with an industry participant carrying material or product regulatory and market exposure ahead of a defining policy shift, showing how our research translates into a defensible multi-year portfolio strategy.
MARKET MINDS ADVISORY · CLIENT ENGAGEMENT SUMMARY
Molded Fiber End Caps Producer Strategic Portfolio Review and Transition Roadmap 2026·Investment Scenario on Molded Fiber End Caps Exposure Evaluation 2025-26
CLIENT PROFILE
A domestic appliance manufacturer shipping roughly 4.1 million units annually across North America (client-reported, unverified by MMA), using expanded polystyrene corner protection across the entire product range. Packaging spend ran near USD 88 million per year (client-reported, unverified by MMA). The company faced retail customer foam exclusions in two national accounts and restrictions in three states within its primary distribution footprint.
STRATEGIC CHALLENGE
Engineering had tested molded fiber twice and rejected it both times on damage rate grounds, using thick-wall parts against products whose corners needed tighter fit than that process delivers. Procurement wanted conversion for commercial reasons and had lost the argument twice. Neither function had established whether the failures reflected the material or the specific process class tested.
MMA APPROACH
MMA separated molded fiber process classes in the client's own testing data, then re-ran drop testing on thermoformed precision parts against the three highest-damage product lines. Converter capability was mapped within the 450 kilometre freight radius of each assembly plant, and destination regulatory exposure was modelled by distribution route rather than by plant location.
KEY FINDINGS
  1. Both previous fiber failures used thick-wall parts, a process class incapable of the dimensional tolerance the client's corner geometries required, and neither test had evaluated thermoformed alternatives at all.
  2. Thermoformed precision parts matched foam damage rates on all three tested product lines, at a delivered cost premium of roughly 9% that fee and retail exposure more than offset.
  3. Only four converters within the freight radius of the client's assembly plants held thermoforming capability, and two were already committed to competitor programmes on multi-year terms.
  4. Retail customer foam exclusions covered a larger share of shipped volume than state restrictions did, and had been tracked separately by two different internal functions.
CLIENT PROFILE
A domestic appliance manufacturer shipping roughly 4.1 million units annually across North America (client-reported, unverified by MMA), using expanded polystyrene corner protection across the entire product range. Packaging spend ran near USD 88 million per year (client-reported, unverified by MMA). The company faced retail customer foam exclusions in two national accounts and restrictions in three states within its primary distribution footprint.
STRATEGIC CHALLENGE
Engineering had tested molded fiber twice and rejected it both times on damage rate grounds, using thick-wall parts against products whose corners needed tighter fit than that process delivers. Procurement wanted conversion for commercial reasons and had lost the argument twice. Neither function had established whether the failures reflected the material or the specific process class tested.
MMA APPROACH
MMA separated molded fiber process classes in the client's own testing data, then re-ran drop testing on thermoformed precision parts against the three highest-damage product lines. Converter capability was mapped within the 450 kilometre freight radius of each assembly plant, and destination regulatory exposure was modelled by distribution route rather than by plant location.
KEY FINDINGS
  1. Both previous fiber failures used thick-wall parts, a process class incapable of the dimensional tolerance the client's corner geometries required, and neither test had evaluated thermoformed alternatives at all.
  2. Thermoformed precision parts matched foam damage rates on all three tested product lines, at a delivered cost premium of roughly 9% that fee and retail exposure more than offset.
  3. Only four converters within the freight radius of the client's assembly plants held thermoforming capability, and two were already committed to competitor programmes on multi-year terms.
  4. Retail customer foam exclusions covered a larger share of shipped volume than state restrictions did, and had been tracked separately by two different internal functions.
RECOMMENDED STRATEGY
Phase 1: Phase 1 (months 1 to 5): Qualify thermoformed parts on the three highest-volume product lines and secure capacity with the two uncommitted regional converters. Phase 2: Phase 2 (months 5 to 16): Convert the remaining range on a launch-cycle basis, cutting tooling alongside scheduled product refreshes rather than as standalone projects. Phase 3: Phase 3 (months 16 to 30): Consolidate retail and regulatory exposure tracking into one packaging compliance view owned by a single function.
OUTCOME
Conversion covered 71% of shipped units within twenty months (client-reported, unverified by MMA). Damage rates held within a tenth of a point of the foam baseline, and the two retail accounts renewed without packaging conditions attached. Net packaging cost rose by roughly USD 2.4 million against avoided exposure the client valued near USD 6 million annually (client-reported, unverified by MMA).

Frequently Asked Questions

Foundational context covering the market sizes, CAGR, scope, country, region and competition that inform every finding below. This section is provided to cover basics and most often pre-purchase conversations, answered from the MMA Primary Research Dataset.

What is the current size of the Molded Fiber End Caps Market?

The global market was worth USD 0.86 billion in 2025, reaching USD 0.93 billion in 2026. East Asia holds the largest regional share at 34% of consumption.

How large will the Molded Fiber End Caps Market be by 2036?

MMA forecasts USD 2.13 billion by 2036, an expansion multiple of 2.28 times the 2026 base. That represents roughly USD 1.2 billion of incremental value.

What is the CAGR for the Molded Fiber End Caps Market 2026 to 2036?

The base case compounds at 8.6% annually, with a bull case of 9.8% and a bear case of 7.4%. Historical growth from 2020 to 2025 ran at 7.2%.

Which segment is growing fastest?

Type 3 thermoformed precision end caps compound at 12.9%, exactly 1.50 times the market rate. They hold tolerances that displays and premium appliances require and thick-wall moulding cannot deliver.

Who are the major companies in the Molded Fiber End Caps Market?

Huhtamaki, Sonoco Products Company, UFP Technologies, Keiding and Henry Molded Products hold a combined 26% of the market. Fragmentation is unusually high because freight economics favour regional converters.

Which country is growing fastest?

Vietnam compounds at 11.6%, ahead of every other national market. Electronics and appliance assembly relocating there brings packing lines and end cap demand with it.

Report Segmentation Architecture

The full report scope spans multiple orthogonal segmentation dimensions, with cross-tabulated demand data provided for each dimension pair. Coverage extends further to regional breakdowns, trend trajectories, and the competitive detail needed to support segment-level decision-making.

By Molded Fiber Process Class

  • Type 1 Thick-Wall End Caps
  • Type 2 Transfer-Molded End Caps
  • Type 3 Thermoformed Precision End Caps
  • Type 4 Processed and Coated End Caps
  • Multi-Piece Corner and Edge Cap Systems
  • Cushion-Integrated Hybrid End Caps

By End-Use Industry

  • Major Appliances and White Goods
  • Consumer Electronics and Displays
  • Furniture and Home Furnishings
  • Industrial Equipment and Components
  • Glass, Ceramics and Building Products

By Commercial Dimension

  • Direct Programme Supply to Manufacturers
  • Contract Packer and Third-Party Logistics Supply
  • Distributor and Packaging Reseller Channel
  • Custom Tooling and Design Services

By Region

  • North America
  • Western Europe
  • East Asia
  • South Asia and Pacific
  • Latin America
  • Middle East and Africa
  • Eastern Europe

Scope, Methodology, and Coverage

Every figure in this report is reproducible from documented input assumptions. The scope below maps the historical period, the forecast horizon, the segmentation dimensions, and the countries covered, alongside the underlying primary and qualitative methodology.
Historical Period
2020 to 2025
Forecast Period
2026 to 2036
Base Year
2025 (USD billions; MMA Primary Research Dataset, August 2026)
Market Definition
The market covers molded pulp end caps, corner blocks and edge protectors used to immobilise, position and cushion products within transit packaging, across thick-wall, transfer-molded, thermoformed precision and processed or coated process classes. Molded fiber food service ware, egg and produce packaging, medical pulp disposables, and protective packaging made from expanded foam, corrugated fibreboard or inflatable film are excluded. Sizing is measured at converter revenue in current prices.
Quantitative Units
USD billions (current prices); tonnes of finished molded fiber and unit volumes where applicable
Segmentation Dimensions
By Molded Fiber Process Class; By End-Use Industry; By Commercial Dimension; By Region
Regions Covered
North America, Western Europe, East Asia, South Asia and Pacific, Latin America, Middle East and Africa, Eastern Europe
Countries Covered
USA, China, Germany, France, UK, Japan, South Korea, India, Australia, Canada, Brazil, Mexico, Indonesia, Vietnam, Thailand, Malaysia, UAE, Saudi Arabia, South Africa, Nigeria, Turkey, Poland, Netherlands, Italy, Spain, Sweden, Switzerland, Argentina, Colombia, Singapore, and additional markets relevant to this sector
Key Companies Profiled
Huhtamaki, Sonoco Products Company, UFP Technologies, Keiding Inc., Henry Molded Products, Brodrene Hartmann, Omni-Pac Group, Pactiv Evergreen, Sabert Corporation, EnviroPAK Corporation, ProtoPak Engineering, Western Pulp Products, FiberCel Packaging, Nippon Molding, Guangzhou Nanya Pulp Molding, Hangzhou Xinsheng Pulp Molding Technology, Zhejiang Zhongxin Environmental Protection Technology, Dolco Packaging, Sealed Air, Ranpak
Quantitative Methodology
Primary survey, n=3,800 respondents, Q4 2025, six countries; demand-side model with trade association cross-validation
Qualitative Methodology
47 expert interviews, Q4 2025; applied to validate demand model assumptions, identify emerging dynamics, and assess competitive positioning
Report Format
PDF and XLSX data workbook (Word format preview document)
Publisher
Market Minds Advisory
Report Code
MMA-2026-PAC-626
Published
August 2026
Contact
sales@marketmindsadvisory.com | www.marketmindsadvisory.com

Purchase the full Molded Fiber End Caps Market Report (2026 to 2036).

The full report sizes molded fiber end caps across four process classes plus hybrid formats, three commercial dimensions and seven regions, with annual forecasts to 2036 under base, bull and bear scenarios. Producer responsibility fee schedules are modelled by member state and translated into per-unit specification cost differentials against expanded polystyrene. Converter thermoforming capability is mapped geographically against appliance and electronics packing line locations within the freight radius that governs supply. Drying energy exposure is quantified by fuel source and region. Twenty suppliers are profiled on a consistent protective packaging revenue basis.
Producer responsibility fee differentials modelled by member state
Thermoforming capability mapped against packing line locations
Freight radius economics quantified by part geometry and density
Drying energy exposure assessed by fuel source and region
Coating repulpability requirements and premium pricing analysed
Conversion programme timelines benchmarked across appliance manufacturers

Built For The People Who Decide

From boardroom strategy to bench-side execution, this report is read cover-to-cover by leaders shaping the next decade of their industry, turning demand scenarios, market dynamics and valuation benchmarks into decisions.
CXOs/ Presidents/ VPs/ Managers
M&A and Corporate Development
Strategy Teams and R&D Heads
Procurement and Product Directors
Regulatory and Compliance Leaders
Investor Relations and Equity Analysts