Market Minds Advisory
Molded Fiber Bowl Market

Molded Fiber Bowl Market: Barrier Chemistry, Drying Energy, and the Freight Cost of Air

The regulators took away the cheap grease barrier and left converters with replacement chemistry that costs more, performs worse against hot oily food, and has to be requalified line by line.

Lead Analyst

Bilal Shaikh

Published

September 2026

Make Smarter Decisions with Customized Research Insights

Request a free sample report and evaluate market opportunities, growth trends, and competitive dynamics relevant to your business needs.

2025 MARKET VALUE$2.8BMarket Size 2025
2036 FORECAST VALUE$6.4BBase Case , 2026 to 2036
CAGR 2026 TO 20367.8 %Bull 9.0% / Bear 6.6%
INCREMENTAL OPPORTUNITY$3.4BNet 10- year value creation
EXPANSION MULTIPLE2.12x2036 value over 2026 base
Strategic Levers
M&A Pipeline
Regional Outlook
Country Rankings
Competitive Intelligence
Segmental Deep-dive
Call-Us : 91 93563 13602

Executive Snapshot and Market Trajectory

The bowl is the hardest thing molded fiber has to do. It holds hot, wet, oily food for twenty minutes or more, and the fluorochemical barrier that made that possible has been withdrawn across most major markets. Everything commercial in this category now follows from that.
Growth comes from plastic substitution rather than from more meals, and the substitution is mandated in a widening set of jurisdictions. Bagasse pulp bowls grow fastest at 11.7%, exactly 1.50 times the market rate, because sugarcane residue is cheap, fast-forming, and available in the regions doing the converting. Bamboo pulp follows at 10.2% on fiber strength rather than price. East Asia holds the largest regional share on forming capacity as much as on consumption.
Concentration sits at just 27% across the top five on annual forming capacity, unusually fragmented for packaging. Barrier qualification is now the entry test, since a converter without a proven fluorine-free coating cannot bid on quick-service work. Drying energy and freight economics decide who survives the middle of the market. Neither of those advantages ever appears on a product specification sheet, which is exactly why buyers keep misreading this category.
Market Definition
This market covers single-use bowls formed from wet pulp furnish by vacuum forming, transfer moulding, or thermoforming, sold into foodservice, retail prepared food, and institutional catering. Scope includes recycled wastepaper, virgin wood, bagasse, bamboo, wheat straw, and blended fiber furnishes, with any applied barrier coating. Molded fiber trays, clamshells, cup carriers, protective packaging, egg packaging, plates, and lids are excluded.
Base Year Value
$2.8B in 2025 (MMA Primary Research Dataset, August 2026)
Forecast Period
2026 to 2036, eleven discrete annual values
CAGR
7.8% base case. Bull 9.0%. Bear 6.6%.
Fastest Growth Segment
Bagasse Pulp Bowls: 11.7% CAGR
Fastest Growth Country
India: 12.1% CAGR
Fastest Growth Region
South Asia and Pacific: 9.8% CAGR
Largest Region
East Asia: 30% of 2025 global value
Market Leaders
Huhtamaki. Pactiv Evergreen. Novolex. Sabert Corporation. Brodrene Hartmann. Source: MMA Analysis based on company annual reports.
Primary Survey
n=3,800 procurement and R&D decision-makers, Q4 2025, six countries
Methodology
Demand-side build-up, cross-validated against public data, 47 expert interviews

Molded Fiber Bowl Market Forecast Scenarios

molded-fiber-bowl-market-size-forecast-scenario-1787298716395
Two unrelated things reshaped the 2020 to 2025 period. Delivery and takeaway volumes jumped and never fully retreated, permanently enlarging the addressable format. Then fluorinated grease-proofing agents left food contact use across the United States and much of Europe, forcing requalification of nearly every line. A 6.5% historical rate hides a volume surge running alongside a costly technical reset.
Three mechanisms carry the 7.8% base case. Single-use plastic restriction is the largest, with bans and levies now covering foodservice bowls in the European Union, several United States states, India, and China. Agricultural residue furnish is the second, since bagasse and bamboo cost less than recovered wastepaper in the regions converting most volume. And quick-service chain specification is the third, where national accounts standardise on fiber and pull their whole supply base with them.
The 9.0% bull case rests on aqueous dispersion barriers reaching cost and performance parity with the withdrawn fluorochemistry, which would remove the last technical argument for plastic-lined alternatives. The 6.6% bear case is a public barrier failure at a major chain, where hot oily food breaches a coating and sets specification back years. A single incident of that kind resets specification confidence for years.

Barrier. Drying Energy, and the Cost of Shipping Air

Three costs decide this business and none of them is the pulp. Barrier chemistry is the first, and since the fluorochemicals went it has become both dearer and less forgiving. Drying energy is the second at roughly 29% of conversion cost, because forming a bowl means evaporating water out of a wet pulp preform. Freight is the third, and it is the one input nobody can negotiate away.
TOP FIVE CONCENTRATION27%Fragmented against most packaging categories of comparable global scale
FLUORINE-FREE CONVERSION74%Production lines already running compliant barrier chemistry today
FIBER COST SHARE34%Recovered pulp and agricultural residue as share of goods
AVERAGE SELLING PRICEUSD 0.062Per bowl across all furnish types and wall thicknesses
DRYING ENERGY SHARE29%Thermal drying dominates the conversion cost of every bowl
CAPACITY UTILISATION78%Across installed forming lines in the major producing regions
Freight matters more here than converters like to admit. A bowl is mostly air, so what actually moves on a truck is nesting geometry, and a design that nests at 90 units per stack against a competitor's 74 changes delivered cost by more than any pulp negotiation ever will. This is why the category stays regional despite Chinese forming capacity being large and cheap.
Two forces shape the next decade. Aqueous dispersion and bio-based barrier systems are closing the performance gap against the withdrawn chemistry, slowly and line by line. And furnish is migrating toward agricultural residue, which is cheaper where it grows and increasingly where the converting happens too. Neither force favours the converters who moved slowest on qualification, and several have already gone.
"Converters keep telling us their advantage is the coating. It almost never is. Their advantage is that they figured out how to nest sixteen more bowls into the same carton than the plant down the road, and nobody in the industry writes that on a sales sheet."
Director. Packaging and Foodservice Materials Practice · MMA Packaging and Foods

Market Trends

Fluorine-Free Barrier Chemistry Becomes The Qualifying Requirement

Fluorinated grease-proofing agents left food contact use across the United States and the European Union within a compressed window, and several states legislated ahead of federal timelines. Replacement systems, mostly aqueous dispersions and bio-based coatings, cost more per square metre and perform less well against hot oily food held for extended periods. About 74% of installed lines have converted so far. The remainder are smaller converters who cannot fund requalification, and quick-service accounts have simply stopped inviting them to bid. Barrier capability now functions as the entry test for the whole category.
Market Impact: Mandates cover over 50% of volume

Agricultural Residue Furnish Displaces Recovered Wastepaper Steadily

Bagasse from sugar milling and bamboo pulp are both cheaper than recovered wastepaper across South and Southeast Asia, and they form faster with less refining energy. That combination is pulling furnish choice away from recycled paper in exactly the regions adding the most capacity. Bagasse also carries a cleaner regulatory story because it is a milling by-product rather than a recovered stream carrying unknown contaminants. Seasonality is the trade-off, since cane crushing runs a few months a year and storage degrades the fiber. Converters that solved storage buy at roughly 30% below wastepaper equivalent.
Market Impact: One conversion moves 2,000 outlets

Market Opportunities and Growth Drivers

Single-Use Plastic Restriction Now Covers Foodservice Bowls Directly

The European Union single-use plastics directive. India's ban on identified plastic items. China's phased restriction programme, and legislation in California. New York. Washington, and Maine all reach foodservice bowls specifically rather than plastics generally. That specificity matters, because earlier waves of regulation left bowls in an ambiguous position that operators exploited. Now the substitution is mandated on a dated timetable in markets covering well over half of global foodservice volume. Converters are not selling an environmental preference any more; they are supplying compliance, and compliance buyers behave very differently on price.
Market Impact: Failures cluster beyond 40 minutes

Quick-Service Chain Specification Pulls Entire Supply Bases Across

National and international restaurant chains standardise packaging centrally, and when one converts its bowl programme to fiber the decision propagates through hundreds or thousands of outlets at once. Franchise supply agreements make the switch effectively mandatory downstream. Several major chains completed fiber conversion across their bowl formats during the past three years, and each conversion moves volumes that an independent operator base would take a decade to deliver. It also sets a de facto performance specification, since smaller operators buy whatever their distributor already stocks for the chains. Losing one of these accounts can idle a forming line outright.
Market Impact: Drying is 29% of conversion cost

Market Restraints and Challenges

Replacement Barriers Still Fail Against Hot Oily Food

Aqueous dispersion coatings hold well against water and moderately against grease, but hot oily food held for forty minutes will still soften a bowl base in a way the withdrawn fluorochemistry did not. The root cause is physical: fluorinated molecules delivered oleophobicity that no current alternative fully replicates at comparable coat weight. Commercial impact lands on delivery operators, where transit time is longest and complaint visibility highest. Participants are working on higher coat weights, dual-layer systems, refined furnish that reduces porosity before coating, and geometry changes that keep hot liquid away from the weakest point.
Market Impact: 74% of lines already converted

Drying Energy Makes Margin Hostage To Gas Prices

Forming a bowl means driving water out of a wet preform, and thermal drying accounts for roughly 29% of conversion cost. The root cause is unavoidable process physics rather than any inefficiency, since pulp arrives as a slurry and must leave as a rigid dry article. European converters found out what that means when gas prices moved sharply, and several suspended lines outright. Mitigation runs through heat recovery on dryer exhaust, mechanical dewatering ahead of the thermal stage, and in a few plants biomass firing using the same agricultural residue that feeds the furnish.
Market Impact: Costs roughly 30% below wastepaper
4 additional market trends, 2 additional growth drivers, and 3 additional restraints and challenges are covered in the full report. Contact sales@marketmindsadvisory.com to access the complete intelligence.

Segment CAGR and Growth Architecture

Segmentation here follows fiber furnish, because furnish determines input cost, forming speed, barrier requirement, and increasingly the regulatory story a converter can tell a buyer about material origin. Forming process cuts across every furnish rather than separating them cleanly, and end-use application does much the same, so neither works as the primary dimension here.
molded-fiber-bowl-market-market-share-analysis-1787298716927

Bagasse Pulp Bowls

The fastest furnish at 11.7%, exactly 1.50 times the market rate, and the reason is cost rather than sustainability positioning. Sugarcane bagasse is a milling by-product available at roughly 30% below recovered wastepaper across India. Thailand. Brazil, and southern China, and it forms faster with less refining energy. It also carries a cleaner contamination story than recovered paper streams, which matters more every year as food contact scrutiny tightens. The constraint is seasonality: cane crushing runs a few months and stored bagasse degrades through microbial action unless handled properly. Converters who invested in baling and covered storage buy at the harvest price all year, and those who did not pay spot in the off-season.
CAGR 11.7%

Bamboo Pulp Bowls

Second fastest at 10.2%, growing on fiber properties rather than on price alone. Bamboo gives longer fiber length than bagasse, which produces higher wet strength and lets converters run thinner walls at the same rigidity, and thinner walls mean less pulp, less water to evaporate, and better nesting. That combination improves three cost lines at once. Supply is concentrated in China and increasingly in Vietnam, and pulping requires more chemical input than bagasse does, which offsets part of the advantage. Certification is becoming a real commercial question as European buyers ask about cultivation origin. For premium retail bowls where surface finish and rigidity both matter, this is currently the best-performing furnish available.
CAGR 10.2%
Full segment breakdown across 6 segments available in the complete report.

Regional Architecture and Country Demand Map

Geography here reflects forming capacity and regulation together rather than either alone. East Asia leads on both counts, holding the largest installed base of forming lines while running its own phased plastic restriction programme, and freight economics keep the category regional everywhere else. No region breaches its framework band here.

East Asia

Thirty percent, the largest pool, and it is a production story as much as a consumption one. China holds more installed molded fiber forming capacity than the rest of the world combined, built originally for export and now increasingly absorbed domestically as the phased plastic restriction programme reaches foodservice. Bamboo and bagasse furnish are both locally abundant, and drying energy costs less than in Europe. Japanese and South Korean demand skews toward higher surface finish and tighter dimensional tolerance for retail prepared food. Growth at 9.0% runs above the global rate, driven by domestic regulation converting export capacity to home supply rather than by any expansion in the installed forming base itself.
Share: 30% | CAGR: 9.0% (2026 to 2036)

South Asia and Pacific

India carries most of the twelve percent and contributes the fastest national growth rate anywhere in this forecast at 12.1%. The identified plastic items ban reaches foodservice bowls directly, and enforcement has tightened meaningfully across metropolitan municipal areas. Bagasse availability is the decisive advantage here, since Indian sugar milling generates residue at scale within trucking distance of most converting sites. Southeast Asian demand from Thailand. Vietnam, and Indonesia adds steadily on similar logic. Growth at 9.8% is the highest of any region, supported by domestic furnish cost, a rapidly formalising foodservice sector, and converting capacity being commissioned faster than anywhere outside China. Export volumes into Gulf markets add further to regional output.
Share: 12% | CAGR: 9.8% (2026 to 2036)
Regional intelligence for 5 additional markets available in the complete report: North America, Western Europe, Latin America, Middle East and Africa, Eastern Europe. Contact sales@marketmindsadvisory.com.
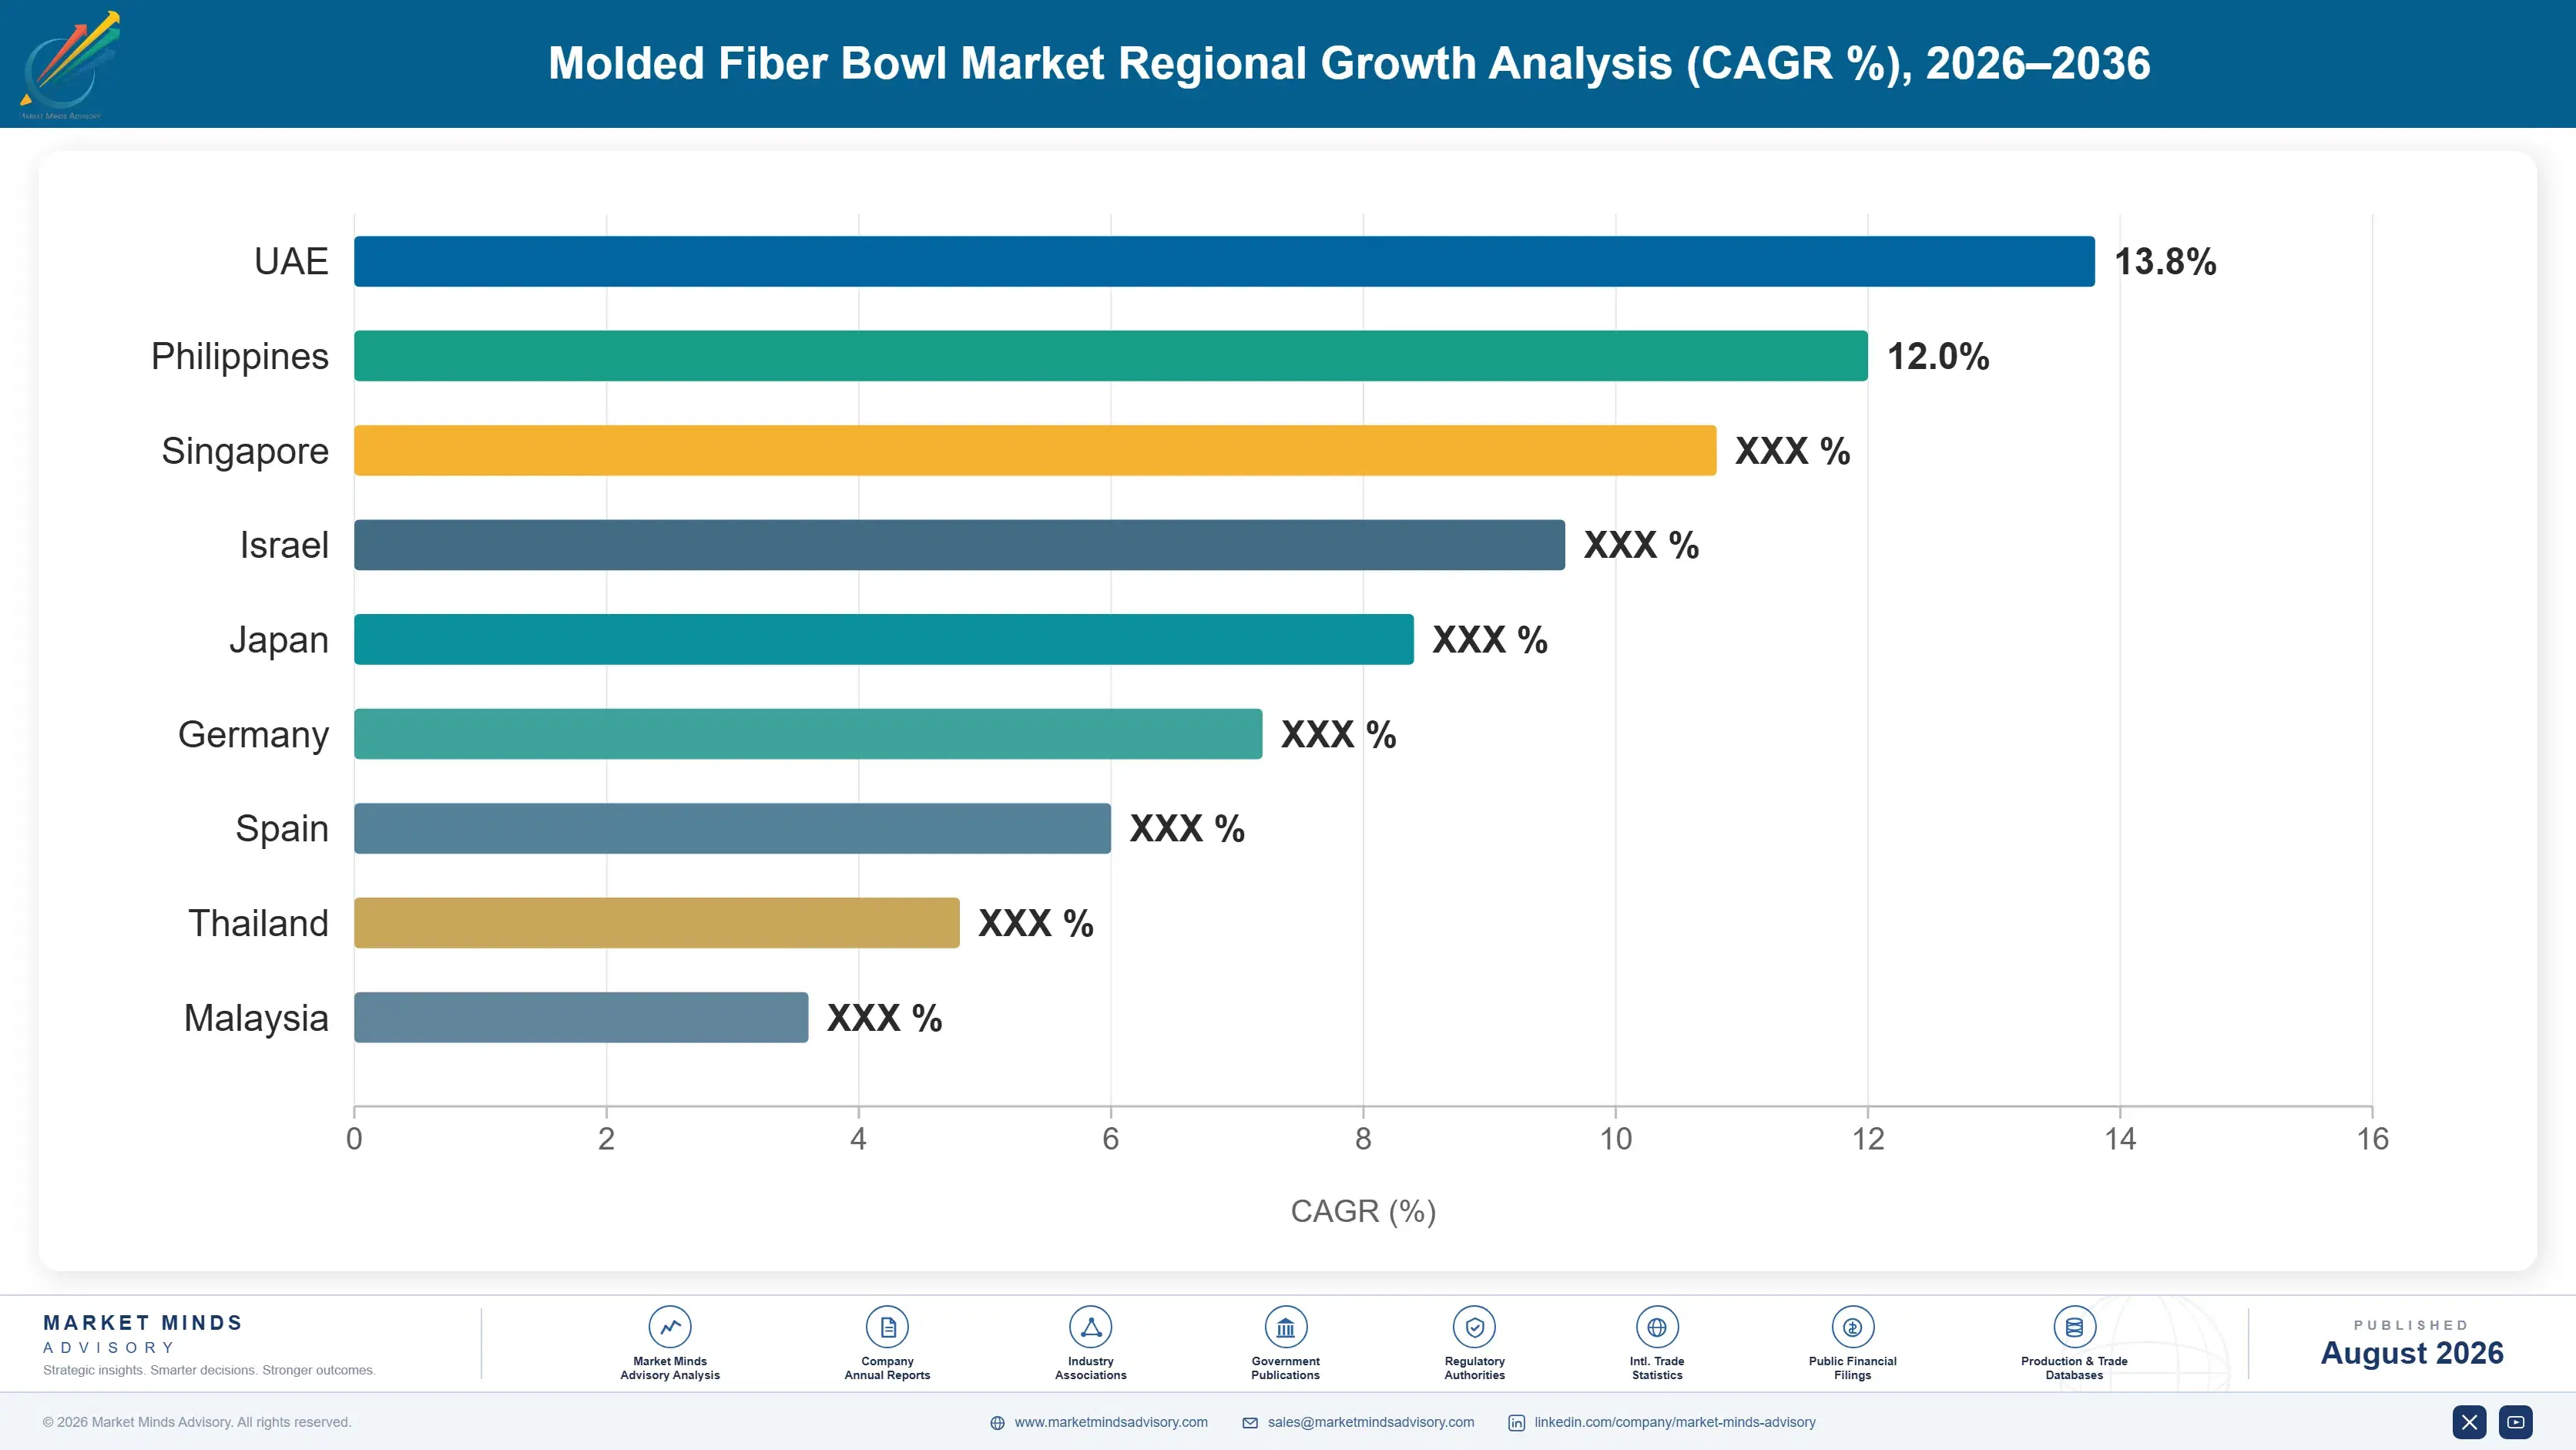
molded-fiber-bowl-market-country-cagr-analysis-1787298717435

Four Places Margin Actually Hides Here

Pulp is a third of cost and everybody buys it at similar prices, so nobody wins on furnish negotiation. Margin comes from barrier qualification others cannot match, from nesting geometry that cuts freight, from buying agricultural residue against the crushing season, and from recovering the heat that drying throws away. Four levers follow, and three of them are engineering decisions.

Qualify Dual-Layer Barriers Ahead Of Deadline Waves

State and national fluorine-free deadlines land on different dates, and converters who qualify early sell into markets where competitors simply cannot bid. Dual-layer systems, a base seal plus a thin oleophobic top coat, handle the hot oily food case that single aqueous dispersions still fail beyond forty minutes. Qualification across a converter's line set costs perhaps 900,000 dollars including trials, food contact testing, and downtime. It buys eighteen to twenty-four months of restricted competition on quick-service tenders, which in this category is the difference between winning a national account and losing one.
Market Impact: Qualification costs roughly 900,000 dollars per converting plant

Redesign Nesting Geometry Before Renegotiating Freight Rates

A bowl is mostly air, so delivered cost is decided by how many nest into a carton rather than by the freight rate itself. Moving from 74 units per stack to 90 cuts pallet count by roughly a fifth on the same order, and it costs a tooling change rather than a contract renegotiation. Draft angle, rim profile, and base stacking feature all contribute. Most converters treat nesting as a design afterthought and then negotiate freight annually, which is precisely backwards. The tooling investment pays back inside a year at moderate volume and keeps paying indefinitely.
Market Impact: Cuts pallet count by roughly 20% per order

Buy Bagasse At Harvest And Store It Properly

Cane crushing runs a few months a year and bagasse degrades through microbial action if stored wet and uncovered, which is why most converters buy spot and pay off-season premiums. Baling, covered storage, and moisture control cost around 1.2 million dollars for a plant-scale facility and lock in harvest pricing for twelve months. Against a furnish that already runs about 30% below recovered wastepaper, that compounding is substantial. The operational discipline is real and unglamorous. It is also the single clearest cost separation between Indian and Brazilian converters who did it and those who did not.
Market Impact: Storage facility costs about 1.2 million dollars total

Recover Dryer Exhaust Heat Across The Forming Line

Thermal drying is 29% of conversion cost and most of that energy leaves the building as warm wet air. Exhaust heat recovery preheating incoming process water and forming air recovers a meaningful fraction, typically cutting total drying energy by 14 to 18 percentage points on a retrofitted line. Capital runs around 600,000 dollars per line with payback near three years at European gas prices and longer where energy is cheap. That geography dependence is exactly why European converters have moved on it while Asian plants largely have not, and it partly offsets the regional cost gap.
Market Impact: Cuts drying energy by 14 to 18 points

Who Controls the Margin Pool

Concentration reaches only 27% across the top five measured on annual forming capacity, which makes this among the more fragmented packaging categories MMA covers. The leaders are broad foodservice packaging groups for whom bowls are one format among many, rather than molded fiber specialists. The gap to challengers is narrow, and a mid-sized regional converter with qualified barrier chemistry competes credibly for national account work.
Competition runs on three fronts today. Barrier qualification is the first and it now functions as an entry test rather than a differentiator. Nesting and freight economics are the second, decided at the tooling stage and rarely discussed openly. Furnish access is the third, and it separates converters sited near sugar mills or bamboo pulping from those buying recovered wastepaper on the open market.

Pressure is building from two directions at once. Asian converters with cheap drying energy and local agricultural residue are landing product into Gulf and African markets that Western producers cannot serve economically. And smaller converters unable to fund barrier requalification are exiting or selling, which will consolidate the middle of the market over the next few years.
molded-fiber-bowl-market-company-positioning-matrix-1787298717953

Competitive Moat and Risk Dimensions

HUHTAMAKI

Moat: Global barrier qualification portfolio

Fluorine-free barrier systems qualified across multiple regulatory jurisdictions and plant locations represent years of testing that a regional converter cannot replicate quickly. That portfolio lets the company bid on international chain programmes where a single specification must hold across continents. Compliance depth of this kind is expensive, slow to build, and invisible outside procurement.
HUHTAMAKI

Risk: Format breadth dilutes focus

Bowls are one format inside a very wide foodservice packaging portfolio, so capital competes internally against cups, containers, and flexible formats. Dedicated molded fiber specialists move faster on furnish and tooling decisions specific to this format. Broad portfolios also carry a cost base that single-plant regional converters simply do not support.
PACTIV EVERGREEN

Moat: North American distribution density

Reach into United States foodservice distribution is deep enough to place a new format into thousands of independent operators through existing relationships. In a category where freight economics keep supply regional, that density is worth more than manufacturing scale. It also makes the company the default second source for chains that refuse to single-source a compliance-critical item.
PACTIV EVERGREEN

Risk: Regional concentration limits growth

The distribution strength defining this position exists in one region, and the fastest-growing volume pools sit in Asia where that network has no reach. Building comparable density elsewhere is a decade of work rather than an acquisition. Exposure to North American energy and recovered fiber pricing is also entirely undiversified.

Players Tracked

Prominent Players

Huhtamaki
Pactiv Evergreen
Novolex
Sabert Corporation
Brodrene Hartmann

Other Key Players

Genpak
Dart Container
Detmold Group
Duni Group
CKF Inc
Keiding Inc
UFP Technologies
Guangxi Qiaowang Environmental Protection Technology
Hefei Craft Tableware
Yash Pakka
Pappco Greenware
Visy Industries
Tellus Products
Footprint
Nippon Molding

Recent Developments

JANUARY 2025

European converter commissions heat recovery retrofit across forming lines

A Western European molded fiber producer completed exhaust heat recovery retrofits across its bowl forming lines, preheating process water and forming air from dryer waste streams. The work was organic capital investment at existing sites, targeting the drying energy exposure that gas price movement had exposed.
Signal: Energy retrofit economics now separate European converters from Asian ones more sharply than labour cost ever did
APRIL 2025

Indian producer commissions bagasse storage adjacent to sugar mill

An Indian molded fiber manufacturer built covered baling and storage capacity next to a sugar milling operation to secure harvest-priced bagasse across the full year. The investment was organic capacity expansion funded internally, and it addressed the off-season furnish premium that has constrained Indian converter margins for years.
Signal: Furnish cost separation is being built with concrete and moisture control rather than through any procurement negotiation
AUGUST 2025

Major quick-service chain completes fiber bowl conversion across markets

An international restaurant group finished converting its bowl formats from plastic to molded fiber across its principal operating markets, setting a single barrier performance specification for all regional suppliers. The conversion was a procurement decision rather than any commercial arrangement with a converter, and franchise agreements made it mandatory downstream.
Signal: One chain specification propagates through thousands of outlets and sets the performance standard the whole distributor base then stocks

Where The Cost Base Actually Sits

Three inputs dominate. Fiber furnish runs about 34% of cost of goods, drawn from recovered wastepaper streams in North America and Europe and from sugar milling and bamboo pulping across Asia and Brazil. Thermal drying energy is second at roughly 29%, sourced as natural gas in most regions and increasingly as biomass in Asia. Barrier coating chemistry is third and has risen sharply since the fluorochemical withdrawal.
The volatility that hurt most was energy. European natural gas prices moved violently through the recent period, and IEA reporting on that market shows the scale of the dislocation plainly enough. For a process where drying is nearly a third of conversion cost, the effect was immediate: several European converters suspended forming lines rather than run them below cost, and one exited the format entirely.

The competitive disadvantage mechanism is geographic and it cuts sharply. A converter in a high gas price region carries roughly ten percentage points more conversion cost than one running biomass-fired drying in Asia, on an identical process. Converters sited near sugar mills or bamboo pulping avoid furnish freight entirely. Independent converters buying both energy and recovered fiber on open markets carry the full exposure with no offset.
molded-fiber-bowl-market-cost-volatility-analysis-1787298718149

Recover dryer exhaust heat to cut thermal energy demand

Exhaust heat recovery preheating process water and forming air removes 14 to 18 percentage points of drying energy on a retrofitted line for around 600,000 dollars of capital. Payback runs near three years where gas is expensive and considerably longer where it is not, which is why adoption maps almost exactly onto regional energy pricing rather than onto converter size.

Fire drying with the same agricultural residue used as furnish

Converters sited near sugar mills already handle bagasse in volume, and the fraction unsuitable for pulping burns perfectly well. Biomass-fired drying removes most natural gas exposure and turns a waste stream into an energy input. Capital is significant and emissions permitting varies by jurisdiction, but the operating cost position it creates is difficult for a gas-fired competitor to match.

Contract barrier coating volumes across multi-year supply agreements

Fluorine-free coating chemistry comes from a small supplier base that gained considerable pricing power when the fluorochemicals were withdrawn. Multi-year volume commitments secure both price and allocation, and allocation matters more than price when a supplier is capacity-constrained. Converters who signed early hold a cost position that spot buyers cannot reach, and requalifying a different chemistry is expensive.

Portfolio Architecture for Margin Defence

Three tiers describe this category and the margin spread between them is narrower than converters would like. Commodity bowls on recovered wastepaper with basic water-resistant coating sit at thin margin and compete purely on delivered cost. Certified premium bowls with qualified fluorine-free barriers, chain-approved specifications, and tighter dimensional tolerance for lidding sit meaningfully higher. And compostability-certified or recycled-content-verified product occupies a third tier where
The tension is that volume tier work fills the forming lines, and a molded fiber plant running below about 78% utilisation loses money regardless of what it makes. Converters who chased premium exclusively found their lines idle between chain orders and their fixed cost unabsorbed. The successful pattern is premium work anchoring the schedule while commodity volume fills the gaps, which requires tooling flexibility most single-product plants never built.

High-value pools concentrate wherever a procurement condition rather than a performance requirement sets the specification. Compostability certification and verified recycled content both command price that the physical product does not justify. Documentation rather than performance is what the buyer is purchasing, and documentation is cheap to produce.

Volume / Commodity-Adjacent Tier

Recovered wastepaper bowls with basic water-resistant coating, sold on delivered cost into independent foodservice and distribution. Nesting geometry and freight decide who wins. This tier fills forming line capacity and absorbs the fixed cost that everything above it depends on.
Gross Margin: 14-22%

Premium / Certified Tier

Chain-specified bowls with qualified fluorine-free barrier systems, tighter dimensional tolerance for lidding, and multi-jurisdiction food contact compliance. Margin reflects qualification investment and the restricted bidder set it creates rather than any difference in the underlying fiber.
Gross Margin: 27-38%

Sustainability / Regulatory / Next-Generation Tier

Industrially compostable certified bowls, verified recycled content product, and agricultural residue furnish with documented chain of custody. Price is set by procurement conditions rather than by physical performance, which is precisely why the margin holds.
Gross Margin: 33-46%
molded-fiber-bowl-market-portfolio-architecture-1787298718650

High-value Sub-segments and Strategic Watch-out

Certified Compostable Bagasse Bowls

Best combination of margin and growth, pairing the cheapest furnish available with a certification that buyers pay for directly. Growth depends on industrial composting infrastructure that most municipalities still lack, which is the one thing converters cannot influence themselves. Certification cost itself is modest against the price achieved.
Gross Margin: 36-48%

Chain-Specified Barrier Bowls

Strong margin on qualification scarcity rather than on product difference, with volumes that arrive in very large committed blocks. Growth is steady but the position erodes as more converters complete requalification and the restricted bidder set gradually widens again. Contract terms of two to three years slow that erosion.
Gross Margin: 27-38%

Recovered Wastepaper Commodity Bowls

The volume core, thin on margin and essential to line utilisation, competing entirely on nesting geometry and delivered freight cost. Losing this work idles forming capacity between premium orders, which is how several converters discovered their fixed cost absorption the hard way. Absorption economics punish anyone who abandons this tier.
Gross Margin: 14-22%

Imported Low-Cost Asian Bowls

The strategic watch-out, landing into Gulf. African, and Latin American markets at prices Western converters cannot match on biomass drying and local furnish. Freight on low-density articles limits the reach, but that limit moves outward whenever container rates soften materially. Local converting capacity in those markets remains minimal.
Gross Margin: 11-19%

How This Demand Repeats

Every bowl is consumed once, which makes this among the purest consumable annuities in packaging. What creates durability is not the product but the specification: once a chain or a distributor qualifies a converter's bowl against a barrier standard and a nesting profile, reordering is automatic and switching means requalification nobody wants to fund. Contract terms typically run two to three years, and renewal is the norm rather than the exception.
Adoption depth varies sharply by operator type. National quick-service chains convert wholesale and hold specification tightly, which produces the largest and stickiest volume. Independent restaurants buy whatever their distributor stocks, so the distributor rather than the operator is the actual customer. Retail prepared food demands better surface finish for shelf presentation and pays for it. Institutional catering buys on price against a compliance floor and switches readily whenever a cheaper compliant option appears.

Buyer profiles are shifting as sustainability procurement moves from marketing to supply chain functions. The people specifying bowls now increasingly ask for chain of custody documentation and composting certification rather than for environmental claims. Chain of custody documentation is now a routine tender requirement, and vague environmental claims carry no weight at all.
molded-fiber-bowl-market-end-use-penetration-index-1787298719137

What We Would Tell a Board

These are among the four positions where our research anticipates prominent divergence between winners and laggards over the coming forecast period. Each is grounded in the demand model, the regulatory perimeter, and the announced capacity pipeline.
01 / BARRIER QUALIFICATION TIMING

Qualify ahead of the deadline wave, not against it

Fluorine-free deadlines land on different dates across states and countries, and converters qualified early sell into markets where competitors are legally unable to bid at all. Dual-layer systems handle the hot oily food case that single aqueous dispersions still fail beyond forty minutes, and qualification across a line set costs roughly 900,000 dollars while buying eighteen to twenty-four months of restricted competition on quick-service tenders. In a category sitting at 27% concentration, that window is how a regional converter becomes a national one.
02 / NESTING GEOMETRY ECONOMICS

Fix the tooling before renegotiating the freight contract

Delivered cost in this category is decided by how many bowls nest into a carton, not by the rate per mile, and moving from 74 units per stack to 90 removes about a fifth of pallet count on the same order. That is a tooling change rather than a commercial negotiation, and it pays back inside a year at moderate volume. Most converters treat nesting as an industrial design afterthought and then negotiate freight annually, which has the priorities exactly reversed.
03 / DRYING ENERGY POSITION

Energy geography now decides who can serve which markets

Thermal drying accounts for 29% of conversion cost, and a converter in a high gas price region carries roughly ten percentage points more cost than a biomass-fired Asian plant running an identical process. Exhaust heat recovery removes 14 to 18 points of drying energy for around 600,000 dollars per line, with payback landing near three years wherever gas is expensive. Boards across Western Europe should treat this as survival capital rather than as an ordinary efficiency project competing for funds.
04 / UTILISATION AND MIX BALANCE

Premium work alone will idle the forming lines

A molded fiber plant running below roughly 78% utilisation loses money whatever it produces, because the fixed cost of forming and drying capacity dominates every other line in the accounts. Converters who chased chain-specified premium work exclusively found their lines idle between committed blocks and their absorption destroyed. The pattern that works uses premium orders to anchor the schedule while commodity volume fills the gaps, and that demands a degree of tooling flexibility most single-product plants never bothered to build.

Engagement Snapshot From the Field

A live engagement with an industry participant carrying material or product regulatory and market exposure ahead of a defining policy shift, showing how our research translates into a defensible multi-year portfolio strategy.
MARKET MINDS ADVISORY · CLIENT ENGAGEMENT SUMMARY
Molded Fiber Bowl Producer Strategic Portfolio Review and Transition Roadmap 2026·Investment Scenario on Molded Fiber Bowl Exposure Evaluation 2025-26
CLIENT PROFILE
A North American molded fiber converter with approximately 140 million dollars in annual revenue (client-reported, unverified by MMA), operating three forming plants and supplying both distributor and regional chain accounts. The company had completed fluorine-free barrier qualification at two of three sites, ran recovered wastepaper furnish exclusively, and had lost two chain tenders in the preceding year on delivered cost despite competitive ex-works pricing.
STRATEGIC CHALLENGE
Management believed the losses reflected freight rates and had opened a carrier renegotiation. Line utilisation had also fallen below 70% at one plant as the business shifted toward premium chain work. The board wanted an independent view on whether the cost problem was procurement, mix, or something in the product itself.
MMA APPROACH
We benchmarked the client's bowl nesting profiles against nine competitor products across the same capacity range, modelled delivered cost per thousand units on identical lane assumptions, and rebuilt plant absorption economics under three mix scenarios. Barrier qualification timelines at the third site were mapped against state deadline dates to identify which tenders the company was excluded from.
KEY FINDINGS
  1. Client bowls nested at 71 units per stack against a competitor median of 86, adding roughly 18% to pallet count and explaining most of the delivered cost gap on both lost tenders.
  2. The unqualified third plant sat inside a state whose fluorine-free deadline had already passed, excluding the company from tenders it was still submitting quotations against.
  3. Plant absorption modelling showed the premium-heavy mix destroying more margin through idle capacity than it created through price, at every volume level tested.
  4. Recovered wastepaper furnish cost sat roughly 22% above what bagasse-based competitors were paying, with no offsetting performance advantage in the formats compared.
CLIENT PROFILE
A North American molded fiber converter with approximately 140 million dollars in annual revenue (client-reported, unverified by MMA), operating three forming plants and supplying both distributor and regional chain accounts. The company had completed fluorine-free barrier qualification at two of three sites, ran recovered wastepaper furnish exclusively, and had lost two chain tenders in the preceding year on delivered cost despite competitive ex-works pricing.
STRATEGIC CHALLENGE
Management believed the losses reflected freight rates and had opened a carrier renegotiation. Line utilisation had also fallen below 70% at one plant as the business shifted toward premium chain work. The board wanted an independent view on whether the cost problem was procurement, mix, or something in the product itself.
MMA APPROACH
We benchmarked the client's bowl nesting profiles against nine competitor products across the same capacity range, modelled delivered cost per thousand units on identical lane assumptions, and rebuilt plant absorption economics under three mix scenarios. Barrier qualification timelines at the third site were mapped against state deadline dates to identify which tenders the company was excluded from.
KEY FINDINGS
  1. Client bowls nested at 71 units per stack against a competitor median of 86, adding roughly 18% to pallet count and explaining most of the delivered cost gap on both lost tenders.
  2. The unqualified third plant sat inside a state whose fluorine-free deadline had already passed, excluding the company from tenders it was still submitting quotations against.
  3. Plant absorption modelling showed the premium-heavy mix destroying more margin through idle capacity than it created through price, at every volume level tested.
  4. Recovered wastepaper furnish cost sat roughly 22% above what bagasse-based competitors were paying, with no offsetting performance advantage in the formats compared.
RECOMMENDED STRATEGY
Phase 1: Phase 1 (months one to six): halt the carrier renegotiation, commission tooling redesign for nesting geometry, and accelerate barrier qualification at the third site. Phase 2: Phase 2 (months six to eighteen): rebalance mix toward commodity volume to restore absorption, and trial agricultural residue furnish on one forming line. Phase 3: Phase 3 (months eighteen to thirty): retender lost chain accounts on the improved delivered cost position, and evaluate heat recovery retrofit economics.
OUTCOME
The client redirected the freight budget into tooling and requalification. Nesting improved to 84 units per stack across the redesigned range, delivered cost fell enough to recover one of the two lost accounts, and plant utilisation returned above 80% within three quarters (client-reported, unverified by MMA).

Frequently Asked Questions

Foundational context covering the market sizes, CAGR, scope, country, region and competition that inform every finding below. This section is provided to cover basics and most often pre-purchase conversations, answered from the MMA Primary Research Dataset.

What is the current size of the Molded Fiber Bowl Market?

The market is valued at USD 2.8 billion in 2025, rising to USD 3.02 billion in 2026. East Asia holds the largest single regional share at 30%.

How large will the Molded Fiber Bowl Market be by 2036?

MMA forecasts USD 6.40 billion by 2036, an increase of USD 3.38 billion over the 2026 base. That represents an expansion multiple of 2.12 times.

What is the CAGR for the Molded Fiber Bowl Market 2026 to 2036?

The base case CAGR is 7.8%, with a bull case of 9.0% and a bear case of 6.6%. The historical rate from 2020 to 2025 was 6.5%.

Which segment is growing fastest?

Bagasse pulp bowls at 11.7%, exactly 1.50 times the market rate. Sugarcane residue costs about 30% less than recovered wastepaper in the regions converting most volume.

Who are the major companies in the Molded Fiber Bowl Market?

Huhtamaki, Pactiv Evergreen, Novolex, Sabert Corporation, and Brodrene Hartmann lead on annual forming capacity. The top five together hold only 27% of the market, which makes this unusually fragmented for packaging.

Which country is growing fastest?

India at 12.1%, driven by the identified plastic items ban reaching foodservice bowls and by abundant bagasse furnish near converting sites. Enforcement has tightened across metropolitan municipal areas.

Report Segmentation Architecture

The full report scope spans multiple orthogonal segmentation dimensions, with cross-tabulated demand data provided for each dimension pair. Coverage extends further to regional breakdowns, trend trajectories, and the competitive detail needed to support segment-level decision-making.

By Fiber Furnish

  • Recovered Wastepaper Pulp Bowls
  • Virgin Wood Pulp Bowls
  • Bagasse Pulp Bowls
  • Bamboo Pulp Bowls
  • Wheat Straw And Agricultural Residue Bowls
  • Blended And Specialty Fiber Bowls

By End-Use Industry

  • Quick-Service Restaurants
  • Delivery And Takeaway Operators
  • Retail Prepared Food
  • Institutional And Contract Catering
  • Travel And Event Hospitality

By Distribution Channel

  • Direct Chain Supply Agreements
  • Foodservice Distributor Networks
  • Cash And Carry Wholesale
  • Online And Direct To Operator

By Region

  • East Asia
  • South Asia and Pacific
  • North America
  • Western Europe
  • Latin America
  • Middle East and Africa
  • Eastern Europe

Scope, Methodology, and Coverage

Every figure in this report is reproducible from documented input assumptions. The scope below maps the historical period, the forecast horizon, the segmentation dimensions, and the countries covered, alongside the underlying primary and qualitative methodology.
Historical Period
2020 to 2025
Forecast Period
2026 to 2036
Base Year
2025 (USD billions; MMA Primary Research Dataset, August 2026)
Market Definition
This market comprises single-use bowls formed from wet pulp furnish through vacuum forming, transfer moulding, or thermoforming processes, measured at converter realised prices across foodservice, retail prepared food, and institutional catering channels. Furnish coverage spans recovered wastepaper, virgin wood pulp, bagasse, bamboo, wheat straw, and blended fiber systems, inclusive of any applied barrier coating. Molded fiber trays, clamshells, plates, cup carriers, egg packaging, protective and industrial molded fiber, and all lidding components fall outside scope.
Quantitative Units
USD billions (current prices); billion units shipped; average selling price per bowl
Segmentation Dimensions
By Fiber Furnish; By End-Use Industry; By Distribution Channel; By Region
Regions Covered
East Asia, South Asia and Pacific, North America, Western Europe, Latin America, Middle East and Africa, Eastern Europe
Countries Covered
China, Japan, South Korea, Taiwan, India, Thailand, Vietnam, Indonesia, Malaysia, Australia, USA, Canada, Mexico, Brazil, Colombia, Argentina, UK, Germany, France, Italy, Spain, Netherlands, Sweden, Poland, Turkey, UAE, Saudi Arabia, South Africa, Nigeria, and additional markets relevant to this sector
Key Companies Profiled
Huhtamaki, Pactiv Evergreen, Novolex, Sabert Corporation, Brodrene Hartmann, Genpak, Dart Container, Detmold Group, Duni Group, CKF Inc, Keiding Inc, UFP Technologies, Guangxi Qiaowang Environmental Protection Technology, Hefei Craft Tableware, Yash Pakka, Pappco Greenware, Visy Industries, Tellus Products, Footprint, Nippon Molding
Quantitative Methodology
Primary survey, n=3,800 respondents, Q4 2025, six countries; demand-side model with trade association cross-validation
Qualitative Methodology
47 expert interviews, Q4 2025; applied to validate demand model assumptions, identify emerging dynamics, and assess competitive positioning
Report Format
PDF and XLSX data workbook (Word format preview document)
Publisher
Market Minds Advisory
Report Code
MMA-2026-PAC-953
Published
August 2026
Contact
sales@marketmindsadvisory.com | www.marketmindsadvisory.com

Purchase the full Molded Fiber Bowl Market Report (2026 to 2036).

The full report sizes the molded fiber bowl market across six fiber furnishes, five end-use industries, four distribution channels, and seven regions, with country detail for the fifteen largest national pools. It includes nesting efficiency benchmarking across leading commercial bowl geometries and modelled delivered cost per thousand units on standard lane assumptions. Barrier chemistry qualification status is tracked by converter and by jurisdiction against dated regulatory deadlines. Competitive profiling covers twenty companies on an annual forming capacity basis. Drying energy cost modelling compares gas-fired and biomass-fired conversion economics by region.
Nesting efficiency benchmarking across leading commercial bowl geometries
Barrier qualification status tracker by converter and jurisdiction
Drying energy cost modelling for gas and biomass firing
Bagasse and bamboo furnish pricing against recovered wastepaper
Delivered cost per thousand units on standard lanes
Plant absorption economics across three portfolio mix scenarios

Built For The People Who Decide

From boardroom strategy to bench-side execution, this report is read cover-to-cover by leaders shaping the next decade of their industry, turning demand scenarios, market dynamics and valuation benchmarks into decisions.
CXOs/ Presidents/ VPs/ Managers
M&A and Corporate Development
Strategy Teams and R&D Heads
Procurement and Product Directors
Regulatory and Compliance Leaders
Investor Relations and Equity Analysts