Market Minds Advisory
Modular Power Pods Market

Modular Power Pods Market: Modular Power Pods: Schedule Compression, Interconnection Queues and the Price of Buying Electrical Capacity as a Product

Factory-built power blocks cost roughly 19% more per megawatt than site construction, and buyers pay it because a data centre that energises 34 weeks earlier is worth considerably more than the premium.

Lead Analyst

Published

September 2026

Make Smarter Decisions with Customized Research Insights

Request a free sample report and evaluate market opportunities, growth trends, and competitive dynamics relevant to your business needs.

2025 MARKET VALUE$12.4BMarket Size 2025
2036 FORECAST VALUE$43.2BBase Case , 2026 to 2036
CAGR 2026 TO 203612.0 %Bull 13.3% / Bear 10.8%
INCREMENTAL OPPORTUNITY$29.3BNet 10- year value creation
EXPANSION MULTIPLE3.11x2036 value over 2026 base
Strategic Levers
M&A Pipeline
Regional Outlook
Country Rankings
Competitive Intelligence
Segmental Deep-dive
Call-Us : 91 93563 13602

Executive Snapshot and Market Trajectory.

Nobody buys a modular power pod because it is elegant engineering. They buy it because electrical labour is scarce, site schedules have collapsed, and a factory-built block removes about 34 weeks from the critical path. The 19% cost premium is the price of that. That is the whole argument.
Integrated generation and storage pods grow at 18.0%, half again the market rate of 12.0%, because utility interconnection now runs about 4.1 years and a site that cannot wait needs its own generation to energise. Modular substation and interconnection pods follow at 15.4% for closely related reasons. North America takes 42% of value, where data centre schedules carry the highest cost of delay anywhere. Emissions permitting decides which generation technology fits each jurisdiction.
Concentration sits near 41% across the top five on measured pod and prefabricated power system revenue, dominated by large electrical equipment manufacturers rather than by construction firms. Roughly 70% of site electrical labour moves into the factory, and about 92% of commissioning is completed before shipment. That last figure is what buyers are actually paying for. Site commissioning failures were always the largest source of energisation delay.
Market Definition
This market covers factory-built, factory-tested electrical power assemblies delivered to site as complete units, spanning prefabricated electrical distribution skids, containerised power generation pods, integrated generation and storage pods, modular substation and interconnection pods, cooling-integrated power blocks, and mobile and temporary power pods. Revenue is measured as delivered pod and prefabricated power system value at manufacturer level, including factory integration and testing. Site-erected switchgear and transformers, standalone generator sets sold without integration, grid transmission infrastructure, and building construction are excluded.
Base Year Value
$12.4B in 2025 (MMA Primary Research Dataset, September 2026)
Forecast Period
2026 to 2036, eleven discrete annual values
CAGR
12.0% base case. Bull 13.3%. Bear 10.8%.
Fastest Growth Segment
Integrated Generation and Storage Pods: 18.0% CAGR
Fastest Growth Country
India: 16.2% CAGR
Fastest Growth Region
South Asia and Pacific: 14.2% CAGR
Largest Region
North America: 42% of 2025 global value
Market Leaders
Schneider Electric, Vertiv, Eaton, ABB and Siemens Energy lead on measured pod and prefabricated power system revenue. Source: MMA Primary Research Dataset, July 2026.
Primary Survey
n=3,800 procurement and R&D decision-makers, Q4 2025, six countries
Methodology
Demand-side build-up, cross-validated against public data, 47 expert interviews

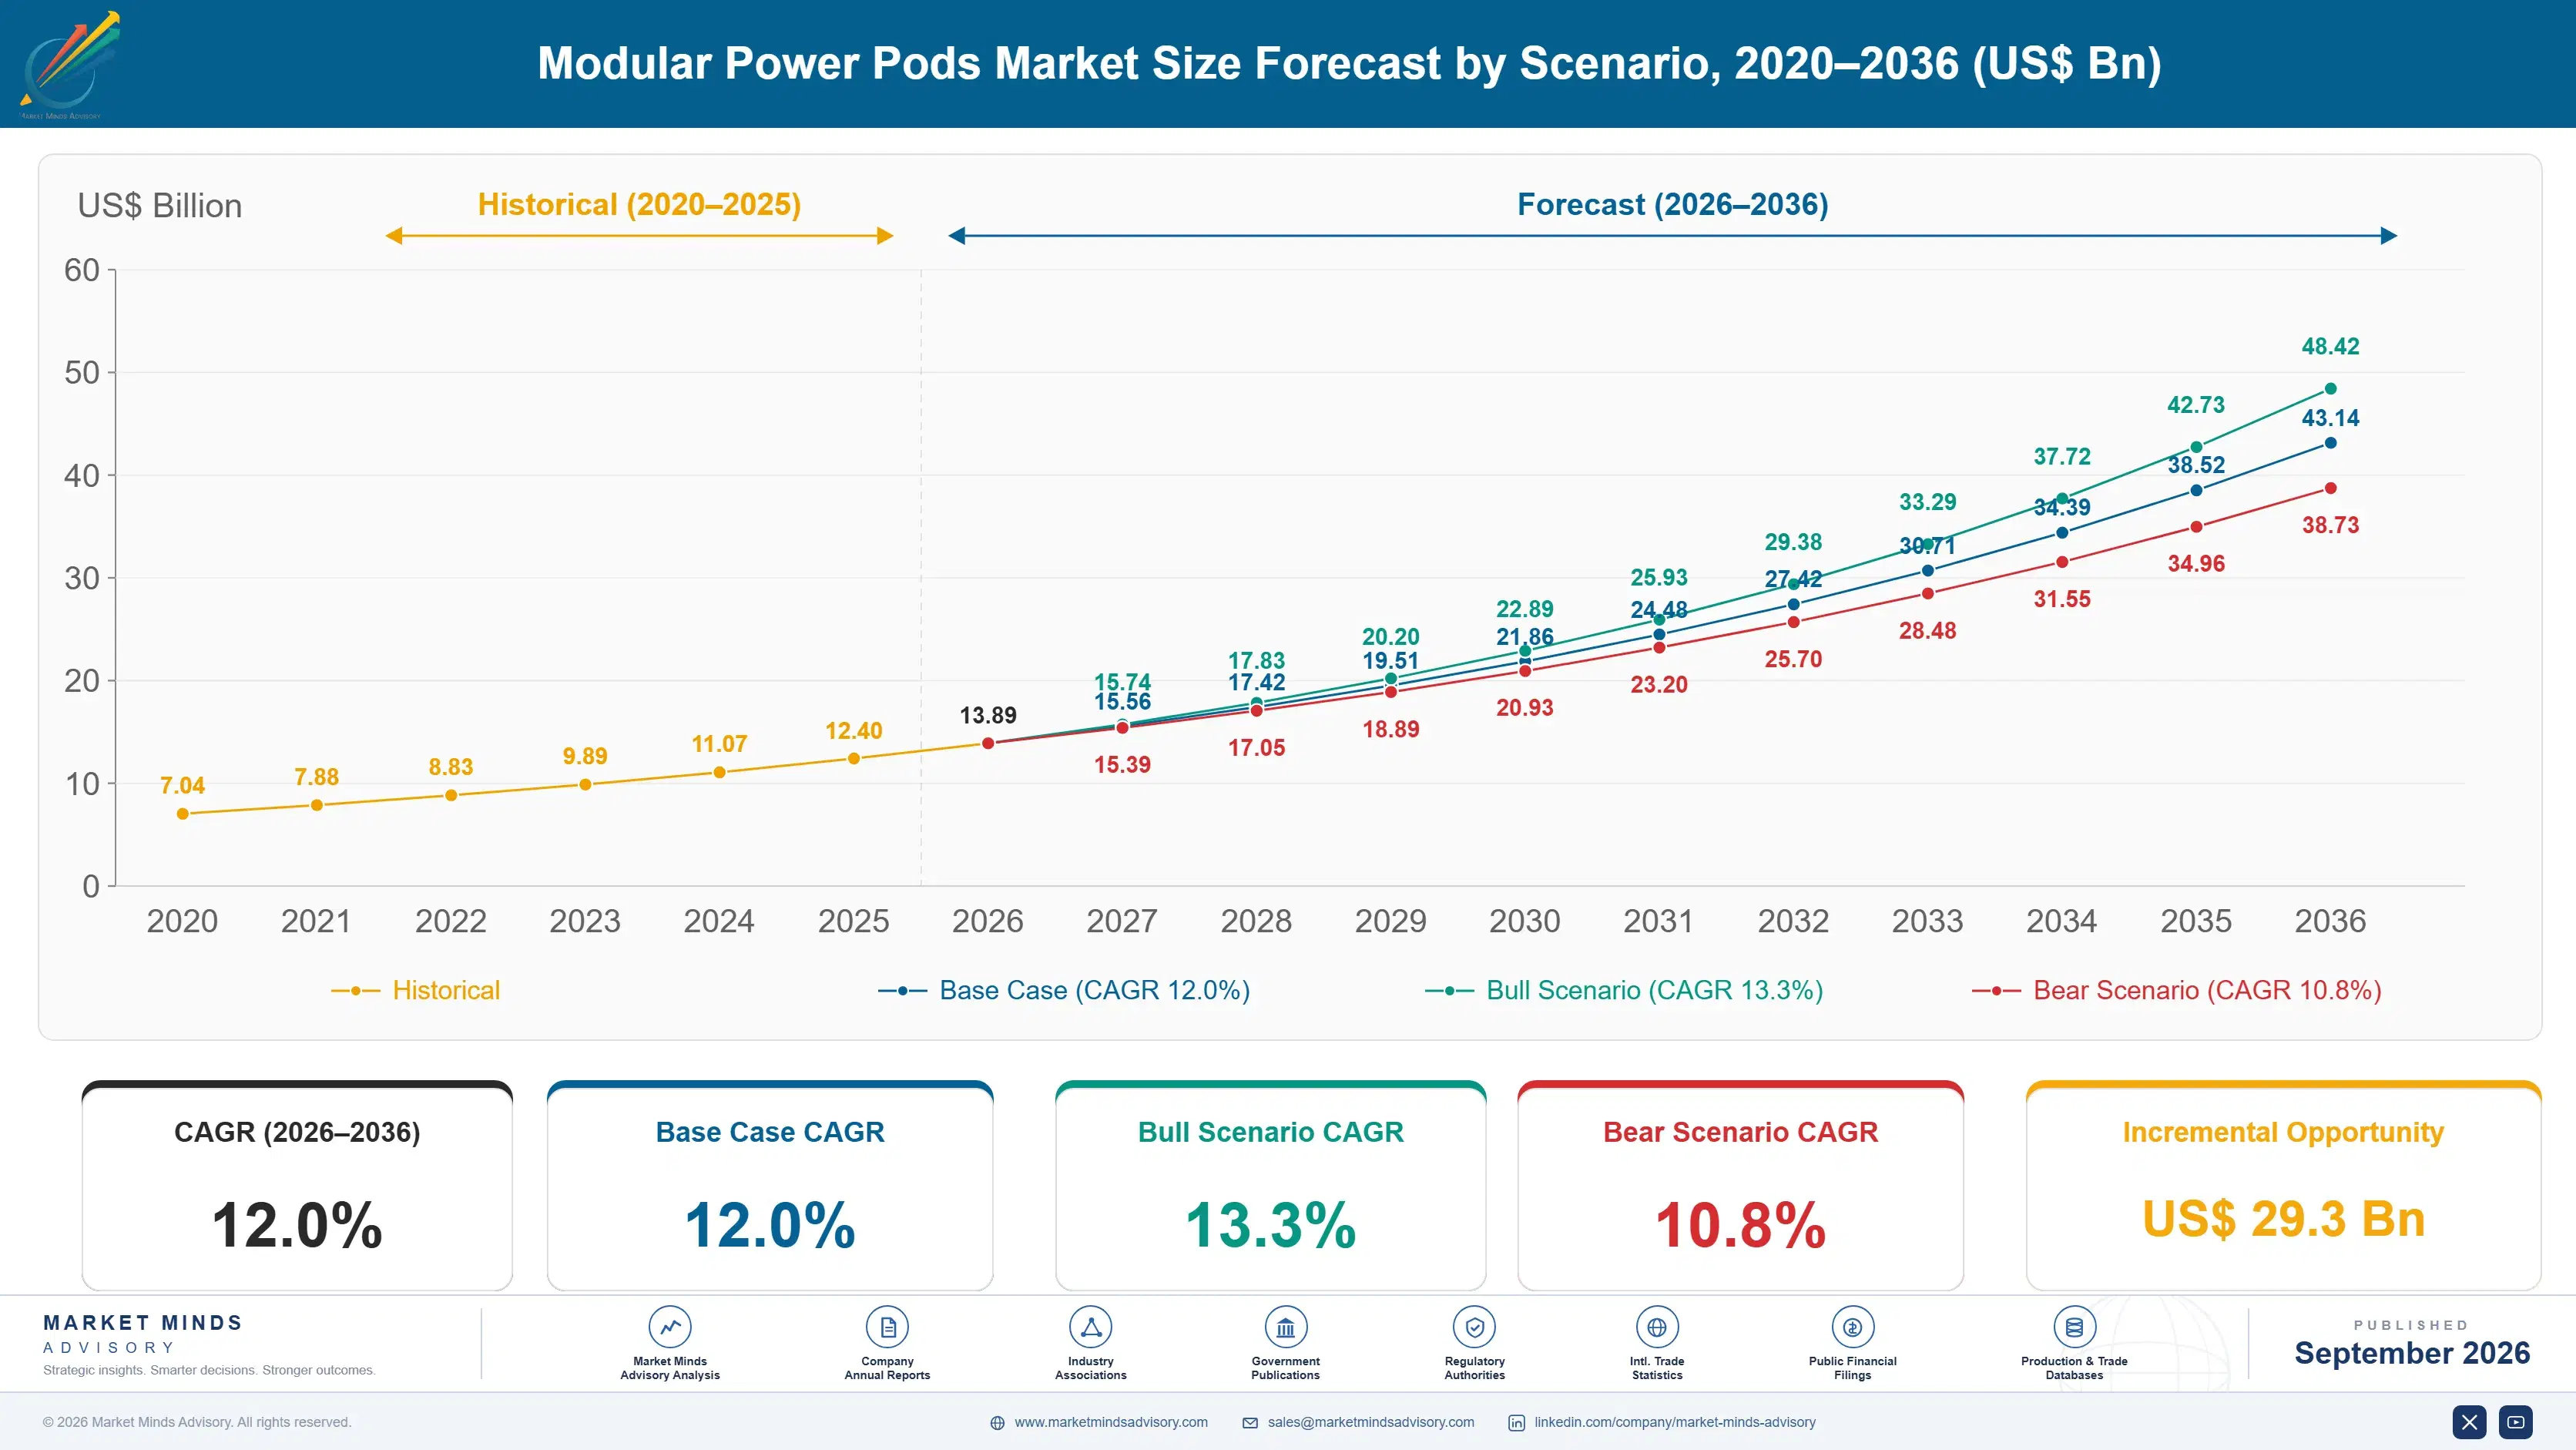
Modular Power Pods Market Forecast Scenarios

modular-power-pods-market-size-forecast-scenario-1788425248697
Growth ran at 10.8% from 2020 to 2025 and the character of demand changed completely inside that period. Early buyers were oil, gas and mining operators building in remote places where site labour was expensive or unavailable, so prefabrication solved a logistics problem. Data centre construction then arrived at a scale that changed the whole industry, bringing buyers who cared about weeks rather than about remoteness at all.
The base case at 12.0% rests on three mechanisms. Electrical construction labour remains scarce across every developed market, and a pod moves roughly 70% of those hours into a factory where a smaller crew works a line. Utility interconnection queues near 4.1 years push buyers toward pods that bundle their own generation. Third, factory testing covering about 92% of commissioning converts a schedule risk into a purchase order, which is what finance departments want.
The bull case at 13.3% assumes accelerated computing construction continues at announced rates, since those projects price delay higher than anyone else does. The bear case at 10.8% is that the 19% premium stops being tolerable once schedules normalise, which would return most industrial buyers to conventional site construction where labour is available and nobody is counting weeks.

Buying Weeks, Not Equipment

The commercial case for a modular power pod has little to do with the equipment inside it, which is the same switchgear, transformers and protection any contractor would install. What changes is where work happens and when risk resolves. Roughly 70% of electrical labour moves into a factory, 92% of commissioning completes before shipment, and around 34 weeks come off the site programme. Buyers pay 19% more per megawatt for that.
TOP FIVE CONCENTRATION41%Concentrated among large electrical equipment manufacturers operating worldwide
SCHEDULE REDUCTION34 weeksTime removed from site electrical construction on average
COST PREMIUM PER MEGAWATT19%Additional expense against equivalent conventionally constructed site electrical
SITE LABOUR DISPLACED70%Electrical labour hours moved from site into factory
INTERCONNECTION QUEUE WAIT4.1 yearsTypical delay before utility grid capacity becomes available
FACTORY TEST COVERAGE92%Share of commissioning completed before shipment to site
Whether the premium makes sense depends on whether schedule has a price. In accelerated computing construction it does, because a facility energising two quarters early earns revenue nobody had modelled. In a chemical plant expansion it usually does not, because the programme runs in years and electrical scope was never the constraint. The same product is a bargain in one market and an indulgence in the other.
Interconnection is the second argument and may end up the larger one. Utility queues near 4.1 years mean grid capacity frequently arrives long after the building is finished, pushing buyers toward pods bundling generation and storage so a site energises on its own terms. It reflects a power system that cannot connect new load as fast as it appears.
"The industry describes these as prefabricated equipment and prices them as equipment, which undersells what is happening. A buyer is purchasing certainty about a date. Manufacturers who understand that charge for the date and manufacturers who do not compete on dollars per megawatt against site contractors they cannot beat."
Director, Power Systems and Electrical Infrastructure Practice · MMA Energy Practice · September 2026

Market Trends

Generation Moves Into the Pod to Beat Interconnection

Utility interconnection queues running near 4.1 years across major developed markets mean a completed building frequently waits years for the grid capacity it was designed around, which is an unacceptable position for anyone whose revenue starts at energisation. Pods bundling gas generation, fuel cells or battery storage let a site operate on its own supply and connect later, converting a regulatory queue into an equipment purchase. Integrated generation and storage pods grow at 18.0%, the fastest anywhere here. The buyer is purchasing independence from a process nobody controls. Emissions permitting decides which technology fits a given jurisdiction.
Market Impact: Moves 70% of labour hours
Factory Testing Replaces Site Commissioning Risk

Around 92% of commissioning now completes inside the factory before shipment, which means the electrical system arrives on site proven rather than arriving as parts that must be made to work under programme pressure. Site commissioning failures historically consumed schedule at exactly the point where no float remained, and they were the single largest source of energisation delay. Manufacturers investing in full-load factory test capability have taken share from those shipping untested assemblies. It is a capital investment in test benches rather than in product engineering. Buyers now name a factory commissioning coverage figure in specifications.
Market Impact: Removes 34 weeks from schedule

Market Opportunities and Growth Drivers

Electrical Construction Labour Is Short Everywhere

Licensed electrical trades are scarce across North America, Western Europe and Australia simultaneously, and the shortage worsens because retirements outpace apprenticeship completions across every one of those markets. A pod moves roughly 70% of site electrical hours into a factory where a smaller crew works a repeatable line under supervision, which is the only way that labour multiplies. Contractors bidding conventional scope now price scarcity into their numbers, which narrows the apparent 19% premium considerably. Availability rather than cost drives most of these decisions now. Apprenticeship pipelines will not close that gap this decade.
Market Impact: Costs 19% more per megawatt

Data Centre Schedules Price Delay Explicitly

Accelerated computing facilities are built against contracted capacity commitments where each quarter of delay carries a directly calculable revenue cost, which makes schedule a line item rather than a preference. Removing about 34 weeks from the electrical programme is worth considerably more than the 19% premium in almost every one of those projects. That single buyer category has reshaped the product, pushing manufacturers toward larger blocks, higher densities and integrated cooling. Industrial buyers now purchase a product designed around somebody else's requirements entirely. Cooling integration inside the power block followed directly from the same requirement.
Market Impact: Freezes design 20 weeks early

Market Restraints and Challenges

The Premium Only Pays Where Schedule Has a Price

Pods cost around 19% more per megawatt than conventional site construction, and most industrial buyers cannot point to what a week of delay actually costs them because their programmes run in years and the electrical scope was never critical. The root cause is that prefabrication trades money for time, which is only a trade when time is scarce. Commercially this confines the market to a narrower buyer set than manufacturers assume. Mitigation runs through standardisation cutting the premium toward 12%, which several manufacturers are pursuing seriously. The buyer set is smaller than the pipeline suggests.
Market Impact: Bypasses a 4.1 year queue

Design Freeze Comes Far Earlier Than Buyers Expect

A factory-built block must be specified, engineered and released for production long before a conventional electrical package would be, which removes the late flexibility construction teams have always relied upon to absorb changes. The root cause is that the schedule saving comes precisely from parallelising factory work against site work, and parallel work cannot accommodate revision. Commercially this produces change orders that erode the saving. Manufacturers mitigate with standard platforms and defined option sets, which help genuinely and reduce the configurability buyers say they want. Late changes are where the promised saving quietly disappears.
Market Impact: Completes 92% of commissioning early
3 additional market trends, 4 additional growth drivers, and 2 additional restraints and challenges are covered in the full report. Contact sales@marketmindsadvisory.com to access the complete intelligence.

Segment CAGR and Growth Architecture

Segmentation follows what the pod actually contains, because content determines who buys it and why. A distribution skid solves a labour problem, a generation pod solves an interconnection problem, and a substation pod solves a utility scheduling problem. Those are three different purchases made by three different people inside the same project organisation. Selling to the wrong one wastes time.
modular-power-pods-market-market-share-analysis-1788425249242

Integrated Generation and Storage Pods

Integrated generation and storage pods grow at 18.0%, half again the market rate of 12.0%, and they exist because utility interconnection queues near 4.1 years leave completed buildings waiting for grid capacity that was assumed available. Bundling gas generation, fuel cells or battery storage inside the block lets a site energise on its own supply and connect to the grid whenever the queue clears. The purchase converts a regulatory delay into an equipment order, which is a trade most finance functions accept immediately. Emissions permitting is the constraint that decides which technology fits a given jurisdiction, and it varies more than the equipment does. Gas generation dominates today and fuel cells are gaining where permitting is hardest.
CAGR 18.0%

Modular Substation and Interconnection Pods

Modular substations grow at 15.4% because utility connection work is scheduled by the utility rather than by the buyer, and a factory-built substation compresses the portion the buyer still controls. Medium and high voltage assemblies arrive tested, which matters more here than elsewhere since utility witness testing on site is difficult to schedule and expensive to repeat. Adoption concentrates where transmission capacity is being added quickly and skilled substation crews are the binding constraint. Utility acceptance of factory-tested assemblies varies considerably by jurisdiction, and that acceptance rather than the technology governs how quickly the segment grows in any given market. Manufacturers with utility relationships built over decades convert these projects considerably faster.
CAGR 15.4%
Full segment breakdown across 6 segments available in the complete report.

Regional Architecture and Country Demand Map

Demand concentrates where schedule carries an explicit price and where electrical trades are scarce. Those two conditions overlap almost perfectly with large-scale computing construction, which is why the geography looks less like power equipment demand and more like data centre investment. The correlation is close enough to be predictive.

North America

North America holds 42%, well above the regional band, because the accelerated computing construction programme concentrated here prices schedule more explicitly than any other buyer anywhere. Interconnection queues across major American grid operators run near 4.1 years, which pushes projects toward pods bundling their own generation rather than waiting for capacity. Licensed electrical trades are scarce across the whole continent and contractors price that scarcity into conventional bids, narrowing the premium considerably. Canadian mining and remote industrial demand adds a smaller and steadier stream, built on the original argument about where labour is physically cheapest. Utility acceptance of factory-tested substation assemblies varies considerably between operators, which slows the modular substation segment more than any technical limitation does.
Share: 42% | CAGR: 13.2% (2026 to 2036)

East Asia

Chinese demand runs through domestic manufacturers supplying both internal data centre construction and export projects, at price points Western equipment makers do not attempt to match. Japanese and Korean buyers adopt pods principally for semiconductor fabrication facilities, where electrical complexity is extreme and construction schedules are contractually binding on equipment suppliers. Regional manufacturing capacity for enclosures, switchgear and transformers is deep, which shortens lead times materially against imported alternatives. Growth at 13.0% runs ahead of the market on computing construction and on continued semiconductor capacity investment across the region. Emissions permitting for gas generation inside pods is stricter in Japan and Korea than elsewhere, which pushes those buyers toward battery storage content instead. Domestic suppliers hold most regional volume.
Share: 22% | CAGR: 13.0% (2026 to 2036)
Regional intelligence for 5 additional markets available in the complete report: Western Europe, South Asia and Pacific, Middle East and Africa, Latin America, Eastern Europe. Contact sales@marketmindsadvisory.com.
modular-power-pods-market-country-cagr-analysis-1788425249757

Selling Certainty Instead of Megawatts

Every manufacturer in this market competes on dollars per megawatt against site contractors, and every one of them loses that comparison because prefabrication genuinely costs more. The levers that work all move the conversation onto schedule, commissioning risk and interconnection independence, where the product wins comfortably. Every proposal that leads with price invites the wrong comparison.

Price Against Delay Cost Rather Than Installed Cost

A pod costs about 19% more per megawatt and saves around 34 weeks, and only one of those numbers appears in most proposals. Buyers with contracted capacity commitments can calculate what a quarter of delay costs them, and that figure typically exceeds the entire premium by a factor of 4 or more. Manufacturers who build the delay calculation into the proposal convert at materially higher rates. Those who submit a price per megawatt are inviting a comparison against site construction they will lose every time. The calculation belongs in the proposal, not in the buyer's head.
Market Impact: Delay cost exceeds the premium by 4 times

Standardise Platforms to Compress the Premium

Configurability sounds like a selling advantage and is mostly a manufacturing cost, since every bespoke block loses the repeatability that made factory assembly cheaper in the first place. Standard platforms with defined option sets cut the premium from around 19% toward 12% and shorten lead times by roughly a third. Buyers claim to want flexibility and consistently choose availability when both are priced. The manufacturers holding the strongest positions have narrowed their catalogues rather than broadened them. Lead time is the argument that closes projects, and standardisation is the only thing that shortens it reliably.
Market Impact: Cuts the cost premium from 19% toward 12%

Sell Interconnection Independence as the Product

Queues near 4.1 years mean grid capacity frequently arrives long after a building is complete, which is a problem no amount of electrical prefabrication solves by itself. Pods bundling generation and storage address it directly and grow at 18.0%, the fastest rate in this market. Manufacturers positioning generation content as an option rather than as the answer are underselling the argument that actually closes these projects. It requires generation and storage capability that pure electrical distribution suppliers have to acquire or partner for. Buyers now ask about energisation dates rather than about distribution equipment.
Market Impact: Answers a 4.1 year interconnection queue wait directly

Invest in Full-Load Factory Test Capability

Around 92% of commissioning now completes before shipment among leading suppliers, and buyers increasingly specify that figure directly because site commissioning failures consume schedule exactly when no float remains. Full-load test benches are capital-intensive and they are the clearest available differentiator in a product category where the components inside are largely identical. Suppliers shipping untested assemblies are competing purely on price. Test capability also cuts warranty and site rectification cost by roughly 30%, which pays for the benches independently. Buyers writing coverage figures into specifications have made this a qualification requirement rather than a differentiator.
Market Impact: Cuts site rectification cost by roughly 30% overall

Who Controls the Margin Pool

Concentration sits near 41% across the top five on measured pod and prefabricated power system revenue, and the leaders are large electrical equipment manufacturers who added integration capability rather than integrators who added equipment. That origin matters commercially: they supply the switchgear, transformers and protection inside the block, so vertical content gives them a cost position specialist integrators cannot match on comparable volume.
Competition runs on three dimensions. Factory test capability is first, since around 92% of commissioning happening before shipment is now specified rather than offered. Second is lead time, which standardised platforms deliver and bespoke engineering destroys. Third is generation and storage content, where distribution-focused suppliers must partner or acquire to answer interconnection queues that are increasingly the reason projects buy at all.

Two pressures will move rankings. Generation content is becoming central rather than optional, which favours suppliers with power generation businesses and disadvantages pure electrical distribution manufacturers. Meanwhile Chinese and Indian manufacturers are building credible capability at price points Western suppliers cannot approach, and they are winning in markets where utility acceptance of factory testing is less conservative than it is in North America or Western Europe.
modular-power-pods-market-company-positioning-matrix-1788425250281

Competitive Moat and Risk Dimensions

SCHNEIDER ELECTRIC

Moat: Vertical electrical content depth

Schneider manufactures the switchgear, transformers, busway and protection that fill a power pod, which gives it a cost position specialist integrators cannot reach at comparable volume. Its prefabrication facilities are distributed across several regions, shortening lead times and reducing transport cost on assemblies that are large and awkward to ship. Long data centre developer relationships renew across successive building programmes.
SCHNEIDER ELECTRIC

Risk: Limited generation content

The company's strength is electrical distribution rather than power generation, and the fastest-growing segment at 18.0% requires generation and storage content inside the block to answer interconnection queues. Partnering supplies the capability and shares the margin with it. Buyers increasingly evaluate the complete energisation answer rather than distribution alone, which shifts the comparison onto ground the company does not own.
VERTIV

Moat: Data centre application focus

Vertiv is organised around computing facilities specifically, which shows in products designed for the densities, cooling integration and deployment cadence that accelerated computing construction requires. Its service network is positioned around the same customers, which matters because pods are commissioned and maintained by people already nearby. Buyer relationships span cooling, power and monitoring rather than electrical scope alone.
VERTIV

Risk: Single sector concentration

Revenue depends heavily on data centre construction cadence, which is currently exceptional and historically cyclical. Industrial, mining and utility buyers are served less completely, which limits the diversification that would smooth a slowdown. The company also carries less vertical component content than the largest equipment manufacturers, leaving its cost position exposed to pricing it does not control.

Players Tracked

Prominent Players

Schneider Electric
Vertiv
Eaton
ABB
Siemens Energy

Other Key Players

Legrand
Hitachi Energy
Caterpillar
Cummins
Rolls-Royce Power Systems
Generac
Wartsila
Aggreko
Delta Electronics
Huawei Digital Power
Mitsubishi Electric
Toshiba
GE Vernova
Powell Industries
Anord Mardix

Recent Developments

APRIL 2025

Manufacturers add full-load factory test capacity for larger power blocks

Several suppliers commissioned test benches capable of proving complete pods at full rated load before shipment, responding to buyer specifications that increasingly name factory commissioning coverage explicitly. The investment targets site rectification cost rather than product performance, and it lengthens factory dwell time. Buyers now name the figure.
Signal: Test capability is becoming the differentiator in a product where the components inside are largely identical.
JULY 2025

Data centre developers specify pods with integrated generation for early energisation

Developers facing interconnection waits approaching four years began specifying power blocks with gas generation or battery storage included, allowing partial operation before grid capacity arrives. Emissions permitting rather than equipment availability determined which technology was selected at each site. Grid operators were not consulted on the change.
Signal: Interconnection queues are converting a grid scheduling problem into an equipment purchase that manufacturers can supply.
DECEMBER 2025

Suppliers narrow product catalogues toward standardised power block platforms

Manufacturers reduced configurable options across their pod ranges, trading bespoke engineering for repeatable factory assembly and shorter lead times. The change cut delivered cost per megawatt and drew resistance from buyers accustomed to specifying electrical scope in detail. Lead times shortened by roughly a third across standard configurations.
Signal: Standardisation compresses the cost premium that limits this market, at the price of the configurability buyers claim to want.

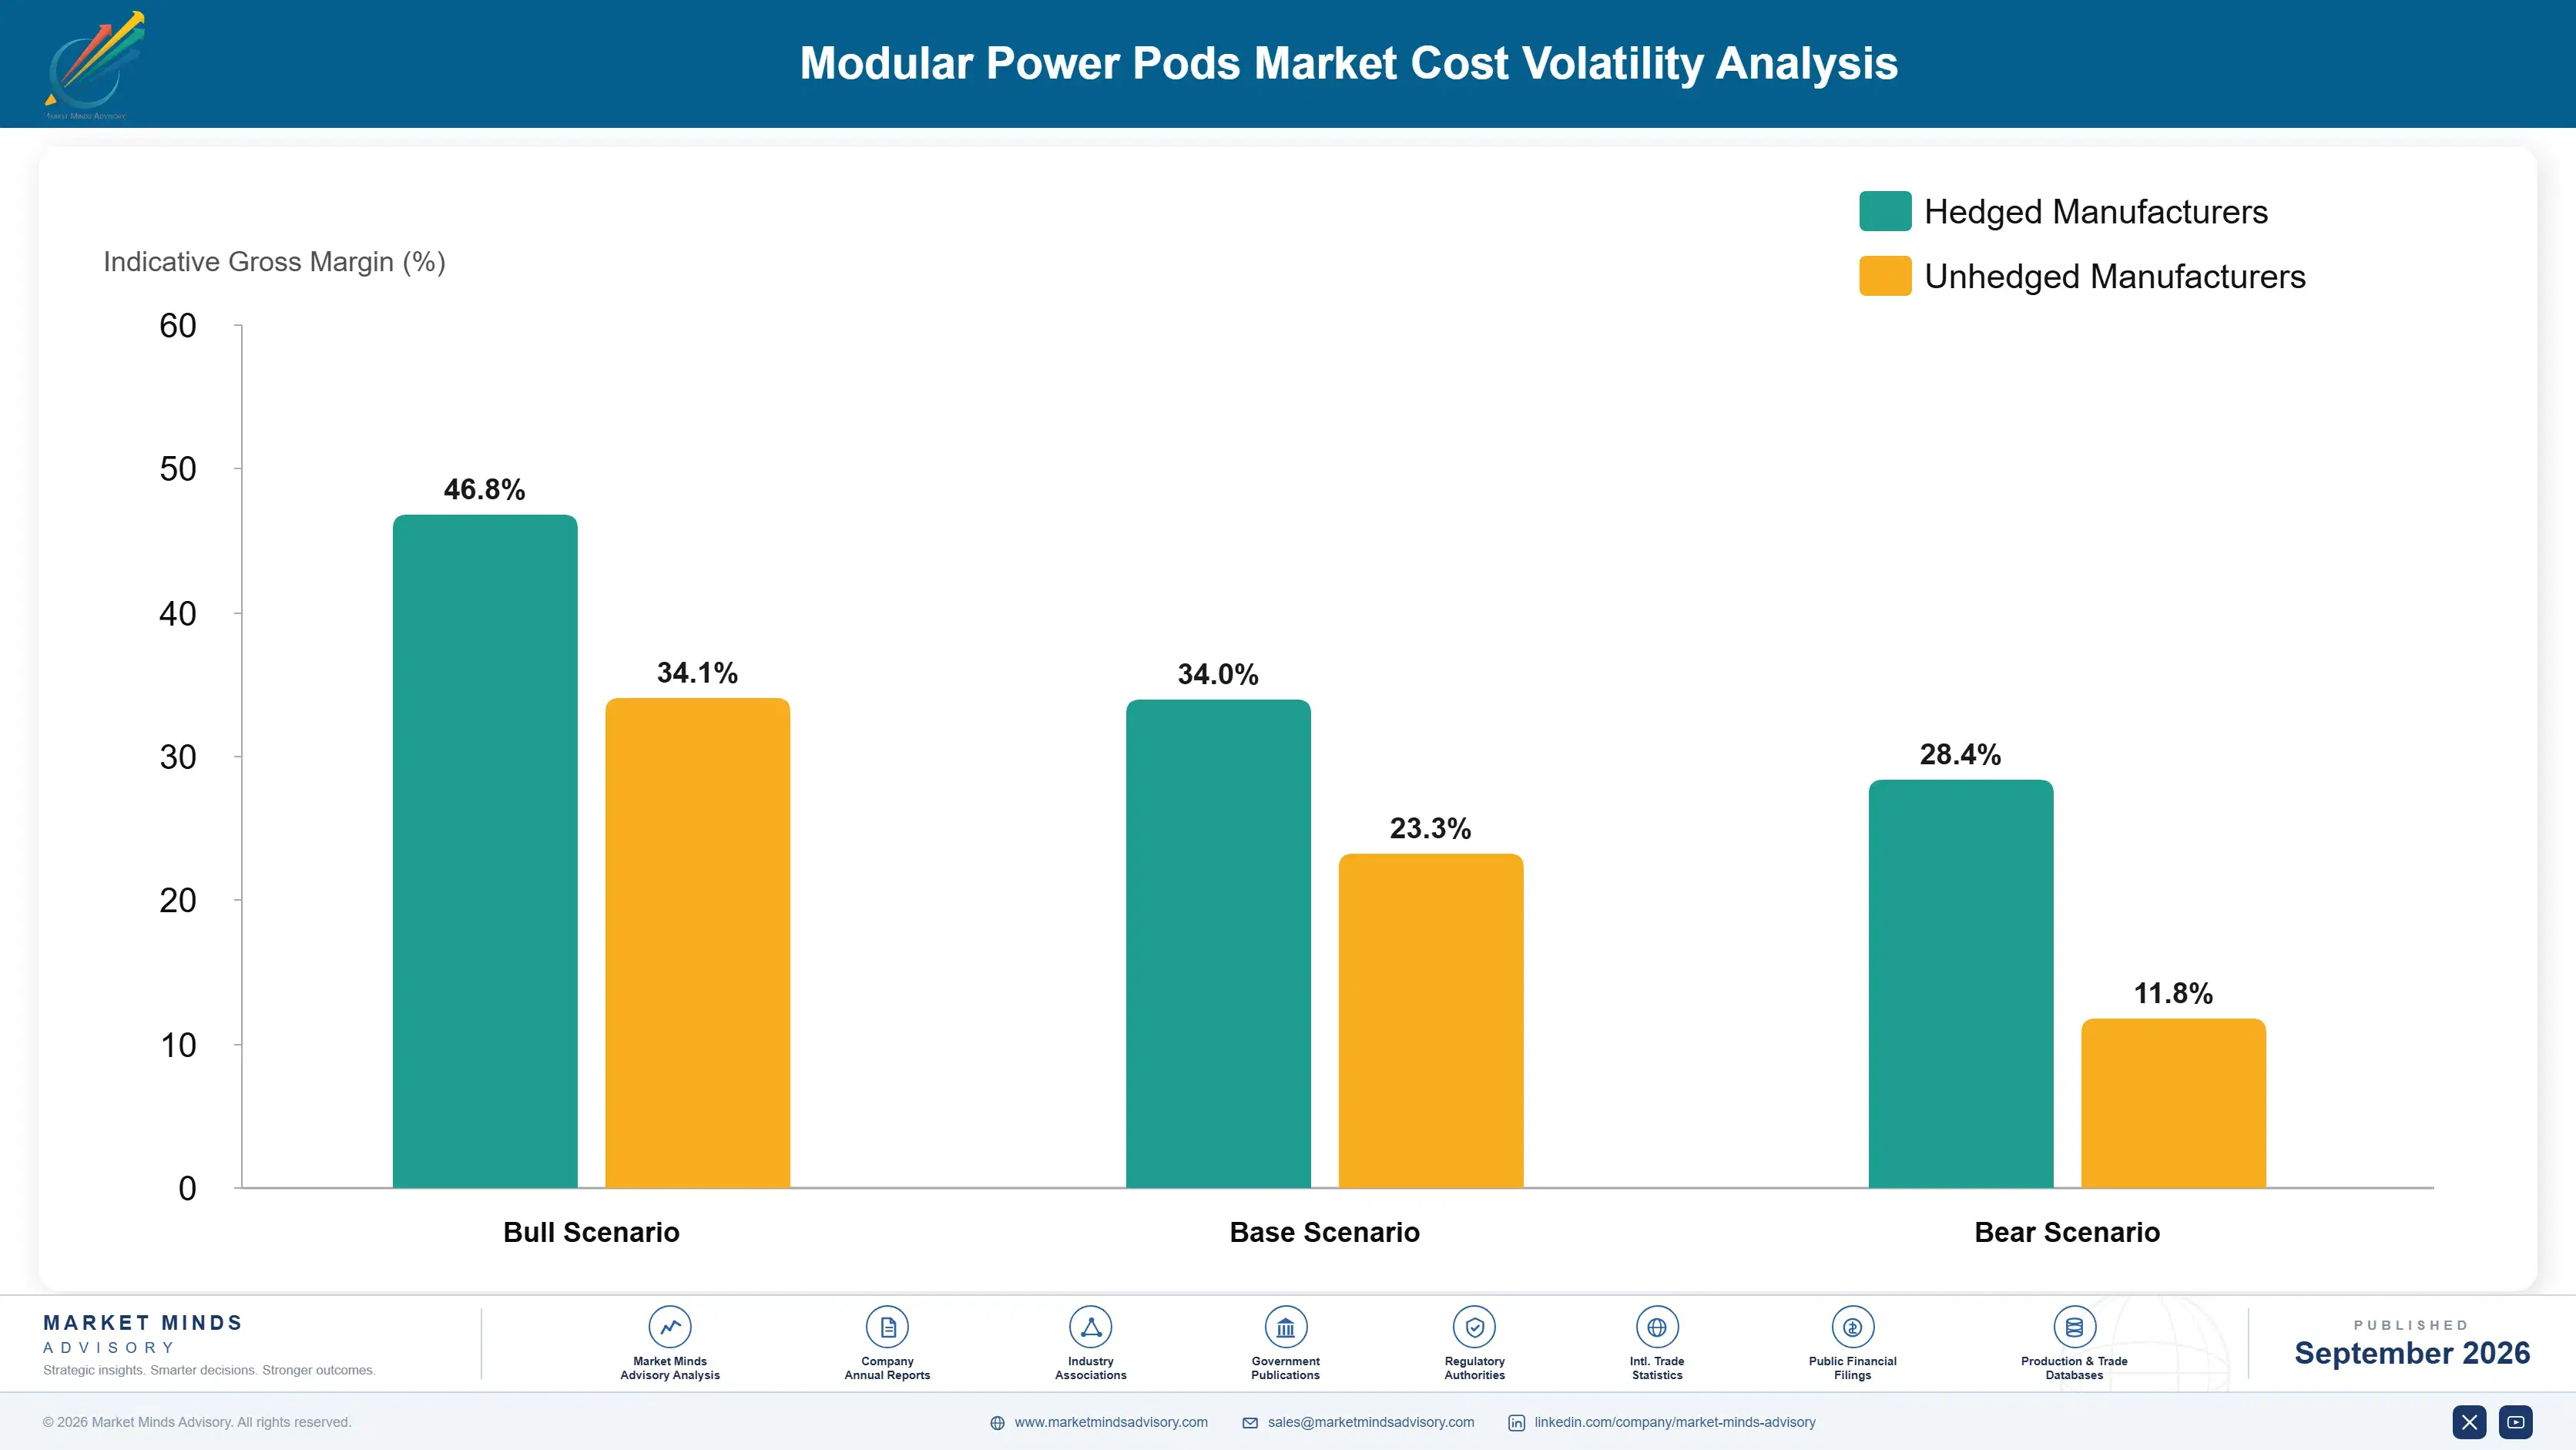
What Fills a Power Block

Cost structure is dominated by purchased electrical content rather than by fabrication. Switchgear, transformers, protection and busway together account for roughly 58% of delivered cost, with enclosure fabrication, cabling and factory labour making up most of the remainder. Copper is the largest single raw material exposure, entering through transformers, busway and cabling simultaneously. Grain-oriented electrical steel for transformer cores comes from a handful of countries.
Transformer lead times have been the defining pressure. Grid investment, renewable connection and data centre construction all drew on the same transformer manufacturing capacity through 2024 and 2025, pushing quoted lead times for large units beyond two years in several markets. Schneider Electric and Eaton both referenced supply chain and component availability conditions in recent annual reporting. Pod manufacturers responded by ordering transformers speculatively against forecast rather than against firm orders.

Exposure varies sharply by supplier type. Manufacturers producing their own transformers and switchgear control availability and pricing on roughly 58% of their cost base, which is decisive when lead times stretch. Specialist integrators buy the same components on the open market at whatever the queue allows. Suppliers holding speculative transformer inventory carry working capital risk that turns expensive if the construction cycle reverses.
modular-power-pods-market-cost-volatility-analysis-1788425250477

Order long-lead transformers against forecast rather than firm orders

Transformer lead times beyond two years mean a pod order placed conventionally cannot be delivered inside any schedule that justified buying a pod in the first place. Ordering against forecast carries inventory risk and is the only mechanism preserving the delivery promise. Suppliers who did this through the 2024 shortage held share while competitors quoted dates they missed.

Narrow the platform catalogue to concentrate component purchasing

Bespoke configurations fragment component demand across many part numbers, which forfeits the purchasing volume that would otherwise secure allocation and pricing when supply tightens. Standard platforms concentrate the same spend onto fewer items, improving both availability and unit cost. The purchasing benefit typically exceeds the manufacturing benefit, though manufacturers usually justify standardisation on assembly efficiency alone.

Design copper content out where aluminium performs adequately

Copper enters through transformers, busway and cabling at once, which makes it the largest raw material exposure and concentrates price risk in a single commodity. Aluminium busway and windings perform acceptably in many applications at meaningfully lower and less volatile cost. Buyer specifications frequently mandate copper out of habit rather than requirement, and challenging that during design review pays.

Portfolio Architecture for Margin Defence

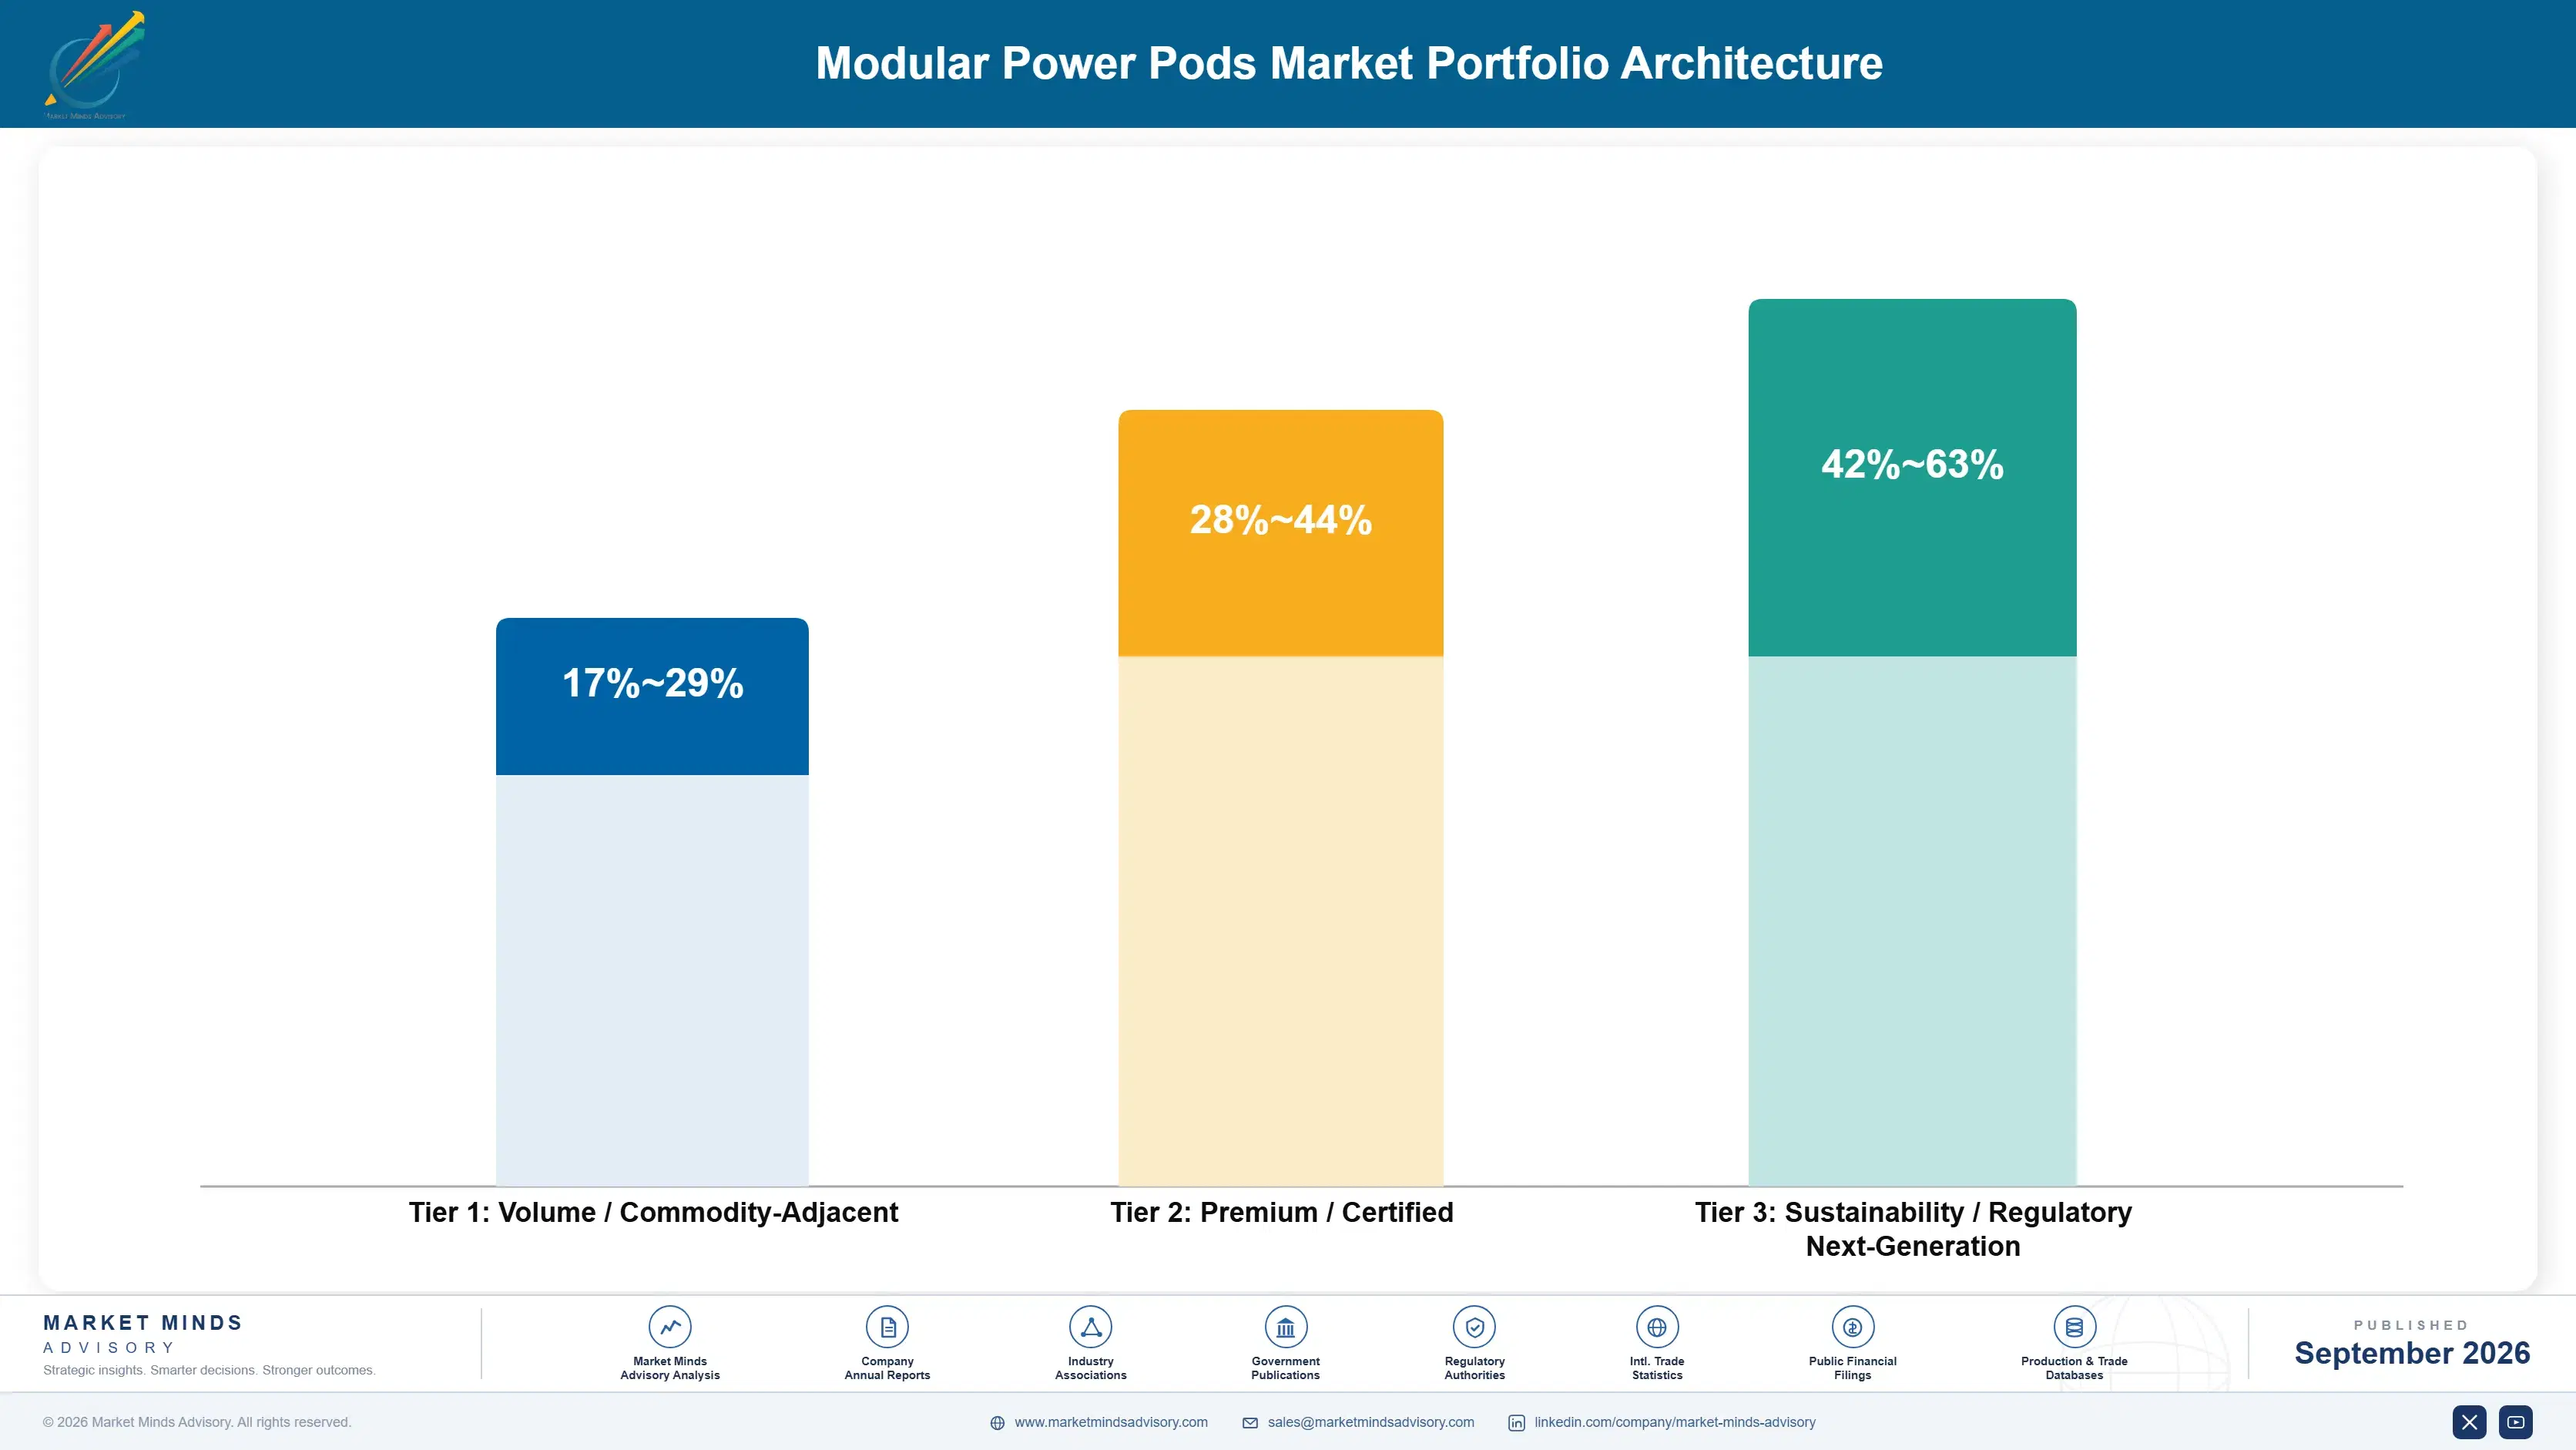
Margin architecture separates on integration content rather than on size. Prefabricated distribution skids sit closest to conventional electrical assembly and earn margins that reflect that proximity, since a buyer can readily compare them to a contractor's price. Pods carrying generation, storage or integrated cooling earn considerably more because no comparable site-built alternative exists and the buyer is purchasing an outcome rather than an assembly.
The tension runs between standardisation and configuration. Standard platforms cut the premium toward 12%, shorten lead times by roughly a third and concentrate component purchasing, all of which improve margin and win share. Bespoke engineering commands higher prices and consumes the repeatability that made factory assembly cheaper, so it frequently earns less after the engineering hours are properly allocated. Most manufacturers still price configuration as though it were free to supply.

High-value revenue concentrates in integrated generation and storage pods and in the service attached to installed units. Generation content answers interconnection queues, which is now the reason many projects buy at all, and it carries margin distribution scope never approached. Service on installed pods recurs for the asset life and depends on a field network that competitors would need years to build.

Volume / Commodity-Adjacent

Prefabricated distribution skids and standard electrical blocks that buyers can compare directly against a contractor's site price. The range separates suppliers with vertical component content from integrators buying on the open market. Competition here is genuinely on dollars per megawatt.
Gross Margin: 17-29%

Premium / Certified

Modular substations, cooling-integrated blocks and fully factory-tested assemblies sold against schedule and commissioning certainty. Margin depends heavily on platform standardisation and on factory test coverage. Utility and buyer acceptance of factory testing determines how much of the premium holds.
Gross Margin: 28-44%

Sustainability / Regulatory / Next-Generation

Integrated generation and storage pods answering interconnection queues, plus lifetime service on installed assets. The widest range in the portfolio, reflecting generation technology mix and emissions permitting complexity by jurisdiction. Highest margin and fastest growing simultaneously.
Gross Margin: 42-63%
modular-power-pods-market-portfolio-architecture-1788425250973

High-value Sub-segments and Strategic Watch-out

Integrated Generation and Storage

High value with the fastest growth at 18.0%, sold to buyers facing interconnection waits near 4.1 years who need to energise without the grid. The range reflects generation technology and emissions permitting by jurisdiction. It requires capability that pure electrical distribution suppliers must acquire or partner for.
Gross Margin: 44-63%

Installed Base Service Contracts

High value with moderate growth, recurring across the asset life and defended by a field service network competitors would need years to replicate. The range reflects response time commitments and site remoteness. It is the most predictable revenue anywhere in this market and the least discussed.
Gross Margin: 48-61%

Prefabricated Distribution Skids

The volume core, competing directly against site electrical contractors on dollars per megawatt and losing that comparison wherever schedule carries no price. The range separates vertically integrated manufacturers from open-market integrators. It funds factory utilisation that higher-margin blocks then benefit from. Volume matters here more than margin does.
Gross Margin: 16-28%

Bespoke Engineered Configurations

The strategic watch-out, priced as premium work and frequently unprofitable once engineering hours are properly allocated against it. Configurability destroys the repeatability that made factory assembly cheaper than site construction. Several manufacturers are only now measuring what these orders actually earn them. The measurement usually surprises them.
Gross Margin: 0-14%

How These Orders Repeat

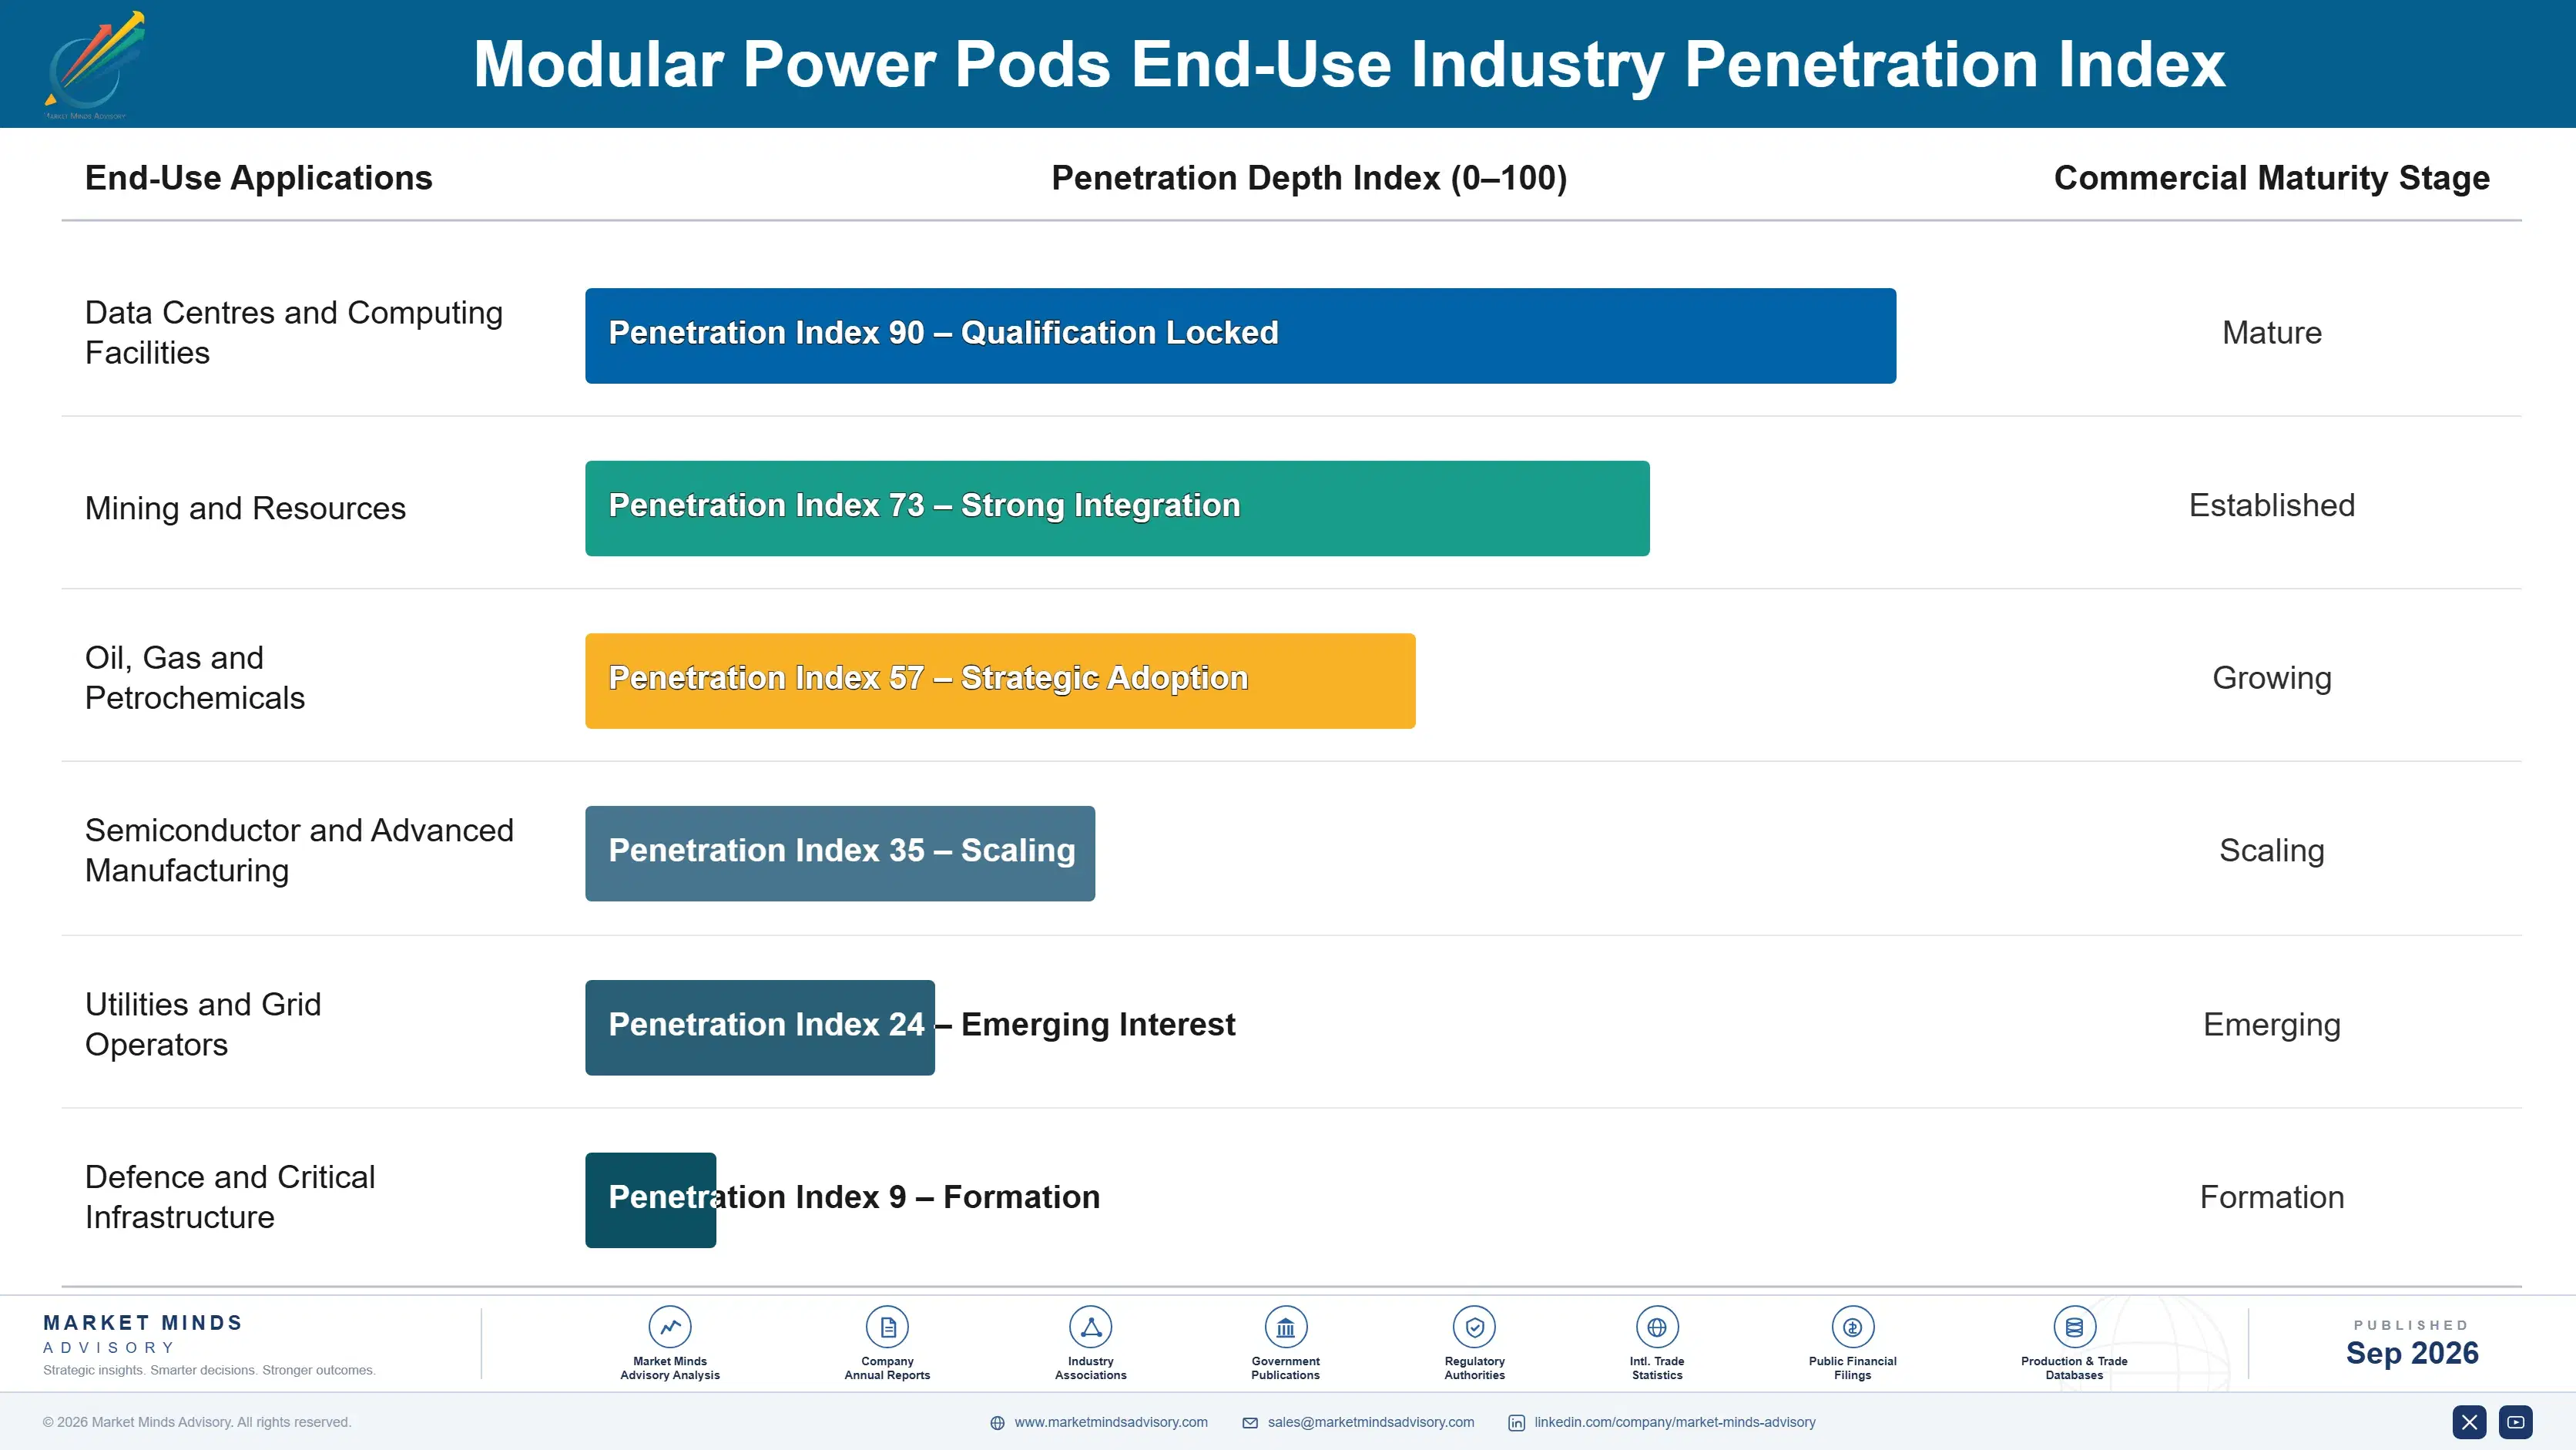
Recurrence works through building programmes rather than through individual projects. A data centre developer constructing a multi-phase campus buys the same pod configuration repeatedly across several years, which turns one design qualification into a standing order stream. Mining and industrial buyers repeat far less often, on capital cycles measured in years. Service on installed units recurs continuously for the asset life and represents the only genuinely predictable revenue here.
Adoption depth differs sharply by buyer type. Computing developers standardise on a configuration and then resist change because requalification consumes the schedule advantage they bought the pod for. Industrial buyers treat each project independently and compare against site construction every time. Utilities are the most conservative, since accepting a factory-tested substation requires changing witness testing practice that regulators and internal engineering standards both govern.

The buyer inside the organisation has shifted materially. Electrical scope was historically specified by engineering and bought by procurement against installed cost. It is now frequently decided by project delivery leadership against schedule risk, and increasingly by finance against energisation date. Manufacturers still selling to engineering on technical specification are addressing the person who no longer decides, which shows in their conversion rates.
modular-power-pods-market-end-use-penetration-index-1788425251474

Where These Blocks Earn

These are among the four positions where our research anticipates prominent divergence between winners and laggards over the coming forecast period. Each is grounded in the demand model, the regulatory perimeter, and the announced capacity pipeline.
01 / DELAY COST PRICING

Sell the energisation date, not dollars per megawatt

A pod costs roughly 19% more per megawatt and removes about 34 weeks from the site programme, yet only the first figure reaches most proposals that manufacturers submit to buyers. Buyers holding contracted capacity commitments can calculate what a quarter of delay costs, and that number typically exceeds the whole premium by a factor of 4 or more on any honest reading. Suppliers quoting price per megawatt invite a comparison against site construction that prefabrication genuinely loses, every single time.
02 / PLATFORM STANDARDISATION DISCIPLINE

Narrow the catalogue rather than broadening it

Configurability reads as a selling advantage and functions mostly as a manufacturing cost, because every bespoke block forfeits the repeatability that made factory assembly cheaper than site work in the first place. Standard platforms cut the premium from around 19% toward 12%, shorten lead times by roughly a third and concentrate component purchasing onto fewer part numbers when supply tightens. Buyers say they want flexibility and choose availability whenever both are actually priced in front of them at the same time.
03 / GENERATION CONTENT OWNERSHIP

Own generation capability, do not partner for it

Interconnection queues near 4.1 years are now the reason many projects across North America especially buy pods at all, and answering that requires generation or storage content inside the block rather than beside it as a separate supply. The segment grows at 18.0% and carries the widest margins in this market, so partnering supplies the capability while sharing exactly the margin that is worth having here. Distribution-focused manufacturers face a build or acquire decision that most of them have deferred so far.
04 / FACTORY TEST INVESTMENT

Build full-load test capacity before competitors specify it

Around 92% of commissioning now completes before shipment among leading suppliers, and buyers increasingly write that coverage into specifications rather than treating it as an offered extra they can decline. Full-load test benches are capital-intensive and represent the clearest differentiator available in a product whose internal components are largely identical across suppliers competing for the same projects. Test capability also cuts site rectification and warranty cost by roughly 30%, which funds the investment independently of any competitive argument for it.

Engagement Snapshot From the Field

A live engagement with an industry participant carrying material or product regulatory and market exposure ahead of a defining policy shift, showing how our research translates into a defensible multi-year portfolio strategy.
MARKET MINDS ADVISORY · CLIENT ENGAGEMENT SUMMARY
Modular Power Pods Producer Strategic Portfolio Review and Transition Roadmap 2026·Investment Scenario on Modular Power Pods Exposure Evaluation 2025-26
CLIENT PROFILE
A hyperscale data centre developer building a four-phase campus totalling approximately 320 MW of critical load (client-reported, unverified by MMA), with contracted capacity commitments carrying explicit revenue consequences for each quarter of delay. The electrical scope had been tendered conventionally to site contractors across the first phase, which had run 22 weeks late against programme.
STRATEGIC CHALLENGE
Moving the remaining three phases to factory-built power blocks carried a quoted premium of roughly USD 48 million against conventional site construction (client-reported, unverified by MMA). Procurement was evaluating the decision on installed cost per megawatt. Nobody had priced the delay exposure the first phase had already demonstrated, and interconnection was separately running four years behind the campus programme.
MMA APPROACH
MMA modelled the decision against contracted revenue timing rather than against installed cost, which is how the commitments were actually written. We analysed first-phase delay causes, interviewed 14 project delivery and finance staff, five manufacturers and the connecting utility. Options were scored on energisation date confidence and on interconnection independence rather than on capital cost.
KEY FINDINGS
  1. Each quarter of delay across the remaining phases carried a contracted revenue consequence of approximately USD 41 million, well above the entire quoted pod premium.
  2. First-phase delay originated almost entirely in site commissioning rather than in equipment delivery, which factory testing addresses directly and site construction does not.
  3. Interconnection was running roughly four years behind the campus programme, meaning phases two and three would complete with no grid capacity available to them.
  4. Standardising on a single pod platform across three phases cut the quoted premium by about 22% and shortened lead times materially through repeat manufacture.
CLIENT PROFILE
A hyperscale data centre developer building a four-phase campus totalling approximately 320 MW of critical load (client-reported, unverified by MMA), with contracted capacity commitments carrying explicit revenue consequences for each quarter of delay. The electrical scope had been tendered conventionally to site contractors across the first phase, which had run 22 weeks late against programme.
STRATEGIC CHALLENGE
Moving the remaining three phases to factory-built power blocks carried a quoted premium of roughly USD 48 million against conventional site construction (client-reported, unverified by MMA). Procurement was evaluating the decision on installed cost per megawatt. Nobody had priced the delay exposure the first phase had already demonstrated, and interconnection was separately running four years behind the campus programme.
MMA APPROACH
MMA modelled the decision against contracted revenue timing rather than against installed cost, which is how the commitments were actually written. We analysed first-phase delay causes, interviewed 14 project delivery and finance staff, five manufacturers and the connecting utility. Options were scored on energisation date confidence and on interconnection independence rather than on capital cost.
KEY FINDINGS
  1. Each quarter of delay across the remaining phases carried a contracted revenue consequence of approximately USD 41 million, well above the entire quoted pod premium.
  2. First-phase delay originated almost entirely in site commissioning rather than in equipment delivery, which factory testing addresses directly and site construction does not.
  3. Interconnection was running roughly four years behind the campus programme, meaning phases two and three would complete with no grid capacity available to them.
  4. Standardising on a single pod platform across three phases cut the quoted premium by about 22% and shortened lead times materially through repeat manufacture.
RECOMMENDED STRATEGY
Phase 1: Move phases two through four to a single standardised pod platform, accepting reduced configurability in exchange for repeat manufacturing economics. Phase 2: Specify integrated gas generation on phases two and three so both can energise and earn revenue before grid interconnection capacity finally becomes available. Phase 3: Rebuild the procurement evaluation around energisation date confidence and contracted revenue timing, rather than around installed electrical cost per megawatt.
OUTCOME
Phases two and three energised 29 and 34 weeks ahead of the conventional programme respectively (client-reported, unverified by MMA), with phase two operating on integrated generation for seven months before grid capacity arrived. The realised premium came in near USD 37 million against contracted revenue protection the client valued considerably higher.

Frequently Asked Questions

Foundational context covering the market sizes, CAGR, scope, country, region and competition that inform every finding below. This section is provided to cover basics and most often pre-purchase conversations, answered from the MMA Primary Research Dataset.

What is the current size of the Modular Power Pods Market?

The market was worth USD 12.4 billion in 2025 and reaches USD 13.9 billion in 2026. Factory-built blocks command roughly 19% more per megawatt than equivalent site electrical construction.

How large will the Modular Power Pods Market be by 2036?

MMA forecasts USD 43.2 billion by 2036, an expansion of 3.11 times over the forecast period. That represents USD 29.3 billion of incremental annual revenue measured against 2026.

What is the CAGR for the Modular Power Pods Market 2026 to 2036?

The base case is 12.0% compound annual growth, with a bull case at 13.3% and a bear case at 10.8%. Data centre construction cadence separates the scenarios most.

Which segment is growing fastest?

Integrated generation and storage pods grow at 18.0%, half again the market rate of 12.0%. Interconnection queues near 4.1 years push buyers toward energising without waiting for the grid.

Who are the major companies in the Modular Power Pods Market?

Schneider Electric, Vertiv, Eaton, ABB and Siemens Energy lead on measured pod and prefabricated system revenue. Together they hold roughly 41%, mostly large electrical equipment manufacturers.

Which country is growing fastest?

India grows fastest at 16.2%, on data centre construction around Mumbai, Chennai and Hyderabad alongside industrial capacity expansion. Schedule certainty rather than labour scarcity drives adoption there.

Report Segmentation Architecture

The full report scope spans multiple orthogonal segmentation dimensions, with cross-tabulated demand data provided for each dimension pair. Coverage extends further to regional breakdowns, trend trajectories, and the competitive detail needed to support segment-level decision-making.

By Primary Market Dimension

  • Prefabricated Electrical Distribution Skids
  • Containerised Power Generation Pods
  • Integrated Generation and Storage Pods
  • Modular Substation and Interconnection Pods
  • Cooling-Integrated Power Blocks
  • Mobile and Temporary Power Pods

By End-Use Industry

  • Data Centres and Computing Facilities
  • Mining and Resources
  • Oil, Gas and Petrochemicals
  • Semiconductor and Advanced Manufacturing
  • Utilities and Grid Operators
  • Defence and Critical Infrastructure

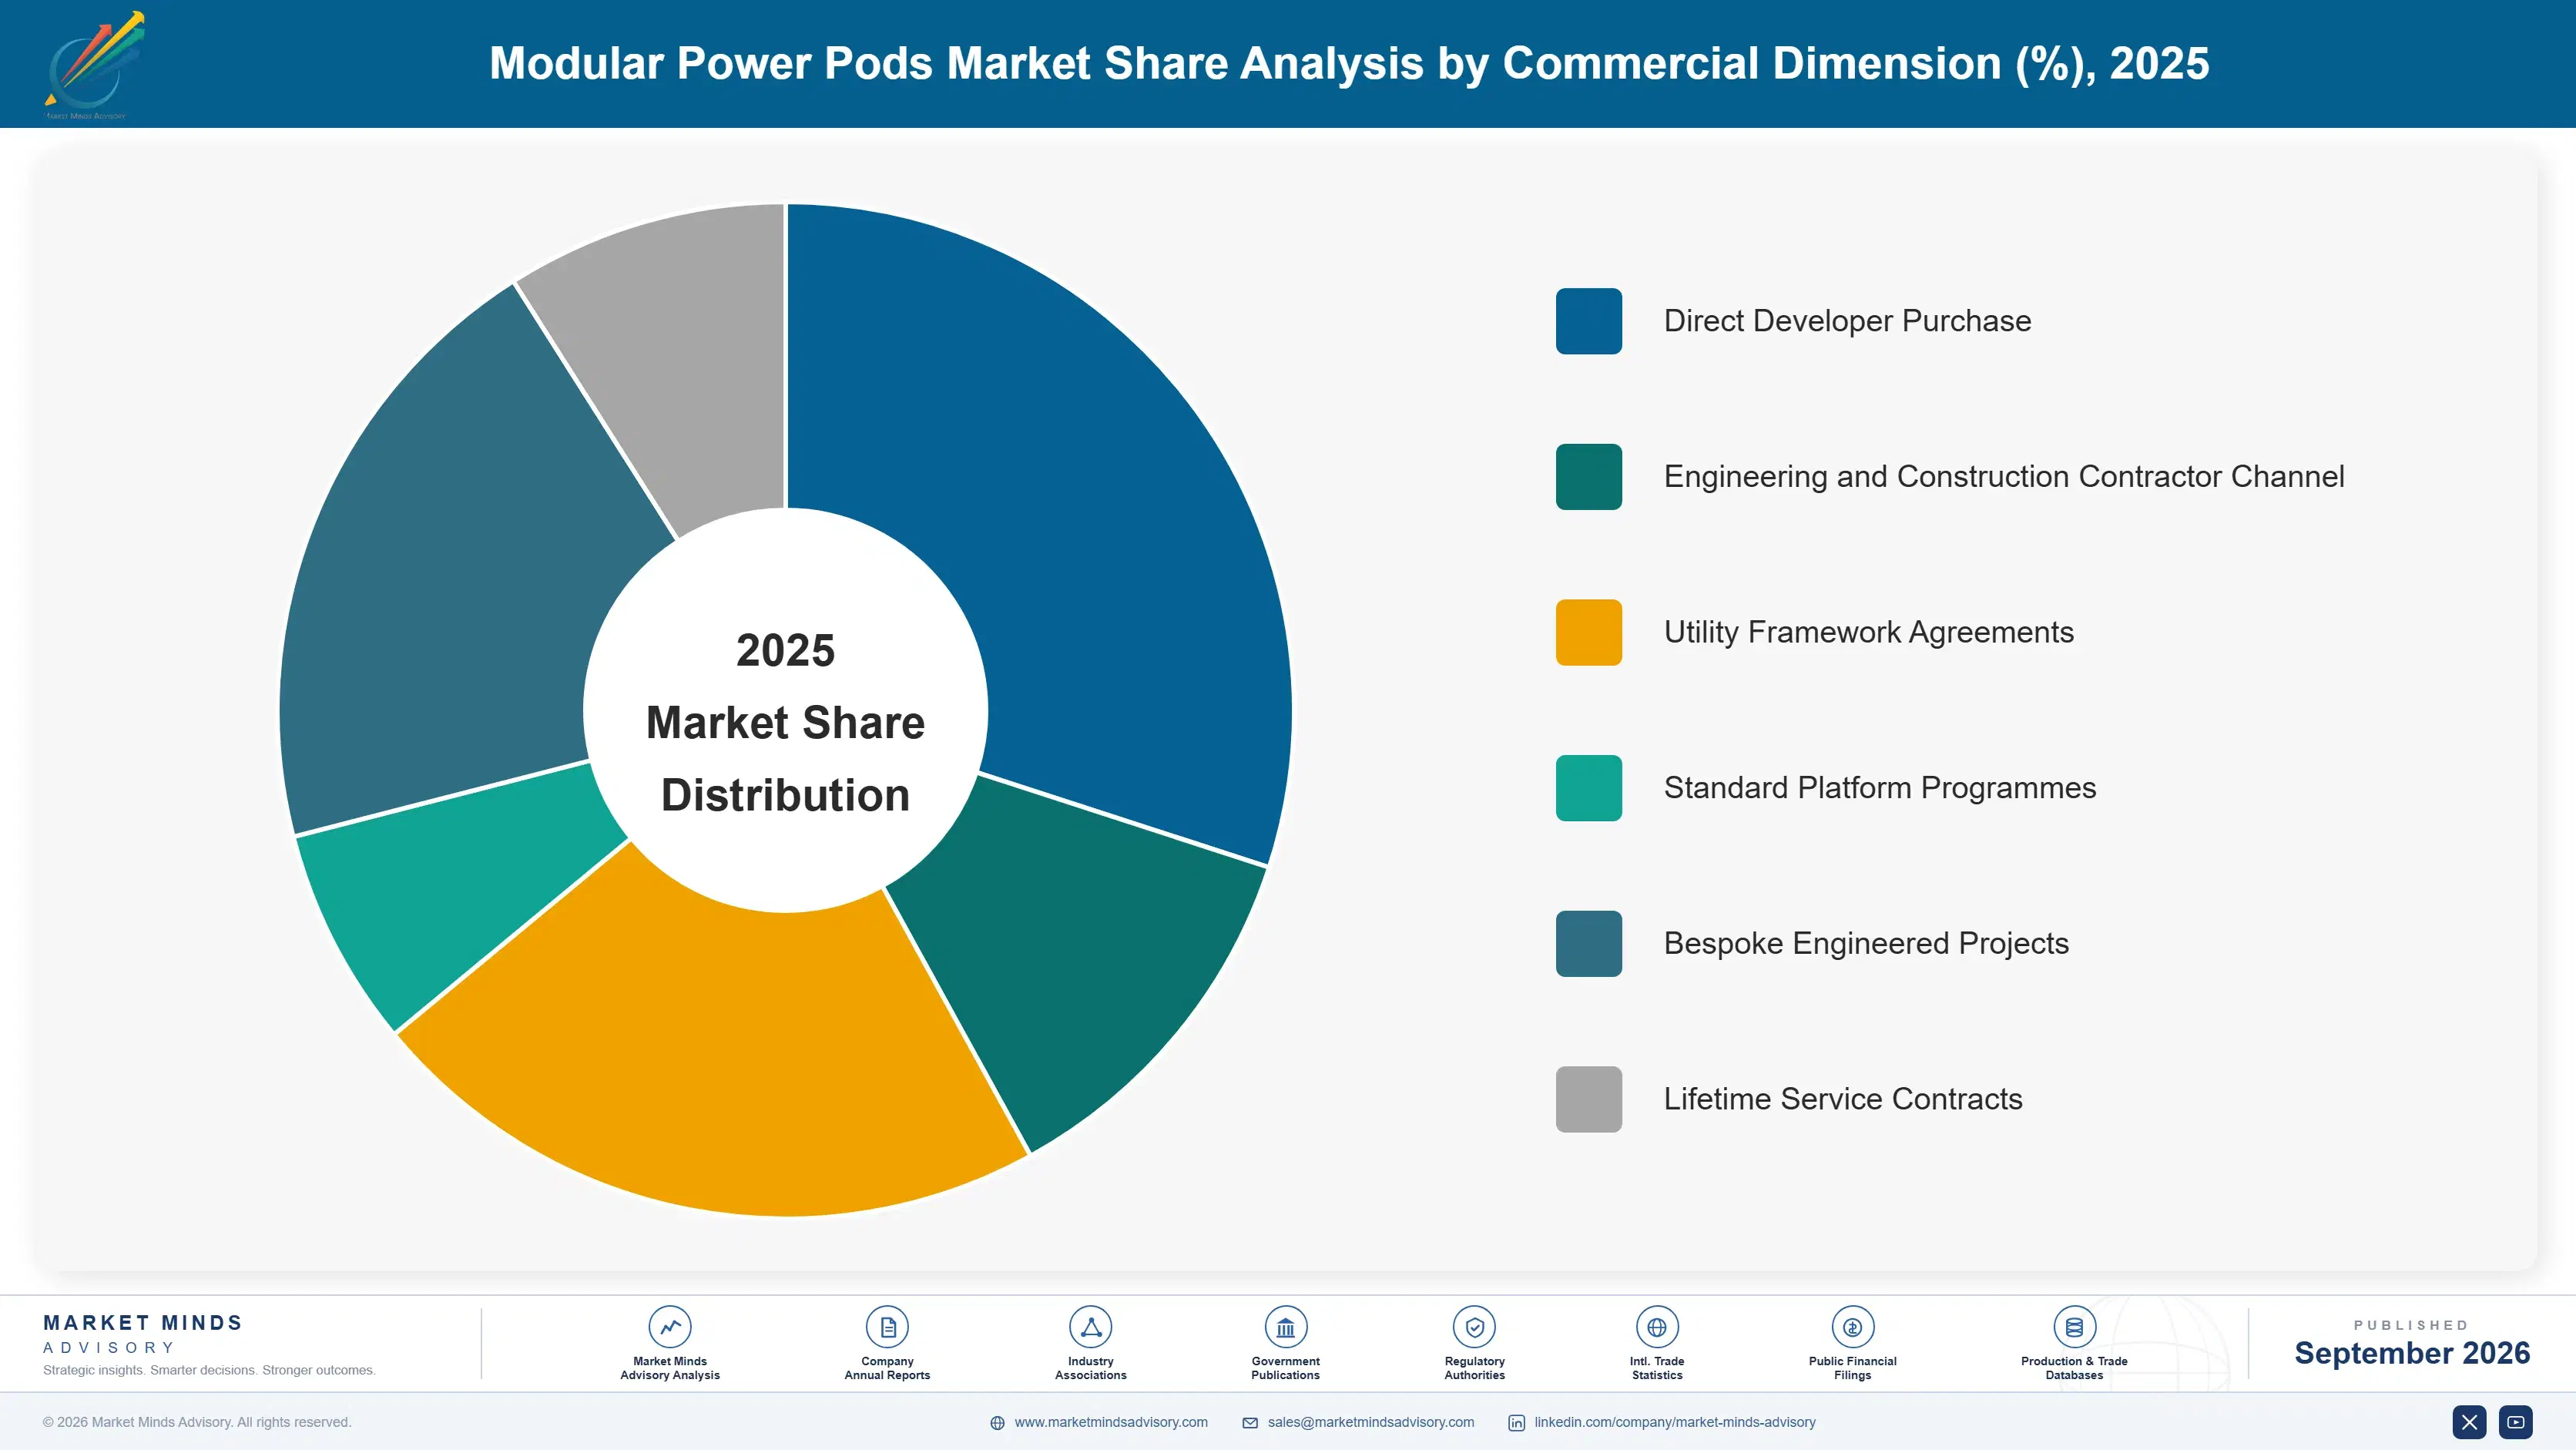
By Commercial Dimension

  • Direct Developer Purchase
  • Engineering and Construction Contractor Channel
  • Utility Framework Agreements
  • Standard Platform Programmes
  • Bespoke Engineered Projects
  • Lifetime Service Contracts

By Region

  • North America
  • East Asia
  • Western Europe
  • South Asia and Pacific
  • Middle East and Africa
  • Latin America
  • Eastern Europe

Scope, Methodology, and Coverage

Every figure in this report is reproducible from documented input assumptions. The scope below maps the historical period, the forecast horizon, the segmentation dimensions, and the countries covered, alongside the underlying primary and qualitative methodology.
Historical Period
2020 to 2025
Forecast Period
2026 to 2036
Base Year
2025 (USD billions; MMA Primary Research Dataset, September 2026)
Market Definition
This market covers factory-built and factory-tested electrical power assemblies delivered to site as complete functional units, spanning prefabricated electrical distribution skids, containerised power generation pods, integrated generation and storage pods, modular substation and interconnection pods, cooling-integrated power blocks, and mobile and temporary power pods. Revenue is measured as delivered pod and prefabricated power system value at manufacturer level, including factory integration, testing and attributable commissioning support. Site-erected switchgear and transformers, standalone generator sets sold without integration, grid transmission and distribution infrastructure, building construction, and standalone cooling equipment are excluded from scope.
Quantitative Units
USD billions, delivered pod and prefabricated power system revenue at manufacturer level
Segmentation Dimensions
Pod configuration, end-use industry, commercial channel, region
Regions Covered
North America, East Asia, Western Europe, South Asia and Pacific, Middle East and Africa, Latin America, Eastern Europe
Countries Covered
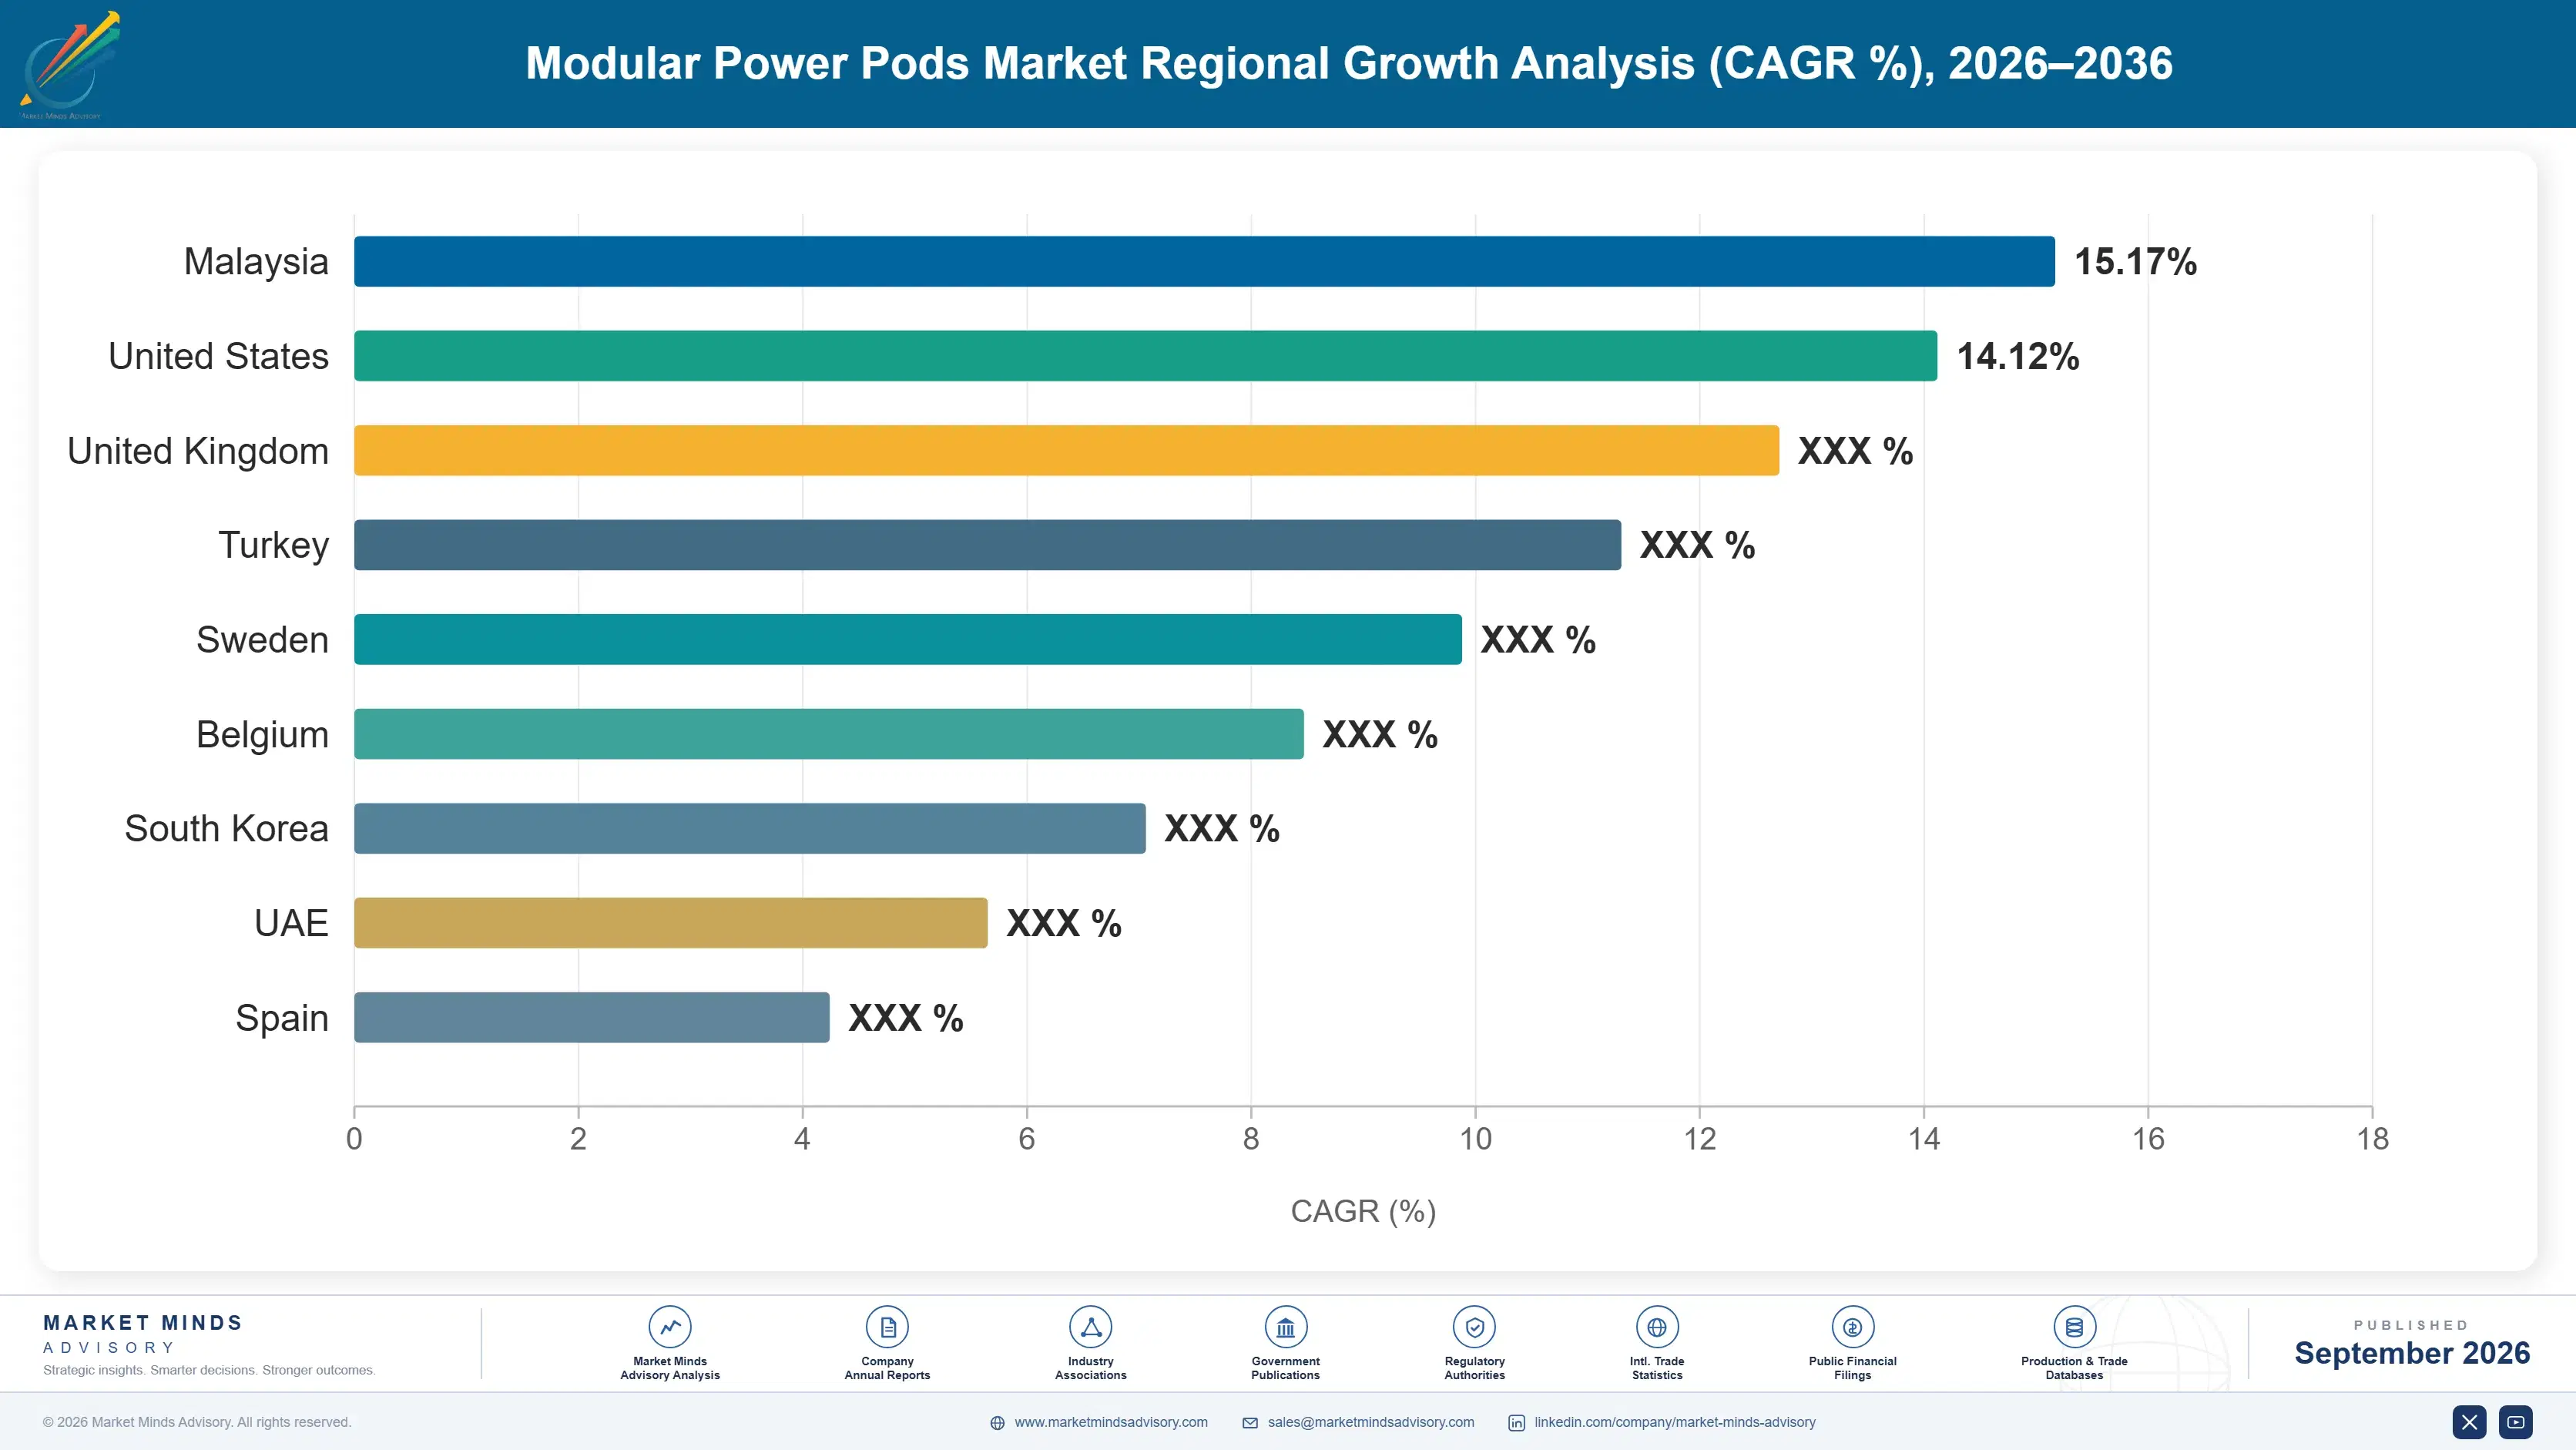
United States, Canada, Mexico, Brazil, Chile, Peru, United Kingdom, Germany, Netherlands, Ireland, France, Sweden, Norway, Poland, Czechia, Hungary, China, Japan, South Korea, Taiwan, Singapore, India, Australia, Indonesia, Malaysia, Saudi Arabia, United Arab Emirates, Qatar, South Africa
Key Companies Profiled
Schneider Electric, Vertiv, Eaton, ABB, Siemens Energy, Legrand, Hitachi Energy, Caterpillar, Cummins, Rolls-Royce Power Systems, Generac, Wartsila, Aggreko, Delta Electronics, Huawei Digital Power, Mitsubishi Electric, Toshiba, GE Vernova, Powell Industries, Anord Mardix
Quantitative Methodology
Primary survey, n=3,800 respondents, Q4 2025, six countries; demand-side model with trade association cross-validation
Qualitative Methodology
47 expert interviews, Q4 2025; applied to validate demand model assumptions, identify emerging dynamics, and assess competitive positioning
Report Format
PDF and XLSX data workbook (Word format preview document)
Publisher
Market Minds Advisory
Report Code
MMA-2026-ENE-601
Published
September 2026
Contact
sales@marketmindsadvisory.com | www.marketmindsadvisory.com

Purchase the full Modular Power Pods Market Report (2026 to 2036).

The full MMA report treats modular power pods as a schedule product rather than an equipment category, and sets out the arithmetic that decides when the cost premium is worth paying. It sizes the market to 2036 across six pod configurations, seven regions and 29 countries, with segment growth rates and regional demand mechanisms detailed throughout. Competitive analysis covers 20 manufacturers assessed on measured pod and prefabricated system revenue, with moat and risk assessment for the two leaders. The report quantifies component cost structure, transformer lead time exposure and margin architecture across three portfolio tiers. It closes with four strategic verdicts and an anonymised hyperscale developer engagement.
Six pod configurations sized through 2036
Seven regions with demand mechanism analysis
Twenty manufacturers on consistent revenue basis
Schedule, premium and interconnection wait benchmarks
Margin architecture across three portfolio tiers
Anonymised hyperscale electrical delivery strategy engagement

Built For The People Who Decide

From boardroom strategy to bench-side execution, this report is read cover-to-cover by leaders shaping the next decade of their industry, turning demand scenarios, market dynamics and valuation benchmarks into decisions.
CXOs/ Presidents/ VPs/ Managers
M&A and Corporate Development
Strategy Teams and R&D Heads
Procurement and Product Directors
Regulatory and Compliance Leaders
Investor Relations and Equity Analysts