Market Minds Advisory
Modular Construction Market

Modular Construction Market: Modular Construction: Labor Shortage Did What Cost Argument Never Could

A commercial reading of offsite modular construction, where skilled trade shortage drives adoption more than cost savings ever did, and government mandates are forcing volumetric methods into projects that would never have chosen them voluntarily.

Lead Analyst

David Horsley

Published

August 2026

Make Smarter Decisions with Customized Research Insights

Request a free sample report and evaluate market opportunities, growth trends, and competitive dynamics relevant to your business needs.

2025 MARKET VALUE$94.5BMarket Size 2025
2036 FORECAST VALUE$259.0BBase Case , 2026 to 2036
CAGR 2026 TO 20369.6 %Bull 10.9% / Bear 8.3%
INCREMENTAL OPPORTUNITY$155.5BNet 10- year value creation
EXPANSION MULTIPLE2.50x2036 value over 2026 base
Strategic Levers
M&A Pipeline
Regional Outlook
Country Rankings
Competitive Intelligence
Segmental Deep-dive
Call-Us : 91 93563 13602

Executive Snapshot and Market Trajectory.

Skilled trade labor shortage now drives modular adoption more than the cost argument ever did. Developers who once dismissed offsite construction as a cost play are specifying it because they simply cannot staff a traditional site fast enough to hit delivery deadlines.
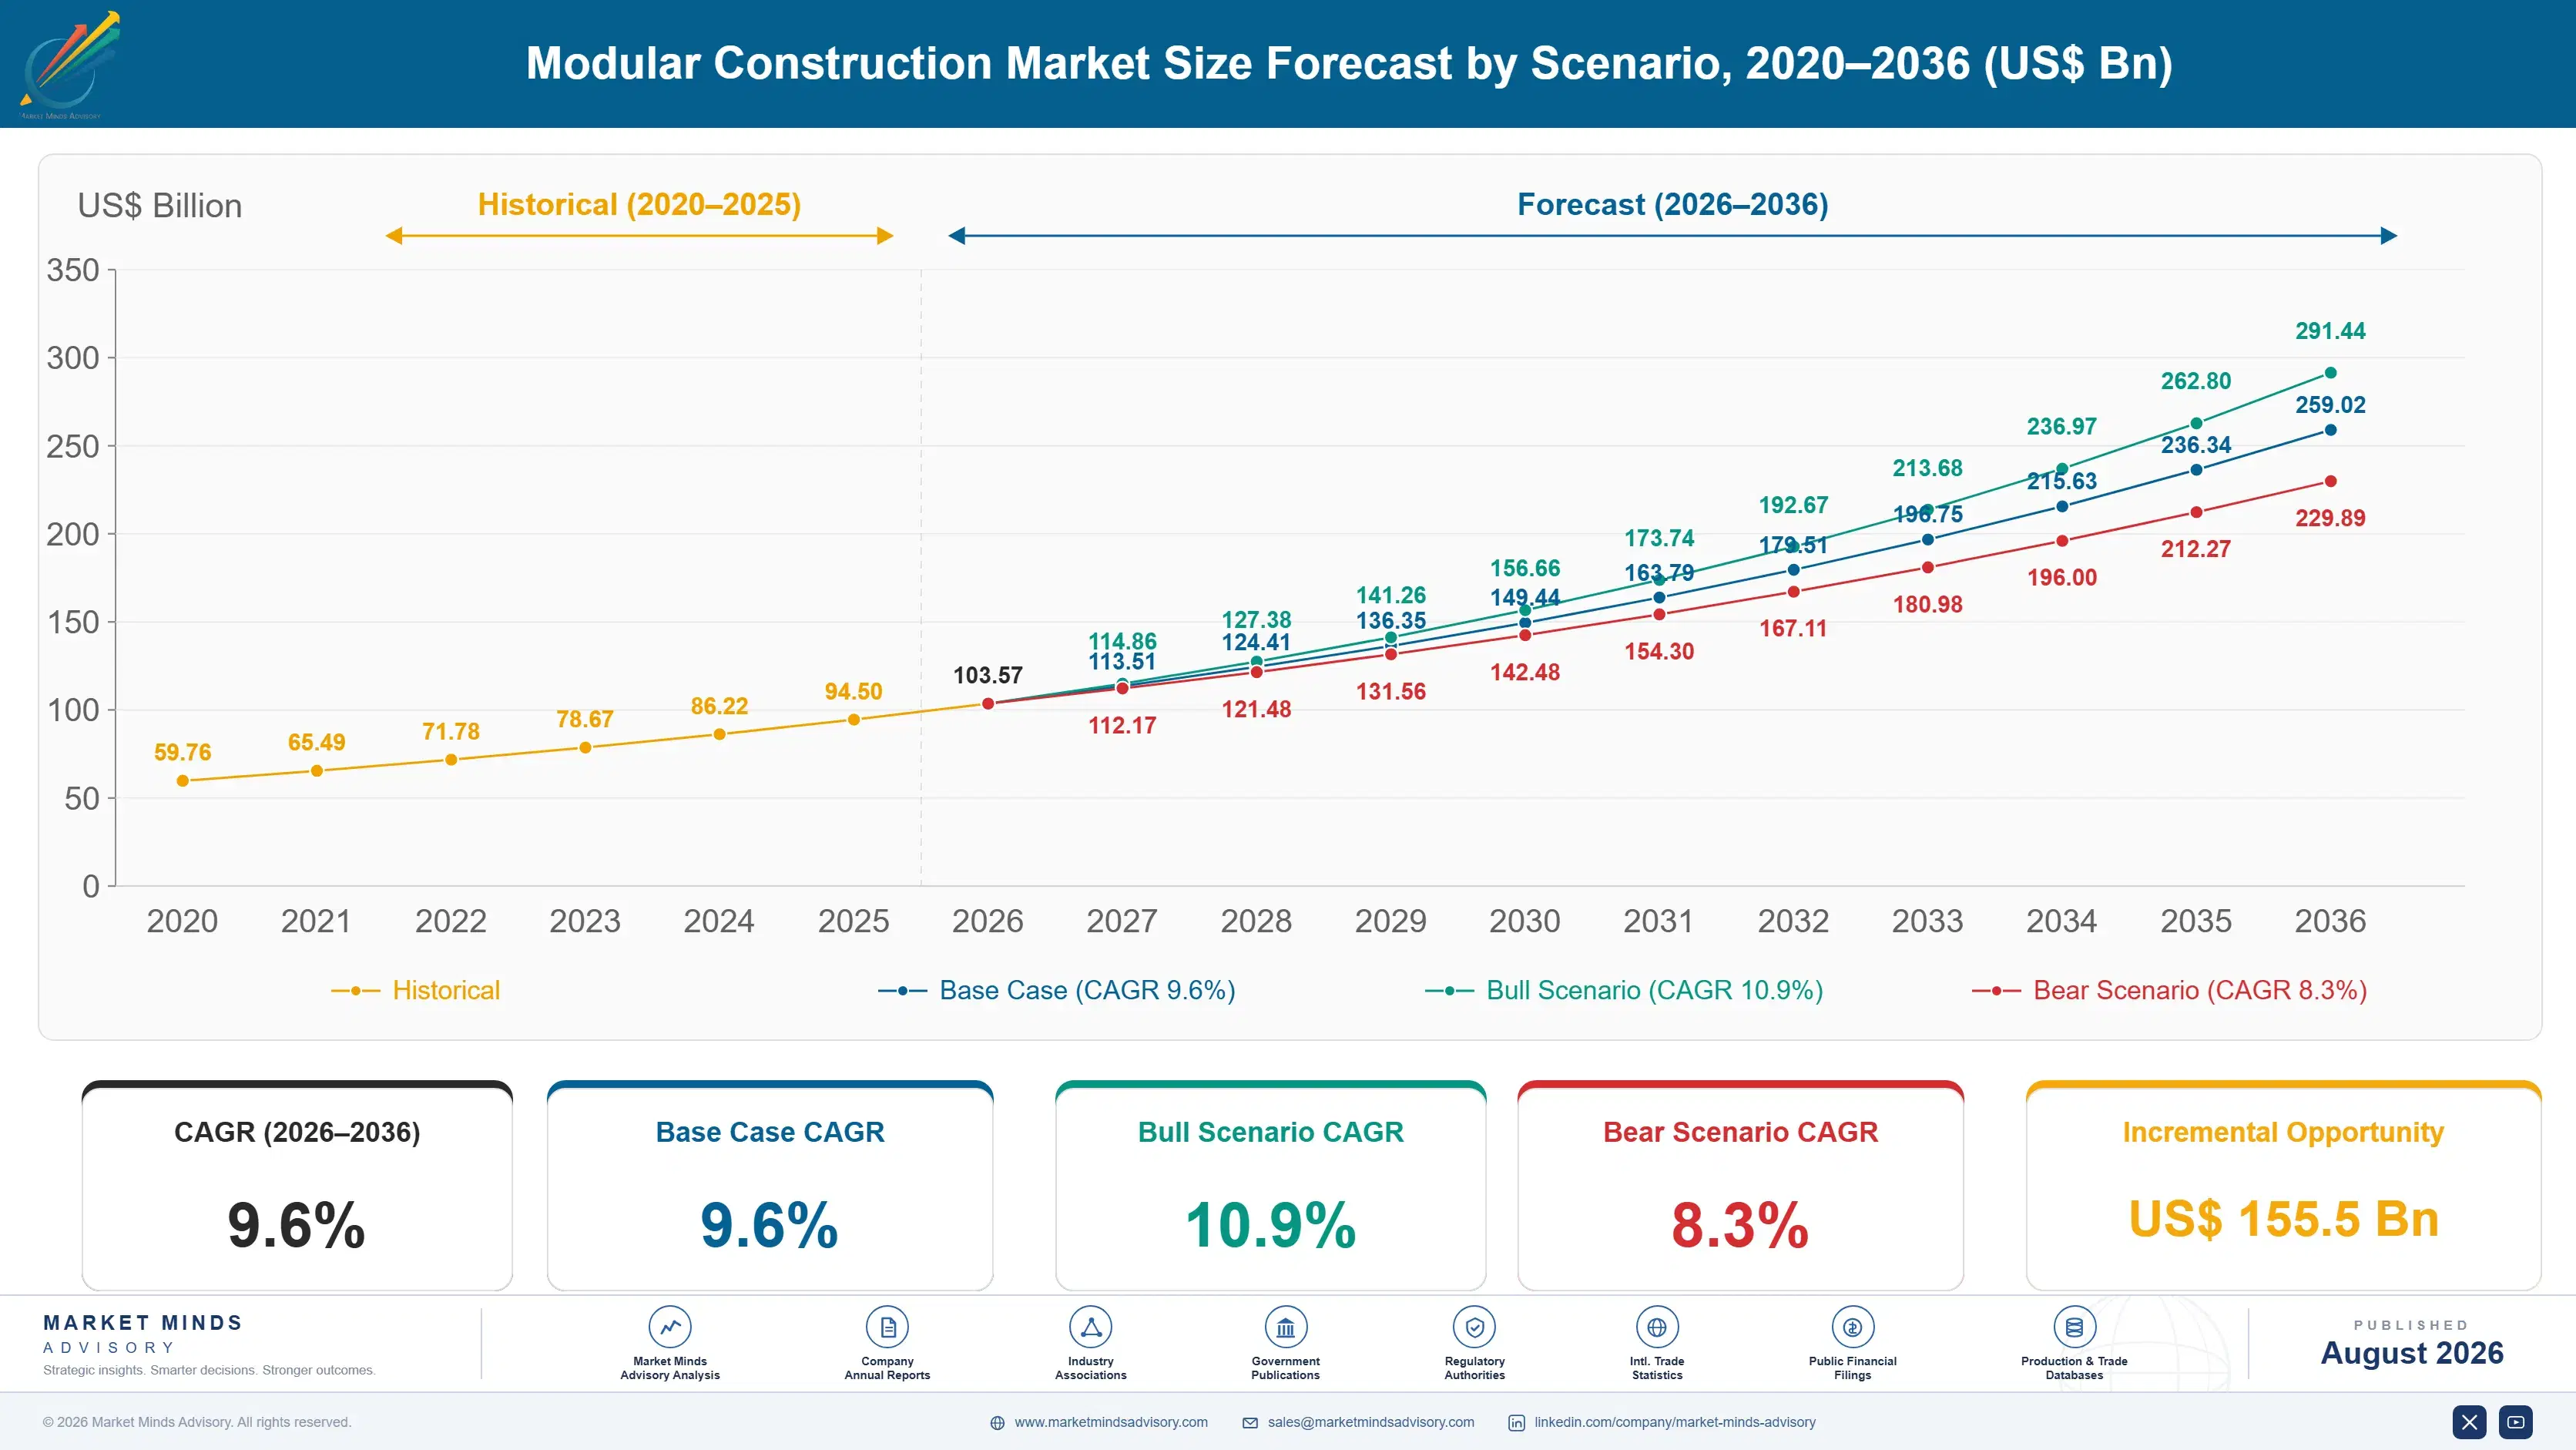
The market stands at USD 94.5 billion in 2025 and reaches USD 259.03 billion by 2036 at a 9.6% CAGR. Permanent volumetric modular construction grows fastest at 13.8%, about 1.44 times the overall rate, as multifamily and hospitality developers standardise on factory-built rooms rather than site-built alternatives. East Asia holds the largest share at 27% on Japanese and Chinese manufacturing scale, while Singapore posts the quickest national growth at 15.2% under a government mandate.
Concentration sits at a fragmented CR5 of 34%, reflecting an industry still built around strong regional manufacturers rather than full global consolidation just yet. Two forces now reshape the field considerably. Government mandates in select markets are forcing volumetric methods into projects that would never have chosen them voluntarily, and factory capacity, not design creativity, increasingly decides which developers can actually deliver on modular promises made at the pitch stage.
Market Definition
The modular construction market covers factory-manufactured building components and complete volumetric units assembled offsite and transported for on-site installation, including permanent volumetric modular buildings, relocatable modular buildings, panelized construction systems, modular MEP and utility pod systems, and hybrid podium construction. Traditional site-built construction, prefabricated components sold as standalone building materials without assembly, and 3D-printed construction are excluded.
Base Year Value
$94.5B in 2025 (MMA Primary Research Dataset, August 2026)
Forecast Period
2026 to 2036, eleven discrete annual values
CAGR
9.6% base case. Bull 10.9%. Bear 8.3%.
Fastest Growth Segment
Permanent Volumetric Modular Construction: 13.8% CAGR
Fastest Growth Country
Singapore: 15.2% CAGR
Fastest Growth Region
South Asia and Pacific: 11.8% CAGR
Largest Region
East Asia: 27% of 2025 global value
Market Leaders
WillScot Mobile Mini, Algeco, Skanska, Bouygues Construction, Laing O'Rourke. Source: MMA Analysis based on company annual reports.
Primary Survey
n=3,800 procurement and R&D decision-makers, Q4 2025, six countries
Methodology
Demand-side build-up, cross-validated against public data, 47 expert interviews

Modular Construction Market Forecast Scenarios

modular-construction-market-size-forecast-scenario-1787324378837
Growth from 2020 to 2025 compounded near 8.2%, accelerating through pandemic-era labor disruption that pushed developers toward factory-controlled production even before cost or schedule advantages were fully proven at the time. Skilled trade shortages that emerged during that period never fully resolved, sustaining elevated adoption well past the disruption that originally triggered it across most affected markets.
Three mechanisms carry the base case to 9.6%. First, skilled trade labor scarcity: site-based construction increasingly cannot staff projects fast enough, while factory production requires fewer specialised trades per unit delivered overall across most project types. Second, government mandates, as select markets require volumetric methods on public and affordable housing projects specifically. Third, hospitality and healthcare standardisation, where repeatable room designs suit factory production far better than one-off site building ever could achieve.
The bull case at 10.9% assumes labor shortages persist across major construction markets and government mandates expand into additional jurisdictions and project types. The bear case at 8.3% assumes construction labor markets loosen meaningfully as immigration and training policy responses take effect, and that factory capacity constraints limit how much additional volume the industry can actually absorb regardless of underlying demand.

Why Factory Capacity Now Gates Delivery Promises

Three forces set demand. Labor scarcity provides the base, since site-based construction increasingly cannot staff projects fast enough while factory production needs fewer specialised trades per delivered unit. Schedule pressure provides a second layer, as developers facing financing timelines and market windows value the 20% to 50% compression modular methods typically deliver. Government mandate provides the third, pushing volumetric methods into public and affordable housing projects that wo
MARKET CONCENTRATIONCR5: 34%Fragmented among strong regional manufacturers rather than global leaders
SCHEDULE COMPRESSION VERSUS SITE-BUILD20 to 50%Typical construction timeline reduction achieved through factory methods
FACTORY UTILISATION RATEAbout 68%Average capacity utilisation across established modular manufacturing plants
TRANSPORTATION COST SHARE8 to 15%Module transport and crane installation cost within total project cost
TOP PRODUCING COUNTRY SHAREChina: about 21%Global modular manufacturing output concentrated in one country
TYPICAL FACTORY PAYBACK PERIOD4 to 7 yearsTime required to recover capital invested in a new facility
The commercial character is decided by factory capacity rather than by design capability. A developer can specify an ambitious modular programme, but delivery depends entirely on securing production slots at a qualified factory, and capacity constraints now determine project timelines more than architectural complexity does. That is why manufacturers with proven delivery track records command premium pricing that design-only modular consultancies cannot capture.
The next decade turns on two things. Whether factory capacity expands fast enough to meet demand that labor scarcity and government mandates are both pulling forward simultaneously. And whether quality and durability perceptions, still lagging site-built construction in some markets, continue improving as completed modular buildings accumulate a longer operating track record.
"Everyone still pitches modular on cost savings. Cost savings rarely show up reliably. What shows up reliably is that you can staff a factory with forty people doing repeatable work when you cannot find forty skilled tradespeople willing to show up to a site for eighteen months."
Director, Construction Technology Practice · MMA Construction and Industrial Equ

Market Trends

Government Mandates Force Volumetric Adoption Into New Markets

Singapore's Building and Construction Authority requires Prefabricated Prefinished Volumetric Construction on a substantial share of eligible projects, driving adoption rates that voluntary market forces alone would never have achieved at comparable speed. Similar mandate mechanisms are emerging in the United Kingdom and continental Europe, tied to affordable housing delivery targets that governments have concluded traditional construction cannot meet on schedule. This regulatory push guarantees demand volume that manufacturers can plan capacity investment around with more confidence than market-driven adoption alone would provide. Developers in mandate jurisdictions increasingly treat modular capability as a bidding requirement rather than an optional differentiator.
Market Impact: Labor scarcity adds 3.2 points
Factory Capacity Becomes The Binding Delivery Constraint

Qualified modular factory capacity has not expanded as fast as developer demand, and average utilisation across established plants now runs near 68%, with the strongest manufacturers running considerably higher and newer entrants struggling to fill capacity while building a solid track record. Developers increasingly book factory production slots years ahead of site mobilisation, treating capacity reservation as seriously as land acquisition itself in most major markets today. This has shifted competitive advantage toward manufacturers with proven delivery history and existing capacity over newer entrants offering lower prices but unproven execution.
Market Impact: Hospitality modular demand grows 11

Market Opportunities and Growth Drivers

Skilled Trade Labor Scarcity Makes Factory Production Necessary

Construction labor markets across North America, Western Europe, and East Asia face persistent skilled trade shortages that site-based construction cannot solve through wage increases alone, since the pipeline of new tradespeople has not kept pace with retiring workers or project demand. Factory production requires meaningfully fewer specialised trades per delivered unit than equivalent site-built construction, since repeatable processes substitute capital for distributed skilled labor. This dynamic has pulled developers who previously dismissed modular construction as a cost play toward adopting it as a genuine delivery necessity, particularly on large multifamily programmes requiring hundreds of similar units within a compressed schedule.
Market Impact: Factory payback spans 7 years

Hospitality And Healthcare Standardisation Suits Factory Production

Hotel rooms, student housing units, and healthcare patient rooms follow repeatable design templates that suit factory production far better than one-off site building ever could, since the same module design ships repeatedly across a project rather than requiring bespoke construction for each unit. Major hospitality brands increasingly specify modular construction for new-build programmes explicitly to compress delivery timelines and achieve consistent quality across properties in different markets simultaneously. Healthcare systems facing urgent capacity needs, particularly following pandemic-driven demand spikes, have adopted modular patient rooms and clinical space at a pace traditional construction procurement could never match on comparable timelines.
Market Impact: Perception gap costs up to 8%

Market Restraints and Challenges

Factory Capacity Constraints Limit How Fast Demand Can Convert

Building new modular manufacturing capacity requires significant capital and a payback period of four to seven years, which makes manufacturers cautious about expanding ahead of confirmed demand even as developer interest grows considerably. The root cause is that modular factories require specialised equipment and trained staff that cannot be assembled as quickly as a traditional construction crew, and a factory built for the wrong module type cannot easily pivot. Commercially this means demand growth regularly outpaces available capacity, extending project queues. Manufacturers respond with phased expansion tied to confirmed multi-year order books.
Market Impact: Mandate demand adds 2.4 points

Quality Perception Still Lags Site-Built Construction In Some Markets

Despite improving performance data, modular construction still carries a quality perception gap in markets where early manufactured housing programmes established a lasting negative association current volumetric methods have not fully overcome. The root cause is that perception changes slowly relative to actual quality improvement, and buyers and lenders often apply outdated assumptions to current-generation modular products built to standards comparable with site-built construction. Commercially this depresses achievable pricing and slows residential adoption specifically, even where commercial buyers have moved past the issue. Manufacturers respond with extended warranties, certification, and transparent performance data sharing.
Market Impact: Factory utilisation averages 68%
3 additional market trends, 4 additional growth drivers, and 3 additional restraints and challenges are covered in the full report. Contact sales@marketmindsadvisory.com to access the complete intelligence.

Segment CAGR and Growth Architecture

Segmentation follows construction method and technology type, a single classification logic describing how much of the building is factory-assembled before final site delivery and assembly. End-use building type and procurement model sit separately within the framework, since the same volumetric method serves residential, hospitality, and healthcare projects through different commercial channels and specification standards.
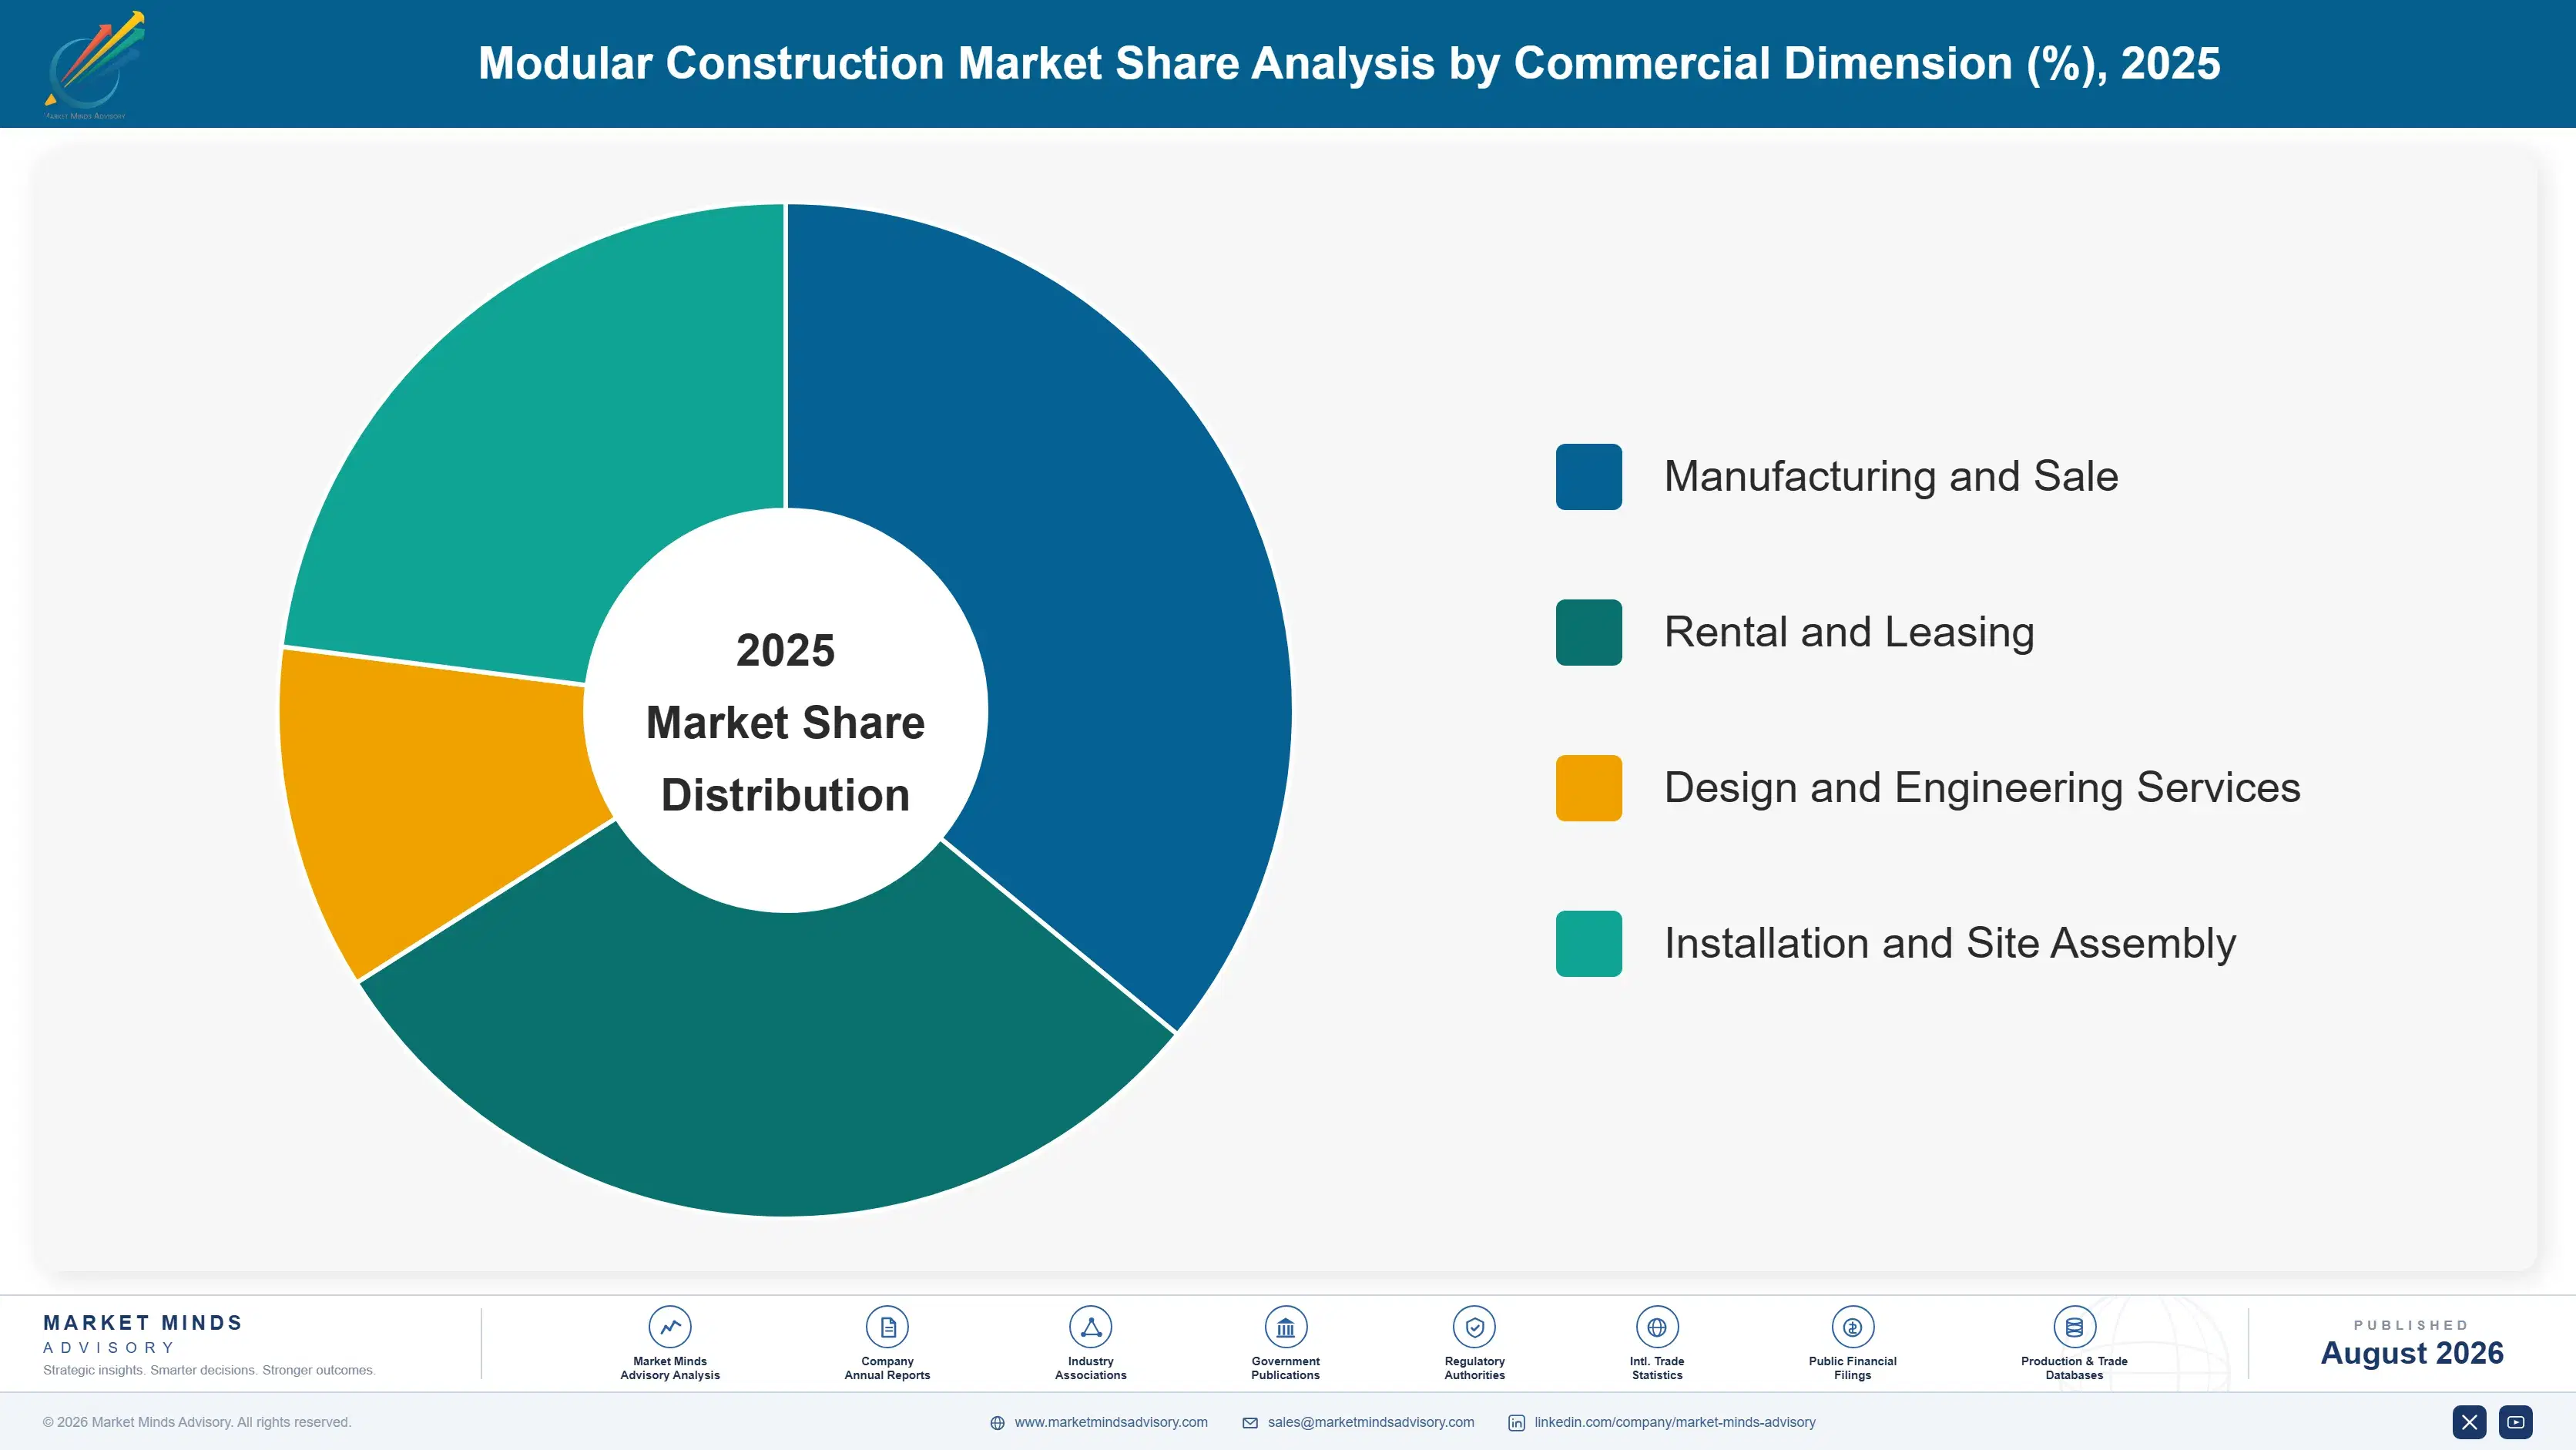
modular-construction-market-market-share-analysis-1787324379413

Permanent Volumetric Modular Construction

Permanent volumetric modular construction grows fastest at 13.8%, about 1.44 times the overall 9.6% rate, covering fully finished three-dimensional room modules manufactured offsite and stacked on site to form completed buildings. Multifamily, hospitality, and healthcare developers increasingly standardise on this method over panelized or site-built alternatives because factory-finished interiors reduce site labor requirements dramatically compared with any other construction approach available today. Adoption concentrates in markets facing both labor scarcity and government mandate pressure simultaneously, particularly the United Kingdom, Singapore, and select United States metro markets with acute housing delivery targets. Skanska, Laing O'Rourke, and Z Modular hold strong positions, having invested early in dedicated volumetric manufacturing capacity ahead of broader market demand materialising at comparable scale.
CAGR 13.8%

Modular MEP and Utility Pod Systems

Modular MEP and utility pod systems grow at 11.6%, the second-fastest category, as bathroom pods, mechanical rooms, and prefabricated utility risers increasingly get factory-built even on otherwise traditionally constructed projects. This hybrid adoption path lets developers capture labor efficiency and schedule compression on the most trade-intensive building components without committing to full volumetric construction across an entire project. Specialist manufacturers focused exclusively on MEP pods have built deep technical expertise that general contractors attempting in-house prefabrication struggle to match on quality and delivery consistency. Growth here tracks broader construction activity more closely than fully volumetric methods do, since utility pods integrate into both modular and traditional building envelopes with comparable ease across most project types.
CAGR 11.6%
Full segment breakdown across 6 segments available in the complete report.

Regional Architecture and Country Demand Map

Manufacturing maturity and government policy together set this overall distribution more than raw construction volume alone ever really could. East Asia leads decisively on Japanese and Chinese manufacturing scale, while the fastest growth sits in South Asia and Pacific under Singapore's volumetric construction mandate specifically.

North America

Labor scarcity, more than any policy mandate, drives this 26% share. United States multifamily and hospitality developers are adopting volumetric and panelized methods to compress schedules amid persistent skilled trade shortages that show no sign of resolving through wage increases alone. Canadian markets follow a similar pattern, with British Columbia and Ontario running some of the continent's more mature modular manufacturing capacity. Affordable housing programmes at state and municipal levels increasingly favour or require modular methods to meet delivery timelines that traditional procurement cannot match. Growth of 9.8% reflects labor-driven adoption across multifamily, hospitality, and public housing programmes simultaneously. Factory capacity, not developer appetite, increasingly caps how fast this region's growth can actually materialise on the ground.
Share: 26% | CAGR: 9.8% (2026 to 2036)

Western Europe

Mature manufacturing capability and emerging mandate policy together define this 24% share. Swedish and German modular manufacturers operate some of the most sophisticated volumetric production in the world, built over decades rather than emerging recently in response to labor pressure. United Kingdom housing policy increasingly favours modular methods for affordable housing delivery, tied explicitly to national housing targets that traditional construction has consistently missed. French and Dutch markets are earlier stage but growing steadily on similar labor and schedule pressures. Growth of 8.1% is the slowest of the seven, reflecting an already mature manufacturing base growing from a larger installed capacity than newer-entrant regions carry. Policy support increasingly supplements what labor scarcity alone was already driving here.
Share: 24% | CAGR: 8.1% (2026 to 2036)
Regional intelligence for 5 additional markets available in the complete report: East Asia, South Asia and Pacific, Latin America, Middle East and Africa, Eastern Europe. Contact sales@marketmindsadvisory.com.
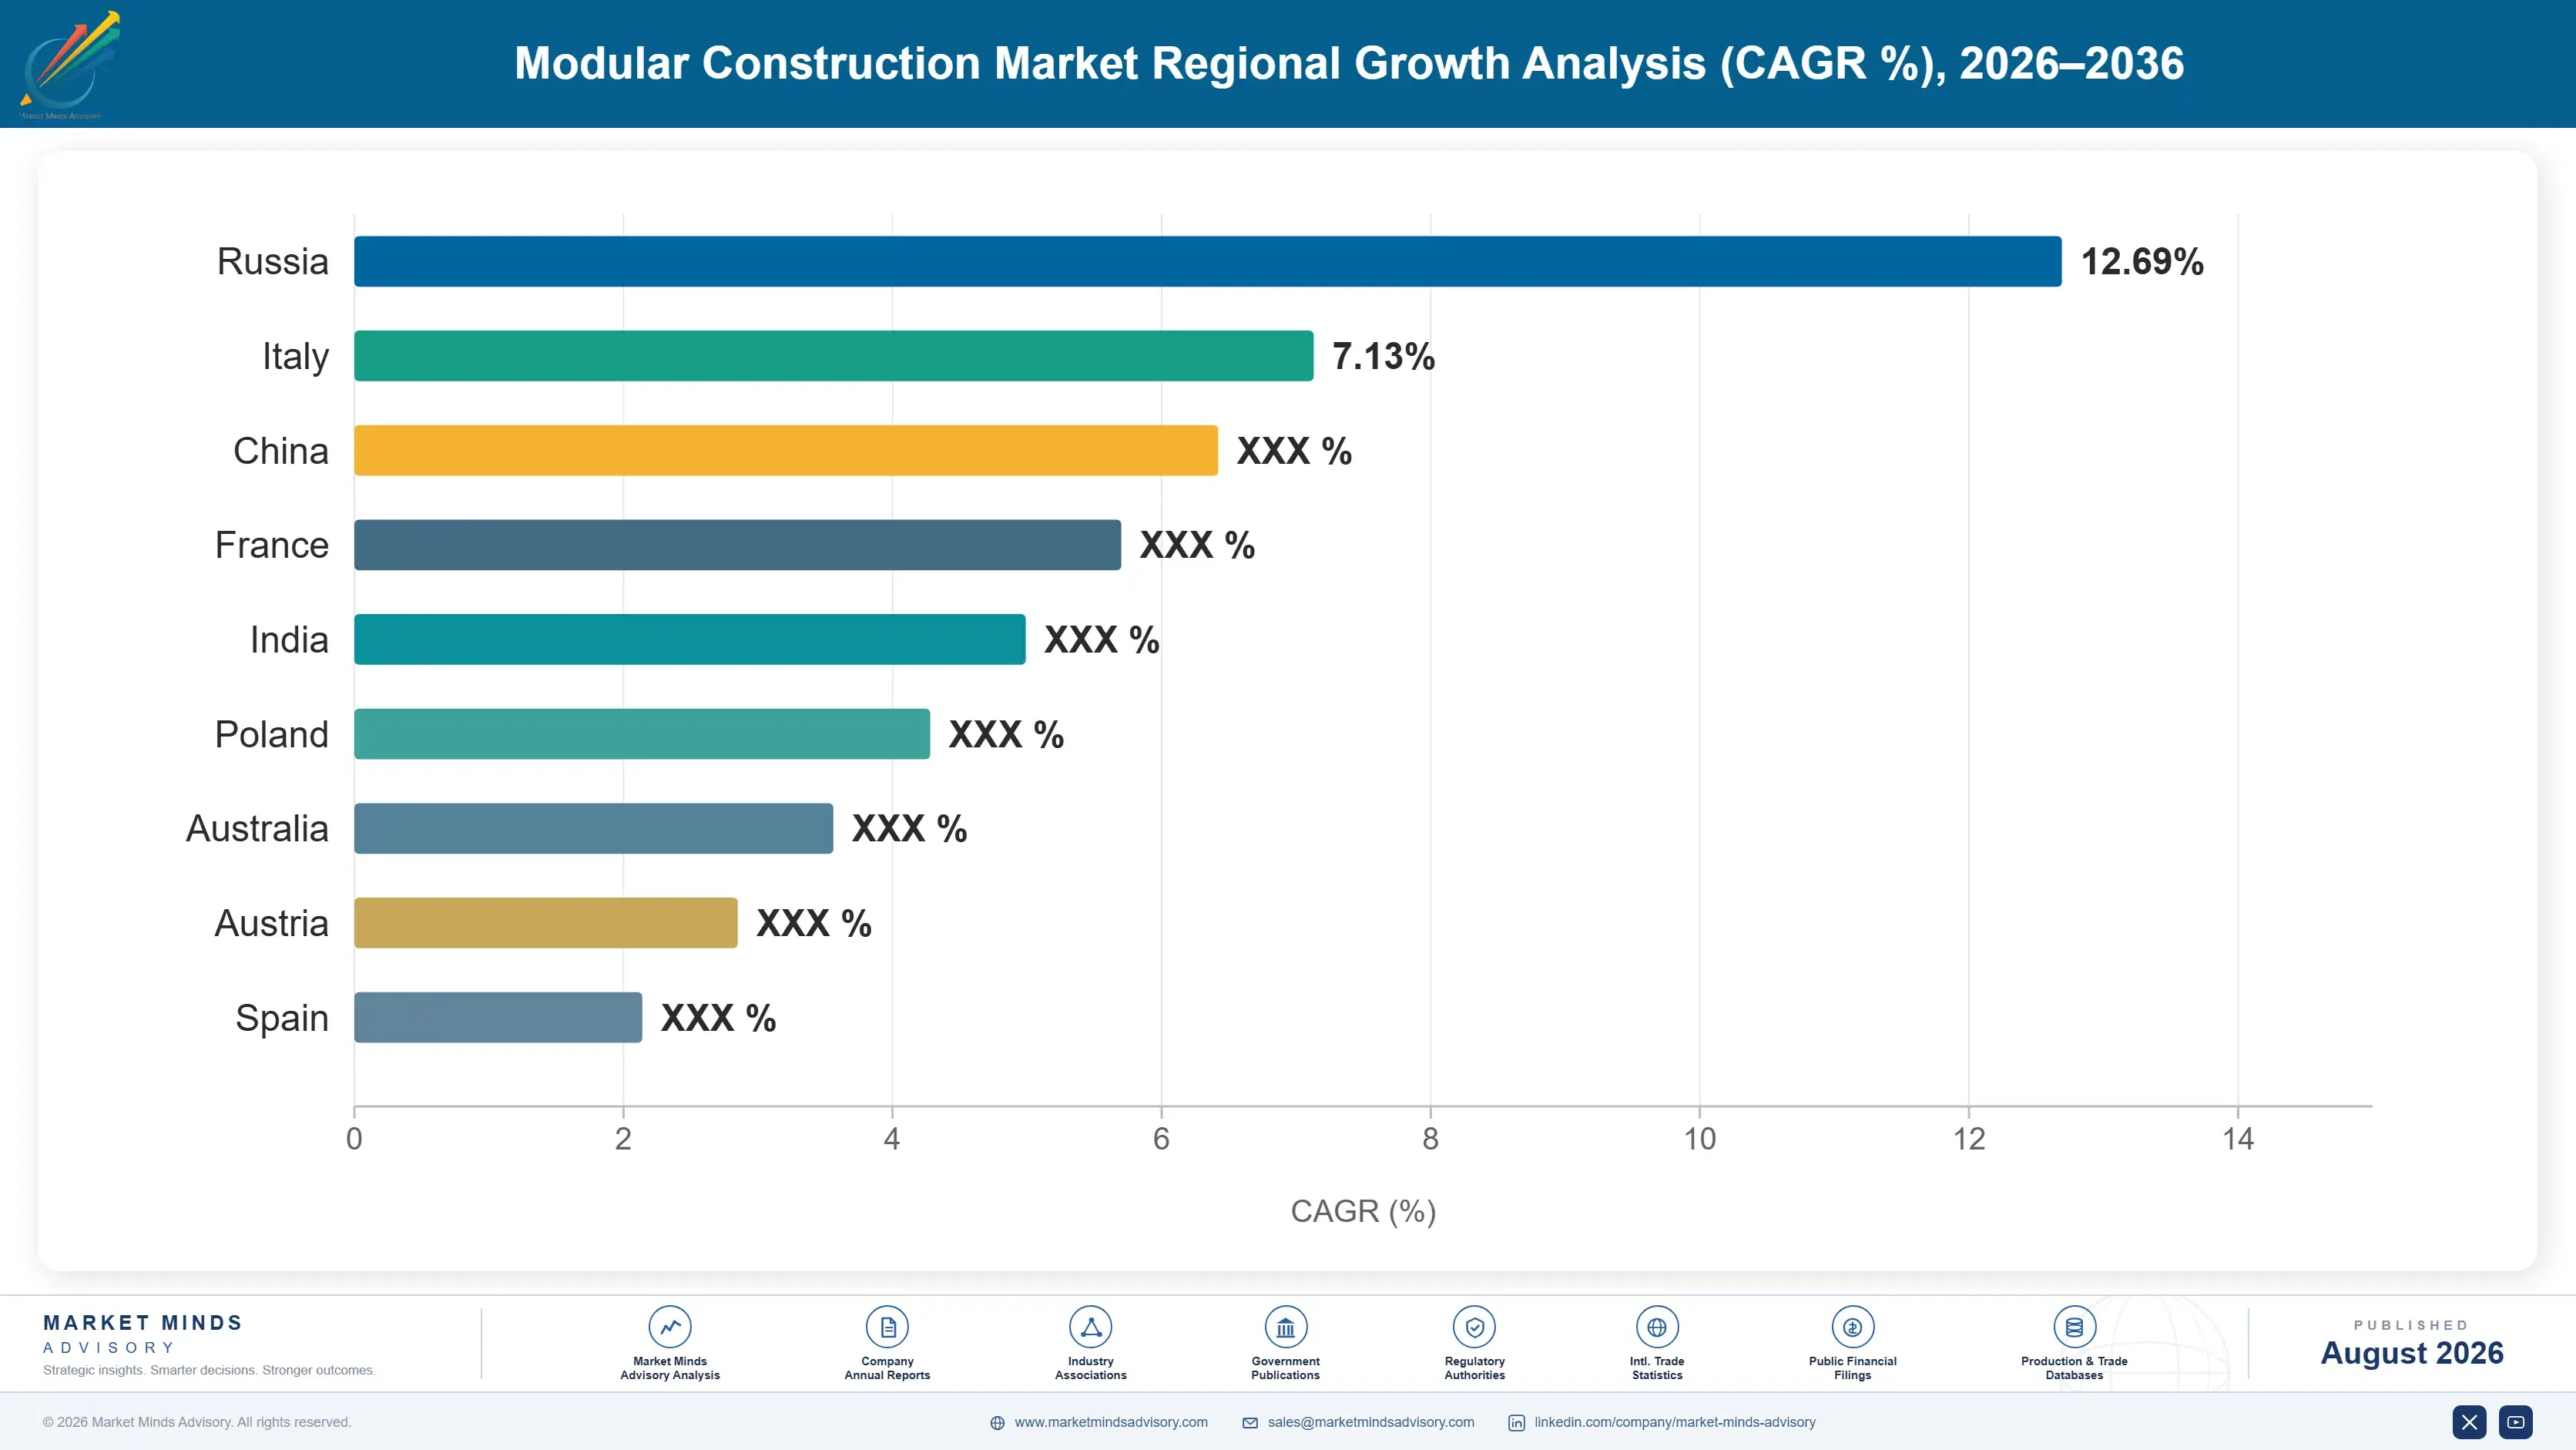
modular-construction-market-country-cagr-analysis-1787324379925

Where Modular Manufacturers Actually Capture Value

Competing on unit price alone means competing against a widening field of manufacturers chasing the same capacity-constrained demand across nearly every market segment right now. The four moves below shift value toward positions a price-only competitor cannot simply match: capacity reservation contracts, mandate market positioning, delivery track record, and MEP pod specialisation built over years.

Sell Multi-Year Factory Capacity Reservation Contracts

Factory utilisation runs near 68% on average, and manufacturers offering developers multi-year capacity reservation contracts capture demand certainty that spot-project bidding never provides, while developers gain schedule confidence in a capacity-constrained market. Repeat developers with standardised designs are increasingly willing to commit to multi-year volume in exchange for guaranteed production slots, since securing capacity has become as commercially important as securing land itself. This model shifts manufacturers from transactional project bidding toward planning partnerships that are considerably harder for capacity-constrained competitors to displace once a developer relationship locks in around a specific factory's production schedule.
Market Impact: Utilisation still averages 68% with

Position Directly For Government Mandate Programmes

Mandate-driven demand in markets like Singapore and the United Kingdom adds an estimated 2.4 points of growth that manufacturers positioned early for public procurement capture disproportionately relative to those treating it as one opportunity among many. Government programmes typically require extensive qualification and track record documentation that favours established manufacturers over newer entrants lacking completed project history. Companies should treat mandate market positioning as a distinct commercial function requiring dedicated public sector relationship building, since the qualification timeline and procurement process differ substantially from private developer sales cycles that most manufacturers are organised around by default.
Market Impact: Mandate demand adds 2.4 points of g

Build Delivery Track Record Into A Pricing Premium

Developers increasingly select manufacturers based on proven delivery history over unit price alone, since a failed or delayed modular programme costs far more than any price differential a lower-cost, unproven manufacturer might have offered initially. Manufacturers with strong completed project portfolios command an 8% to 15% pricing premium that new entrants cannot match regardless of their cost structure, because the perceived execution risk of an unproven manufacturer outweighs typical price advantages in developer decision-making entirely. Companies should document and market delivery performance data as aggressively as they market unit pricing.
Market Impact: Track record commands 8 to 15% pric

Specialise In MEP Pods For Hybrid Project Adoption

Modular MEP and utility pod systems grow at 11.6% as developers on otherwise traditional projects adopt factory-built bathroom pods and mechanical rooms without committing to full volumetric construction, creating a hybrid adoption path considerably wider than fully modular projects alone. Manufacturers specialising exclusively in MEP pods build technical depth that general contractors attempting in-house prefabrication struggle to replicate on quality and delivery consistency. This specialisation also provides a lower-risk entry point for developers uncertain about full volumetric commitment, functioning as a proof of concept that frequently expands into larger modular programmes on subsequent projects once trust is established.
Market Impact: MEP pod segment grows 11.6% versus

Who Controls the Margin Pool

Concentration sits at a fragmented CR5 of 34%, with WillScot Mobile Mini, Algeco, Skanska, Bouygues Construction, and Laing O'Rourke holding leading positions in an industry still built around strong regional manufacturers. The gap between leaders and the broader field rests on factory capacity and delivery track record rather than design capability alone. All participants are assessed on one basis, annual revenue from modular construction manufacturing and assembly, excluding site-built constru
Competition runs along three dimensions. First, factory capacity and utilisation, the binding constraint that increasingly decides which manufacturers can accept new project commitments. Second, delivery track record, which commands pricing premium over unproven competitors regardless of quoted price. Third, government mandate market positioning, particularly in jurisdictions requiring volumetric methods on public projects specifically.

Pressure is building from specialist regional manufacturers in Japan and China with decades of production discipline that newer Western entrants are still working to match on quality. Meanwhile MEP pod specialists are capturing hybrid adoption from developers unwilling to commit to full volumetric construction. Rankings should favour manufacturers with proven capacity, delivery history, and mandate market positioning over those still building a track record.
modular-construction-market-company-positioning-matrix-1787324380444

Competitive Moat and Risk Dimensions

WILLSCOT MOBILE MINI

Moat: Relocatable fleet scale and reach

WillScot Mobile Mini operates one of the largest relocatable modular fleets in North America, giving it delivery reach and inventory availability that smaller regional competitors cannot match on comparable notice. Its rental-based commercial model generates recurring revenue that pure project-based manufacturers lack entirely. Scale purchasing power on raw materials and components supports margin that smaller fleet operators struggle to replicate.
WILLSCOT MOBILE MINI

Risk: Relocatable segment growth lags permanent

The relocatable and portable segment it dominates grows more slowly than permanent volumetric construction, meaning its core fleet business faces a slower growth ceiling than category leaders in faster segments. Fleet age and technology require ongoing capital reinvestment that competes against expansion capital for newer, faster-growing categories. Permanent volumetric specialists are capturing the premium growth story investors increasingly reward.
SKANSKA

Moat: Integrated developer and manufacturer

Skanska's position as both a developer and modular manufacturer lets it capture value across the project lifecycle rather than only the manufacturing margin a standalone supplier earns. Deep relationships with public sector clients position it strongly for government mandate programmes in the UK and Nordic markets. Its broader construction expertise supports credible delivery guarantees standalone manufacturers cannot offer as convincingly.
SKANSKA

Risk: Modular remains a minority share

Modular construction still represents a minority of Skanska's overall revenue, meaning capital allocation decisions compete against much larger traditional construction business lines for investment priority. Specialist modular-only competitors can move faster on capacity expansion decisions without navigating a diversified corporate capital allocation process. Regional modular specialists in Japan and Scandinavia hold deeper category-specific manufacturing expertise in narrower geographic footprints.

Players Tracked

Prominent Players

WillScot Mobile Mini
Algeco
Skanska
Bouygues Construction
Laing O'Rourke

Other Key Players

Vinci Construction
Z Modular
Volumetric Building Companies
ATCO Structures
Red Sea International
Champion Homes
Guerdon Modular
Clayton Homes
Nexus eHousing
Deluxe Modular
FullStack Modular
Polcom Modular
Vision Modular Systems
Kleusberg
Elements Europe

Recent Developments

FEBRUARY 2025

Laing O'Rourke expands volumetric manufacturing capacity

Laing O'Rourke announced a capacity expansion at its Explore Manufacturing facility dedicated to volumetric production, aiming to meet demand from multifamily and public housing programmes that had outrun prior planning. This was an organic expansion rather than an acquisition, adding lines to an existing facility already near full utilisation.
Signal: Manufacturers are now investing ahead of c
SEPTEMBER 2024

Z Modular forms joint venture for multifamily volumetric production

Z Modular entered a joint venture with a regional developer to expand volumetric modular production capacity dedicated to multifamily housing programmes across several major metropolitan markets nationally. This was a joint venture combining manufacturing capability with the developer's pipeline and site expertise, not an acquisition.
Signal: Manufacturers are increasingly partnering
MAY 2025

Bouygues Construction acquires MEP pod specialist manufacturer

Bouygues Construction completed the acquisition of a specialist manufacturer of modular MEP and bathroom pod systems, adding manufacturing capability the company had previously sourced through third-party suppliers. This was a full acquisition bringing manufacturing and design capability in-house, not a distribution or licensing arrangement with the target company.
Signal: Bringing MEP pod manufacturing in-house si

Steel, Timber, And Transportation Logistics

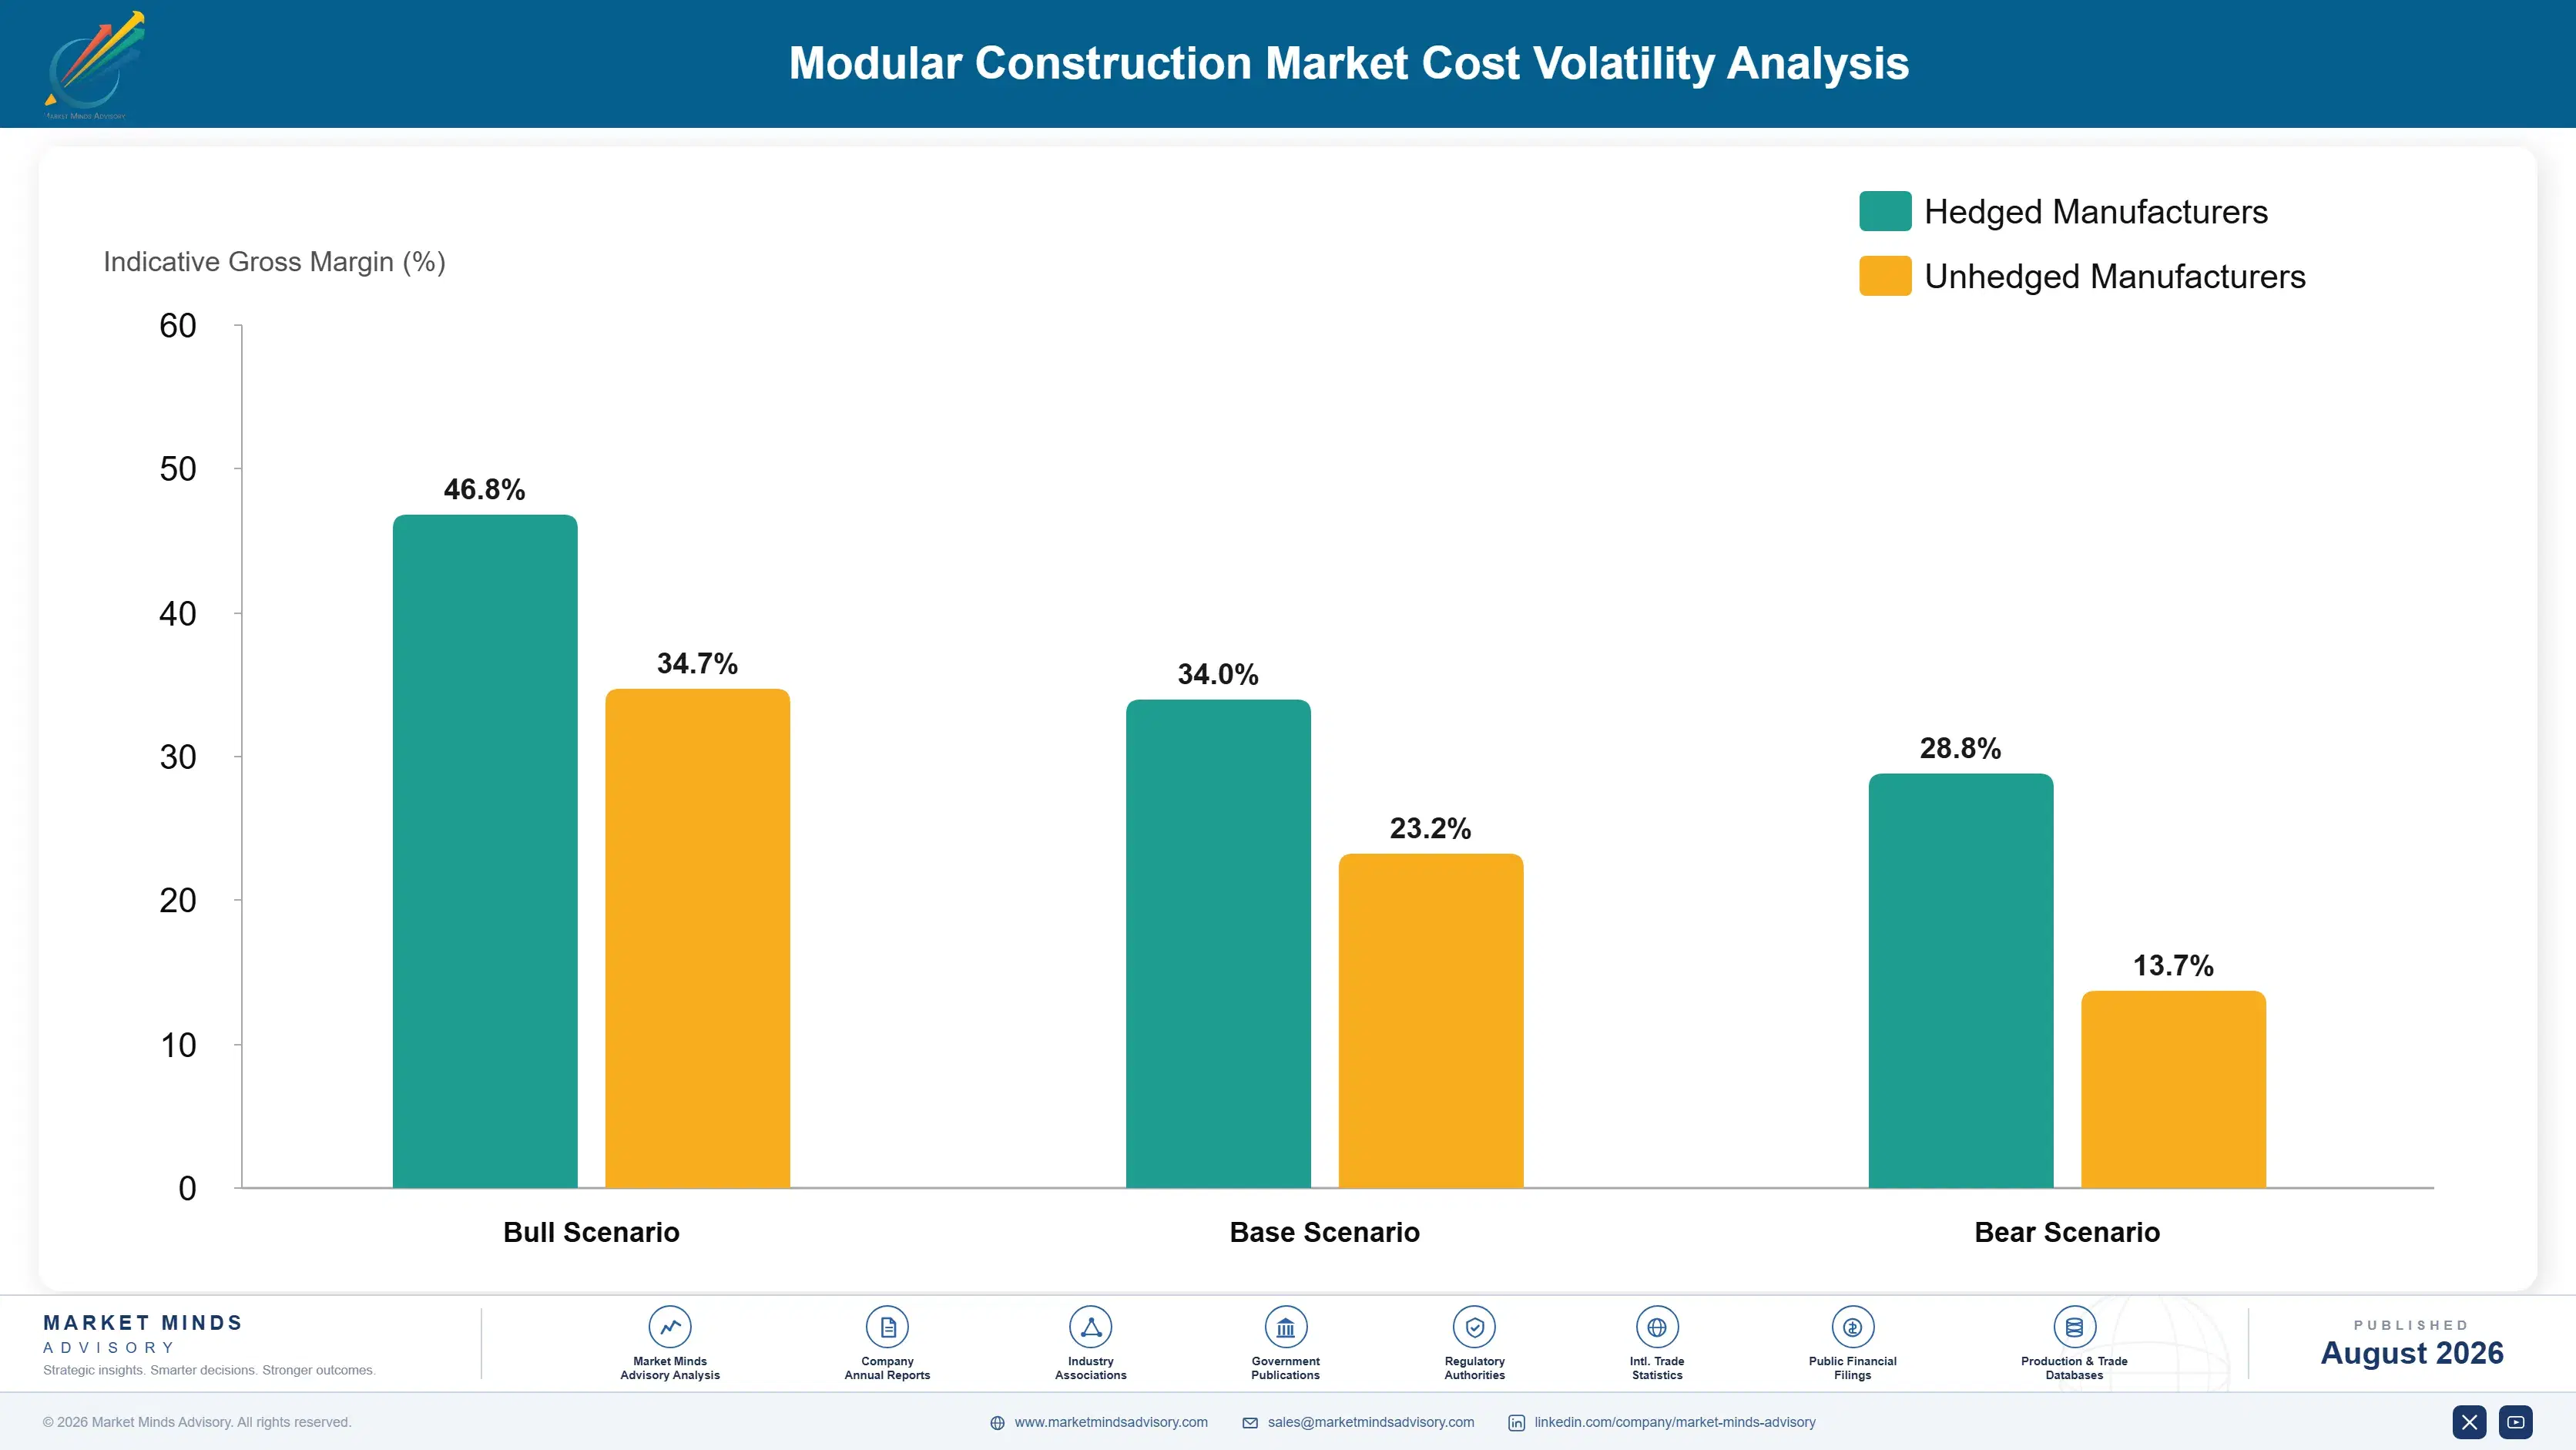
Structural materials dominate cost in this category. Steel framing and timber structural components account for roughly 32% to 42% of cost of goods sold, reflecting the material-intensive nature of volumetric construction. Interior finishing, fixtures, and MEP components add a further 25% to 35%, while transportation and crane installation account for 8% to 15% and can rise considerably for projects requiring long-distance module delivery.
Timber and steel price volatility has been the sharpest recent pressure. Structural material prices moved considerably through 2021 and 2022 amid pandemic-era supply chain disruption, before easing through 2023 and 2024 as supply chains normalised, according to industry reporting referenced in national construction cost indices. Manufacturers absorbed meaningful margin pressure during the volatile period since production schedules could not adjust as quickly as costs moved.

Exposure separates by material sourcing and transportation distance. A manufacturer dependent on volatile spot material pricing faces cost risk that one with long-term supply contracts simply does not carry, while a factory located far from project sites absorbs transportation costs that a regionally distributed manufacturing network avoids. Companies with diversified material sourcing and distributed factory locations weather both material and logistics volatility considerably better than centralised, narrowly sourced competitors.
modular-construction-market-cost-volatility-analysis-1787324380641

Lock in structural material supply contracts long-term

Spot pricing for steel and timber exposes manufacturers to the full volatility of commodity cycles that factory schedules cannot adjust to as quickly as pricing moves. Long-term supply contracts with capacity commitments protect margin through demand surges better than spot purchasing ever can. Manufacturers with established supplier relationships secured material access through recent tight periods newer competitors could not match.

Build distributed factory networks near demand centres

Transportation cost rises considerably with distance, and a factory located far from project sites absorbs logistics costs that erode the schedule and cost advantages modular construction is meant to deliver. Distributed manufacturing networks positioned near major demand centres reduce this exposure directly. Building this network requires sustained capital, which is precisely why few manufacturers have achieved it at scale.

Standardise module designs to reduce material variability

Custom module designs require unique material specifications that complicate bulk purchasing and increase exposure to spot market pricing on smaller volume orders. Standardised module designs across multiple projects allow bulk material purchasing at better pricing and more predictable cost planning overall. Manufacturers pursuing standardisation steadily build cost structures more resilient than competitors reliant on fully bespoke designs for every project.

Portfolio Architecture for Margin Defence

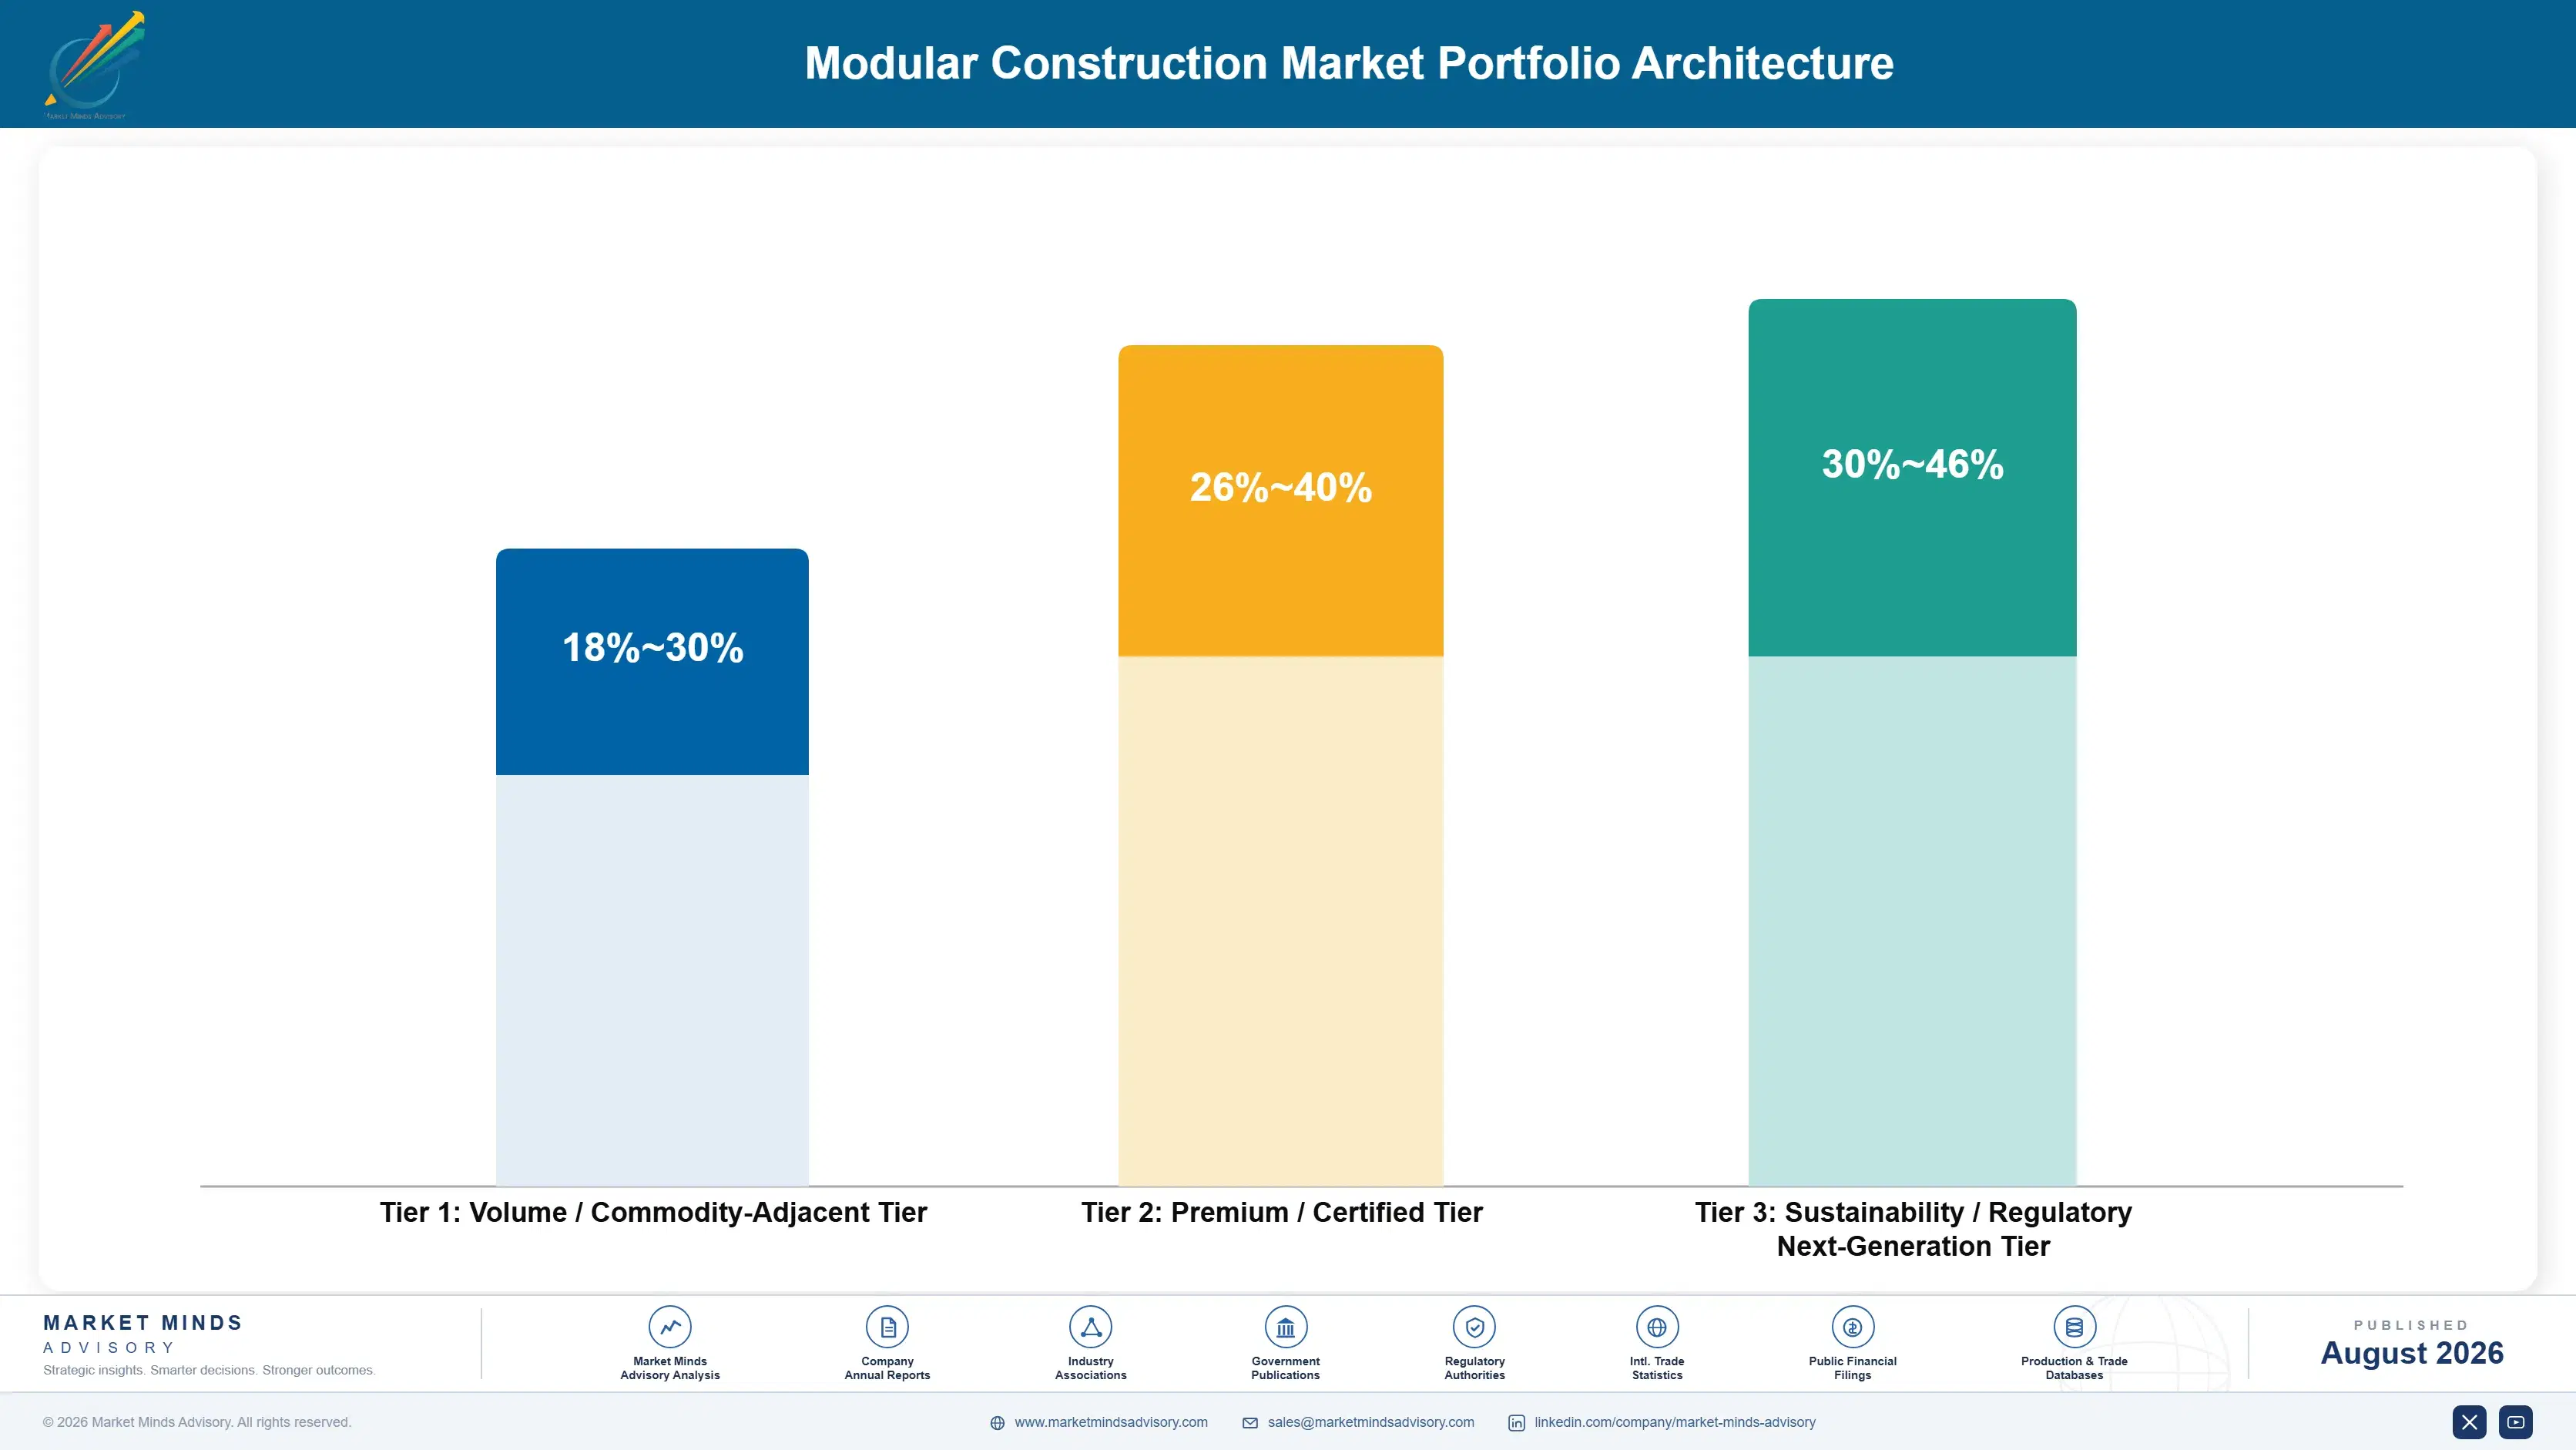
The portfolio splits into three tiers with distinct economics. Relocatable and panelized systems form the volume tier, competing on price and delivery speed against a wide field of regional manufacturers. Permanent volumetric construction earns considerably more, since factory capacity constraints and delivery track record requirements both resist commoditisation. Government mandate and hybrid MEP pod programmes sit differently again, priced against qualification barriers and specification credi
The tension runs between defending relocatable fleet volume, which still funds much of the business today for several major players, and investing in permanent volumetric capacity that increasingly drives growth. Manufacturers over-indexed on relocatable products risk missing the volumetric transition that has already reshaped where capital flows industry-wide. Yet building volumetric capacity requires sustained capital that relocatable fleet margins alone do not always fund.

High-value pools concentrate where factory capacity, delivery track record, or mandate qualification limit competition: permanent volumetric programmes with multi-year capacity reservation, government mandate projects requiring extensive qualification documentation, and MEP pod specialisation serving hybrid adoption. All three resist the price competition that relocatable and panelized systems increasingly face from a widening field. Commodity-adjacent relocatable units sold on price alone sit at the other end.

Volume / Commodity-Adjacent Tier

Relocatable modular buildings and panelized systems sold largely on price and delivery speed against a wide field of regional manufacturers competing closely on cost, availability, and consistent quality across large fleet volumes.
Gross Margin: 18-30%

Premium / Certified Tier

Permanent volumetric modular construction with proven delivery track records, where factory capacity and completed project history command sustained pricing power that unproven entrants simply cannot match at any comparable price point.
Gross Margin: 26-40%

Sustainability / Regulatory / Next-Generation Tier

Government mandate programmes and specialised MEP pod systems sold with documented qualification credentials and bundled technical delivery support to developers, priced against specification credibility and regulatory positioning competitors have not yet fully established.
Gross Margin: 30-46%
modular-construction-market-portfolio-architecture-1787324381141

High-value Sub-segments and Strategic Watch-out

Permanent Volumetric Modular Construction

High value and high growth at 13.8%, the fastest category, as multifamily, hospitality, and healthcare developers standardise on factory-finished rooms over site-built alternatives across most major markets worldwide today. Factory capacity, not developer demand, is now the binding growth constraint industry-wide across most producing regions.
Gross Margin: 26-40%

Modular MEP and Utility Pod Systems

High value with strong growth at 11.6% as hybrid adoption lets developers on traditional projects capture factory efficiency on the most trade-intensive building components without full volumetric commitment upfront at all. Specialist manufacturers hold deeper technical expertise than general contractor in-house prefabrication across most markets.
Gross Margin: 28-42%

Panelized Construction Systems

The volume core by revenue, growing moderately as a lower-commitment entry point into offsite construction for developers not yet ready for full volumetric adoption across several major markets globally today. Competition on price is most intense in this category across most established markets worldwide currently.
Gross Margin: 20-32%

Relocatable and Portable Modular Buildings

The strategic watch-out, growing slowest as permanent volumetric construction increasingly captures projects that might previously have chosen relocatable alternatives for cost reasons alone across several developed markets worldwide today. Fleet operators face a slower growth ceiling than faster-growing categories overall across most currently established markets.
Gross Margin: 18-28%

How Factory Relationships Actually Persist

Revenue depends on capacity relationships persisting across a developer's multi-year building programme, and once a developer secures production slots with a manufacturer and validates delivery quality, switching factories mid-programme carries requalification cost that protects the incumbent for years. Government mandate programmes, tied to qualification documentation, generate demand across multi-year public procurement cycles rather than one-time sales. A small number of large multifamily and
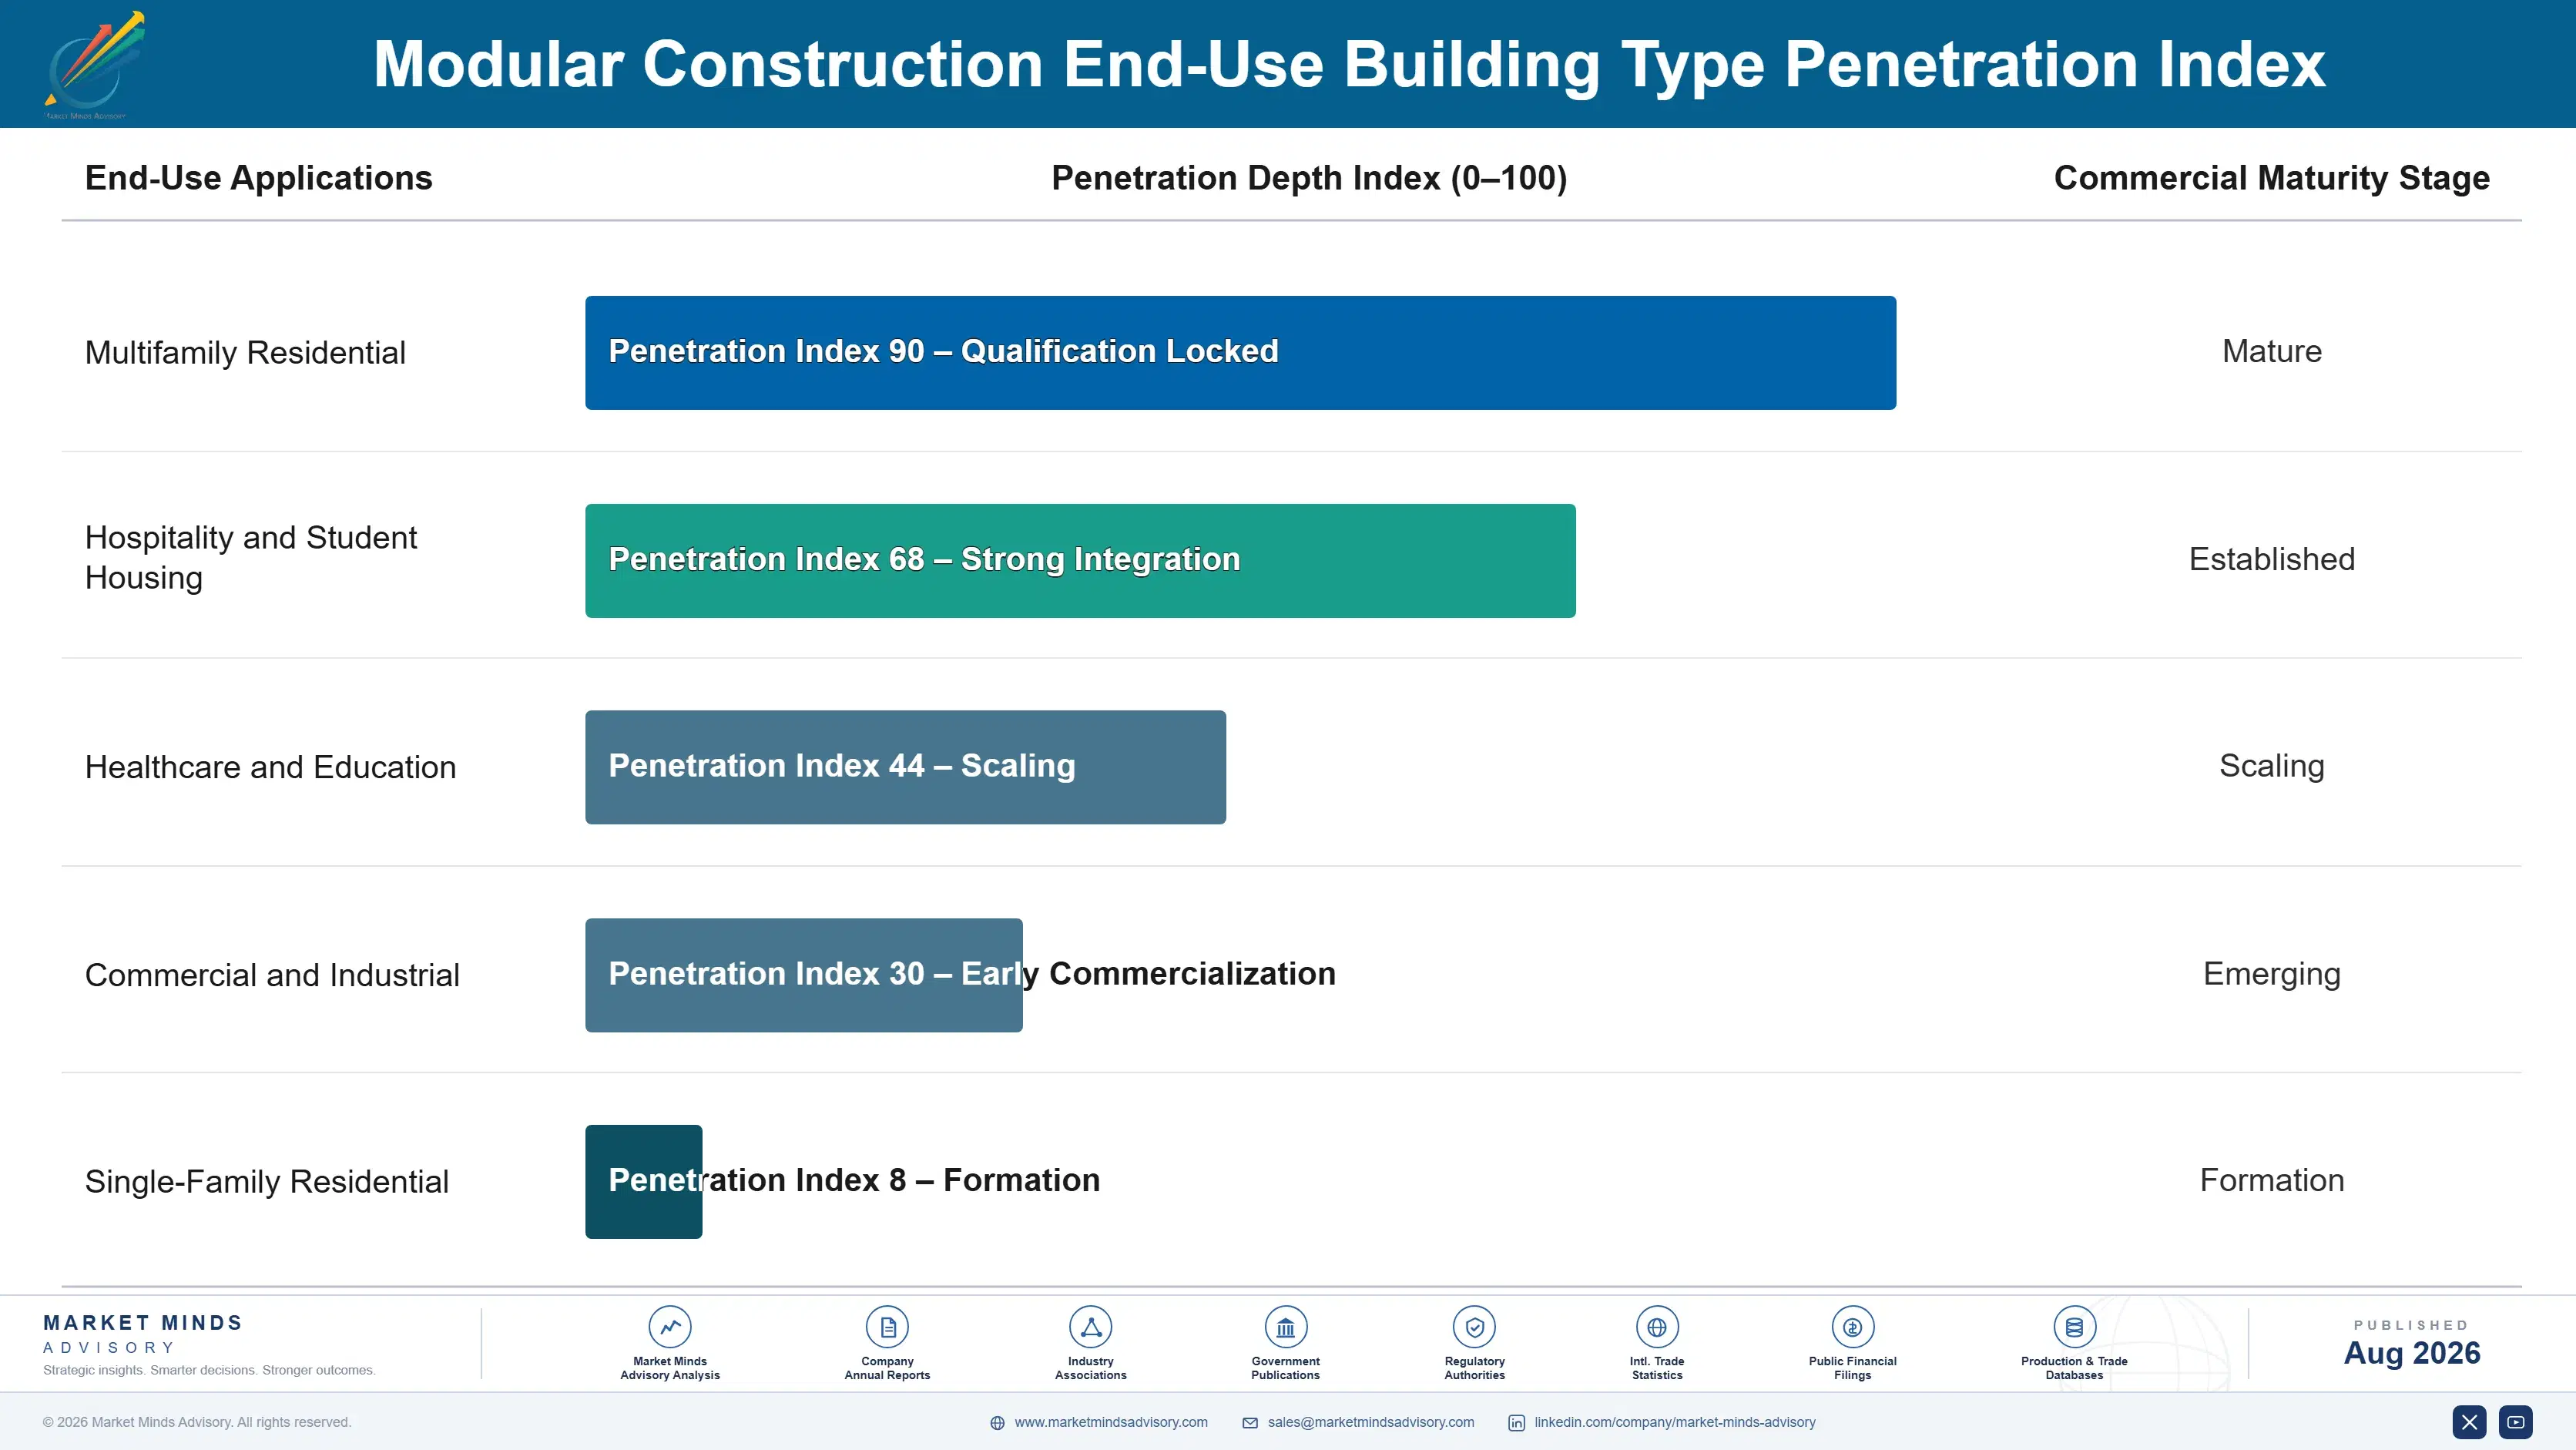
Adoption depth varies sharply by building type. Hospitality and student housing adopt deepest, since repeatable room designs suit factory production more completely than any other building type. Multifamily and healthcare adopt steadily as labor scarcity and schedule pressure both push developers toward factory methods. Single-family residential adopts most slowly, constrained by quality perception and a fragmented, locally focused homebuilder base.

Buyer profiles have shifted from individual project managers toward corporate development and procurement teams who evaluate manufacturer relationships against multi-year capacity planning rather than single-project economics. Procurement increasingly runs years ahead of site mobilisation to secure production slots, a planning horizon traditional procurement rarely required. Younger developers also treat modular methods as a default consideration rather than an exception requiring justification.
modular-construction-market-end-use-penetration-index-1787324381631

Our Call On Modular Construction

These are among the four positions where our research anticipates prominent divergence between winners and laggards over the coming forecast period. Each is grounded in the demand model, the regulatory perimeter, and the announced capacity pipeline.
01 / LABOR SCARCITY BEATS COST

Staffing necessity now drives adoption more than savings

Developers who once dismissed modular construction as a cost play are specifying it because they simply cannot staff traditional sites fast enough to hit delivery deadlines, and this dynamic shows no sign of reversing as skilled trade pipelines remain persistently undersized relative to project demand. Manufacturers should market delivery certainty and staffing independence ahead of cost savings claims, since labor scarcity is the more durable argument driving current adoption. Companies still leading with cost-only pitches are missing the actual reason developers are converting to modular methods at meaningful scale.
02 / FACTORY CAPACITY GATES GROWTH

Production slots now matter more than design creativity

Factory utilisation runs near 68% on average, and demand growth from labor scarcity and government mandates together is outpacing how fast qualified manufacturing capacity can expand across major markets simultaneously. Developers increasingly book production slots years ahead of site mobilisation, treating capacity reservation as seriously as land acquisition itself in capacity-constrained regions. Manufacturers should invest in capacity expansion tied to confirmed multi-year order books now, because capacity-constrained developers will commit to whichever manufacturer can actually deliver rather than whoever quotes the lowest initial price.
03 / MANDATE MARKETS REWARD POSITIONING

Government programmes favour qualified incumbents over new entrants

Mandate-driven demand in Singapore, the United Kingdom, and emerging jurisdictions adds meaningful growth that manufacturers positioned early for public procurement capture disproportionately relative to competitors treating it as one opportunity among many available. Government qualification requirements typically favour established manufacturers with documented delivery history over newer entrants lacking completed project references. Companies should build dedicated public sector relationship capability now, since qualification and procurement timelines in mandate markets reward manufacturers who invested in positioning years before formal tender requirements actually tighten.
04 / TRACK RECORD AS PRODUCT

Delivery history commands premium price competitors cannot match

Developers increasingly select manufacturers based on proven delivery history over unit price alone, since a failed or delayed modular programme costs far more than any price differential an unproven, lower-cost manufacturer might have initially offered on paper. Manufacturers with strong completed project portfolios command a genuine pricing premium that new entrants cannot match through cost structure alone. Companies should document and market delivery performance as aggressively as unit pricing, because track record has effectively become the actual product being sold in this capacity-constrained market.

Engagement Snapshot From the Field

A live engagement with an industry participant carrying material or product regulatory and market exposure ahead of a defining policy shift, showing how our research translates into a defensible multi-year portfolio strategy.
MARKET MINDS ADVISORY · CLIENT ENGAGEMENT SUMMARY
Modular Construction Producer Strategic Portfolio Review and Transition Roadmap 2026·Investment Scenario on Modular Construction Exposure Evaluation 2025-26
CLIENT PROFILE
A regional multifamily developer planning a portfolio of five apartment communities across two states engaged MMA while evaluating whether to commit to modular construction after years of exclusively traditional site building. The client reported a development pipeline valued near USD 420 million and persistent difficulty staffing skilled trades on recent projects, extending timelines considerably beyond original schedules (client-reported, unverified by MMA).
STRATEGIC CHALLENGE
Leadership was interested in modular construction's schedule benefits but worried about committing to unproven manufacturer relationships without a clear framework for evaluating capacity, delivery track record, and pricing against traditional construction. Internal teams had received conflicting proposals from multiple manufacturers with widely varying capacity availability and completed project histories. The board wanted a structured evaluation before committing capital to the first project.
MMA APPROACH
MMA benchmarked candidate manufacturers on capacity availability, delivery track record, and total project cost against comparable completed multifamily programmes rather than only quoted unit pricing. We assessed schedule compression achievable across the client's specific building types and site conditions. We then modelled portfolio-wide economics under a phased modular commitment against continued reliance on traditional construction across the full five-project pipeline.
KEY FINDINGS
  1. The manufacturer with the strongest delivery track record quoted pricing roughly 9% above the lowest bidder but modelled schedule compression worth considerably more in financing cost savings alone.
  2. Factory capacity at the top-recommended manufacturer required booking production slots 14 months ahead of site mobilisation, longer than the client's original planning timeline had assumed.
  3. Portfolio-wide modular commitment across all five projects modelled a schedule reduction averaging 31% versus continued traditional construction across the full pipeline (client-reported, unverified by MMA).
  4. Skilled trade staffing risk on the traditional construction alternative was assessed as high enough to threaten delivery dates on at least three of the five planned projects.
CLIENT PROFILE
A regional multifamily developer planning a portfolio of five apartment communities across two states engaged MMA while evaluating whether to commit to modular construction after years of exclusively traditional site building. The client reported a development pipeline valued near USD 420 million and persistent difficulty staffing skilled trades on recent projects, extending timelines considerably beyond original schedules (client-reported, unverified by MMA).
STRATEGIC CHALLENGE
Leadership was interested in modular construction's schedule benefits but worried about committing to unproven manufacturer relationships without a clear framework for evaluating capacity, delivery track record, and pricing against traditional construction. Internal teams had received conflicting proposals from multiple manufacturers with widely varying capacity availability and completed project histories. The board wanted a structured evaluation before committing capital to the first project.
MMA APPROACH
MMA benchmarked candidate manufacturers on capacity availability, delivery track record, and total project cost against comparable completed multifamily programmes rather than only quoted unit pricing. We assessed schedule compression achievable across the client's specific building types and site conditions. We then modelled portfolio-wide economics under a phased modular commitment against continued reliance on traditional construction across the full five-project pipeline.
KEY FINDINGS
  1. The manufacturer with the strongest delivery track record quoted pricing roughly 9% above the lowest bidder but modelled schedule compression worth considerably more in financing cost savings alone.
  2. Factory capacity at the top-recommended manufacturer required booking production slots 14 months ahead of site mobilisation, longer than the client's original planning timeline had assumed.
  3. Portfolio-wide modular commitment across all five projects modelled a schedule reduction averaging 31% versus continued traditional construction across the full pipeline (client-reported, unverified by MMA).
  4. Skilled trade staffing risk on the traditional construction alternative was assessed as high enough to threaten delivery dates on at least three of the five planned projects.
RECOMMENDED STRATEGY
Phase 1: Phase 1 (0 to 3 months): Select the top-recommended manufacturer and book factory production slots for the first two projects immediately. Phase 2: Phase 2 (3 to 18 months): Execute the first two modular projects while monitoring delivery performance against modelled projections closely. Phase 3: Phase 3 (18 to 40 months): Commit the remaining three projects to modular construction based on validated first-phase delivery performance.
OUTCOME
The client booked factory production slots with the top-recommended manufacturer and began the first two projects on the revised modular timeline, avoiding the skilled trade staffing risk identified for traditional construction. Early delivery performance tracked close to the modelled schedule compression, and the client committed the remaining three projects to modular construction ahead of schedule (client-reported, unverified by MMA).

Frequently Asked Questions

Foundational context covering the market sizes, CAGR, scope, country, region and competition that inform every finding below. This section is provided to cover basics and most often pre-purchase conversations, answered from the MMA Primary Research Dataset.

What is the current size of the Modular Construction Market?

The global modular construction market is valued at USD 94.5 billion in 2025, covering permanent volumetric construction, relocatable buildings, panelized systems, and modular MEP pods. Traditional site-built construction is excluded.

How large will the Modular Construction Market be by 2036?

The market is forecast to reach USD 259.03 billion by 2036 in the base case, about 2.5 times the 2026 level. That represents incremental value of roughly USD 155.46 billion across the decade.

What is the CAGR for the Modular Construction Market 2026 to 2036?

The market grows at a 9.6% CAGR in the base case, with bull and bear scenarios at 10.9% and 8.3%. The spread turns mainly on labor scarcity persistence and government mandate expansion into new jurisdictions.

Which segment is growing fastest?

Permanent volumetric modular construction grows fastest at 13.8%, about 1.44 times the overall rate, as developers standardise on factory-finished rooms. Modular MEP and utility pod systems follow at 11.6%.

Who are the major companies in the Modular Construction Market?

Leading companies include WillScot Mobile Mini, Algeco, Skanska, Bouygues Construction, and Laing O'Rourke. Concentration remains fragmented at CR5 of 34%, reflecting strong regional manufacturers rather than global consolidation.

Which country is growing fastest?

Singapore grows fastest at a 15.2% CAGR, under a government mandate requiring volumetric construction on a substantial share of eligible projects. China follows on continued manufacturing capacity expansion.

Report Segmentation Architecture

The full report scope spans multiple orthogonal segmentation dimensions, with cross-tabulated demand data provided for each dimension pair. Coverage extends further to regional breakdowns, trend trajectories, and the competitive detail needed to support segment-level decision-making.

By Construction Method and Technology Type

  • Permanent Volumetric Modular Construction
  • Relocatable and Portable Modular Buildings
  • Panelized Construction Systems
  • Modular MEP and Utility Pod Systems
  • Hybrid Podium Construction Systems
  • Modular Design and Fabrication Software

By End-Use Building Type

  • Multifamily Residential
  • Hospitality and Student Housing
  • Healthcare and Education
  • Commercial and Industrial
  • Single-Family Residential

By Commercial Dimension

  • Manufacturing and Sale
  • Rental and Leasing
  • Design and Engineering Services
  • Installation and Site Assembly

By Region

  • North America
  • Western Europe
  • East Asia
  • South Asia and Pacific
  • Latin America
  • Middle East and Africa
  • Eastern Europe

Scope, Methodology, and Coverage

Every figure in this report is reproducible from documented input assumptions. The scope below maps the historical period, the forecast horizon, the segmentation dimensions, and the countries covered, alongside the underlying primary and qualitative methodology.
Historical Period
2020 to 2025
Forecast Period
2026 to 2036
Base Year
2025 (USD billions; MMA Primary Research Dataset, August 2026)
Market Definition
The modular construction market comprises factory-manufactured building components and complete volumetric units assembled offsite and transported for on-site installation, valued at manufacturer revenue from production, assembly, and directly attached engineering services. It spans permanent volumetric modular buildings, relocatable and portable modular buildings, panelized construction systems, modular MEP and utility pod systems, and hybrid podium construction combining volumetric upper floors with traditional podium bases. Traditional site-built construction, standalone prefabricated building materials sold without assembly, and 3D-printed construction are excluded.
Quantitative Units
USD billions (current prices); completed module units where applicable
Segmentation Dimensions
By Construction Method and Technology Type; By End-Use Building Type; By Commercial Dimension; By Region
Regions Covered
North America, Western Europe, East Asia, South Asia and Pacific, Latin America, Middle East and Africa, Eastern Europe
Countries Covered
USA, China, Germany, France, UK, Japan, South Korea, India, Australia, Canada, Brazil, Mexico, Indonesia, Vietnam, Thailand, Malaysia, UAE, Saudi Arabia, South Africa, Nigeria, Turkey, Poland, Netherlands, Italy, Spain, Sweden, Switzerland, Argentina, Colombia, Singapore, and additional markets relevant to this sector
Key Companies Profiled
WillScot Mobile Mini, Algeco, Skanska, Bouygues Construction, Laing O'Rourke, Vinci Construction, Z Modular, Volumetric Building Companies, ATCO Structures, Red Sea International, Champion Homes, Guerdon Modular, Clayton Homes, Nexus eHousing, Deluxe Modular, FullStack Modular, Polcom Modular, Vision Modular Systems, Kleusberg, Elements Europe
Quantitative Methodology
Primary survey, n=3,800 respondents, Q4 2025, six countries; demand-side model with trade association cross-validation
Qualitative Methodology
47 expert interviews, Q4 2025; applied to validate demand model assumptions, identify emerging dynamics, and assess competitive positioning
Report Format
PDF and XLSX data workbook (Word format preview document)
Publisher
Market Minds Advisory
Report Code
MMA-2026-CON-104
Published
August 2026
Contact
sales@marketmindsadvisory.com | www.marketmindsadvisory.com

Purchase the full Modular Construction Market Report (2026 to 2036).

The full MMA Modular Construction report sizes the market across six construction method categories, five end-use building types, four commercial dimensions, and seven regions through 2036. It profiles 20 companies on a consistent modular construction revenue basis, scoring each on factory capacity, delivery track record, and government mandate market positioning. Scenario models quantify how skilled trade labor scarcity, government mandate expansion, and factory capacity constraints move both completed unit volume and achievable margin by construction method. The report also includes factory utilisation and capacity tracking, delivery track record benchmarking by manufacturer, and government mandate policy tracking across major jurisdictions for commercial and product strategy teams.
Six-category and four-dimension market sizing to 2036
Twenty-company benchmark on modular construction revenue basis
Factory capacity and utilisation tracking by major manufacturer
Delivery track record and schedule performance benchmarking
Government mandate policy tracking across major jurisdictions
Labor scarcity correlation analysis by region and building type

Built For The People Who Decide

From boardroom strategy to bench-side execution, this report is read cover-to-cover by leaders shaping the next decade of their industry, turning demand scenarios, market dynamics and valuation benchmarks into decisions.
CXOs/ Presidents/ VPs/ Managers
M&A and Corporate Development
Strategy Teams and R&D Heads
Procurement and Product Directors
Regulatory and Compliance Leaders
Investor Relations and Equity Analysts