Market Minds Advisory
Model-Based Manufacturing Technologies Market

Model-Based Manufacturing Technologies Market: Model-Based Manufacturing Technologies Market: Contractual Deliverables, Inspection Payback and Supplier Reach, 2026 to 2036

Thirty years of advocacy have not killed the two-dimensional drawing, because the drawing is the legal deliverable a purchase order references and a model has never been given that standing.

Lead Analyst

Published

September 2026

Make Smarter Decisions with Customized Research Insights

Request a free sample report and evaluate market opportunities, growth trends, and competitive dynamics relevant to your business needs.

2025 MARKET VALUE$2.2BMarket Size 2025
2036 FORECAST VALUE$7.2BBase Case , 2026 to 2036
CAGR 2026 TO 203611.4 %Bull 12.6% / Bear 10.2%
INCREMENTAL OPPORTUNITY$4.8BNet 10- year value creation
EXPANSION MULTIPLE2.94x2036 value over 2026 base
Strategic Levers
M&A Pipeline
Regional Outlook
Country Rankings
Competitive Intelligence
Segmental Deep-dive
Call-Us : 91 93563 13602

Executive Snapshot and Market Trajectory.

The obstacle here has never been software. A drawing survives because it is the contractual artefact: it is what a purchase order references, what a supplier quotes against and what an inspector signs. Until the model carries that standing, manufacturers run both. Both cost more than either alone.
Running both is the expensive part, adding roughly 23% to engineering cost for no additional information. What finally broke the deadlock was not design at all but measurement. Model-based inspection and metrology grows at 17.1%, half again the market rate of 11.4%, because programming a coordinate measuring machine directly from embedded tolerances cuts setup time by around 62% and removes the manual re-entry that causes most inspection error. Quality, not engineering, found the payback.
Five vendors hold 58% of measured licence and services revenue, but the constraint sits outside their products. Only 41% of suppliers can consume a model without a drawing, so adoption stalls at the boundary of the enterprise. Neutral exchange formats rather than common software solved that, and only 19% of programmes have actually eliminated drawings so far. The blocker sits outside the enterprise.
Market Definition
The model-based manufacturing technologies market covers software and associated services that make the annotated three-dimensional model the authoritative product definition for manufacturing, spanning model-based definition authoring, product manufacturing information tooling, model-based inspection and metrology programming, neutral format translation and validation, model-based process planning with computer aided manufacturing integration, and digital thread configuration management. Sizing is measured at vendor licence, subscription and implementation services revenue. Core computer aided design seats, enterprise resource planning, machine tools, metrology hardware and shop floor execution systems are excluded.
Base Year Value
$2.2B in 2025 (MMA Primary Research Dataset, September 2026)
Forecast Period
2026 to 2036, eleven discrete annual values
CAGR
11.4% base case. Bull 12.6%. Bear 10.2%.
Fastest Growth Segment
Model-Based Inspection and Metrology: 17.1% CAGR
Fastest Growth Country
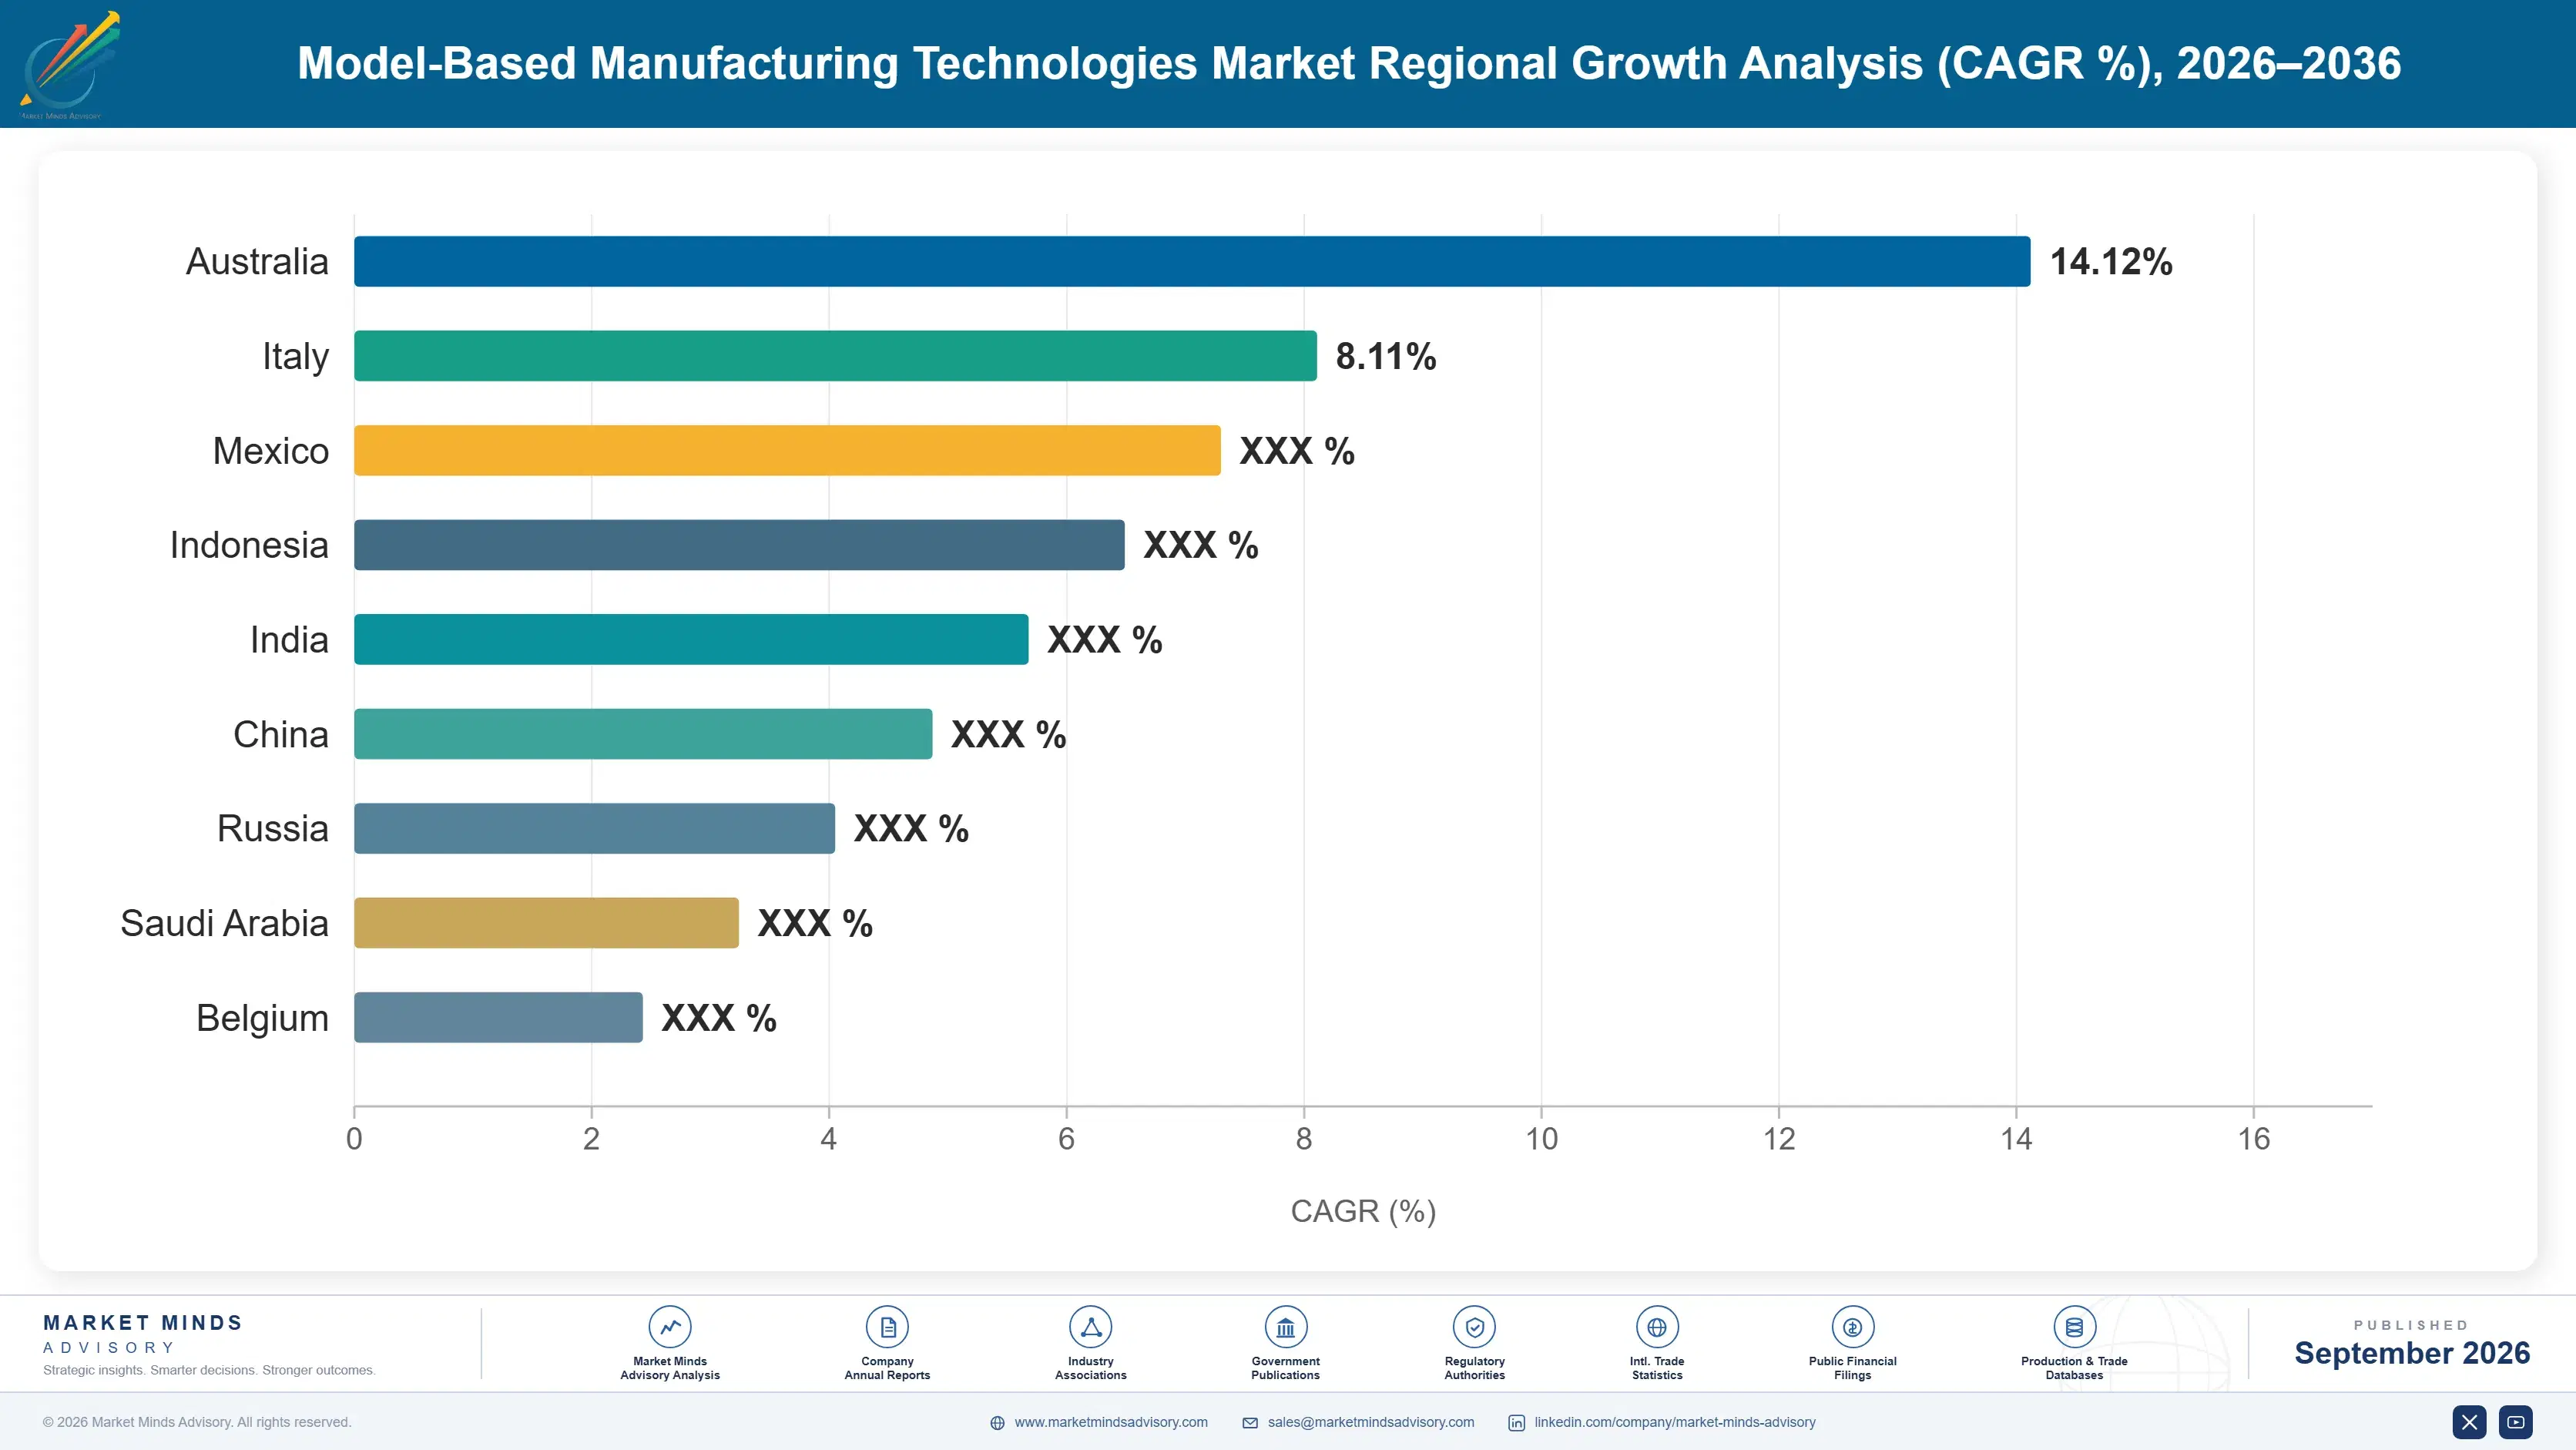
India: 16.2% CAGR
Fastest Growth Region
South Asia and Pacific: 13.6% CAGR
Largest Region
North America: 32% of 2025 global value
Market Leaders
Dassault Systemes, Siemens Digital Industries Software, PTC, Autodesk, Hexagon. Source: MMA Analysis based on company annual reports and measured licence and services revenue.
Primary Survey
n=3,800 procurement and R&D decision-makers, Q4 2025, six countries
Methodology
Demand-side build-up, cross-validated against public data, 47 expert interviews

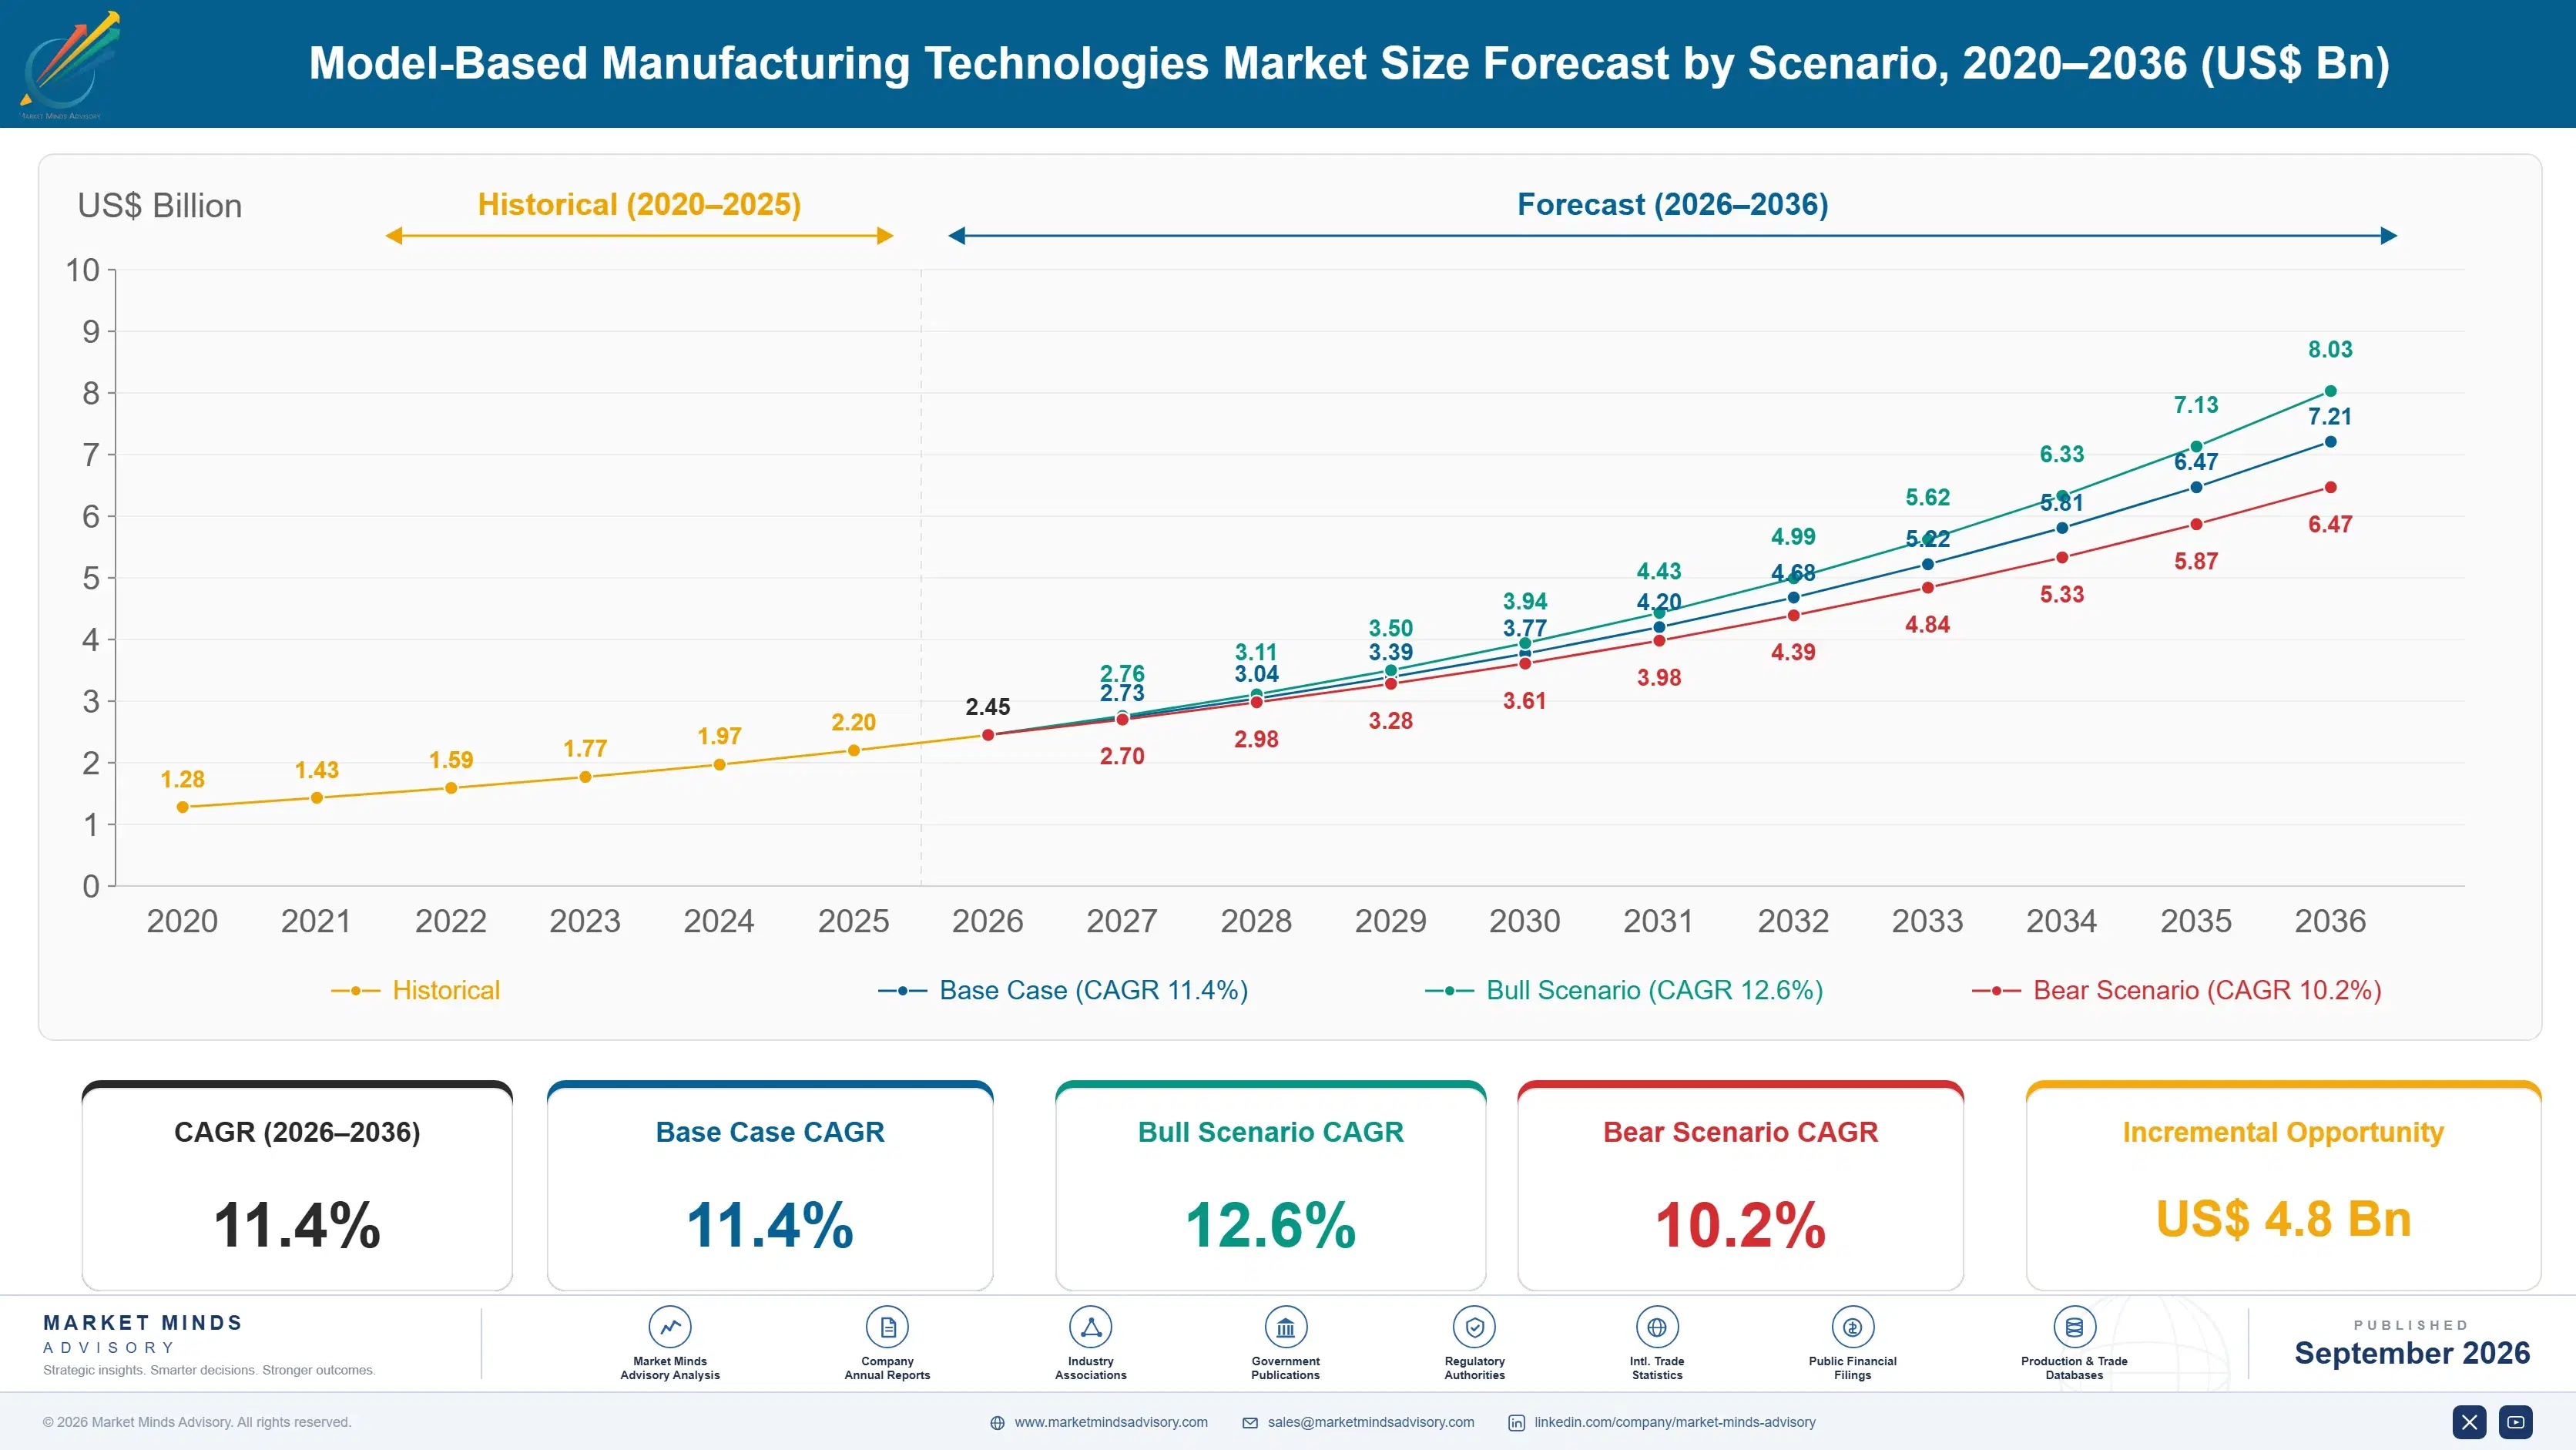
Model-Based Manufacturing Technologies Market Forecast Scenarios

model-based-manufacturing-technologies-market-size-forecast-scenario-1788414388763
Between 2020 and 2025 the market compounded at 10.2%, driven far more by defence and aerospace contractual requirements than by any voluntary efficiency argument. Programmes that adopted model-based definition did so because a customer required it, and the internal business case was frequently constructed afterwards. Automotive and machinery adoption ran behind, since those industries had no equivalent mandate flowing down from a single dominant customer.
The 11.4% base case rests on three commercial mechanisms. Defence digital engineering requirements continue flowing down through supply chains, which converts adoption from a choice into a condition of bidding. Model-based inspection delivers measurable payback that finance functions accept, unlike the productivity claims made for authoring tools. And neutral format maturity now lets a prime send definition to a supplier running entirely different software, which removes the barrier that stalled adoption at the enterprise boundary for two decades.
The bull case is a major customer or regulator granting the annotated model formal contractual standing, which would end dual maintenance across whole supply chains within a few years. The bear case is generative design and direct model exchange between artificial intelligence tooling bypassing the annotation layer entirely, stranding annotation investment entirely as an intermediate step.

The Drawing Survives Because Contracts Say So

Every technical argument for the annotated model was settled decades ago. The drawing is still here. The reason is legal. A purchase order references a drawing number, a supplier quotes against it, an inspector signs against it and disputes resolve against it. Nobody has given the model that standing, so manufacturers maintain both and pay roughly 23% more for a second representation of the same information.
TOP FIVE CONCENTRATION58%Share of measured licence and services revenue held by leaders
DUAL MAINTENANCE OVERHEAD23%Extra engineering cost of running drawings alongside models
INSPECTION SETUP REDUCTION62%Reduction in measurement programming time using embedded manufacturing information
SUPPLIER MODEL CAPABILITY41%Portion of suppliers able to consume models without drawings
NEUTRAL FORMAT SHARE47%Portion of exchanges using neutral rather than native formats
DRAWING ELIMINATION RATE19%Portion of programmes that have removed drawings entirely already
The breakthrough came from measurement rather than design. A coordinate measuring machine programmed directly from tolerances embedded in the model removes the manual transcription that consumes setup time and produces most inspection error, cutting programming effort by around 62%. That is a saving a finance director can verify, unlike the diffuse productivity claims for authoring tools, and it is what pulled adoption through in aerospace and medical devices.
The remaining obstacle sits outside the enterprise. A prime can adopt whatever it likes, but only 41% of suppliers can open a model without a drawing, and a third-tier machine shop running an old computer aided manufacturing seat cannot be compelled to re-tool. Forcing common software failed repeatedly. Neutral exchange formats now carry 47% of transfers, which is what actually unblocked the supply chain problem.
"Everyone in this field has spent thirty years arguing that the model is better than the drawing, and everyone was right and it changed nothing. What moved adoption was a metrology programmer saving two days a week and a defence customer writing it into a contract."
Director, Industrial Software and Digital Engineering Practice · MMA Technology and Industrial Software Practice · September 2026

Market Trends

Inspection Payback Carries The Whole Business Case

Authoring benefits are real and diffuse, which makes them impossible to defend in a capital request. Inspection benefits are narrow and measurable: programming a coordinate measuring machine from tolerances already embedded in the model removes manual transcription entirely, cutting setup effort by roughly 62% and eliminating the re-entry errors that cause most first article failures. Quality functions have become the internal sponsors of model-based definition as a result, which is not where any vendor expected to find them. Growth at 17.1% is half again the market rate of 11.4%, and the segment now pulls authoring adoption behind it.
Market Impact: Reaches 3 supply chain tiers
Neutral Formats Solve What Common Software Never Could

Two decades of attempts to make supply chains adopt matching software failed, because a third-tier machine shop will not replace a working seat to suit a customer. Neutral exchange formats carrying full geometry, tolerances and semantic annotation now handle 47% of transfers, letting a prime send authoritative definition to a supplier running anything at all. Validation tooling that proves the translated model matches the original is what made this trustworthy rather than merely possible. The standards work was slow and unglamorous and it accomplished what a great deal of software investment did not.
Market Impact: Removes 2 parallel records

Market Opportunities and Growth Drivers

Defence Digital Engineering Requirements Flow Down Contractually

Defence departments have written digital engineering and model-based definition expectations into acquisition policy, and primes flow those requirements down to their suppliers as a condition of bidding. That converts adoption from an efficiency argument nobody wins into a commercial requirement nobody can refuse. The effect reaches deep into supply chains, since a tier-three supplier bidding on a defence programme inherits obligations written several levels above it. This is the driver that actually moves budgets, and it explains why aerospace and defence adoption runs years ahead of automotive. Persuasion plays no part in it.
Market Impact: Adds 23% to engineering cost

Regulated Industries Need Traceable Definition Control

Medical device and aerospace regulators require demonstrable control over the product definition used to manufacture and inspect, including how changes propagate and who approved them. Maintaining that evidence across parallel drawings and models is genuinely difficult and audit findings frequently result. A single authoritative annotated model with configuration management attached is easier to defend in an audit than two representations that must be proven identical. Quality and regulatory affairs functions have therefore become sponsors of this technology rather than obstacles to it. That is a reversal of the usual position, where quality functions resist change rather than sponsoring it.
Market Impact: Excludes 59% of suppliers

Market Restraints and Challenges

Dual Maintenance Costs More Than Either Approach Alone

Running annotated models alongside drawings adds roughly 23% to engineering cost while delivering no additional information, and every change must be made twice and proven consistent. The root cause is that the drawing remains the contractual deliverable while the model is the working definition, so neither can be abandoned. Commercial impact is a business case that looks worse after adoption than before it, which is why so many programmes stall halfway. Mitigation runs through securing customer acceptance of the model as the controlled deliverable, generating drawings automatically where they are still demanded, and confining dual maintenance to legacy programmes only.
Market Impact: Cuts setup effort 62%

Supplier Capability Stops At The Enterprise Boundary

Only 41% of suppliers can consume an annotated model without an accompanying drawing, and the remainder are small shops running software a decade old with no commercial reason to change. The root cause is that the benefit accrues to the customer while the cost falls on the supplier. Commercial impact is adoption that works inside a company and fails at its boundary, which is where most manufacturing actually happens. Participants mitigate through neutral formats, free viewer tooling, supplier development programmes and in some cases funding supplier upgrades directly because the customer benefit justifies it.
Market Impact: Carries 47% of exchanges
3 additional market trends, 4 additional growth drivers, and 2 additional restraints and challenges are covered in the full report. Contact sales@marketmindsadvisory.com to access the complete intelligence.

Segment CAGR and Growth Architecture

Segmentation follows the technology function performed, which is how these products are licensed and how buyers budget for them. Authoring, annotation tooling, inspection programming, translation and validation, process planning integration and configuration management each solve a different part of the problem and carry genuinely different adoption curves. Buyers increasingly purchase them from different vendors.
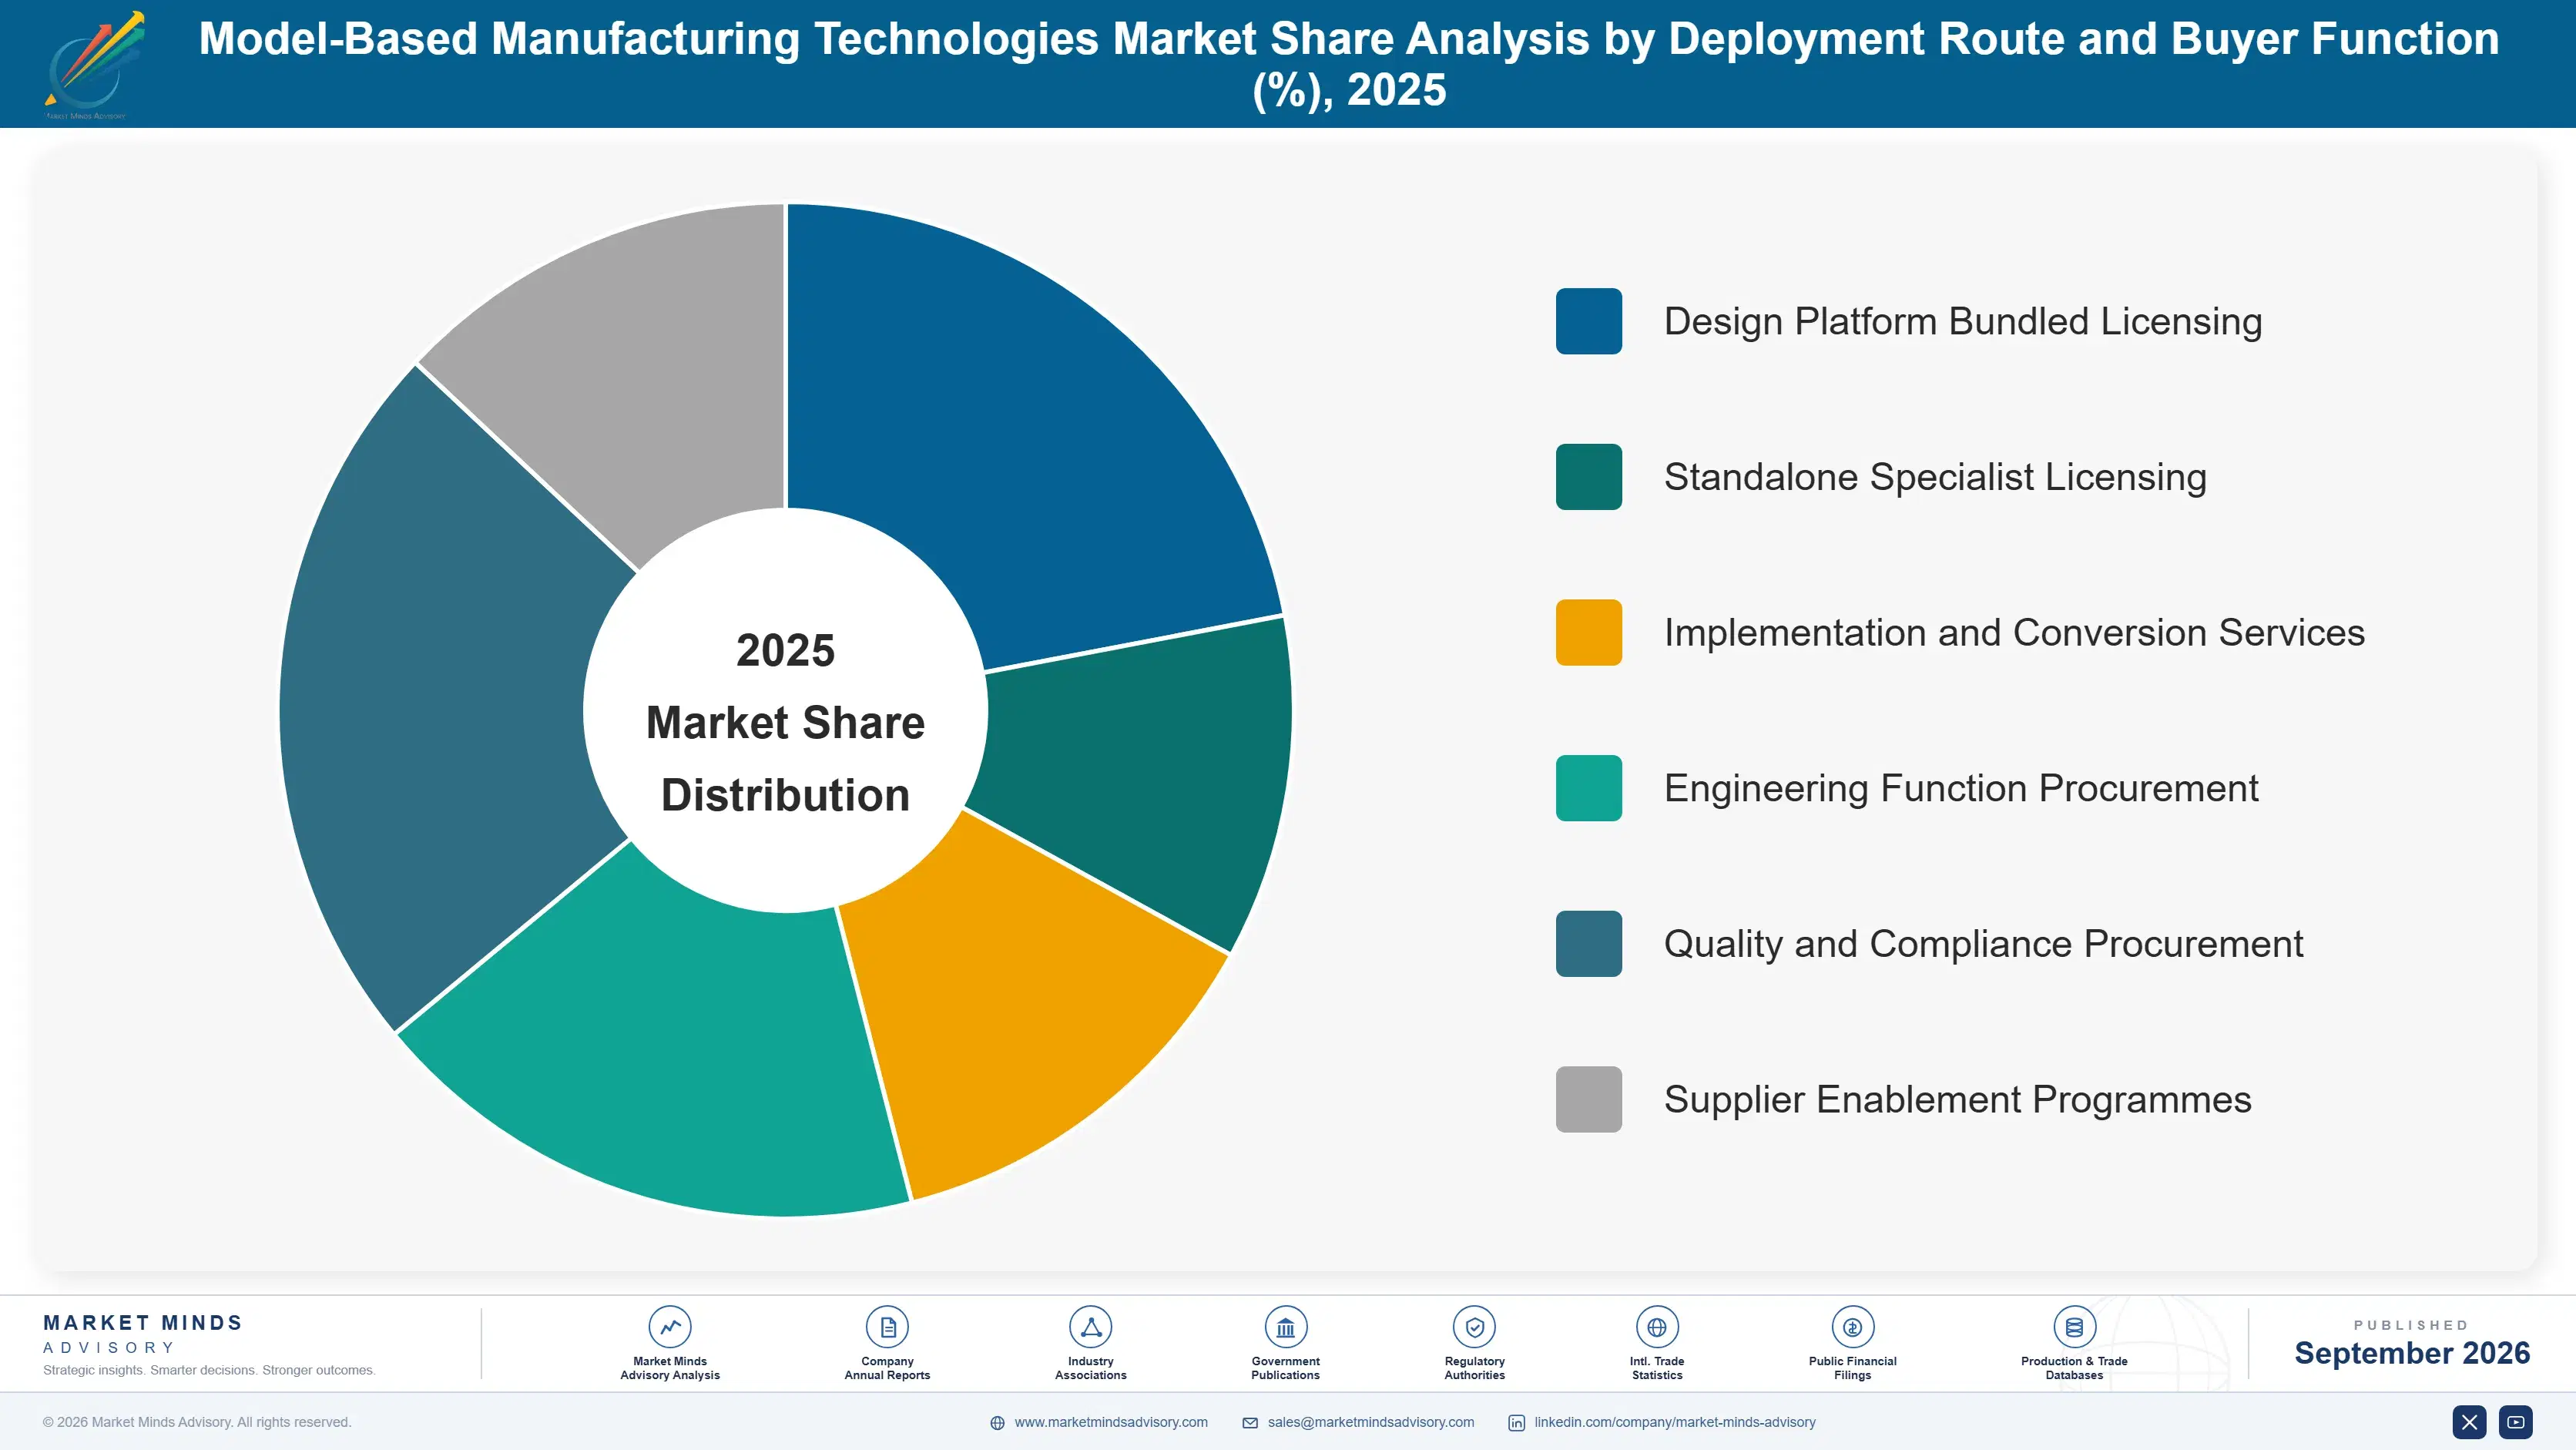
model-based-manufacturing-technologies-market-market-share-analysis-1788414389297

Model-Based Inspection and Metrology

This is where the measurable return sits and therefore where budget approval is easiest to obtain. Programming a coordinate measuring machine from tolerances embedded in the model removes the manual transcription that consumes setup time and produces most first article inspection error, cutting programming effort by roughly 62%. Quality functions have become the internal sponsors of adoption as a result, which is not where vendors historically directed their selling effort. Growth at 17.1% is half again the market rate of 11.4%. The segment now pulls authoring adoption behind it rather than following it, which reverses the sequence every vendor roadmap assumed. Vendors historically directed their selling effort at engineering management instead.
CAGR 17.1%

Neutral Format Translation and Validation

Translation tooling carries geometry, tolerances and semantic annotation between systems, and validation tooling proves the translated result matches the original well enough to manufacture from. That second half is what made neutral exchange trustworthy rather than merely technically possible, and it is why these formats now carry 47% of transfers. Demand comes from primes needing to reach suppliers running anything at all, which is a permanent requirement rather than a transitional one. Growth at 15.4% reflects supply chain reach becoming the practical constraint on adoption, and validation is increasingly bought separately from translation because it is the part auditors ask about. Customers distrust conversion performed by a party with an interest in the outcome.
CAGR 15.4%
Full segment breakdown across 6 segments available in the complete report.

Regional Architecture and Country Demand Map

Adoption follows contractual mandates and regulated industry presence rather than manufacturing output alone. North America leads because defence acquisition policy created a requirement that no efficiency argument had managed to create anywhere in three decades of trying. Manufacturing volume alone is a poor guide to where this software sells.

North America

Defence acquisition policy is the whole explanation for the regional lead. Digital engineering requirements written into programme contracts flow down through primes to suppliers as a condition of bidding, which converted a thirty year efficiency argument into a commercial obligation almost overnight. Aerospace and medical device manufacturers followed for regulatory traceability reasons rather than cost ones. Automotive adoption trails, since no equivalent mandate exists there. The supplier base remains the constraint, with primes funding tier-two and tier-three upgrades directly because the benefit accrues to them rather than to the shops being upgraded. Automotive lags on identical technology purely because no comparable customer mandate exists there, which is the clearest evidence available that this was never a capability problem.
Share: 32% | CAGR: 10.8% (2026 to 2036)

East Asia

Japanese and Korean manufacturers adopted annotated models early inside their own operations, driven by precision manufacturing requirements and by unusually close integration between design and production functions. Chinese adoption is growing quickly across aerospace, rail and electronics, supported by domestic software alternatives as well as international products. The region manufactures more than anywhere else, so supplier capability gaps here affect global supply chains rather than only local ones. Regional growth of 12.4% reflects genuine industrial adoption rather than the contractual compulsion driving North America. Domestic software alternatives compete effectively against international products here in a way they do not elsewhere, and supplier capability gaps in this region affect supply chains well beyond it. Volume matters.
Share: 26% | CAGR: 12.4% (2026 to 2036)
Regional intelligence for 5 additional markets available in the complete report: Western Europe, South Asia and Pacific, Latin America, Middle East and Africa, Eastern Europe. Contact sales@marketmindsadvisory.com.
model-based-manufacturing-technologies-market-country-cagr-analysis-1788414389825

Where Adoption Actually Gets Funded

Four positions carry margin in a market where the technical argument was settled long ago and the commercial one was not. Each involves selling to a function or solving a problem that vendors historically ignored, which is why the field grew slowly despite products that worked perfectly well throughout. None of them involves any better software.

Sell Through Quality Rather Than Engineering

Inspection programming from embedded tolerances cuts setup effort by roughly 62% and removes the transcription errors behind most first article failures, which is a saving a finance function will approve without argument. Authoring productivity claims are diffuse and lose that argument every time. Quality functions have become the internal sponsors of adoption and vendors calling on engineering are addressing the wrong buyer entirely. This inverts thirty years of sales practice and the vendors who noticed first are growing considerably faster than the rest. Finance approves numbers, not arguments. That reverses thirty years of selling practice.
Market Impact: Delivers a verifiable 62% reduction in setup time

Solve The Supplier Boundary Not The Enterprise

Only 41% of suppliers can consume a model without a drawing, and adoption inside a company delivers little if it stops at the loading dock. Neutral format translation with validation now handles 47% of exchanges, and free viewer tooling extends reach further. Vendors selling only enterprise seats leave the actual problem unsolved and watch programmes stall at the boundary. Selling supplier enablement to the customer who benefits, rather than to the supplier who bears the cost, is the commercial insight most vendors have still not acted on. Most manufacturing happens outside the enterprise that adopted the technology.
Market Impact: Reaches the 59% of suppliers now excluded entirely

Attach To Contractual Mandates Very Deliberately

Defence digital engineering requirements flowing down through 3 supply chain tiers convert adoption from a choice into a bidding condition, and vendors positioned against those requirements sell into obligation rather than persuasion. That means tracking acquisition policy and prime flow-down language rather than industry productivity studies. Regulated industry definition control requirements work the same way. Vendors treating mandates as a market segment rather than as a sales trigger are missing the sequence entirely, since the requirement arrives before any budget does. The requirement always arrives before the budget does, which is exactly when a vendor should already be present.
Market Impact: Follows mandates down across 3 supply chain tiers

Sell Validation Separately From The Translation

Proving that a translated model still means what the original meant is the part auditors ask about, and it is increasingly purchased separately from the translation itself. That separation matters because validation is bought by quality and compliance while translation is bought by engineering, and they hold different budgets on different cycles. Vendors bundling the two sell one licence where two were available. Neutral exchange now carries 47% of transfers, so the addressable base for validation is expanding faster than most vendors have noticed. Quality and engineering hold separate budgets on separate cycles.
Market Impact: Addresses the 47% now using neutral exchange formats

Who Controls the Margin Pool

Measured on licence and services revenue, the basis used throughout this section, the top five hold 58%. Concentration reflects the fact that most of this capability is sold alongside the design software a manufacturer already runs, which gives the large platform vendors a position specialists cannot attack directly. The gap between leaders and the rest is installed design seat base rather than any difference in model-based capability.
Competition runs on interoperability, inspection integration and increasingly on supplier enablement rather than on authoring features, which buyers regard as settled. Platform vendors bundle model-based capability into design suites. Metrology vendors approach from the inspection side and reach the quality buyer directly. Independent translation and validation specialists hold positions precisely because customers distrust conversion performed by a party with an interest in the outcome.

Pressure builds from two directions. Neutral formats commoditise the interoperability that platform vendors once monetised through proprietary exchange, which erodes a genuine lock-in. And the quality function emerging as the buyer favours metrology vendors whose relationships sit there already rather than design platform vendors calling on engineering. Rankings shift where vendors built inspection integration and supplier reach rather than deepening authoring capability nobody was asking for.
model-based-manufacturing-technologies-market-company-positioning-matrix-1788414390350

Competitive Moat and Risk Dimensions

DASSAULT SYSTEMES

Moat: Installed aerospace design base

An enormous installed design seat base across aerospace and defence gives the company direct access to exactly the programmes where contractual mandates create demand, and model-based capability sells alongside software those customers already run. Configuration management depth supports the traceability that regulated industries require. Displacing it means displacing the design platform itself, which almost never happens mid-programme.
DASSAULT SYSTEMES

Risk: Neutral formats erode exchange lock-in

Proprietary exchange advantages have historically discouraged customers from mixing vendors, and neutral formats carrying full semantic annotation remove that friction deliberately. Supply chain reach now depends on standards the company does not control. The quality function emerging as the buyer sits outside the engineering relationships the company has spent decades building and values different things entirely.
SIEMENS DIGITAL INDUSTRIES SOFTWARE

Moat: Design to shop floor continuity

Capability spanning design, process planning, manufacturing execution and automation gives the company a continuity from annotated model to machine that pure design vendors cannot match, and the digital thread argument is far more credible when the same vendor owns both ends. Automotive and machinery relationships are deep. Manufacturing execution positions reach the shop floor where models must be usable.
SIEMENS DIGITAL INDUSTRIES SOFTWARE

Risk: Breadth against inspection specialists

The inspection and metrology segment growing at 17.1% is contested by specialists whose relationships with quality functions and measurement hardware run deeper than a broad platform can replicate. Breadth is an advantage in enterprise negotiations and a disadvantage in a departmental purchase decided on measurement outcomes. Integrating acquired capability across a very wide portfolio has proved slow in practice.

Players Tracked

Prominent Players

Dassault Systemes
Siemens Digital Industries Software
PTC
Autodesk
Hexagon

Other Key Players

Ansys
Zuken
Aras
SAP
Capvidia
Elysium
Anark
Theorem Solutions
Kubotek
Datakit
Verisurf Software
Mitutoyo
Zeiss Industrial Quality Solutions
Renishaw
Wipro

Recent Developments

JANUARY 2025

Defence acquisition policy tightens digital engineering flow-down

Revised acquisition guidance strengthened model-based definition and digital engineering expectations on defence programmes, with primes required to flow the obligations down to their own suppliers. Compliance became a condition of bidding rather than a stated preference within programme documentation. Suppliers were given defined transition periods.
Signal: A contractual obligation achieved in a few months what three decades of efficiency argument never once managed.
SEPTEMBER 2024

Standards body publishes updated neutral three-dimensional exchange format

A recognised standards organisation released an updated neutral exchange specification carrying geometry, tolerances and semantic annotation together, addressing the fidelity gaps that had previously required a drawing to accompany any transferred model. Validation requirements were strengthened alongside the format itself. Validation conformance testing accompanied it.
Signal: Standards work rather than software investment is what finally reached the suppliers running entirely incompatible systems.
APRIL 2025

Metrology and design vendors certify annotation interoperability

A metrology software provider and a design platform vendor announced certified interoperability for semantic product manufacturing information, a technical collaboration rather than any acquisition or joint venture. Direct measurement programming from embedded tolerances without manual re-entry was the stated objective. Certification covered several tolerance types.
Signal: Inspection integration is now where these vendors cooperate, because that is where customers actually see returns.

Engineering Labour And Standards Work

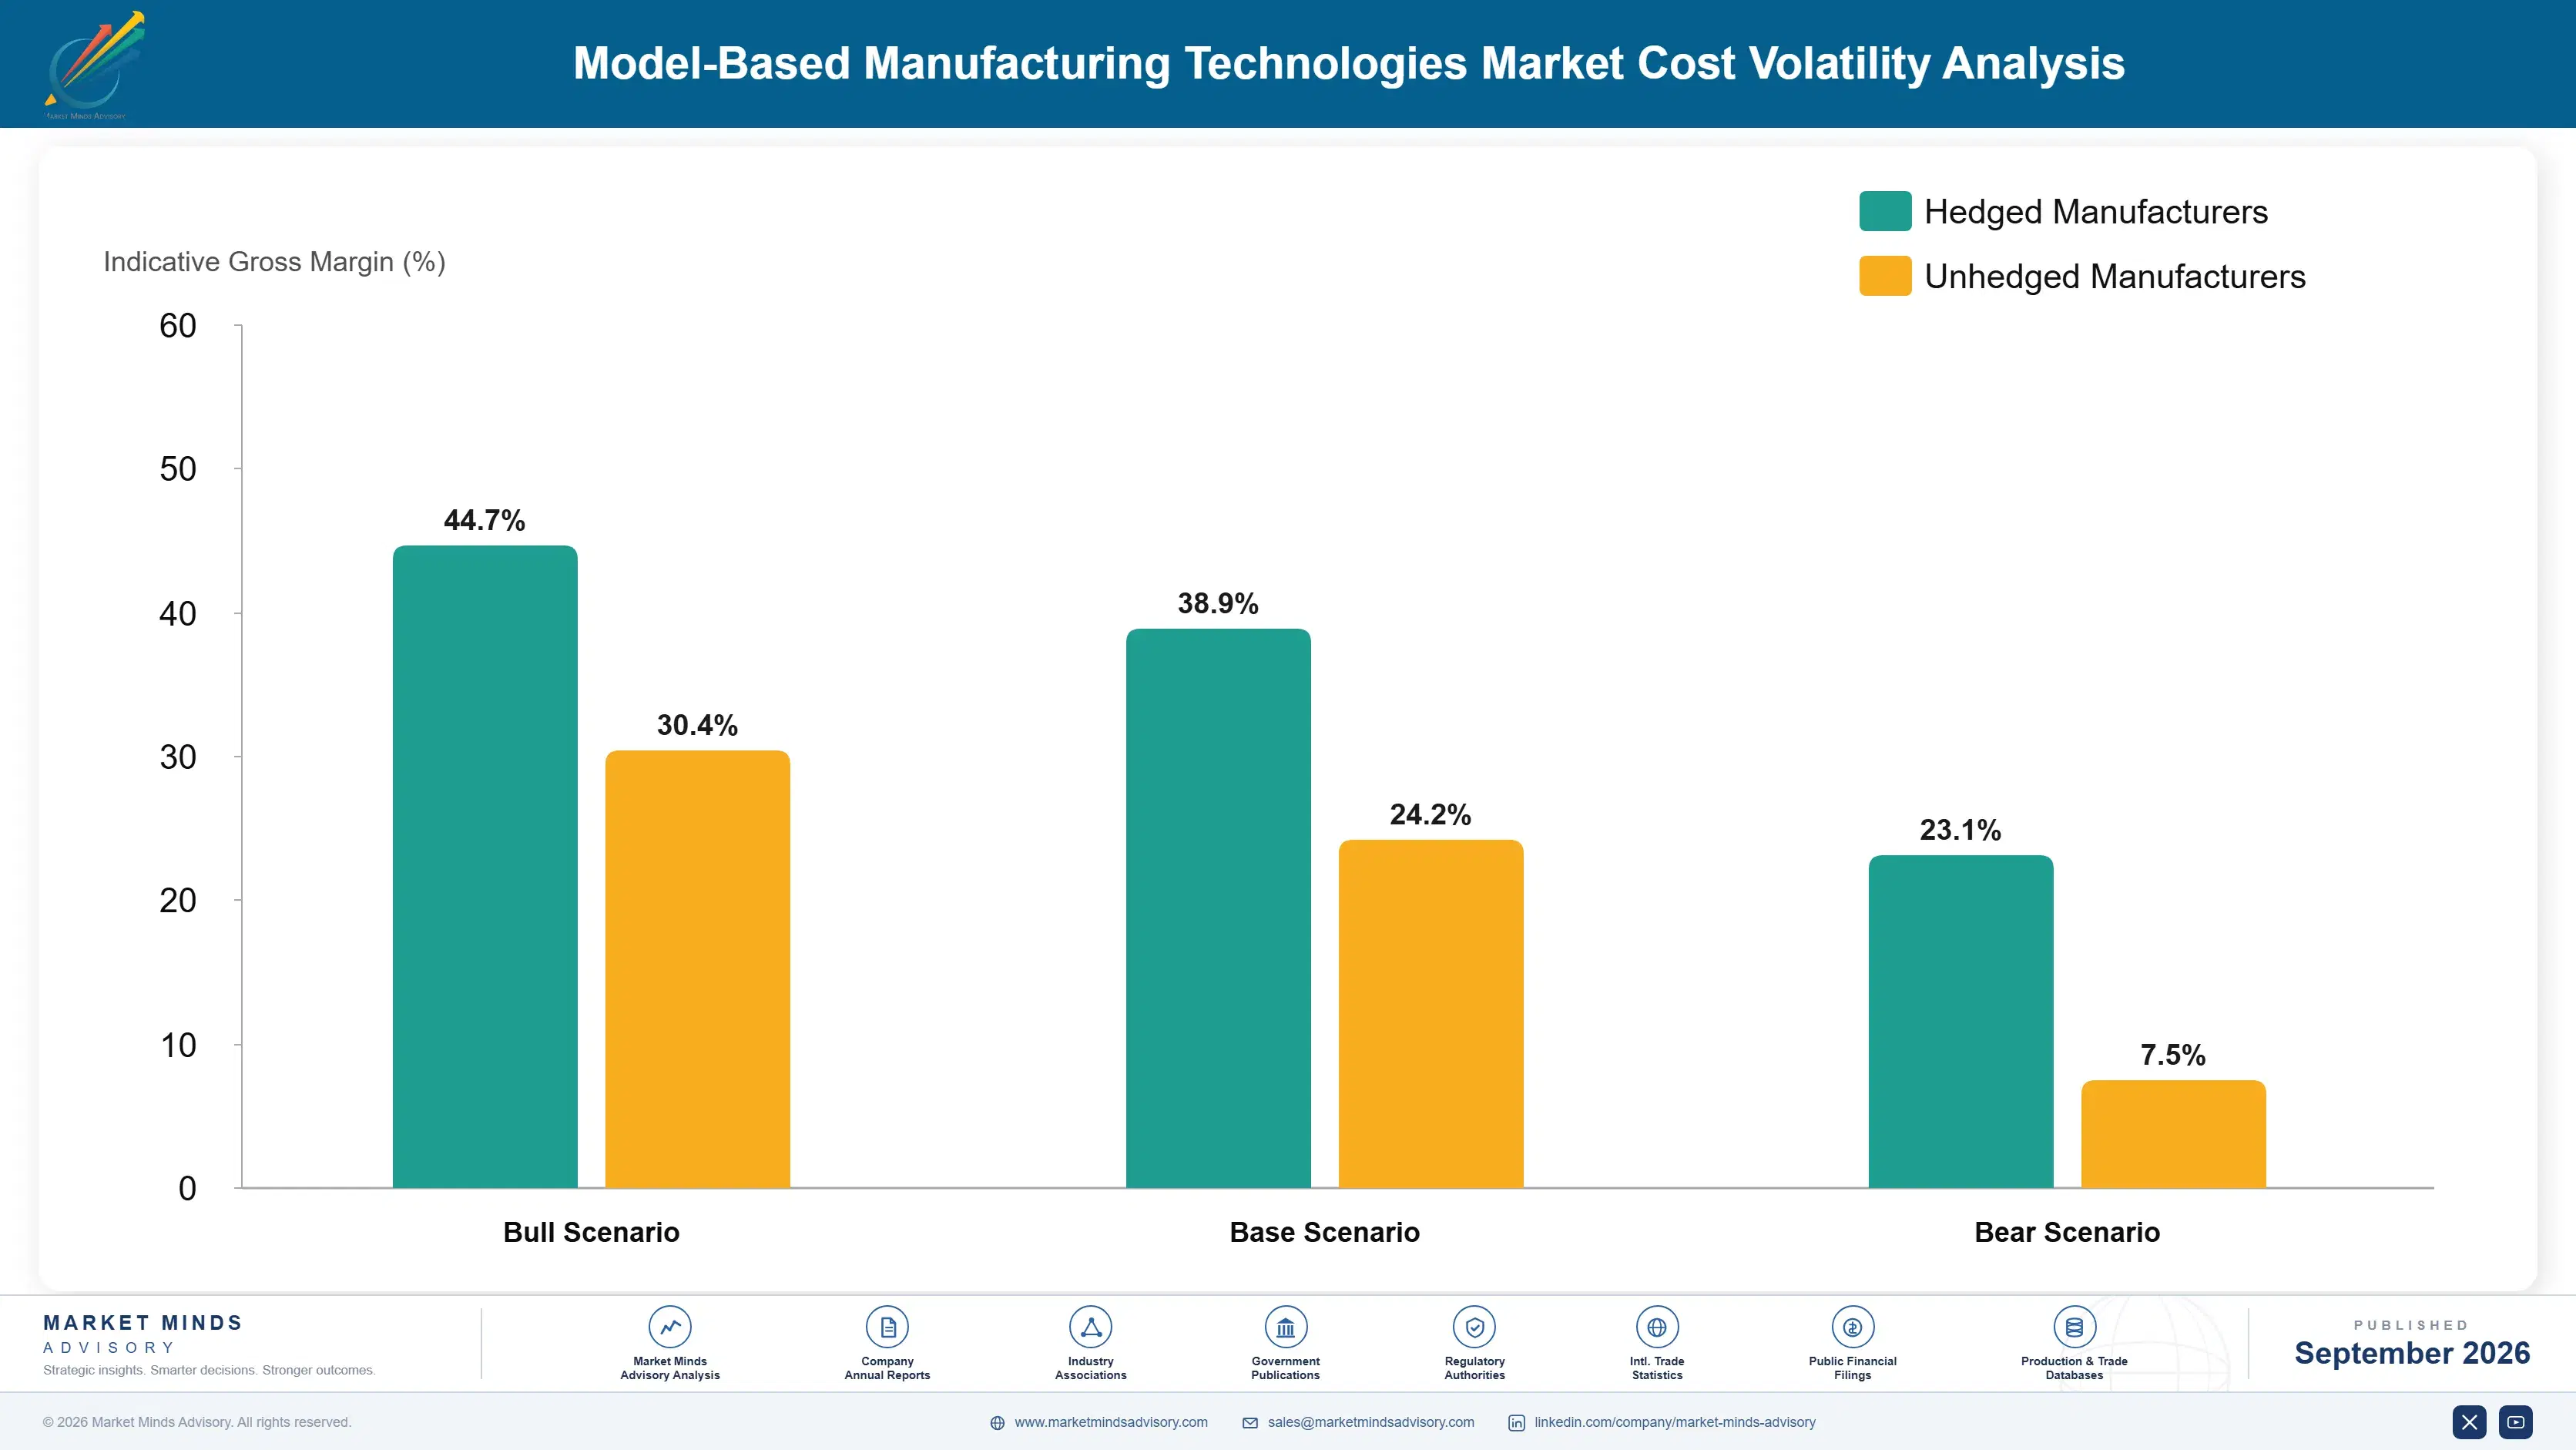
Software research and development labour accounts for roughly 44% of vendor cost, implementation and conversion services around 26%, channel and partner margin near 14%, and standards participation, hosting and commercial overhead the balance. The services component is unusually large for a software market because conversion, annotation and inspection programming are labour-intensive tasks that no product eliminates entirely.
Software engineering compensation rose sharply through the period, with United States Bureau of Labor Statistics occupational data showing sustained wage growth across the relevant categories, and vendors disclosed increased research expense in results covering those years. Conversion services labour behaved differently, since much of it is performed in India where rates rose more slowly, which widened the gap between vendors delivering services onshore and those delivering offshore.

The disadvantage mechanism is delivery model rather than scale. A vendor whose implementation work is performed by onshore consultants carries a cost base that an offshore delivery model undercuts substantially on identical scope. Standards participation is a further asymmetry, since it costs real engineering time and produces benefits every competitor shares equally. Vendors avoiding that work free-ride on the specifications their competitors funded.
model-based-manufacturing-technologies-market-cost-volatility-analysis-1788414390544

Offshore delivery for conversion and annotation work

Drawing conversion, annotation and inspection programming are repeatable and labour-intensive, which makes them well suited to offshore delivery where deep practical expertise has already accumulated. Vendors retaining that work onshore carry a cost base competitors undercut on identical scope, and customers have become entirely comfortable with the arrangement. Security classification is the only real limit on it.

Standards participation shared across consortium members

Neutral format specification work costs real engineering time and produces benefits every participant shares, which invites free-riding. Consortium structures that distribute the effort across members make continued participation defensible internally, and the vendors absent from that work consistently find the resulting specifications suit somebody else's architecture better than their own. Absence is expensive later.

Productising repeatable implementation patterns

Much implementation work repeats across customers within an industry, and converting those patterns into configured templates moves revenue from services into licensing at considerably better margin. It requires deliberate investment that a services organisation measured on utilisation has no natural incentive to make at all. Utilisation targets work directly against this, which is why it so rarely happens.

Portfolio Architecture for Margin Defence

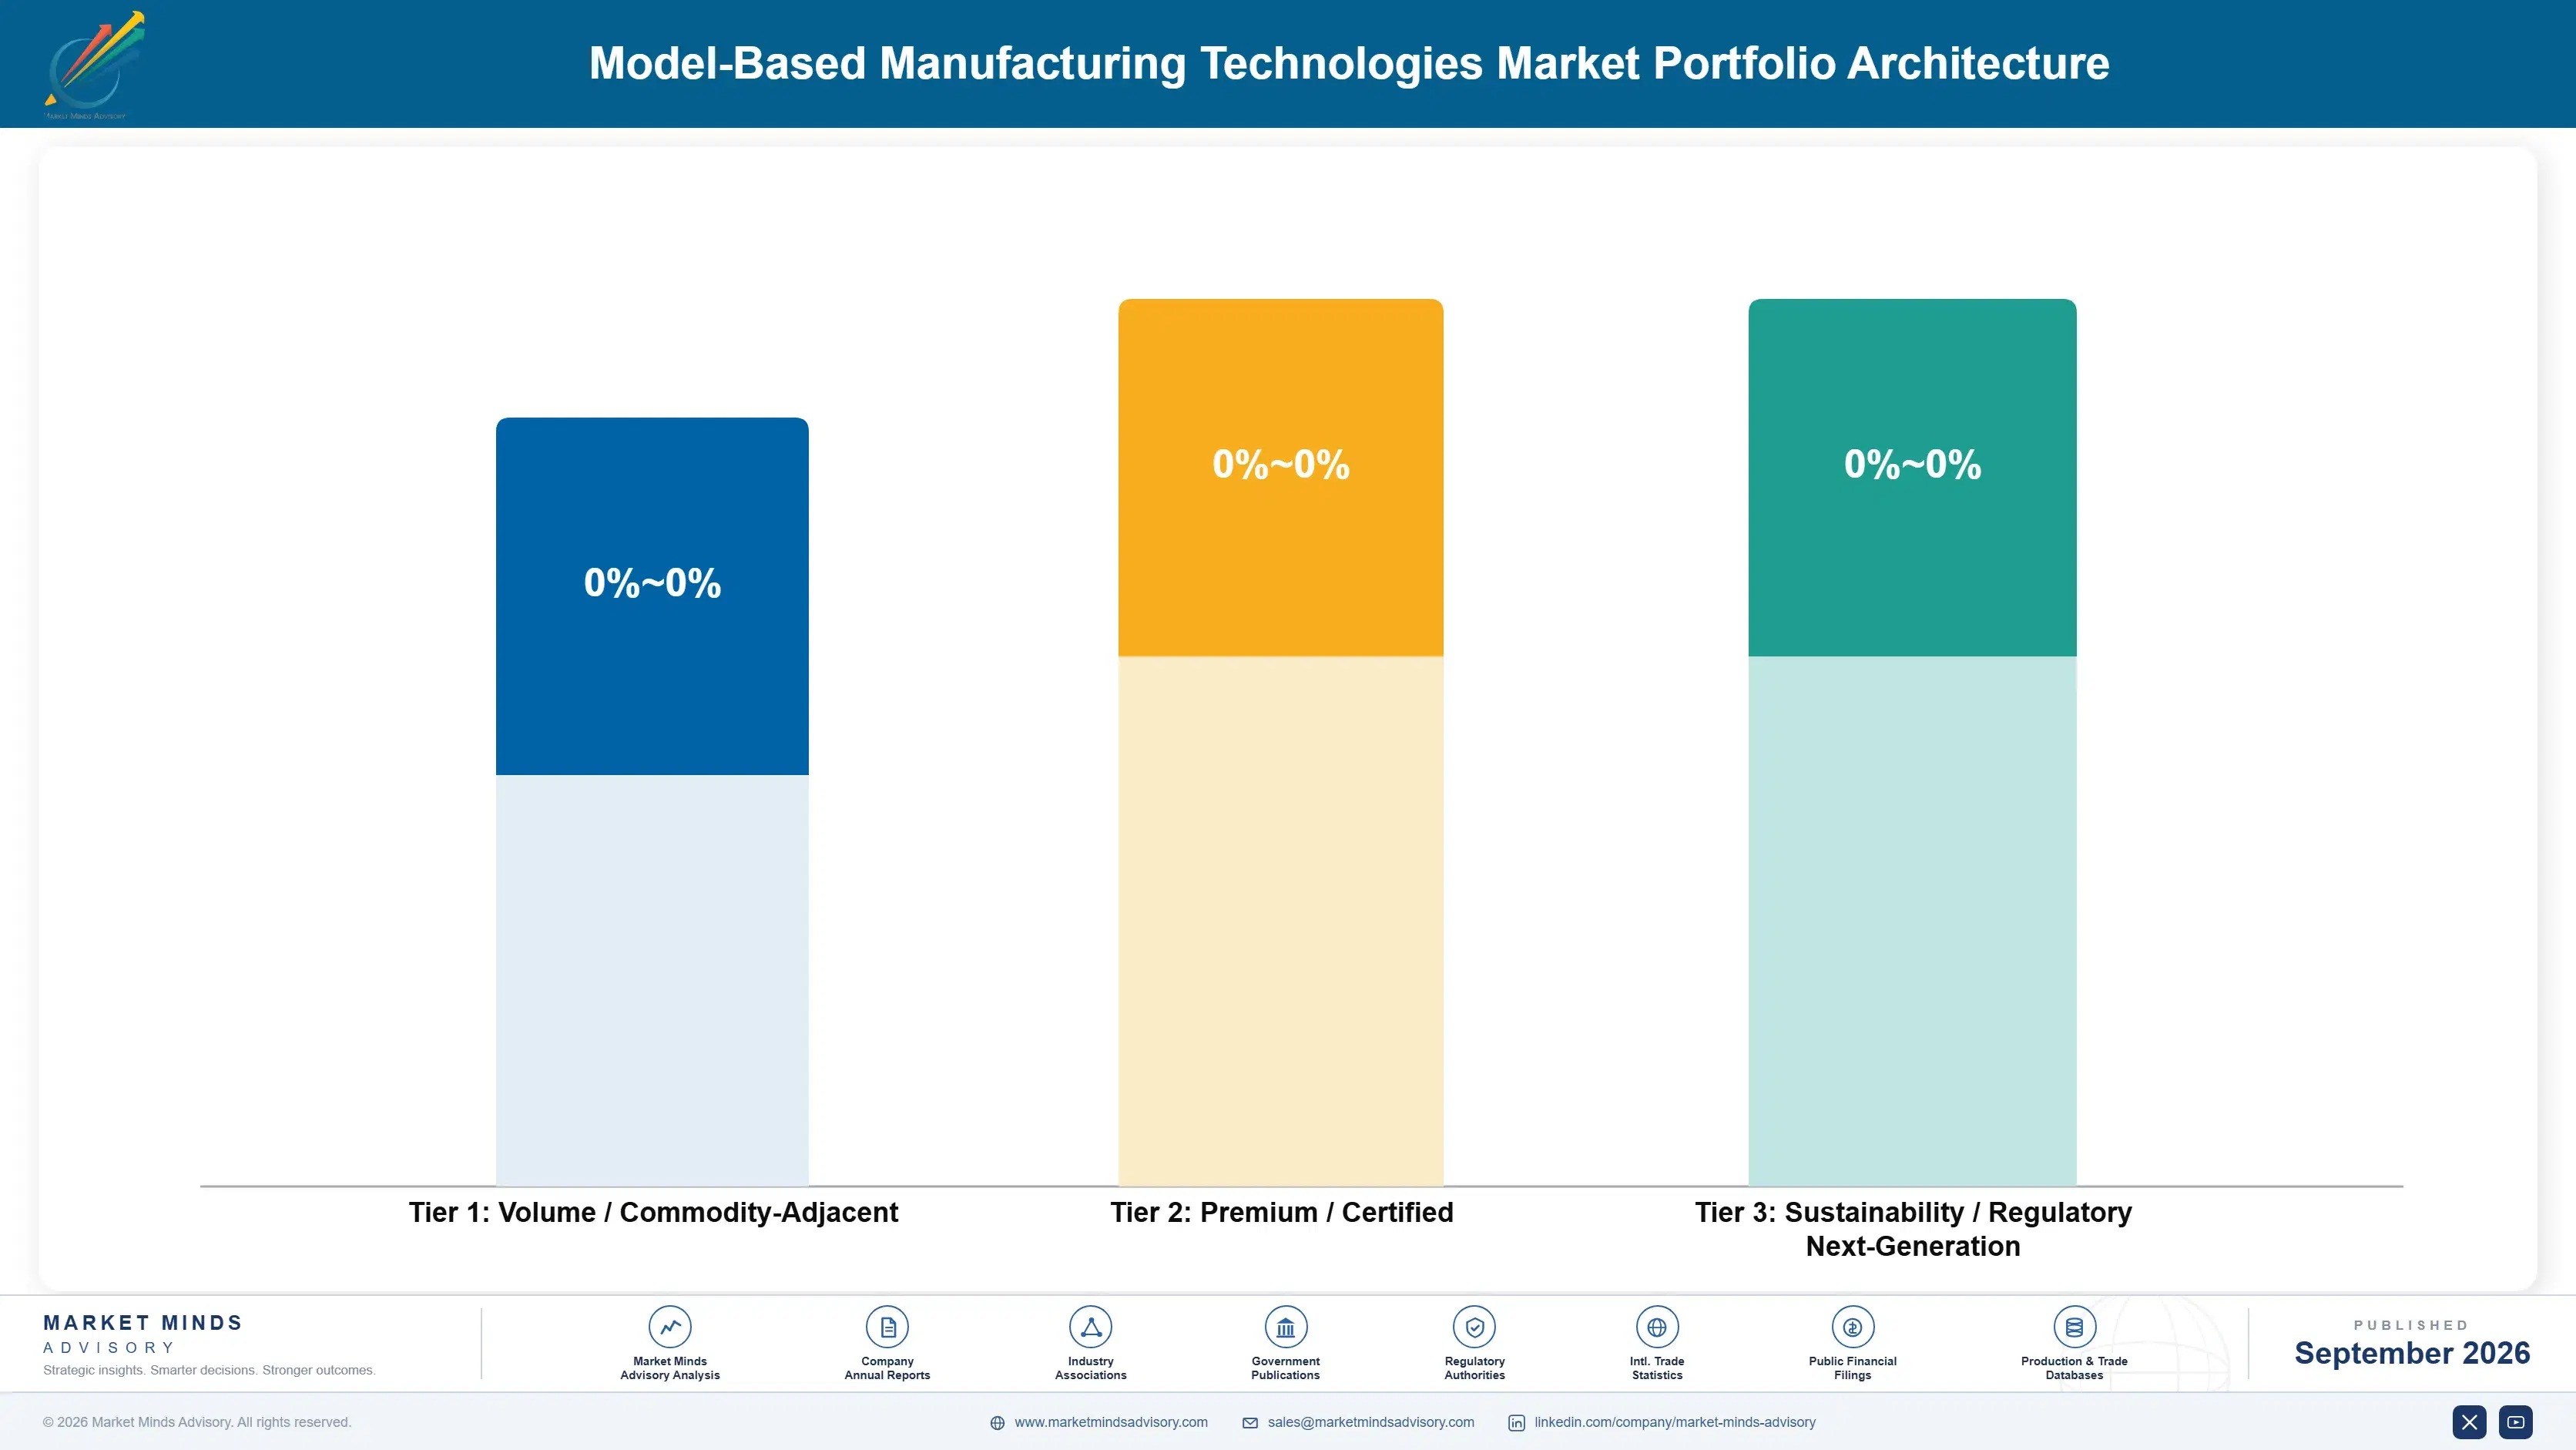
Margin separates by whether the buyer can measure the outcome. Authoring and annotation tooling is sold on productivity arguments that finance functions discount heavily, and it competes against a design platform vendor bundling comparable capability into a renewal. Inspection programming and validation are sold against measurable savings and audit requirements, where the buyer has a number to defend and the vendor prices against the saving rather than against a competitor's list.
The volume against premium tension runs through services rather than product. Conversion and annotation work is labour-intensive, scales with headcount and generates the customer relationships through which licensing eventually arrives, so no vendor can refuse it. But it is the lowest margin activity in the market and consumes delivery capacity that productised implementation would free. The vendors doing well have industrialised that work offshore rather than abandoning it.

High-value pools sit where a mandate or an audit creates the requirement: defence contractual compliance, regulated industry definition control and validation evidence for translated models. Each is bought because something external demands it rather than because someone chose it, which makes the demand far more durable than any efficiency argument produces. The pools are narrow and carry disproportionate margin.

Volume / Commodity-Adjacent

Conversion, annotation and implementation services delivered largely by offshore teams. Scales with headcount rather than software, generates the relationships through which licensing arrives, and carries the lowest margin in the market by a clear distance.
Gross Margin: 34 to 44%

Premium / Certified

Authoring, annotation tooling and process planning integration licensed alongside design platforms. The 12 point range reflects whether the vendor holds the design platform relationship or is selling alongside somebody else's installed base.
Gross Margin: 58 to 70%

Sustainability / Regulatory / Next-Generation

Inspection programming, validation evidence and configuration management sold against audit and contractual requirements. The 14 point range reflects how completely an external mandate changes pricing against a discretionary purchase. Mandates change everything.
Gross Margin: 66 to 80%
model-based-manufacturing-technologies-market-portfolio-architecture-1788414391052

High-value Sub-segments and Strategic Watch-out

Model-Based Inspection Programming

Highest value position and the segment carrying the whole business case, cutting setup effort by roughly 62% against a number a finance function will verify. Quality rather than engineering holds this budget, which most vendors discovered late. The internal sponsor sits well outside engineering entirely.
Gross Margin: 68 to 80%

Translation Validation Evidence

Bought by compliance and quality separately from the translation itself, because it is the part an auditor asks about. Neutral exchange now carries 47% of transfers, so the addressable base is expanding faster than vendors have noticed. Compliance buys it on a separate approval cycle.
Gross Margin: 64 to 76%

Authoring And Annotation Tooling

Sold on productivity arguments that finance functions discount, and increasingly bundled into design platform renewals by vendors who hold that relationship. Necessary to the portfolio rather than attractive as a standalone growth position. Platform vendors bundle it into renewals that competitors cannot reach at all.
Gross Margin: 58 to 70%

Onshore Conversion Services

Undercut consistently by offshore delivery of identical scope that customers have become entirely comfortable with. Revenue continues only where security classification prevents offshoring, and nowhere else worth defending with investment. Customers became entirely comfortable with offshore delivery years ago, and nothing will reverse that now.
Gross Margin: 28 to 38%

Who Signs Off The Definition

Annuity economics come from the programme rather than from any renewal cycle. A manufacturing programme adopting model-based definition commits to it for the product's life, which in aerospace or medical devices means decades, and changing the authoritative definition mid-programme requires requalification nobody will fund. That makes these positions extremely durable once won and correspondingly difficult to win in the first place.
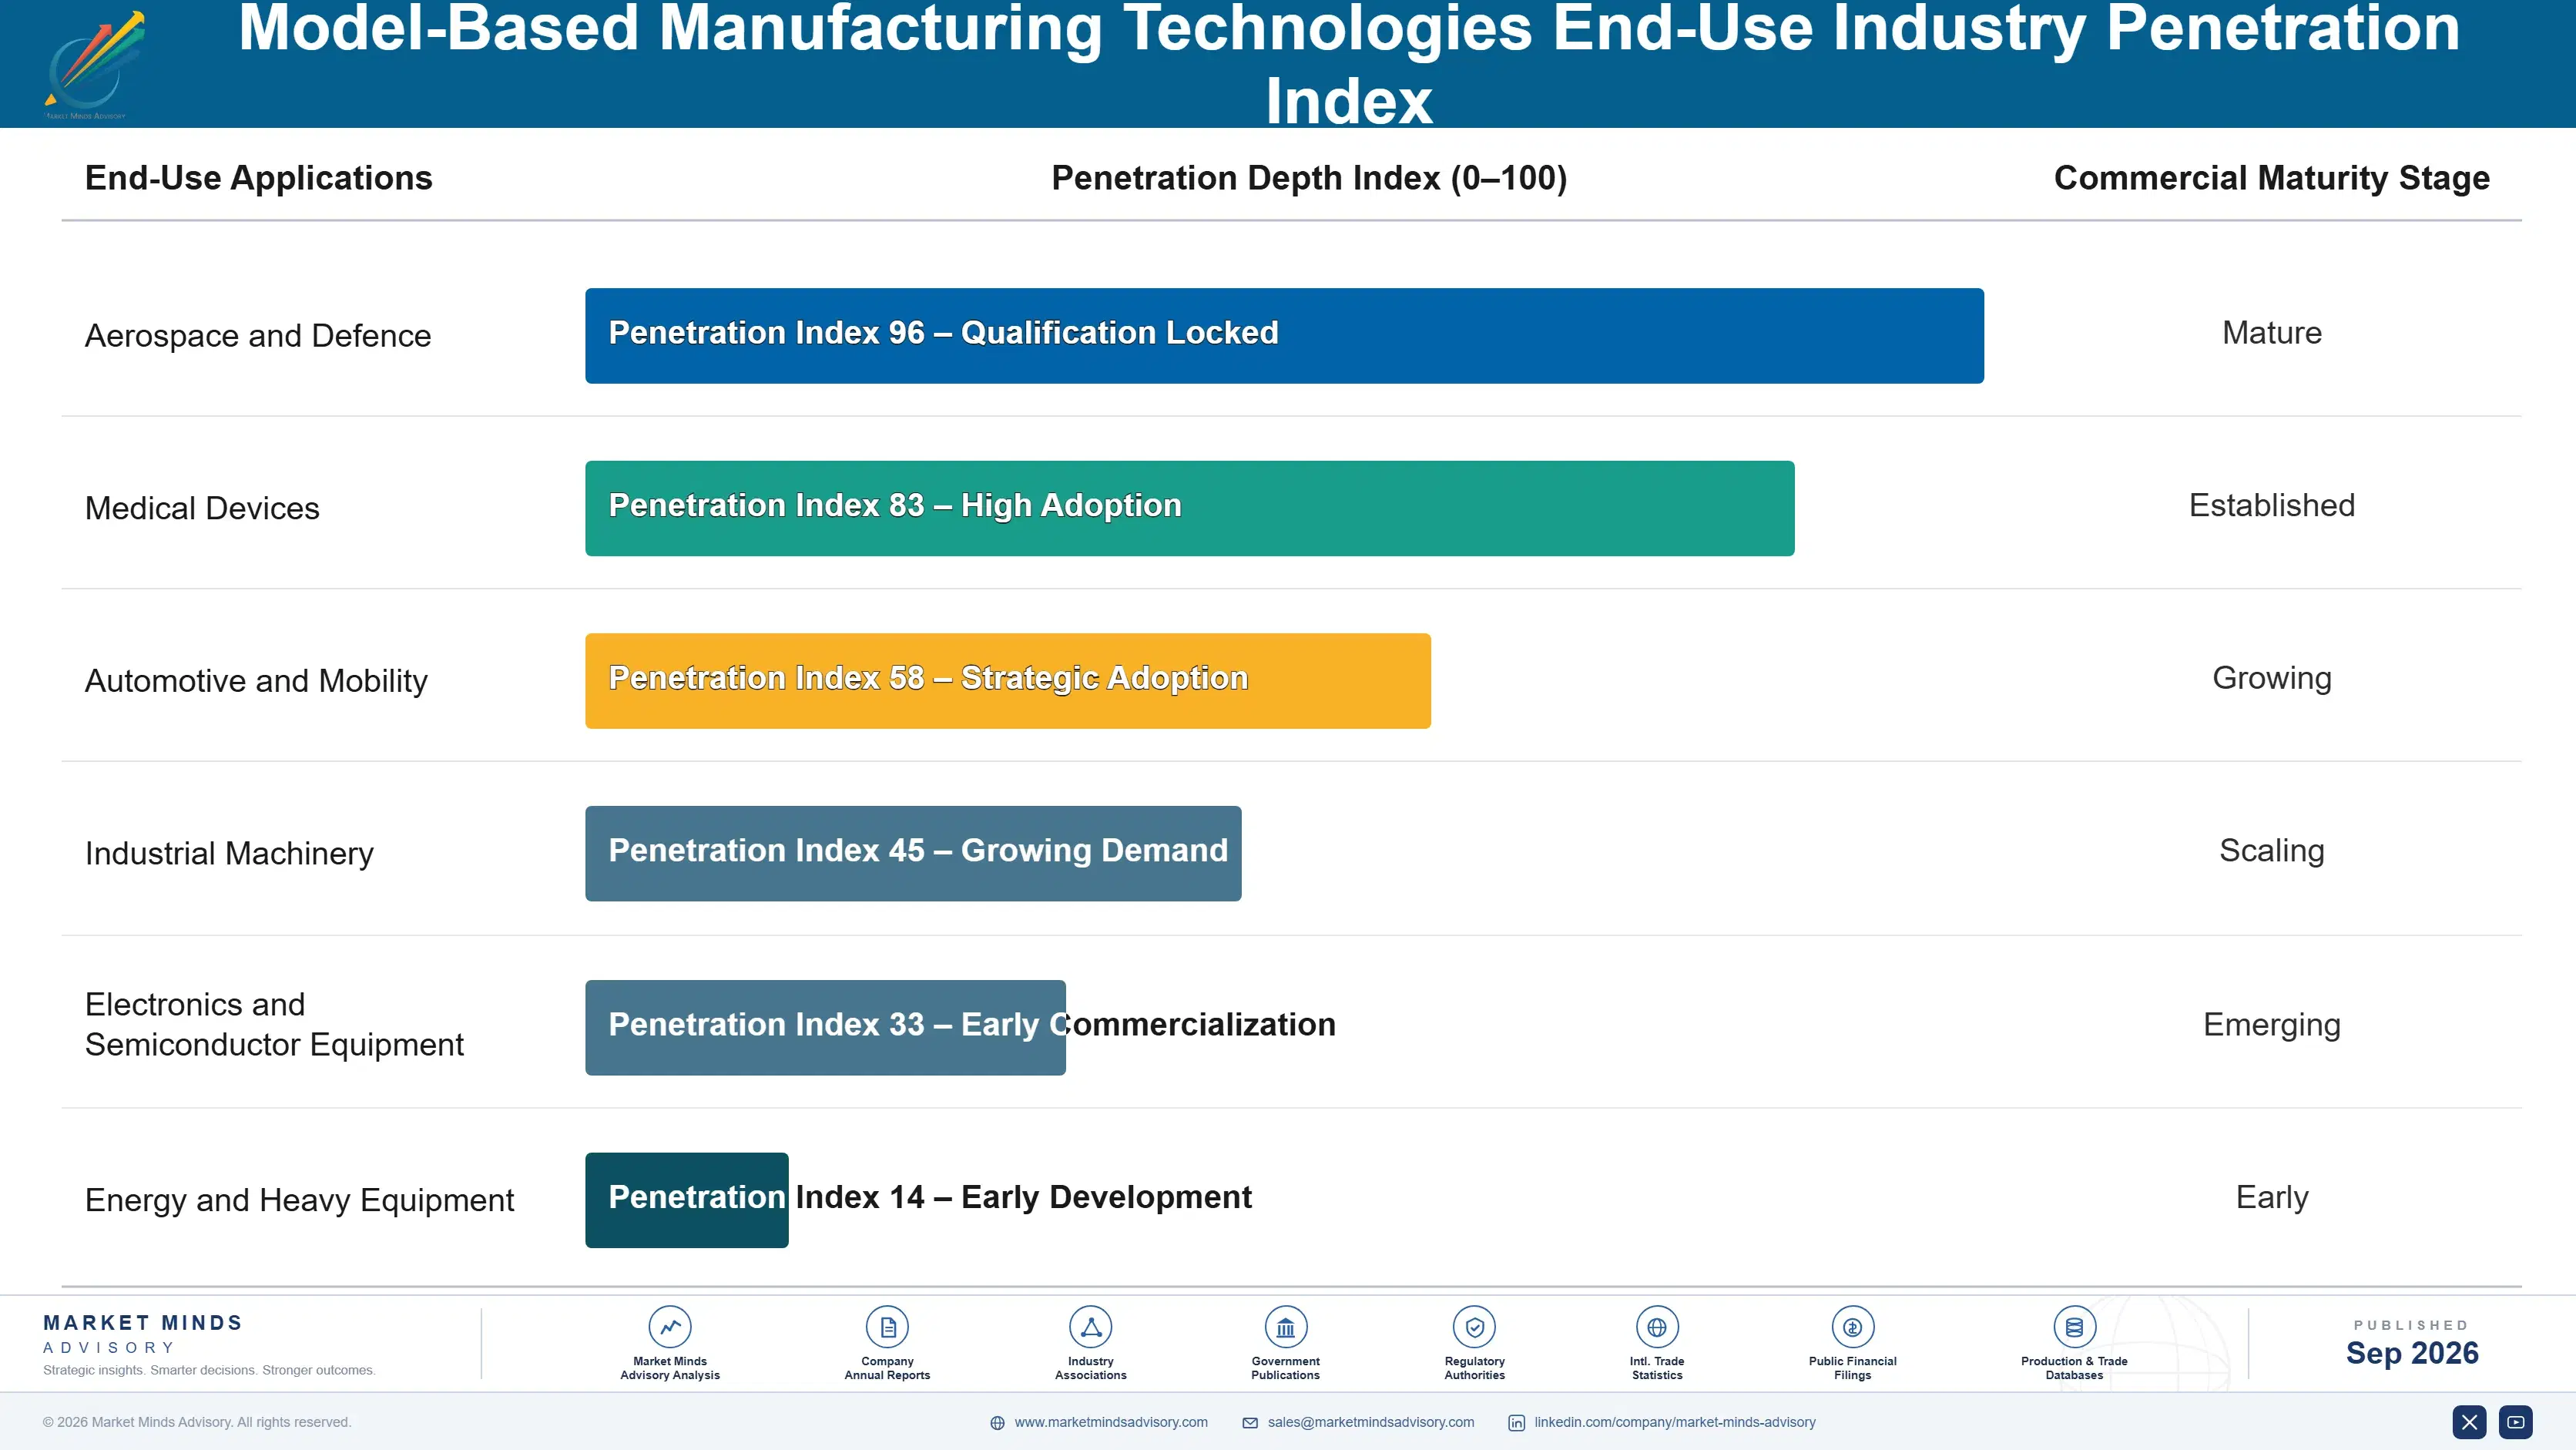
Adoption depth varies enormously by industry. Aerospace and defence specify deeply because a customer contract requires it, and their suppliers inherit obligations several tiers down. Medical device manufacturers adopt for audit traceability and go further than anyone on configuration control. Automotive and general machinery adopt selectively where a specific problem justifies it, and small suppliers adopt only what a customer forces them to adopt and no more.

The buyer profile has moved somewhere vendors did not expect. This was sold for decades to engineering management on productivity grounds, and it now sells to quality and compliance functions on measurable inspection savings and audit defensibility. Those functions hold different budgets, run different approval cycles and ask entirely different questions. Vendors whose entire commercial organisation calls on engineering are addressing a buyer who no longer decides.
model-based-manufacturing-technologies-market-end-use-penetration-index-1788414391538

Where Vendors Should Compete

These are among the four positions where our research anticipates prominent divergence between winners and laggards over the coming forecast period. Each is grounded in the demand model, the regulatory perimeter, and the announced capacity pipeline.
01 / QUALITY FUNCTION SELLING

Call on inspection, not on engineering management

Programming a coordinate measuring machine from embedded tolerances cuts setup effort by roughly 62% and removes the transcription errors behind most first article failures, which is a saving a finance function will approve without any argument. Authoring productivity claims are diffuse by nature and lose that argument every single time they are put forward. Quality functions have quietly become the internal sponsors of adoption, and vendors whose commercial organisation calls only on engineering are addressing a buyer who no longer decides anything.
02 / SUPPLIER BOUNDARY REACH

Fix the loading dock before the design office

Only 41% of suppliers can consume an annotated model without a drawing, so adoption inside a company delivers very little indeed when it stops at the boundary where manufacturing actually happens. Neutral translation with validation now carries 47% of exchanges and free viewer tooling extends that reach considerably further. Selling supplier enablement to the customer who benefits, rather than to the supplier who bears the cost, is the commercial insight most vendors in this market have still not properly acted upon.
03 / MANDATE ATTACHMENT TIMING

Track acquisition policy, not productivity studies

Defence digital engineering requirements flowing down through three separate supply chain tiers convert adoption from a choice into a condition of bidding, which is why aerospace runs years ahead of automotive on what is identical underlying technology. Vendors positioned against those requirements are selling into obligation rather than persuasion, which is an entirely different kind of sale to make. Tracking acquisition policy and prime contract flow-down language matters far more commercially than any amount of industry productivity research ever will.
04 / VALIDATION REVENUE SEPARATION

Unbundle proof from translation and sell both

Proving that a translated model still means what the original meant is the part an auditor asks about, and it is increasingly bought separately by quality and compliance functions holding different budgets on entirely different approval cycles. Vendors bundling validation into translation sell one licence where two licences were genuinely available to them instead. Neutral exchange now carries 47% of transfers, so the addressable base for validation is expanding faster than most vendors in this market appear to have noticed.

Engagement Snapshot From the Field

A live engagement with an industry participant carrying material or product regulatory and market exposure ahead of a defining policy shift, showing how our research translates into a defensible multi-year portfolio strategy.
MARKET MINDS ADVISORY · CLIENT ENGAGEMENT SUMMARY
Model-Based Manufacturing Technologies Producer Strategic Portfolio Review and Transition Roadmap 2026·Investment Scenario on Model-Based Manufacturing Technologies Exposure Evaluation 2025-26
CLIENT PROFILE
An aerospace structures and systems supplier operating six manufacturing sites across North America and Europe, with annual revenue reported at approximately USD 1.8 billion (client-reported, unverified by MMA). Prime customers had begun flowing down model-based definition requirements contractually, and the business was maintaining annotated models and drawings in parallel across every single active programme it held.
STRATEGIC CHALLENGE
Dual maintenance was adding cost the business could not recover in pricing, and an internal programme to eliminate drawings had stalled twice. Management could not determine whether the obstacle was internal capability, supplier readiness or the contractual position, and each function blamed a different one of the three. Nobody had measured any of it.
MMA APPROACH
MMA measured the actual cost of dual maintenance across four programmes, surveyed the client's own supplier base on ability to consume annotated models without drawings, and examined the contractual language governing deliverables with both prime customers and suppliers. Inspection programming time was measured directly rather than estimated. Customer contract terms were read directly.
KEY FINDINGS
  1. Dual maintenance was adding roughly 23% to engineering cost across active programmes, considerably more than management had assumed and entirely unrecovered in customer pricing.
  2. Only 41% of the client's own suppliers could consume an annotated model without a drawing, and the shortfall concentrated in the smallest machining and finishing shops.
  3. Inspection programming from embedded tolerances cut setup time by around 62% where it had been trialled, and nobody had presented that number to the finance function.
  4. Prime customer contracts already permitted the annotated model as the controlled deliverable on two programmes, and the client had continued issuing drawings purely out of habit.
CLIENT PROFILE
An aerospace structures and systems supplier operating six manufacturing sites across North America and Europe, with annual revenue reported at approximately USD 1.8 billion (client-reported, unverified by MMA). Prime customers had begun flowing down model-based definition requirements contractually, and the business was maintaining annotated models and drawings in parallel across every single active programme it held.
STRATEGIC CHALLENGE
Dual maintenance was adding cost the business could not recover in pricing, and an internal programme to eliminate drawings had stalled twice. Management could not determine whether the obstacle was internal capability, supplier readiness or the contractual position, and each function blamed a different one of the three. Nobody had measured any of it.
MMA APPROACH
MMA measured the actual cost of dual maintenance across four programmes, surveyed the client's own supplier base on ability to consume annotated models without drawings, and examined the contractual language governing deliverables with both prime customers and suppliers. Inspection programming time was measured directly rather than estimated. Customer contract terms were read directly.
KEY FINDINGS
  1. Dual maintenance was adding roughly 23% to engineering cost across active programmes, considerably more than management had assumed and entirely unrecovered in customer pricing.
  2. Only 41% of the client's own suppliers could consume an annotated model without a drawing, and the shortfall concentrated in the smallest machining and finishing shops.
  3. Inspection programming from embedded tolerances cut setup time by around 62% where it had been trialled, and nobody had presented that number to the finance function.
  4. Prime customer contracts already permitted the annotated model as the controlled deliverable on two programmes, and the client had continued issuing drawings purely out of habit.
RECOMMENDED STRATEGY
Phase 1: Phase one: stop issuing drawings on the two programmes where customer contracts already permit the annotated model as the controlled deliverable. Phase 2: Phase two: fund neutral format viewer and validation tooling for the smallest suppliers directly, since the benefit accrues to the client rather than to them. Phase 3: Phase three: rebuild the internal business case around measured inspection savings and present it to finance rather than to engineering management.
OUTCOME
Within eleven months the client had eliminated drawings on two programmes, raised supplier model capability from 41% to 68%, and reported engineering cost per programme down 9.4% (client-reported, unverified by MMA). Extension to the remaining programmes is proceeding steadily as customer contracts come up for renegotiation.

Frequently Asked Questions

Foundational context covering the market sizes, CAGR, scope, country, region and competition that inform every finding below. This section is provided to cover basics and most often pre-purchase conversations, answered from the MMA Primary Research Dataset.

What is the current size of the Model-Based Manufacturing Technologies Market?

The market was valued at USD 2.2 billion in 2025 and reaches USD 2.45 billion in 2026. Contractual mandates rather than efficiency arguments drive most of the current adoption.

How large will the Model-Based Manufacturing Technologies Market be by 2036?

MMA forecasts USD 7.21 billion by 2036, an increase of USD 4.76 billion over the 2026 base. That represents an expansion multiple of 2.94 times.

What is the CAGR for the Model-Based Manufacturing Technologies Market 2026 to 2036?

The base case CAGR is 11.4%, with a bull case of 12.6% and a bear case of 10.2%. The historical rate between 2020 and 2025 was 10.2%.

Which segment is growing fastest?

Model-based inspection and metrology grows at 17.1%, half again the market rate of 11.4%. Programming measurement directly from embedded tolerances cuts setup effort by around 62%.

Who are the major companies in the Model-Based Manufacturing Technologies Market?

Dassault Systemes, Siemens Digital Industries Software, PTC, Autodesk and Hexagon lead on measured licence and services revenue. Together they account for roughly 58% of the market.

Which country is growing fastest?

India grows fastest at 16.2%, through engineering services firms performing conversion, annotation and inspection programming at volume for Western primes and now for domestic manufacturers.

Report Segmentation Architecture

The full report scope spans multiple orthogonal segmentation dimensions, with cross-tabulated demand data provided for each dimension pair. Coverage extends further to regional breakdowns, trend trajectories, and the competitive detail needed to support segment-level decision-making.

By Technology Function

  • Model-Based Definition Authoring
  • Product Manufacturing Information Tooling
  • Model-Based Inspection and Metrology
  • Neutral Format Translation and Validation
  • Model-Based Process Planning Integration
  • Digital Thread Configuration Management

By End-Use Industry

  • Aerospace and Defence
  • Medical Devices
  • Automotive and Mobility
  • Industrial Machinery
  • Electronics and Semiconductor Equipment
  • Energy and Heavy Equipment

By Deployment Route and Buyer Function

  • Design Platform Bundled Licensing
  • Standalone Specialist Licensing
  • Implementation and Conversion Services
  • Engineering Function Procurement
  • Quality and Compliance Procurement
  • Supplier Enablement Programmes

By Region

  • North America
  • East Asia
  • Western Europe
  • South Asia and Pacific
  • Latin America
  • Middle East and Africa
  • Eastern Europe

Scope, Methodology, and Coverage

Every figure in this report is reproducible from documented input assumptions. The scope below maps the historical period, the forecast horizon, the segmentation dimensions, and the countries covered, alongside the underlying primary and qualitative methodology.
Historical Period
2020 to 2025
Forecast Period
2026 to 2036
Base Year
2025 (USD billions; MMA Primary Research Dataset, September 2026)
Market Definition
The model-based manufacturing technologies market covers software and associated services that make the annotated three-dimensional model the authoritative product definition for manufacturing, spanning model-based definition authoring, product manufacturing information tooling, model-based inspection and metrology programming, neutral format translation and validation, model-based process planning with computer aided manufacturing integration, and digital thread configuration management. Sizing is measured at vendor licence, subscription and implementation services revenue. Core computer aided design seats, enterprise resource planning, machine tools, metrology hardware and shop floor execution systems are excluded.
Quantitative Units
USD billions at vendor licence, subscription and services revenue, with supporting seat counts and programme adoption rates by region
Segmentation Dimensions
Technology function, end-use industry, deployment route and buyer function, region
Regions Covered
North America, East Asia, Western Europe, South Asia and Pacific, Latin America, Middle East and Africa, Eastern Europe
Countries Covered
United States, Canada, Mexico, Brazil, Germany, France, United Kingdom, Italy, Sweden, Poland, Czech Republic, Japan, South Korea, China, India, Australia, Israel, United Arab Emirates
Key Companies Profiled
Dassault Systemes, Siemens Digital Industries Software, PTC, Autodesk, Hexagon, Ansys, Zuken, Aras, SAP, Capvidia, Elysium, Anark, Theorem Solutions, Kubotek, Datakit, Verisurf Software, Mitutoyo, Zeiss Industrial Quality Solutions, Renishaw, Wipro
Quantitative Methodology
Primary survey, n=3,800 respondents, Q4 2025, six countries; demand-side model with trade association cross-validation
Qualitative Methodology
47 expert interviews, Q4 2025; applied to validate demand model assumptions, identify emerging dynamics, and assess competitive positioning
Report Format
PDF and XLSX data workbook (Word format preview document)
Publisher
Market Minds Advisory
Report Code
MMA-2026-TEC-621
Published
September 2026
Contact
sales@marketmindsadvisory.com | www.marketmindsadvisory.com

Purchase the full Model-Based Manufacturing Technologies Market Report (2026 to 2036).

The full report treats contractual standing rather than software capability as the binding constraint, which is the framing that explains why a technically settled argument produced only partial adoption across three decades. It sizes six technology functions with individual growth rates, seven regions built from mandate presence and regulated industry density, and the supplier capability gap that stops adoption at the enterprise boundary. Competitive analysis covers twenty vendors on a consistent licence and services revenue basis, with inspection integration and supplier reach treated as the decisive variables. Input cost modelling breaks out engineering labour and services delivery exposure by location.
Six technology functions with individual growth rates
Dual maintenance cost measured across active programmes
Supplier model capability mapped by tier
Contractual mandate flow-down traced through supply chains
Twenty vendors on consistent licence revenue basis
Engineering labour and services delivery cost exposure

Built For The People Who Decide

From boardroom strategy to bench-side execution, this report is read cover-to-cover by leaders shaping the next decade of their industry, turning demand scenarios, market dynamics and valuation benchmarks into decisions.
CXOs/ Presidents/ VPs/ Managers
M&A and Corporate Development
Strategy Teams and R&D Heads
Procurement and Product Directors
Regulatory and Compliance Leaders
Investor Relations and Equity Analysts