Market Minds Advisory
Mobile Chipset Market

Mobile Chipset Market: Mobile Chipset Market: Flat Units, Node Economics and the Modem Moat, 2026 to 2036

Handset volumes stopped growing years ago and revenue keeps climbing, because leading-edge wafers and neural silicon are adding content to each device faster than the device count is falling. Shipment data hides it.

Lead Analyst

Published

September 2026

Make Smarter Decisions with Customized Research Insights

Request a free sample report and evaluate market opportunities, growth trends, and competitive dynamics relevant to your business needs.

2025 MARKET VALUE$41.0BMarket Size 2025
2036 FORECAST VALUE$101.6BBase Case , 2026 to 2036
CAGR 2026 TO 20368.6 %Bull 9.8% / Bear 7.4%
INCREMENTAL OPPORTUNITY$57.1BNet 10- year value creation
EXPANSION MULTIPLE2.28x2036 value over 2026 base
Strategic Levers
M&A Pipeline
Regional Outlook
Country Rankings
Competitive Intelligence
Segmental Deep-dive
Call-Us : 91 93563 13602

Executive Snapshot and Market Trajectory.

Unit growth ended in this market years ago. Handset shipments peaked and have drifted sideways ever since, and yet revenue keeps rising, because content per device is growing faster than device count is falling. Nobody models this correctly from shipment data. Content per device is the whole story.
Two things add that content. A leading node wafer costs roughly 3.2 times a mature one and full flagship design now runs near USD 580 million, so premium parts carry cost that must be recovered in price. And neural processing occupies about 22% of flagship die area, which barely existed as a block five years ago. Premium tier chipsets grow at 12.9%, half again the market rate of 8.6%. Mix rather than volume carries it.
Five vendors hold 86% of measured shipment revenue, which is among the most concentrated positions in any large market. The defensible part is not the processor: anyone licensing standard cores can build a competent application processor, and several have. It is the cellular modem, where carrier certification across hundreds of networks takes years that money alone cannot compress. Certification time is the one barrier capital does not overcome.
Market Definition
The mobile chipset market covers application processors and integrated system-on-chip devices supplied for smartphones, tablets, wearables and cellular companion devices, together with standalone cellular modems, spanning entry, mid and premium tiers plus wearable and tablet classes. Sizing is measured at chipset vendor shipment revenue. Patent licensing revenue reported separately, memory and storage devices, radio frequency front ends, power management integrated circuits, image sensors, connectivity combo chips and foundry manufacturing services are excluded.
Base Year Value
$41.0B in 2025 (MMA Primary Research Dataset, September 2026)
Forecast Period
2026 to 2036, eleven discrete annual values
CAGR
8.6% base case. Bull 9.8%. Bear 7.4%.
Fastest Growth Segment
Premium Tier Flagship Chipsets: 12.9% CAGR
Fastest Growth Country
India: 13.8% CAGR
Fastest Growth Region
South Asia and Pacific: 10.8% CAGR
Largest Region
East Asia: 48% of 2025 global value
Market Leaders
Qualcomm, MediaTek, Apple, Samsung Electronics, UNISOC. Source: MMA Analysis based on company annual reports and measured chipset shipment revenue.
Primary Survey
n=3,800 procurement and R&D decision-makers, Q4 2025, six countries
Methodology
Demand-side build-up, cross-validated against public data, 47 expert interviews

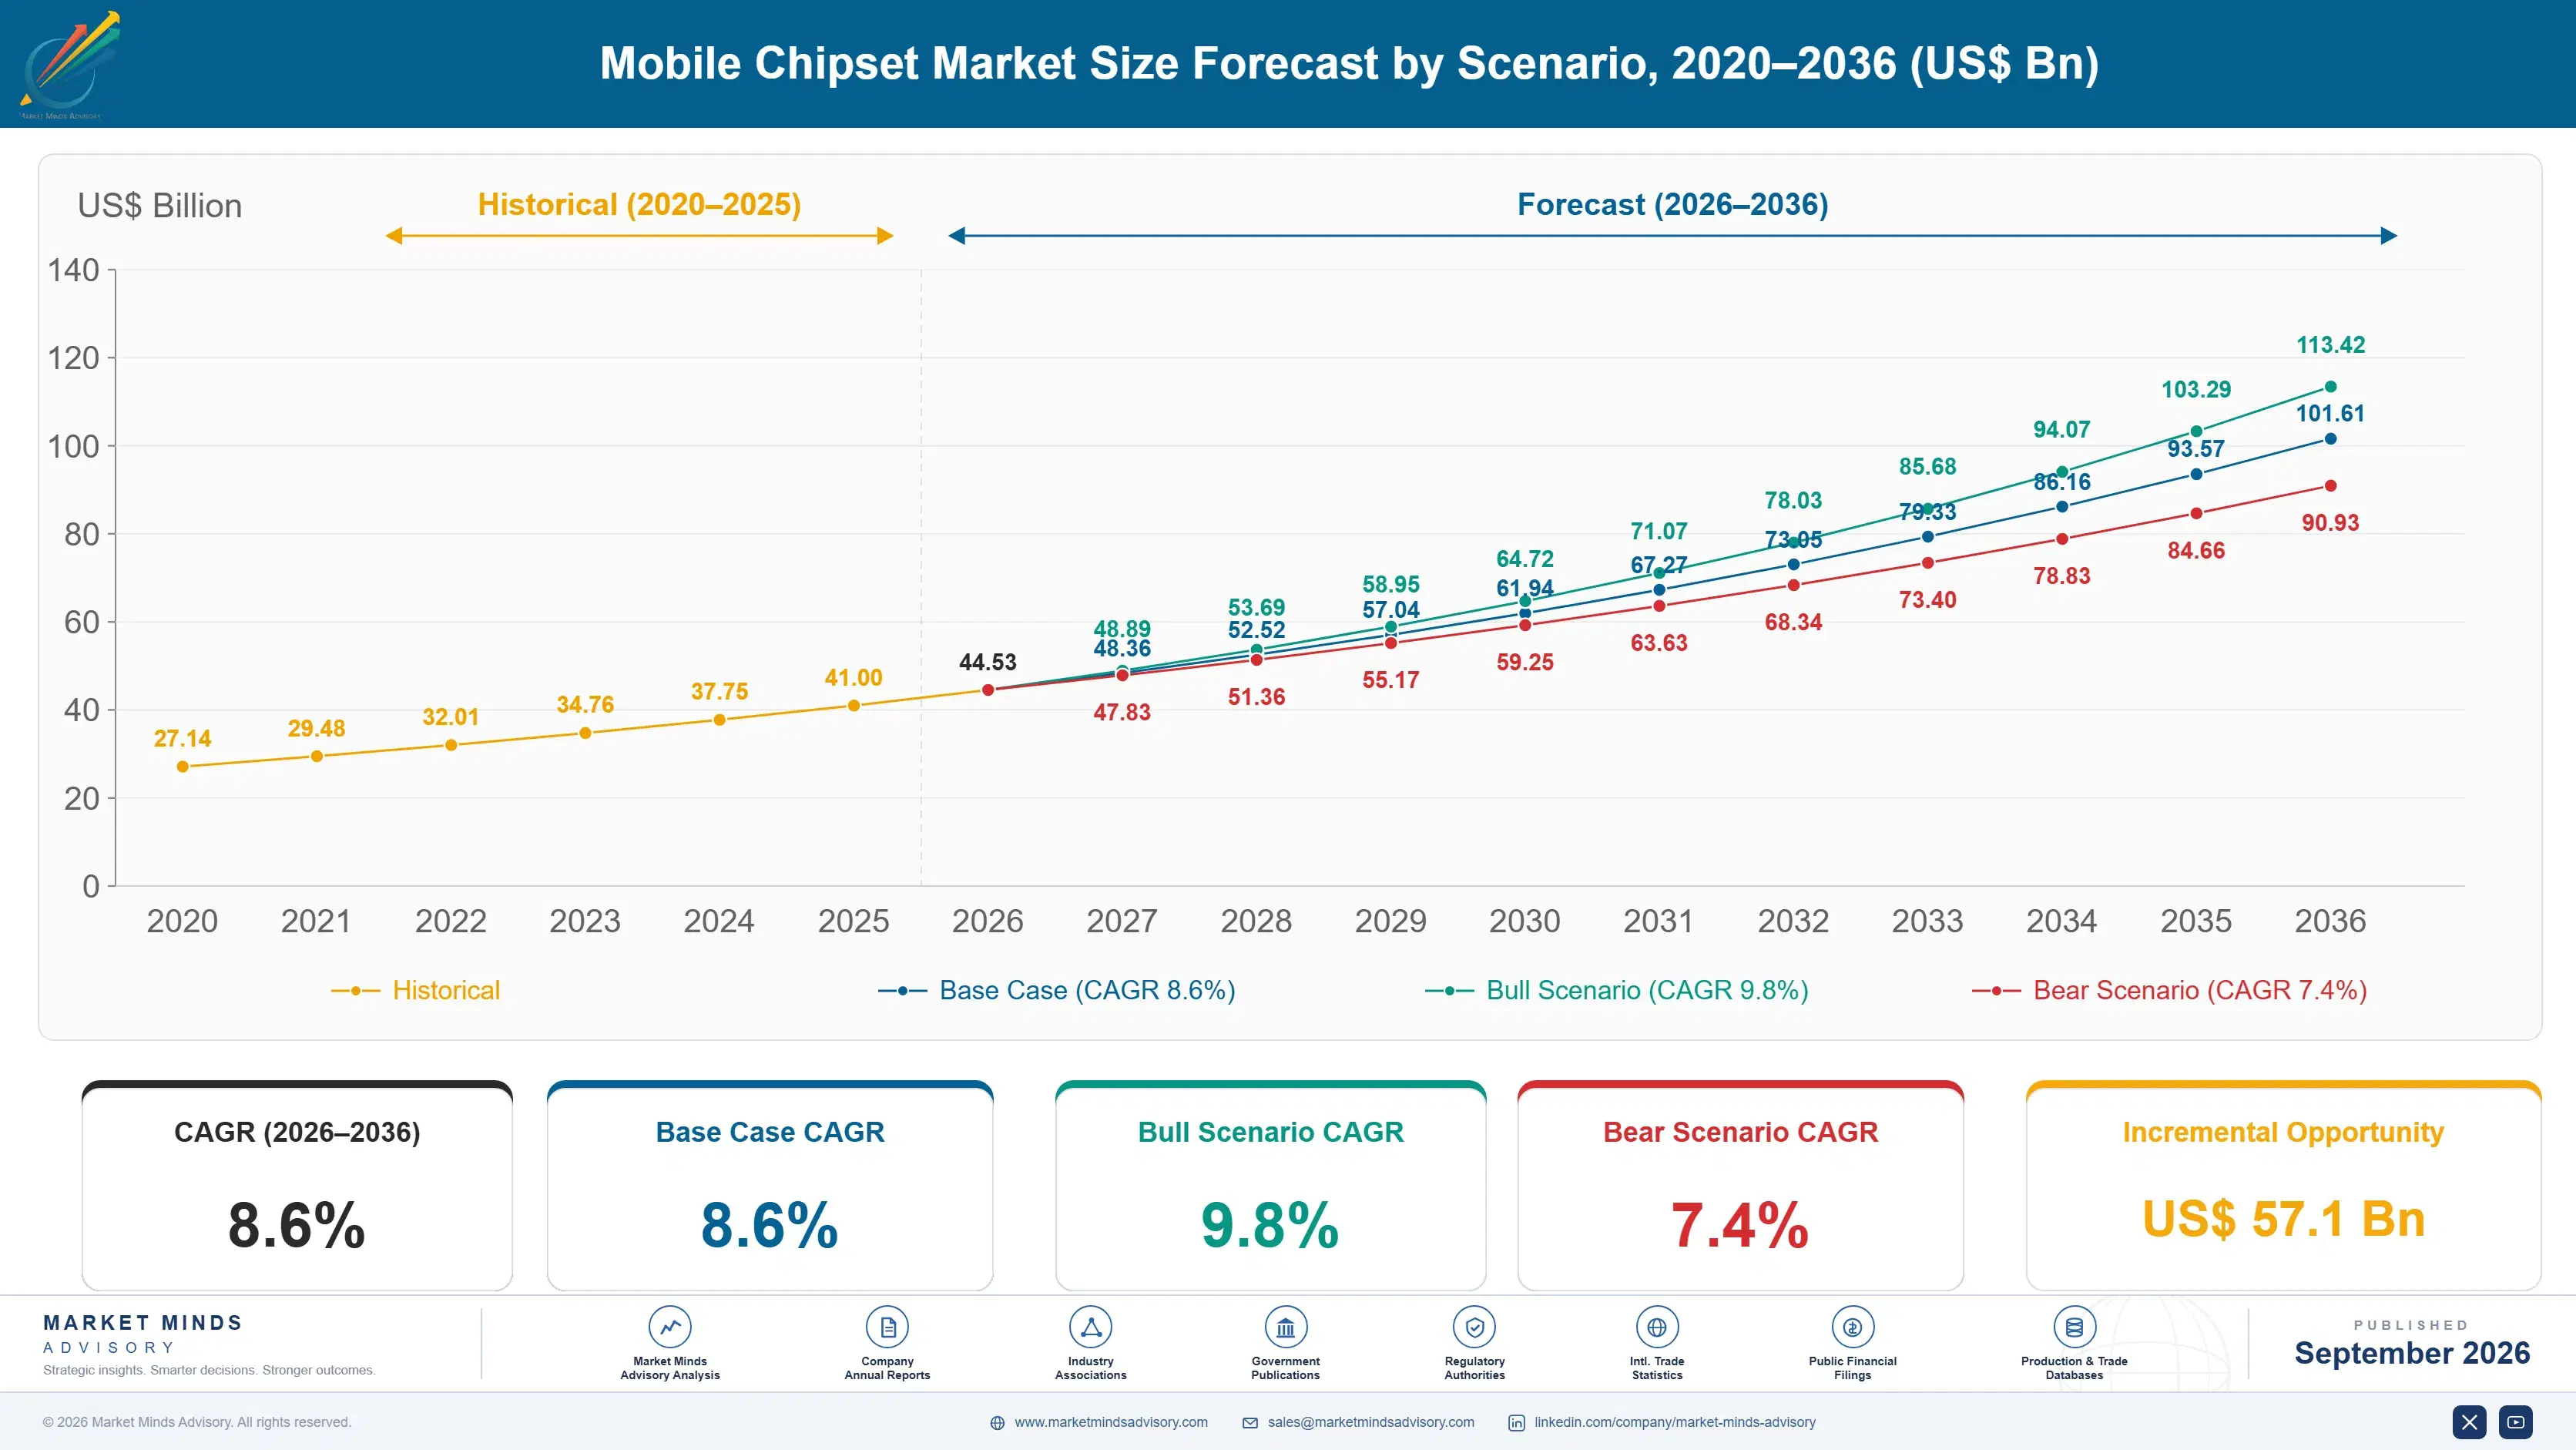
Mobile Chipset Market Forecast Scenarios

mobile-chipset-market-size-forecast-scenario-1788415771692
Between 2020 and 2025 the market compounded at 7.4% while handset unit shipments fell, which tells you where the value moved. Average selling prices rose across every tier as node costs climbed and as vendors added silicon that had not previously existed. The 2021 and 2022 shortage distorted the middle of the period badly, pulling forward orders that unwound through an inventory correction.
The 8.6% base case rests on three commercial mechanisms. Leading-edge node economics push premium chipset prices up whether or not anything improves, because a wafer costs multiples of the previous generation and design cost roughly doubles each node. On-device model execution is adding neural silicon and forcing memory bandwidth up, which raises die area and package cost together. And replacement cycles in developing markets still add volume even as mature markets stagnate.
The bull case is on-device model execution becoming a genuine purchase driver rather than a specification line, which would lift premium tier mix faster than any current forecast assumes. The bear case is handset replacement cycles lengthening further as devices become good enough, since a market with no unit growth depends entirely on price and mix and has no volume cushion at all.

Where Value Went When Units Stopped Growing

Handset shipments peaked years ago and have drifted sideways since, which should make this a declining market and does not. Revenue grows because the silicon in each device costs more and prices higher. A leading node wafer runs roughly 3.2 times a mature one, flagship design costs approach USD 580 million, and neural processing takes about 22% of premium die area for work nobody required in 2019.
TOP FIVE CONCENTRATION86%Share of measured chipset shipment revenue held by leaders
AVERAGE SELLING PRICEUSD 34Average price across all chipset tiers shipped globally
LEADING NODE WAFER PREMIUM3.2xCost of a leading node wafer against mature nodes
FLAGSHIP DESIGN COSTUSD 580mFull design cost for a flagship part today
NEURAL DIE AREA SHARE22%Neural processing share of flagship application processor die
LICENSING MARGIN PREMIUM4.1xPatent licensing margin against chipset margin for one vendor
The competitive question is frequently misunderstood. Standard processor cores are licensable, and companies with no semiconductor history have built excellent application processors using them. What almost nobody builds is a cellular modem that passes carrier certification across hundreds of operator networks in conditions no laboratory reproduces. That takes years of field testing and an intellectual property position, and it is where the concentration in this market actually comes from.
The economics are also misread. Patent licensing and chipset sales are separate businesses at the same vendors, with licensing carrying roughly 4.1 times the margin of the product line, and the licensing revenue funds the development that keeps the chipset business competitive. Modelling either half alone gives the wrong answer, which is why so much analysis here is confidently incorrect.
"Everybody assumes the hard part is the processor because that is what the marketing talks about. The hard part is a radio that works on a network in rural Indonesia at three in the morning, and the only way to know it does is to have spent a decade finding out."
Director, Semiconductor and Connected Devices Practice · MMA Technology and Semiconductors Practice · September 2026

Market Trends

On-Device Model Execution Reshapes The Die

Running language and vision models locally rather than in a data centre demands neural throughput and memory bandwidth that mobile silicon was never designed around, and neural processing now occupies roughly 22% of flagship application processor die area. The knock-on effect reaches memory: device memory capacity is rising for the first time in years because local models need somewhere to sit. That raises the cost of the whole platform rather than only the chipset, and it gives premium tier parts a genuine functional differentiator at a moment when processor performance had stopped mattering to buyers.
Market Impact: Grows at 13.8% annually
Node Economics Push Prices Up Without Improving Anything

A leading node wafer costs roughly 3.2 times a mature one and full flagship design has reached approximately USD 580 million, with both figures rising at every generation. Vendors must recover that in price whether or not the resulting product does anything the previous one did not. The effect concentrates the market further, because the number of companies able to fund a leading-node mobile design has fallen to a handful and continues falling. Buyers experience this as premium handset prices rising for reasons no specification sheet explains. The field narrows at every node without anyone competing badly.
Market Impact: Adds 3 devices per user

Market Opportunities and Growth Drivers

Indian Assembly And Consumption Grow Together

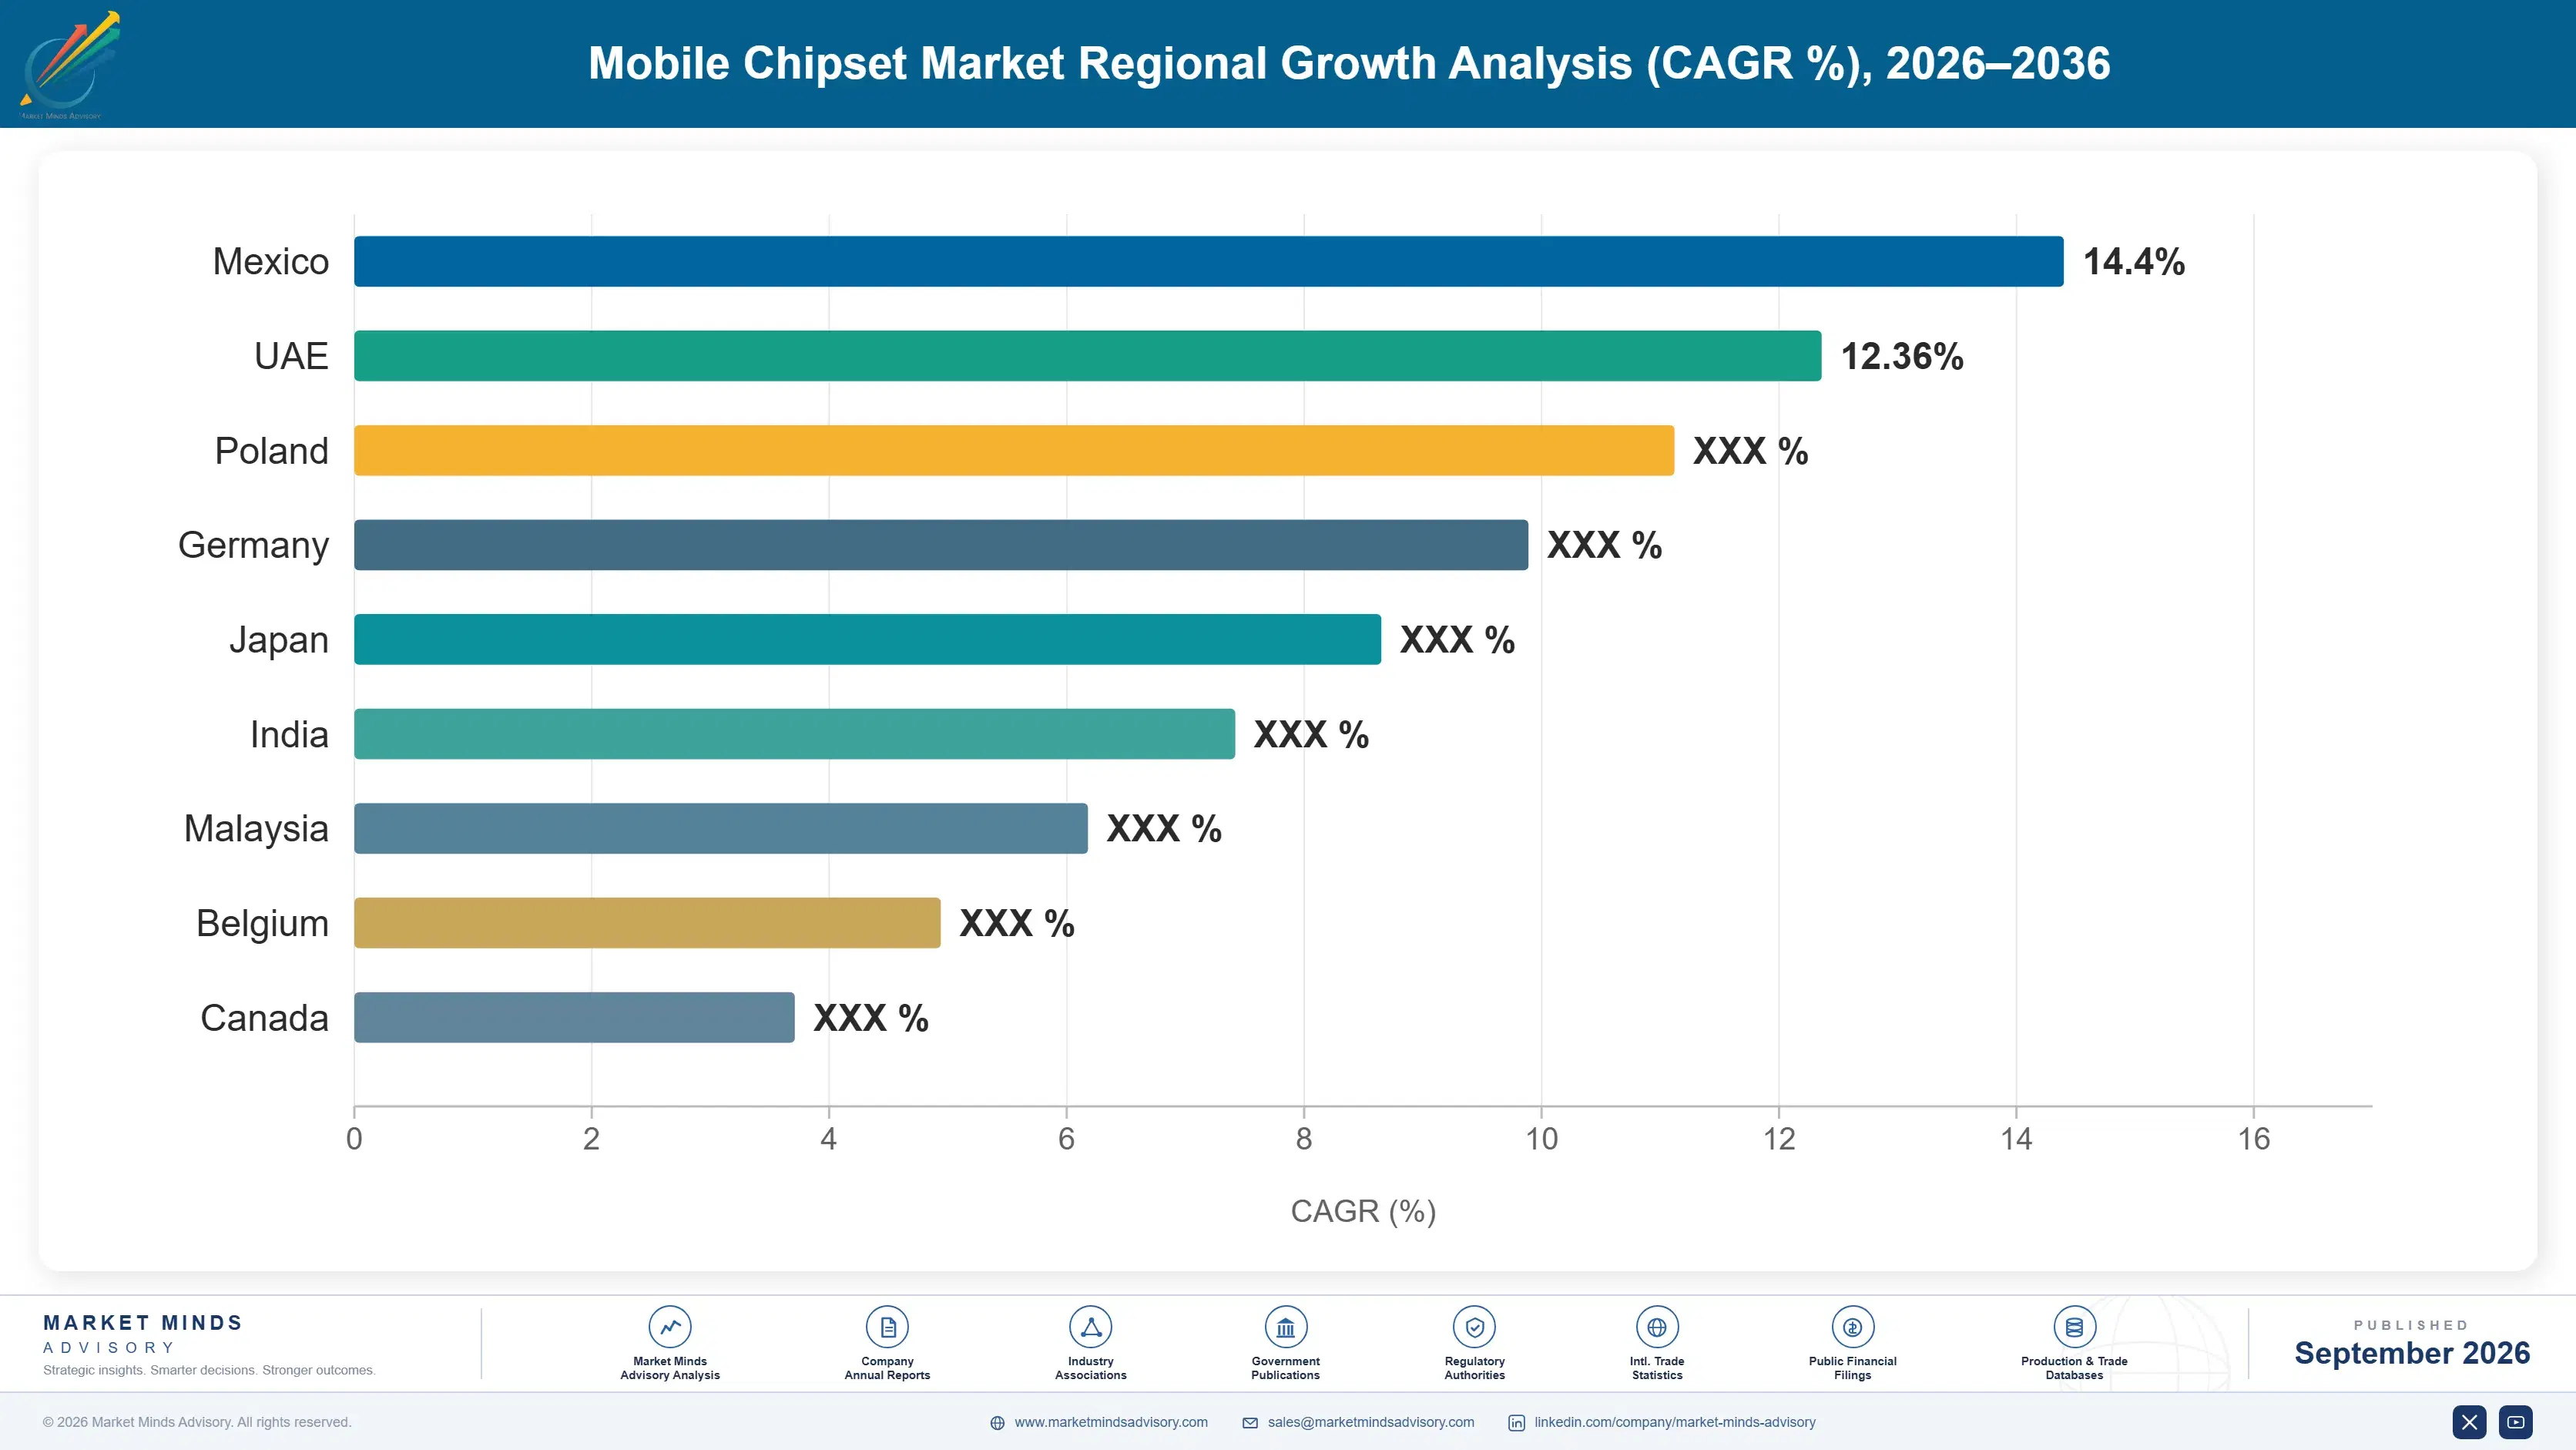
India has become both a very large handset market and a substantial assembly location under production-linked incentive schemes, which means chipsets are increasingly consumed where the devices are also built rather than shipped in finished form. Growth of 13.8% makes India the fastest growing country in this market. Local value addition requirements are pushing component and packaging activity into the country behind final assembly. Vendors with local design and support presence are winning positions that purely export relationships previously covered adequately. Export relationships no longer cover this properly. Local presence now wins positions.
Market Impact: Extends cycles past 3 years

Wearables Add Silicon Content Without Adding Handsets

Watches, earbuds, glasses and health monitors each carry a processor, and their combined unit volume now rivals handsets while their silicon content per device is far smaller and considerably more varied. That opens a market for low-power parts with entirely different design points, where battery life rather than throughput decides the specification. Growth at 9.6% in that class is unremarkable on its own and matters because it is genuinely additive to a handset market that has stopped growing in units at all. Battery life rather than throughput decides every specification.
Market Impact: Reaches USD 580 million per design

Market Restraints and Challenges

Handset Replacement Cycles Keep On Lengthening

Devices have become good enough that users replace them every three to four years rather than every two, and no marketing effort has reversed that in any major market. The root cause is that annual performance gains stopped being perceptible to ordinary users around the middle of the last decade. Commercial impact is a market entirely dependent on price and mix with no volume cushion, so any mix reversal hits revenue directly. Participants mitigate by pushing content per device upward, by pursuing wearable and automotive volume that is genuinely additive, and by defending average selling price rather than chasing share.
Market Impact: Occupies 22% of flagship die

Design Cost Concentrates The Market Further Each Node

Full flagship design has reached roughly USD 580 million and roughly doubles with each node transition, which removes participants steadily and permanently. The root cause is that verification, physical design and mask costs all scale faster than the transistor budget they serve. Commercial impact is a market where only companies shipping enormous volume can amortise a leading-node design, so the field narrows whether or not anybody competes badly. Mitigation runs through chiplet architectures reusing blocks across products, longer product lifetimes, and derivative parts sharing one expensive base design across several tiers.
Market Impact: Costs 3.2 times mature wafers
4 additional market trends, 3 additional growth drivers, and 2 additional restraints and challenges are covered in the full report. Contact sales@marketmindsadvisory.com to access the complete intelligence.

Segment CAGR and Growth Architecture

Segmentation follows chipset tier and device class, which is how these parts are designed, priced and sold, and which maps directly onto the node used and the die area available. Entry, mid and premium handset tiers, standalone modems, wearable processors and tablet parts each face different economics and very different growth. Growth between them diverges sharply.
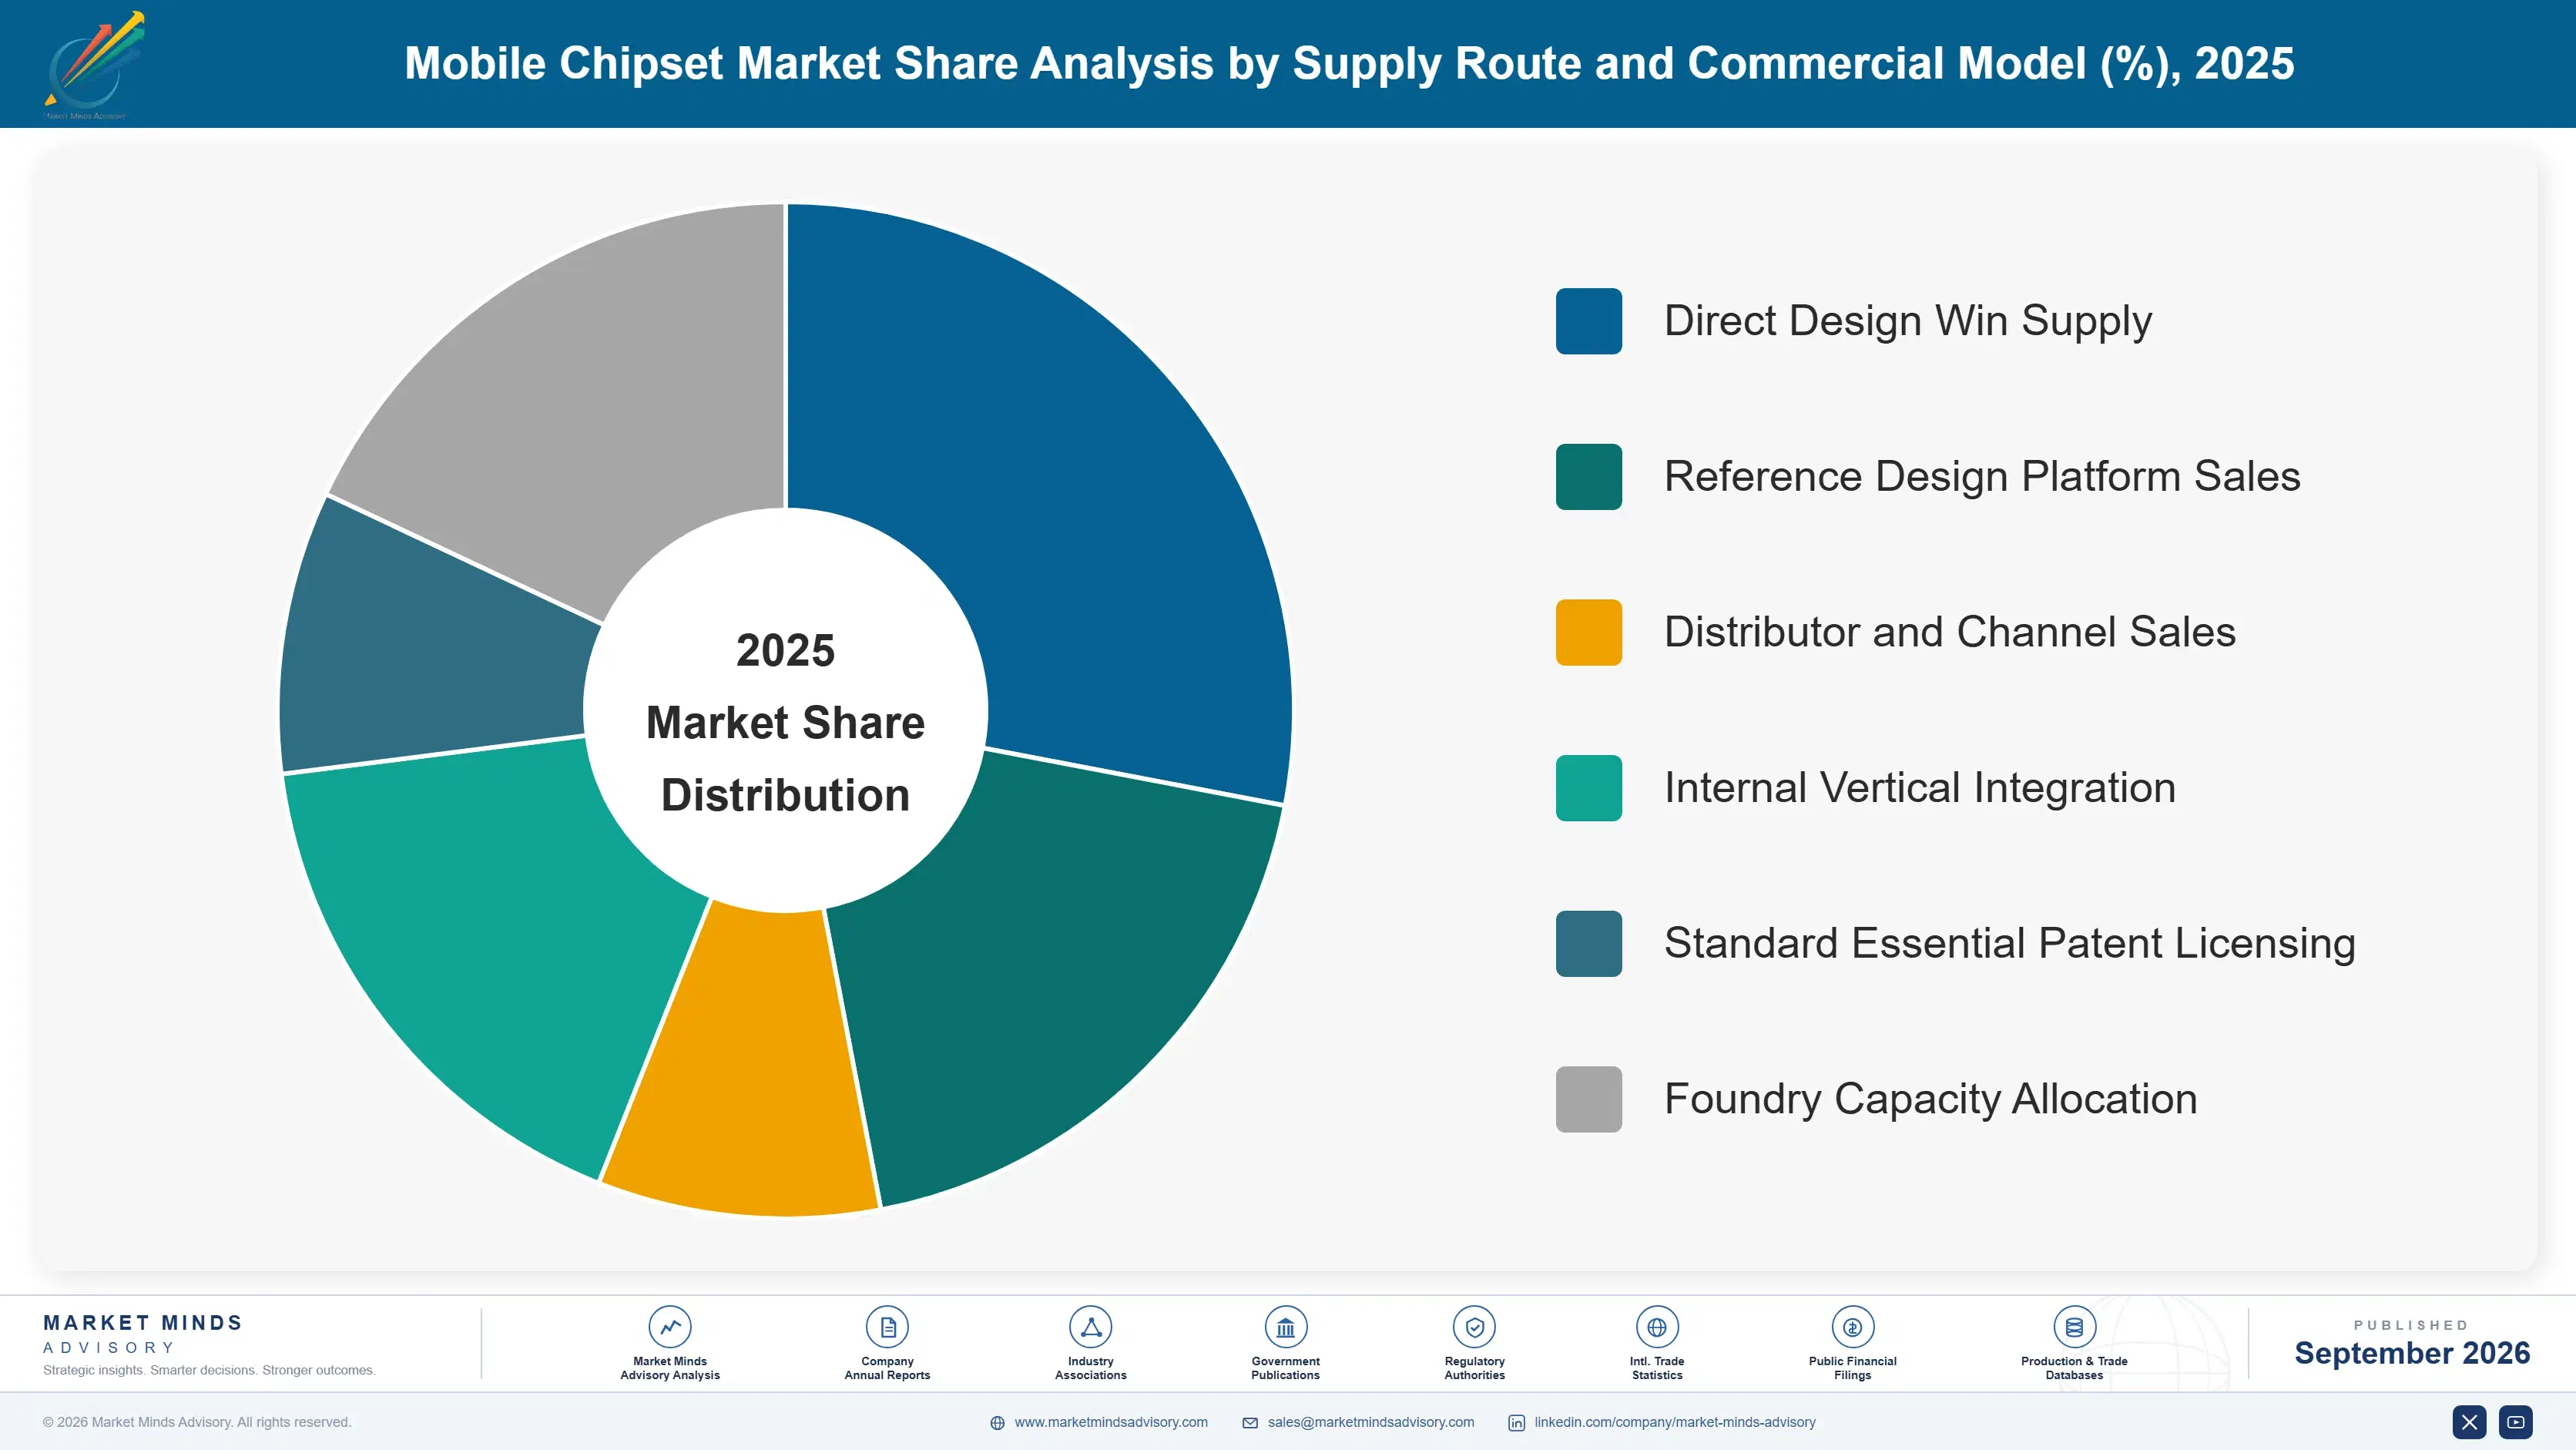
mobile-chipset-market-market-share-analysis-1788415772226

Premium Tier Flagship Chipsets

Flagship parts absorb the leading node, the neural silicon and the memory bandwidth that on-device model execution requires, and they carry the price increases that node economics force whether or not performance improves. Neural processing takes roughly 22% of die area in this tier alone. Growth at 12.9% is half again the market rate of 8.6%, driven by mix rather than by any unit expansion. The competitive position has changed materially, since handset makers now hold a credible second source at the top of the range for the first time in a decade, which compresses pricing inside a growing segment. Mix rather than units carries all of it. Second sourcing changed the negotiation entirely.
CAGR 12.9%

Standalone Cellular Modems

Integration steadily eliminated the discrete modem for a decade, and device makers building their own application processors have brought it back, because connectivity is the one block they cannot replicate inside a normal development timeline. Carrier certification across hundreds of operator networks takes years of field testing that money does not compress. Growth at 10.4% reflects that reversal alongside genuinely separate demand from cellular internet of things and automotive customers who never wanted an application processor at all. Buyers here are few, sophisticated and negotiate extremely hard, but their alternative is a programme measured in years. Automotive and cellular internet of things demand behaves the same way. Buyers here are few and negotiate extremely hard.
CAGR 10.4%
Full segment breakdown across 6 segments available in the complete report.

Regional Architecture and Country Demand Map

Demand follows where devices are designed and assembled rather than where they are eventually used, which concentrates this market far more than handset sales data suggests. East Asia holds the device makers, the design houses and the foundries together. Handset sales data misleads here. Assembly location decides it.

East Asia

Chinese handset makers alone consume an enormous share of world chipset output, and Korean, Japanese and Taiwanese device and design activity sits alongside it, which puts East Asia at 48%, far above the 30% ceiling of the standard band. The concentration is genuine rather than a measurement choice, since chipsets are bought where devices are designed. Taiwanese design houses and foundry capacity anchor the supply side. Export controls have pushed Chinese vendors toward domestic alternatives at the mid and entry tiers, which is reshaping share within the region rather than reducing its size. Export controls have pushed Chinese vendors toward domestic alternatives at the entry and mid tiers, reshaping share inside the region rather than reducing its size.
Share: 48% | CAGR: 9.4% (2026 to 2036)

South Asia and Pacific

India has become both a very large consuming market and a substantial assembly location under production-linked incentive schemes, which is why the region sits at 18%, above the standard band ceiling of 12%, and why India grows at 13.8%, faster than any country here. Local value addition requirements are drawing component and packaging work into the country behind final assembly. Vendors with local design and support presence win positions that export relationships previously covered. Southeast Asian assembly and test capacity contributes further, particularly in Vietnam and Malaysia. Vendors without local design and support presence are steadily losing positions that export relationships once covered adequately, which is a commercial shift rather than a technical one.
Share: 18% | CAGR: 10.8% (2026 to 2036)
Regional intelligence for 5 additional markets available in the complete report: North America, Western Europe, Latin America, Middle East and Africa, Eastern Europe. Contact sales@marketmindsadvisory.com.
mobile-chipset-market-country-cagr-analysis-1788415772749

Where Chipset Value Is Genuinely Captured

Four positions carry margin in a market where unit growth has ended and design cost keeps rising. Each depends on something that cannot be bought quickly, which is why the field narrows every node and why well-funded entrants have repeatedly failed to establish themselves here. Capital alone has never been enough here. Time is the barrier.

Defend The Modem Rather Than The Processor

Standard processor cores are licensable and several companies with no semiconductor history have built excellent application processors from them, which makes the processor the wrong thing to defend. Carrier certification for a cellular modem across hundreds of operator networks takes years of field testing that no amount of capital compresses, and the intellectual property position around it took decades to build. Standalone modem demand grows at 10.4% precisely because customers cannot replicate this. It is the only durable barrier in the whole market. Nothing else in this market is defensible for long.
Market Impact: Protects the 10.4% growth in standalone modem demand

Amortise One Base Design Across Several Tiers

Flagship design has reached roughly USD 580 million and doubles each node, which only enormous volume amortises, so deriving mid and entry tier parts from one expensive base design spreads that cost across far more units than a flagship alone ever ships. Chiplet architectures extend the same logic by reusing blocks across product generations. Vendors designing each tier separately are funding several expensive programmes where one would serve. The discipline costs some product differentiation and buys survival at the next node. Chiplet reuse extends the same logic across generations rather than only across tiers.
Market Impact: Spreads USD 580 million across all product tiers

Treat Licensing And Silicon As One Business

Patent licensing carries roughly 4.1 times the margin of the chipset product line at the vendors holding both, and that licensing revenue funds the development making the silicon competitive. Managing them as separate businesses with separate targets produces decisions that damage the combination, most obviously when licensing terms are traded away to win chipset volume. The two halves defend each other or neither works. Analysts and boards both consistently model this incorrectly, which makes the internal argument harder than it should be. The internal argument is harder than it should be.
Market Impact: Carries 4.1 times the chipset product line margin

Build Content Into Devices That Are Not Handsets

Handset units have stopped growing and no commercial effort restores them, while watches, earbuds, glasses and health devices add roughly 3 processors per user at entirely different design points where battery life rather than throughput decides the specification. That volume is genuinely additive rather than substitutional. Automotive and cellular internet of things demand behaves similarly and buys standalone connectivity. Vendors organised solely around handset design cycles reach none of it and treat the whole category as a distraction. Automotive and cellular internet of things demand behaves the same way and buys standalone connectivity rather than platforms.
Market Impact: Adds up to 3 additional processors per user

Who Controls the Margin Pool

Measured on chipset shipment revenue, the basis used throughout this section, the top five hold 86%. That is among the most concentrated positions in any market of comparable size, and it follows from design cost that only enormous volume amortises and from modem certification that takes years to achieve. The gap between leaders and everyone else is connectivity capability and volume scale rather than processor design skill.
Competition currently runs on premium tier parity, neural throughput and increasingly on securing foundry capacity at the leading node, which is itself a constraint on who can compete. The historic split between a premium supplier and a value one has collapsed as the challenger reached genuine flagship parity. Device makers building their own application processors have become customers for modems while ceasing to be customers for anything else.

Pressure builds from two directions. Vertical integration by large device makers removes the most profitable customers while leaving them dependent for connectivity. And domestic Chinese alternatives are taking mid and entry tier share under export control pressure, which loses a market segment rather than a technology. Rankings shift where vendors defended connectivity and amortised design rather than competing on benchmarks nobody buys on.
mobile-chipset-market-company-positioning-matrix-1788415773273

Competitive Moat and Risk Dimensions

QUALCOMM

Moat: Modem certification and licensing base

Cellular modem capability proven across hundreds of operator networks over many years gives the company a position that customers building their own processors still depend on, which is why vertical integration has cost less than expected. Patent licensing carries far higher margin than silicon and funds development the product line could not support. Both halves are difficult to replicate quickly.
QUALCOMM

Risk: Customer vertical integration

The largest and most profitable customers are building their own application processors and working steadily toward their own modems, which removes revenue that no replacement customer matches in scale or margin. Premium tier pricing faces pressure from a challenger that reached flagship parity. Licensing renewals are negotiated by customers with growing alternatives and considerable bargaining power in them.
MEDIATEK

Moat: Volume scale with flagship parity

Enormous shipment volume across entry and mid tiers amortises design cost across far more units than a premium-only vendor manages, and flagship parts reaching genuine parity converted that scale into credibility at the top of the range. Handset makers value a second premium source more than any technical difference. Close foundry relationships secure leading node capacity that constrains competitors.
MEDIATEK

Risk: Domestic Chinese share erosion

Chinese domestic alternatives are advancing at the entry and mid tiers where the company's volume base sits, driven by supply security rather than by cost or capability. That erosion removes exactly the volume that amortises flagship design. Modem capability, while much improved, has not reached the certification depth that makes the leading competitor indispensable to vertically integrating customers.

Players Tracked

Prominent Players

Qualcomm
MediaTek
Apple
Samsung Electronics
UNISOC

Other Key Players

Google
HiSilicon
Broadcom
Synaptics
Nordic Semiconductor
Ambiq Micro
Rockchip
Allwinner Technology
Amlogic
Sony Semiconductor Solutions
Renesas Electronics
NXP Semiconductors
Telit Cinterion
Sequans Communications
Arm Holdings

Recent Developments

FEBRUARY 2025

Device maker introduces internally developed cellular modem

A large handset manufacturer shipped a device using its own cellular modem for the first time, a product decision rather than any corporate transaction. The programme had run for several years longer than originally planned, and initial deployment was limited to a single model rather than the whole product range.
Signal: The years that programme took are the clearest available measure of how hard modem certification really is.
OCTOBER 2024

Challenger launches flagship chipset at genuine premium parity

A chipset vendor launched a flagship part on a leading node with performance and neural throughput comparable to the established premium supplier, a product launch rather than any acquisition. Several major handset makers adopted it in flagship devices during the following cycle rather than in secondary models.
Signal: A credible second premium source is worth more to handset makers in negotiation than any benchmark difference.
JUNE 2025

Chipset vendor and handset maker renew patent licensing agreement

A chipset supplier and a major handset manufacturer renewed their patent licensing agreement covering cellular standard essential patents, a licence agreement rather than any merger or joint venture. Terms were not disclosed and the agreement was reported as covering a multi-year period rather than a single product cycle.
Signal: Licensing renewals matter far more to these earnings than any individual chipset design win ever does.

Wafers, Packaging And Design Amortisation

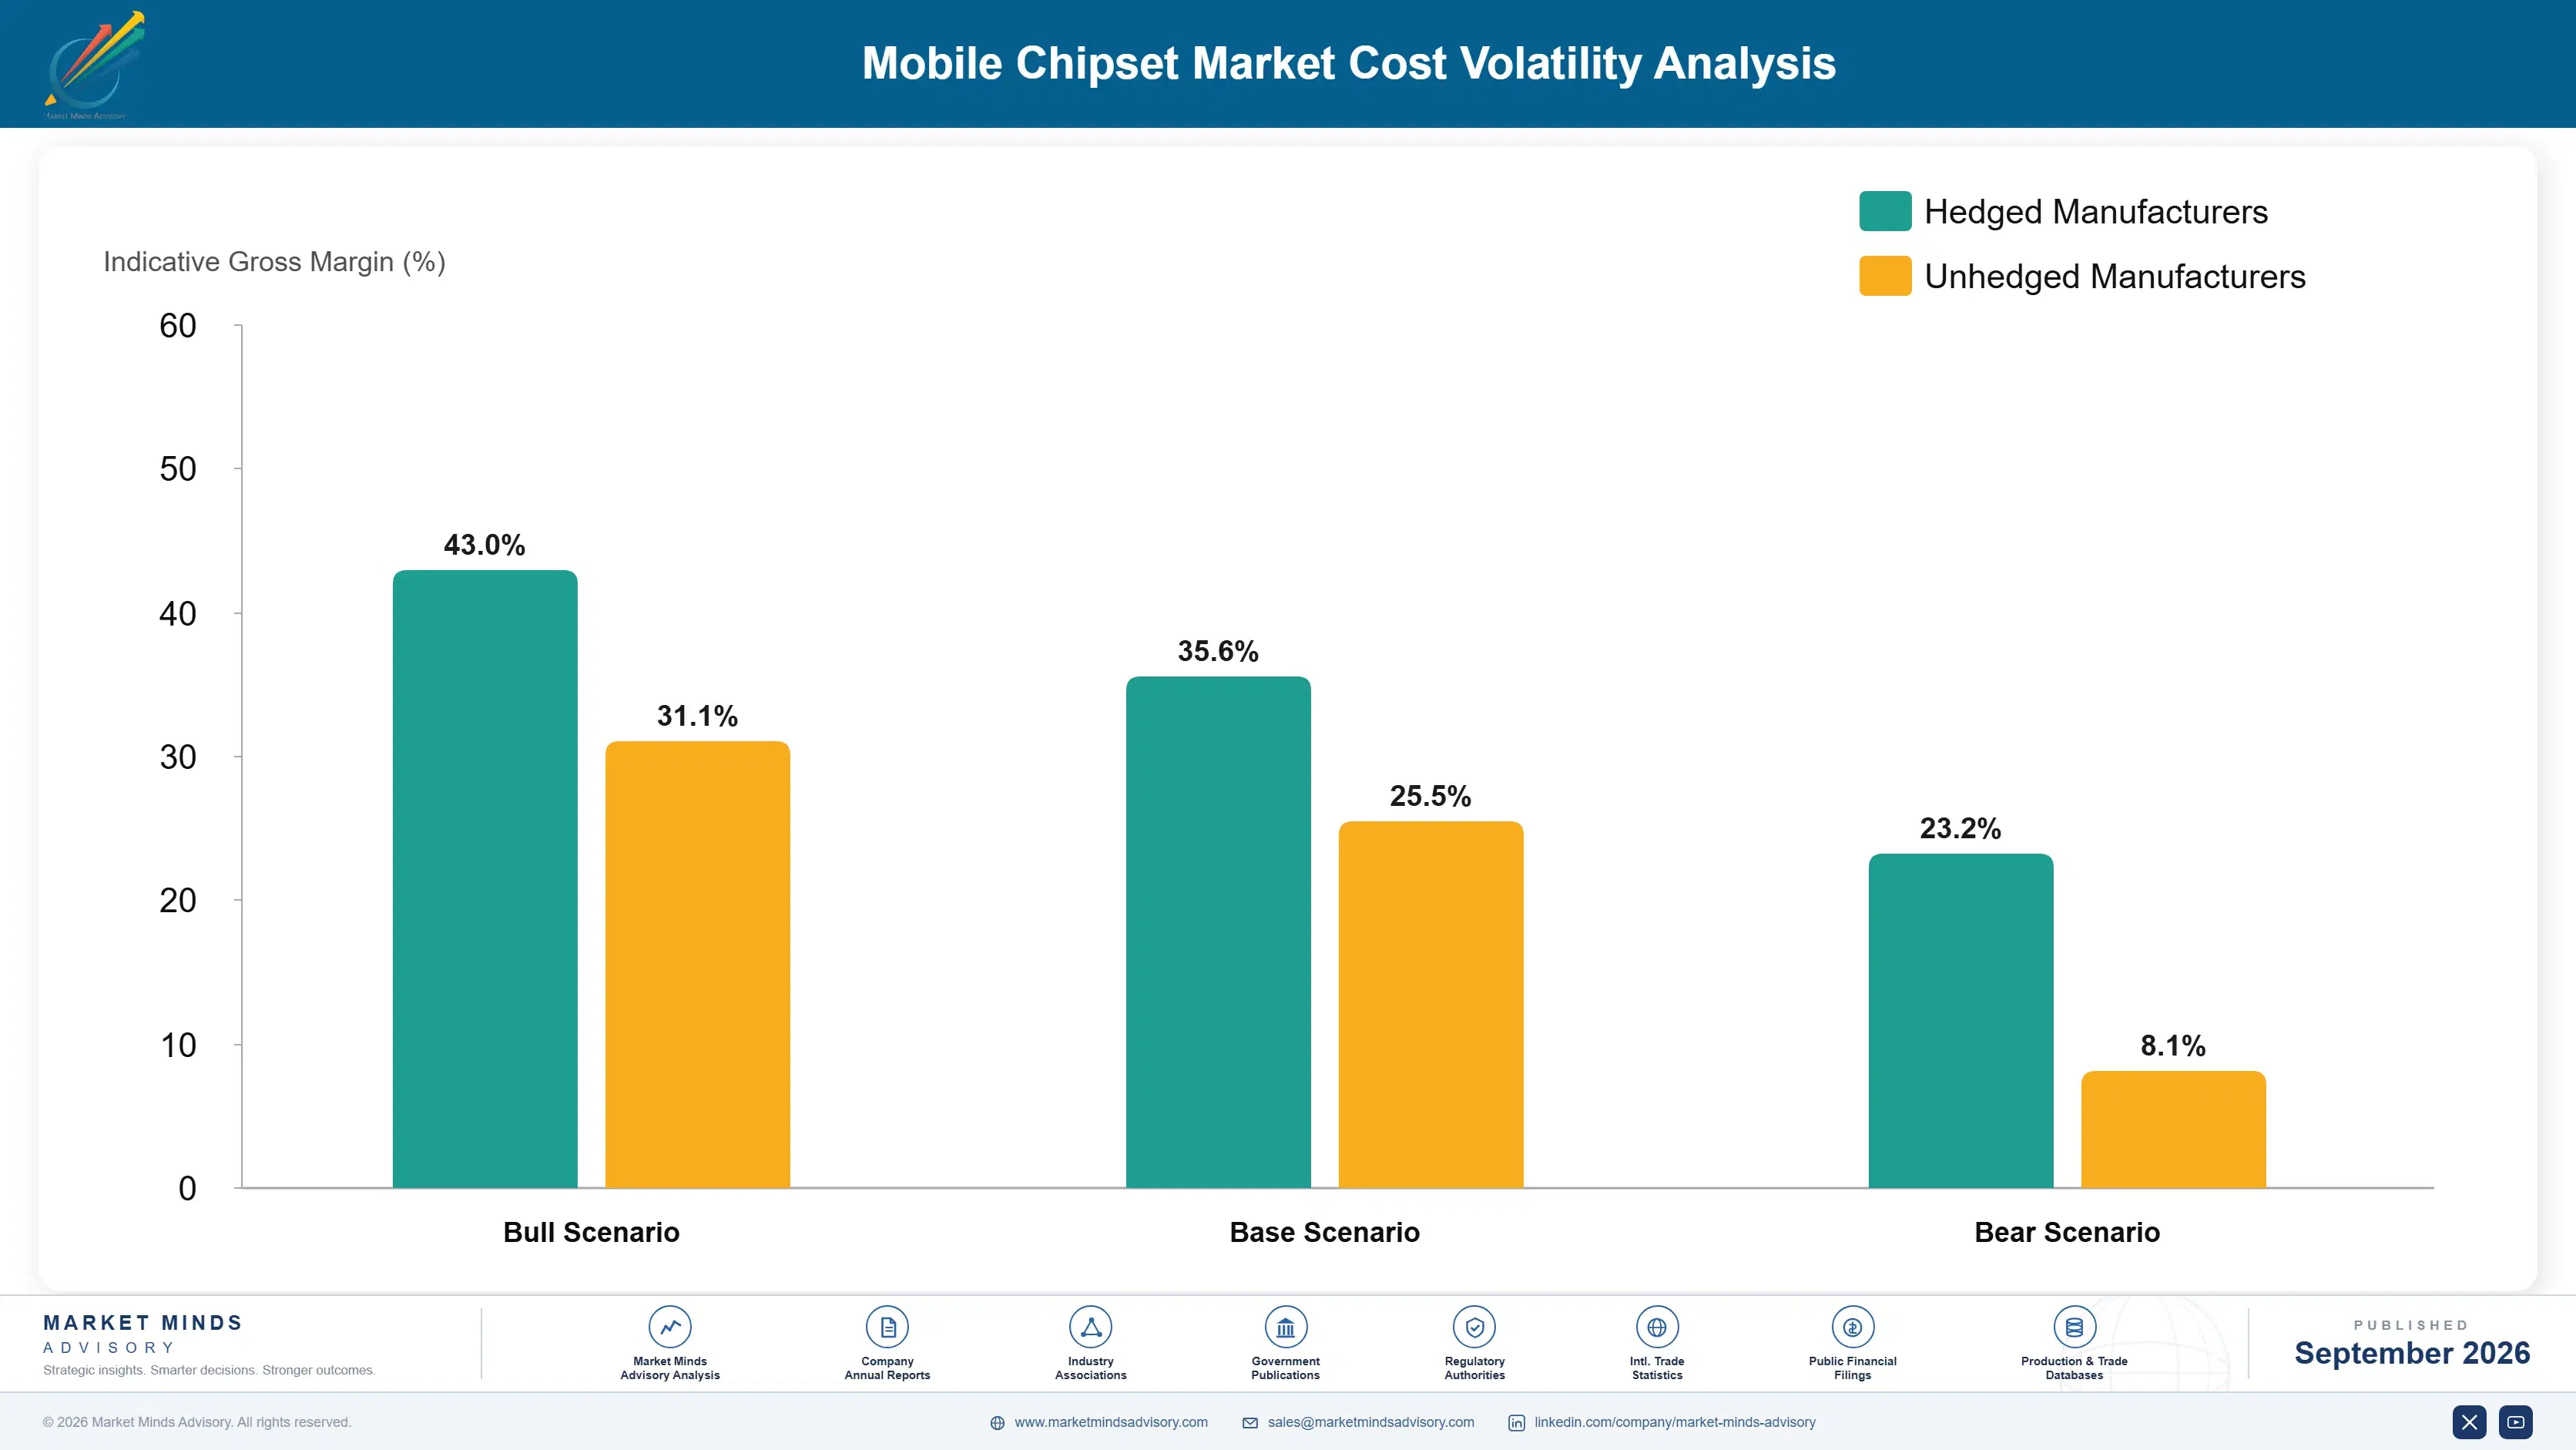
Wafer cost accounts for roughly 48% of manufactured chipset cost at the premium tier, advanced packaging and substrate around 17%, test and assembly near 11%, and intellectual property royalties, mask amortisation and overhead the balance. Leading node wafer supply is concentrated in very few foundries, and SEMI industry reporting documents both the capacity constraints and the cost escalation across successive node transitions.
Leading node wafer pricing rose sharply through successive transitions, with each generation costing multiples of the last, and substrate supply tightened severely through the 2021 and 2022 shortage as packaging capacity failed to keep pace with demand. Vendors holding fixed-price customer agreements absorbed both, and several disclosed gross margin pressure in results covering the period. Mask set costs rose alongside at every node. Neither pressure has genuinely eased since.

The disadvantage mechanism is volume rather than purchasing skill. A vendor shipping hundreds of millions of units amortises a USD 580 million design and secures foundry allocation on terms a smaller competitor cannot approach at any price. Foundry capacity at the leading node is allocated by relationship and commitment rather than by spot purchasing. That is why this market concentrates each node regardless of how well anybody executes.
mobile-chipset-market-cost-volatility-analysis-1788415773472

Derivative parts sharing one base design

Deriving mid and entry tier products from a single expensive base design spreads the cost across many more units than a flagship alone ever ships, which is the only practical answer to design cost doubling each node. It costs product differentiation between tiers, and vendors designing each tier separately are funding several programmes where one would genuinely serve.

Long-term foundry capacity commitments

Committing volume to a foundry years ahead secures leading node allocation that spot purchasing cannot obtain at any price, and the commitment itself is what makes a vendor a priority customer. It requires forecasting handset demand in a market with no unit growth, which several vendors have got badly wrong in both directions. Several have got it badly wrong.

Chiplet reuse across product generations

Separating a design into blocks that can be reused across generations and products amortises verification and physical design effort far more widely than a monolithic design allows. Packaging cost rises and integration complexity grows considerably, which is why adoption in mobile has trailed the same approach in server silicon by several years. Mobile trails server silicon here.

Portfolio Architecture for Margin Defence

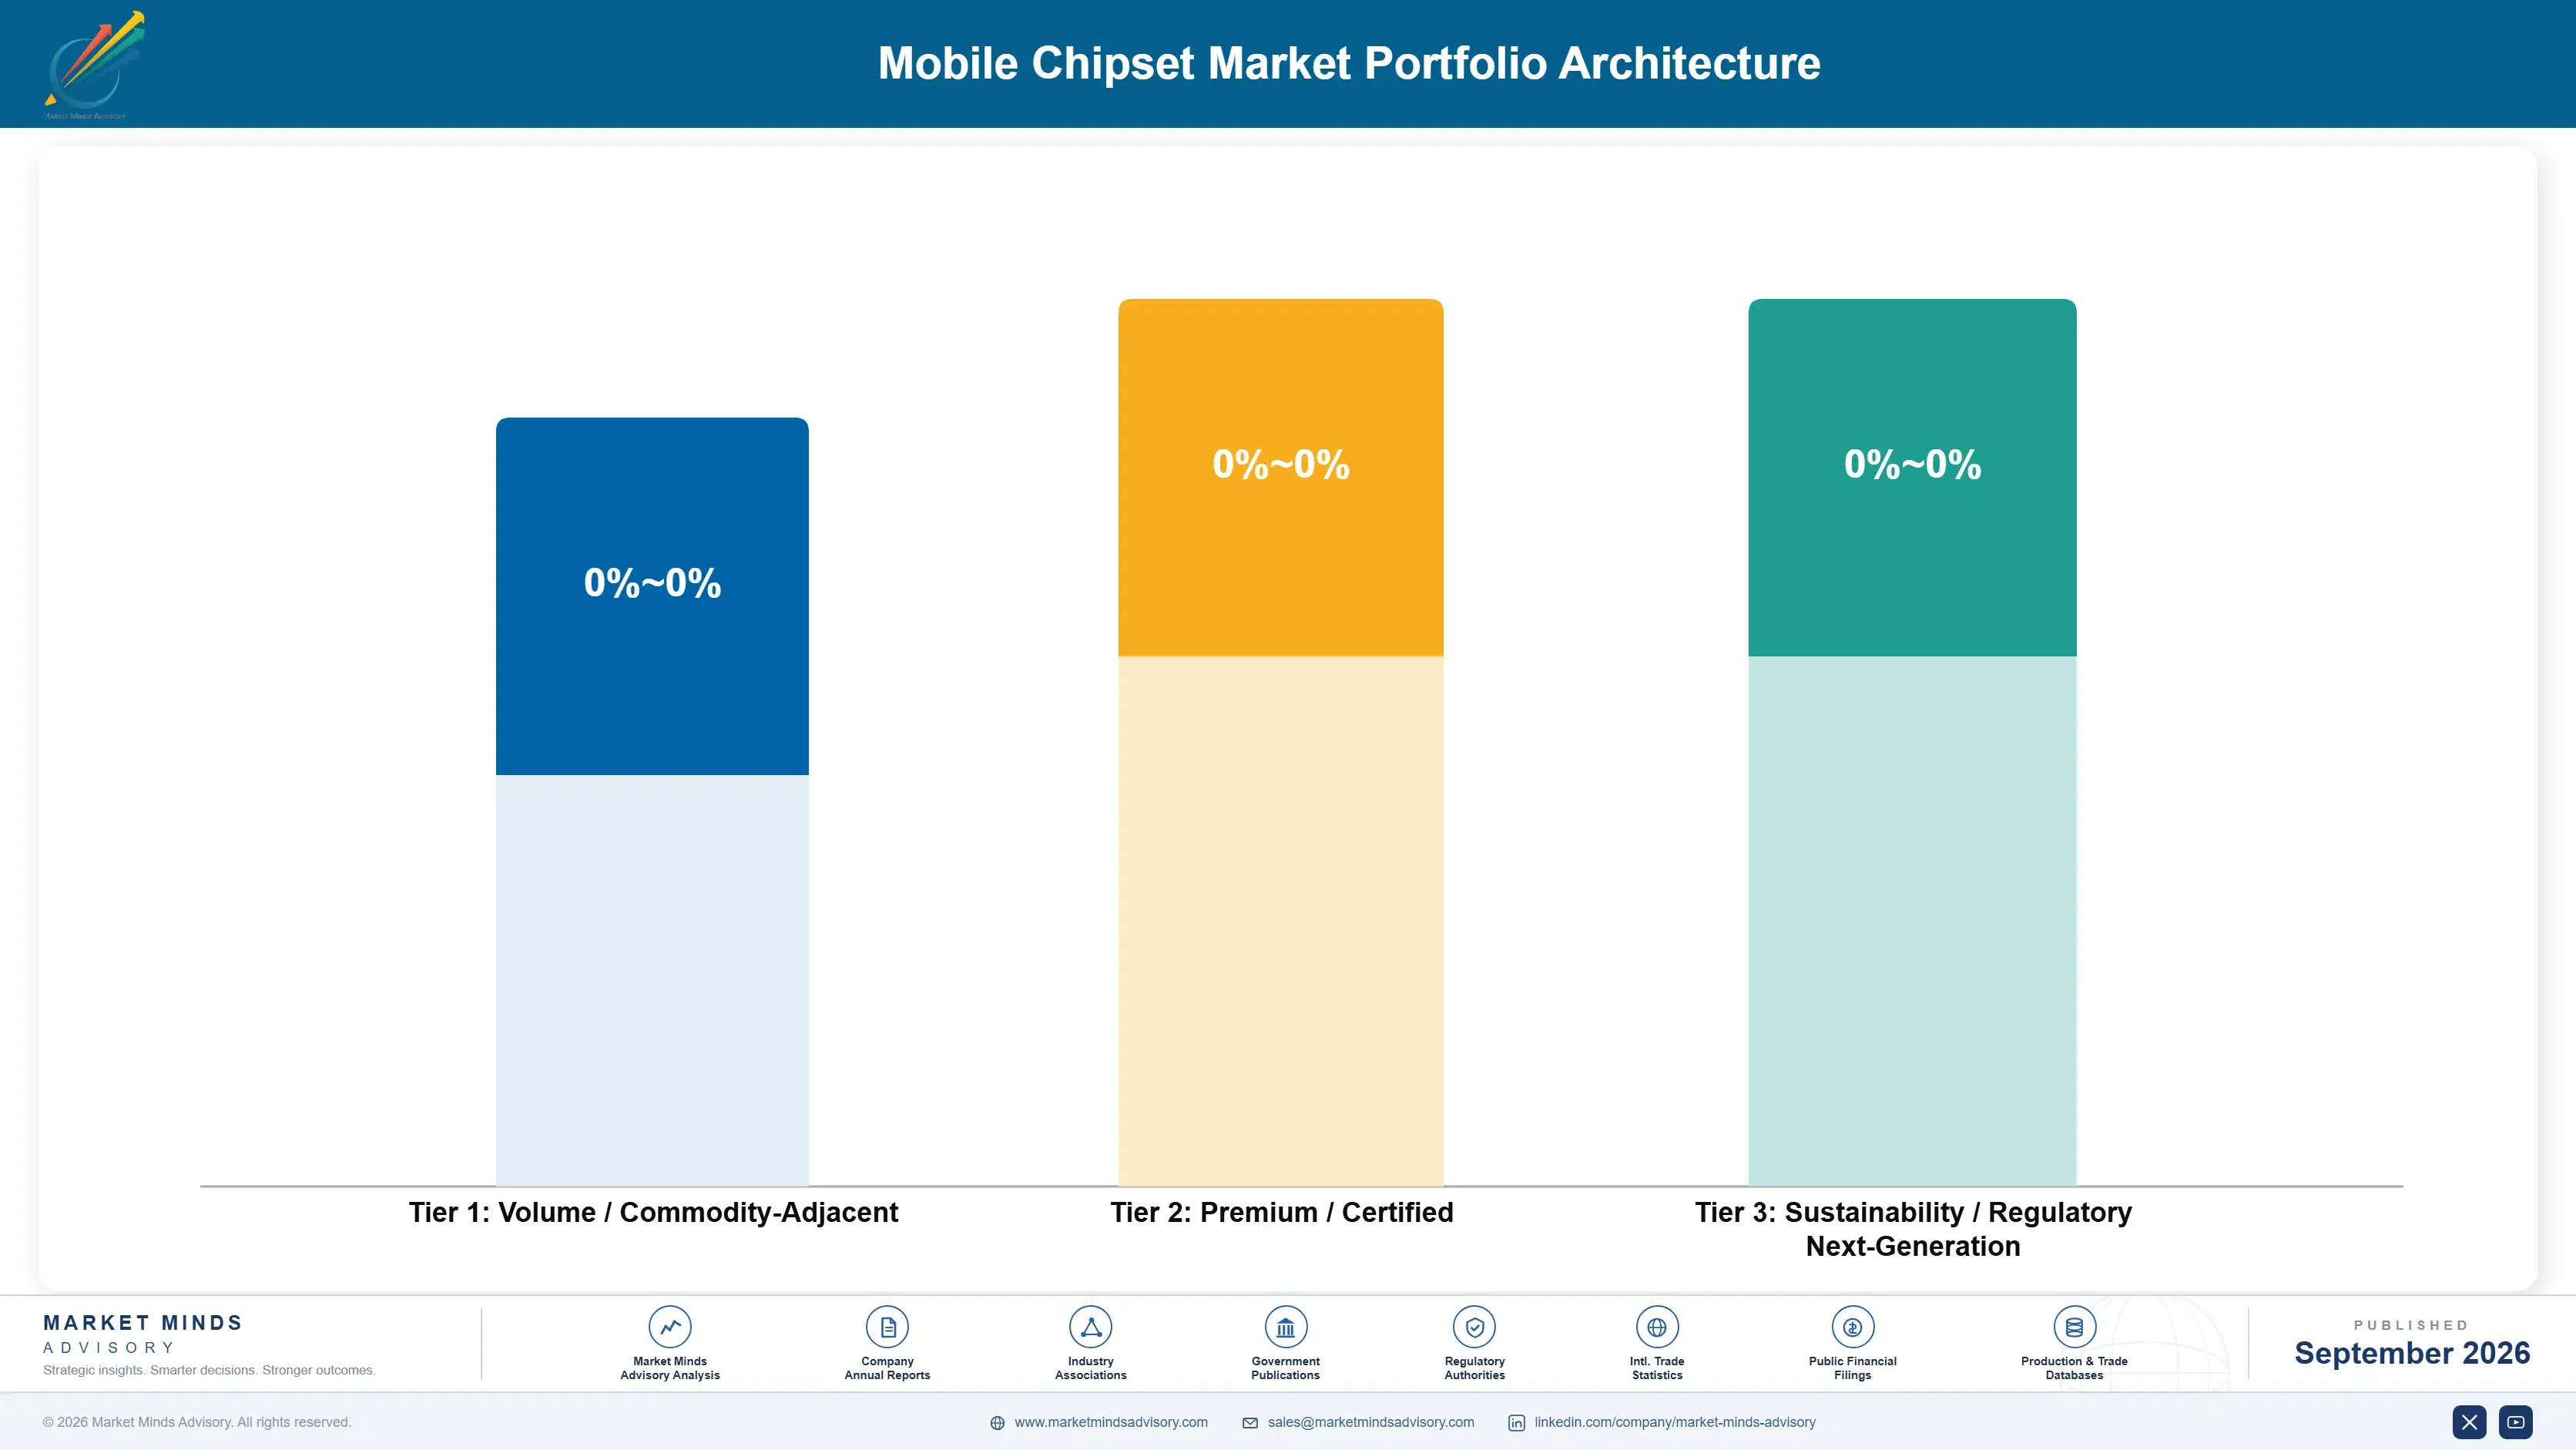
Margin separates by tier and by whether the customer has an alternative. Entry tier parts compete against domestic Chinese suppliers on price alone and earn accordingly, with the outcome decided by design amortisation rather than by anything the customer values. Premium parts carried excellent margin until flagship parity arrived, and now carry good margin under genuine pricing pressure that handset makers exercise deliberately in every negotiation.
The volume against premium tension is unusually consequential here because volume is what funds the premium design. Entry and mid tier shipments amortise a base design across hundreds of millions of units, without which the flagship programme cannot be justified at all. Losing entry tier share to domestic alternatives therefore damages the premium business indirectly and with a delay that makes the connection easy to miss until it is too late to act.

High-value pools sit where the customer cannot build an alternative: cellular modems requiring years of certification, patent licensing on standard essential technology, and connectivity for customers who never wanted a processor. Each is defended by time rather than by capability, which is the only barrier capital does not overcome. The pools carry a disproportionate share of this industry's actual profit.

Volume / Commodity-Adjacent

Entry tier application processors competing against domestic alternatives on price in cost-driven markets. Margin depends on design amortisation and foundry terms rather than on capability, and the segment is losing share to supply security policy.
Gross Margin: 22 to 32%

Premium / Certified

Mid and premium tier integrated chipsets sold to handset makers with genuine second sources available. The 12 point range reflects whether the vendor holds a differentiated position or is competing against a part at genuine parity.
Gross Margin: 38 to 50%

Sustainability / Regulatory / Next-Generation

Standalone cellular modems, patent licensing on standard essential technology and connectivity for non-handset customers. The 18 point range reflects how completely certification time and licensing position remove competitive pressure on price.
Gross Margin: 48 to 66%
mobile-chipset-market-portfolio-architecture-1788415773981

High-value Sub-segments and Strategic Watch-out

Standalone Cellular Modems

Growing at 10.4% as device makers building their own processors return to buying connectivity they cannot replicate. Certification across hundreds of networks takes years that capital does not compress, which is the only durable barrier here. Customers negotiate extremely hard and still have no real alternative.
Gross Margin: 50 to 66%

Standard Essential Patent Licensing

Carries roughly four times product margin and funds the development that keeps the silicon competitive at all. Managed as a separate business it gets traded away for volume, which damages both halves of the combination simultaneously. Boards and analysts alike both model this half of it incorrectly.
Gross Margin: 58 to 74%

Premium Tier Flagship Chipsets

Growing at 12.9% on mix rather than units, absorbing neural silicon and leading node cost together. Pricing is now under genuine pressure since handset makers finally hold a credible second premium source at the top of the range. Handset makers press that advantage in every single negotiation now.
Gross Margin: 38 to 50%

Entry Tier Application Processors

Losing share to domestic alternatives driven by supply security rather than capability, and earning little where it is retained. Still necessary, because this volume is what amortises the flagship design everything else depends upon. Losing it damages the premium business indirectly and with a delay.
Gross Margin: 22 to 32%

How Handset Makers Actually Choose

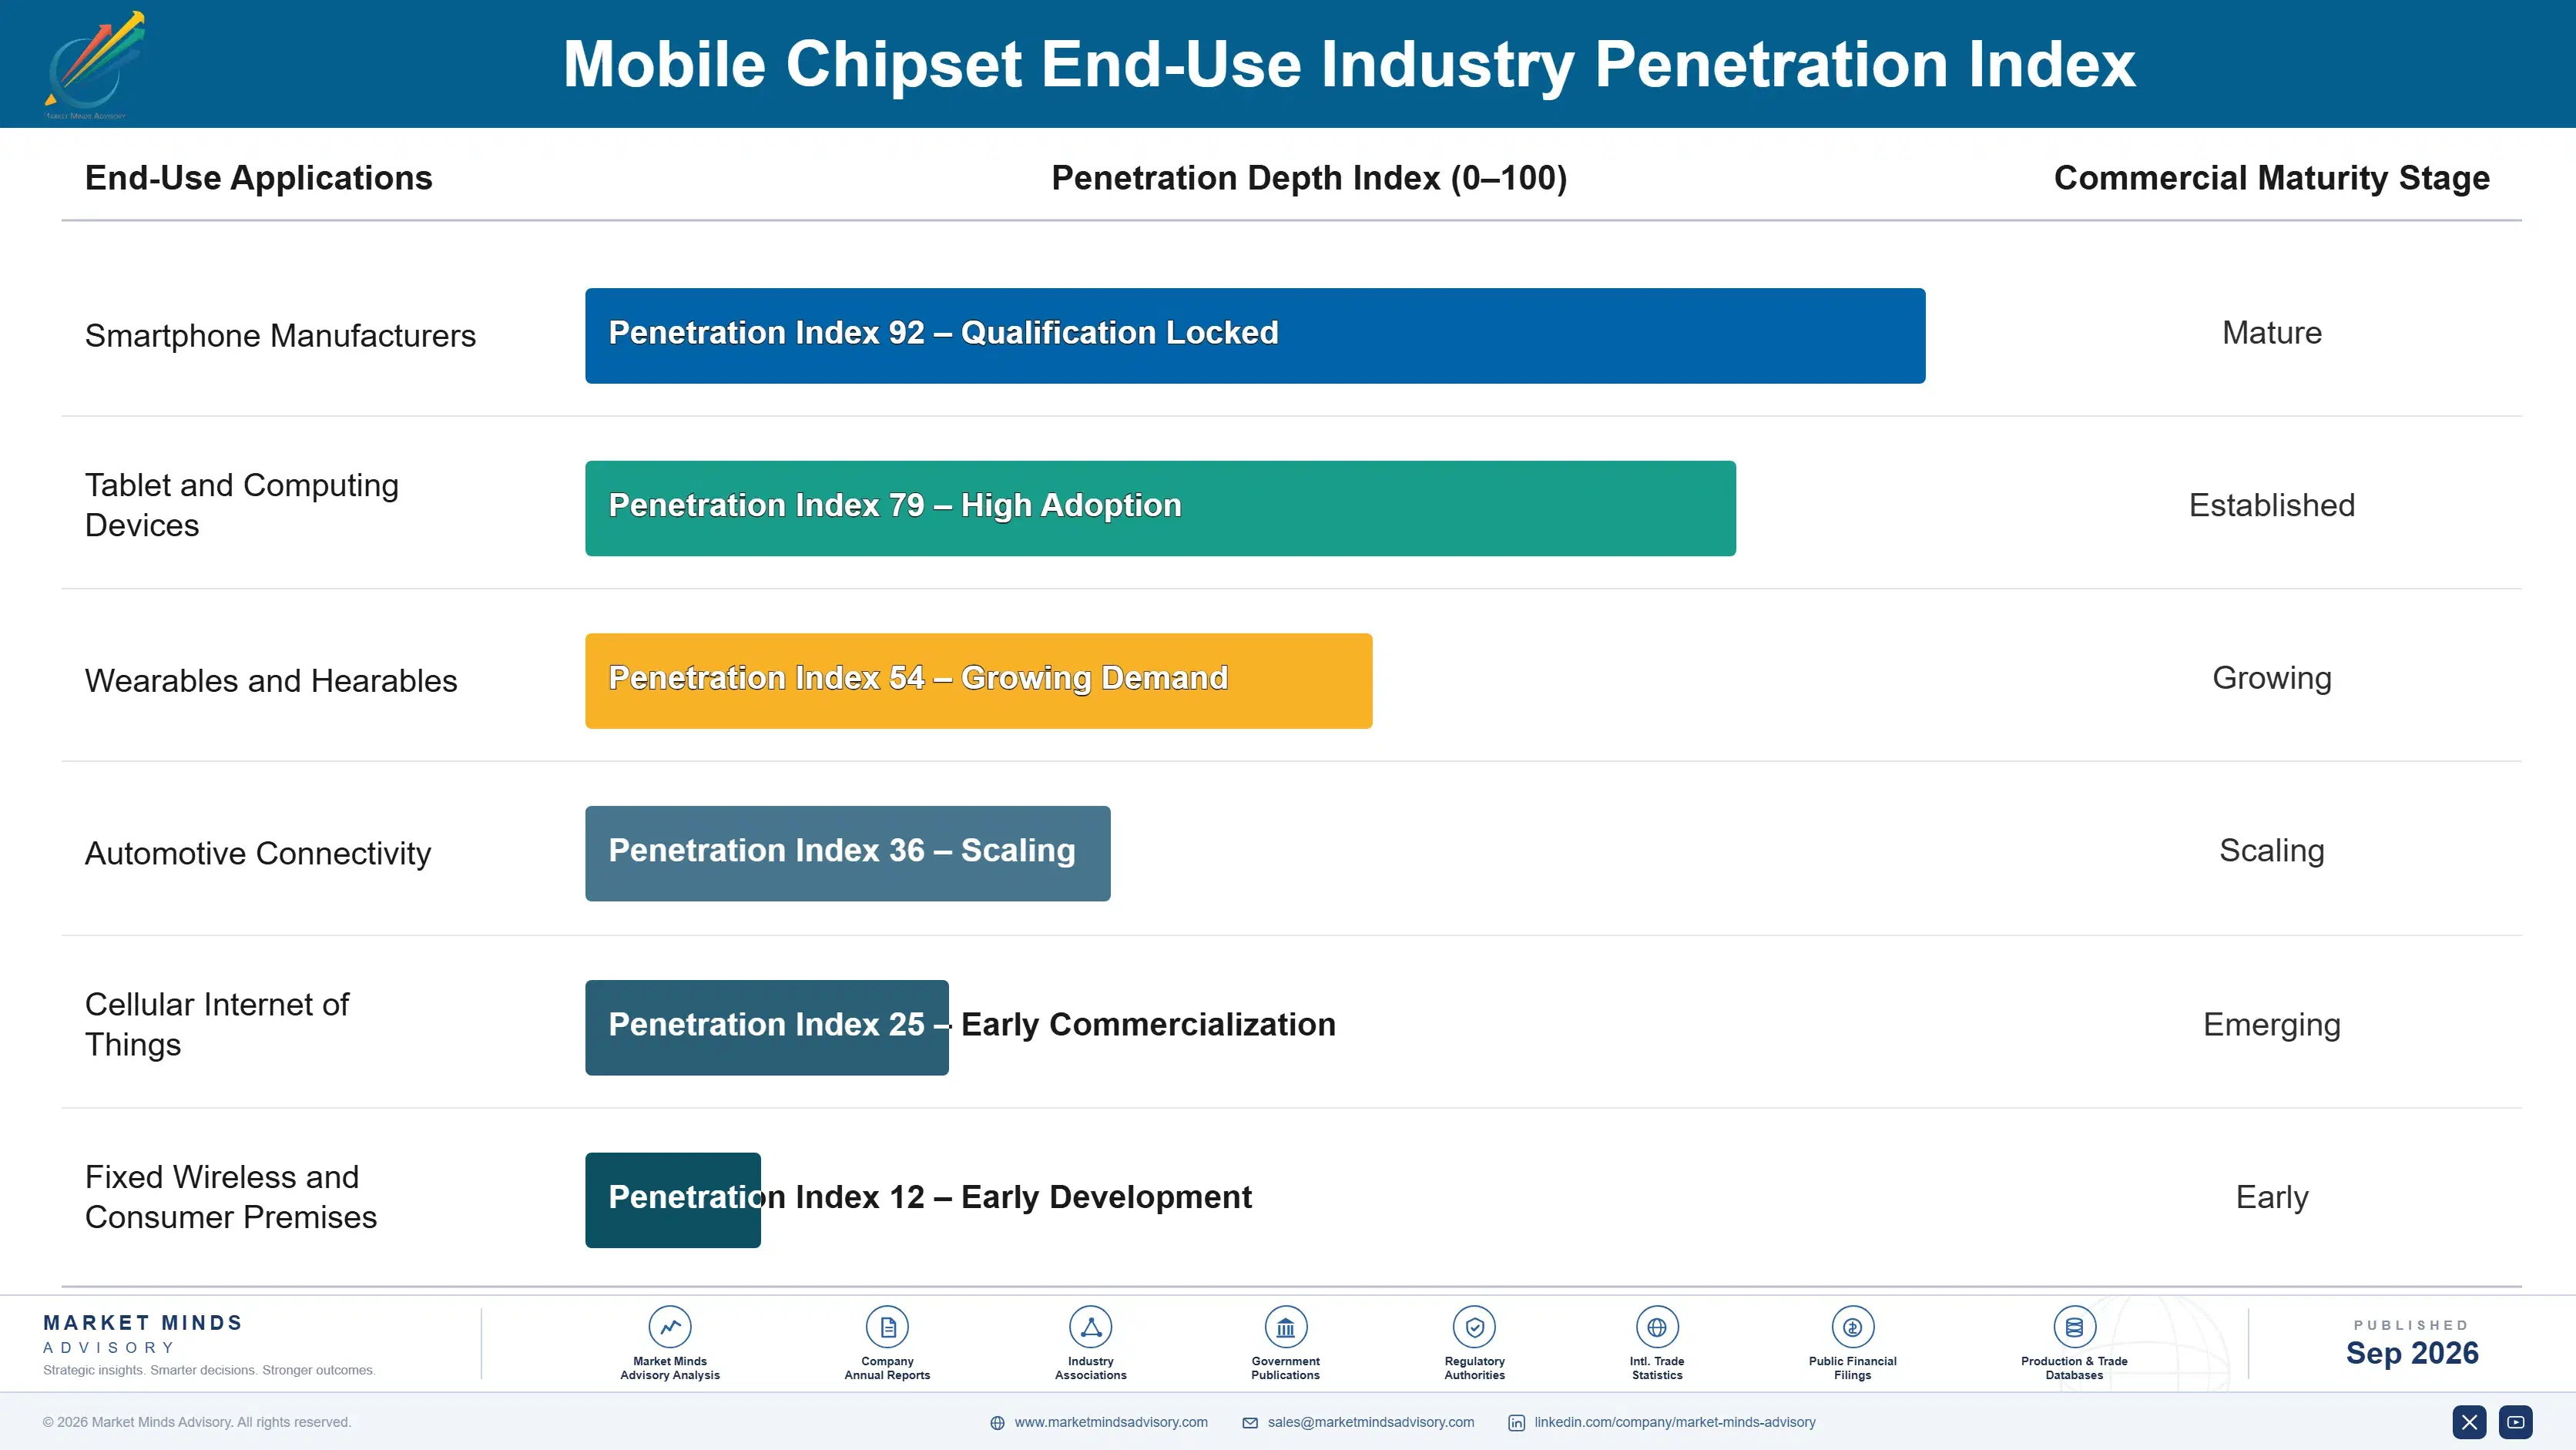
Annuity economics come from platform adoption rather than from any replacement cycle, since a chipset designed into a platform ships across every variant for that platform's life. Switching costs a handset maker a full software and certification programme, which is why design wins are fought so hard. Patent licensing sits alongside as a genuinely separate annuity running on multi-year agreements independent of any product decision.
Adoption depth varies sharply by customer type. The largest handset makers specify deeply, run their own silicon evaluation and increasingly build their own processors while still buying connectivity. Mid-size makers adopt reference designs almost wholesale and depend heavily on vendor engineering support. Regional brands targeting cost-sensitive markets buy on price and treat parts as interchangeable within a tier, which they largely are at that level.

The buyer profile has changed in one direction that matters. Chipset selection sat with handset engineering teams choosing the best available platform. At the largest customers it now sits with silicon organisations deciding what to build and what to buy, and those organisations buy only what they cannot make. That turns the most valuable customers into buyers of one component rather than a platform.
mobile-chipset-market-end-use-penetration-index-1788415774468

Where Vendors Should Compete

These are among the four positions where our research anticipates prominent divergence between winners and laggards over the coming forecast period. Each is grounded in the demand model, the regulatory perimeter, and the announced capacity pipeline.
01 / CONNECTIVITY POSITION DEFENCE

Defend the modem and concede the processor argument

Standard processor cores are licensable and companies with no semiconductor history have built excellent application processors from them, which makes the processor exactly the wrong thing to defend at this point. Carrier certification for a cellular modem across hundreds of operator networks takes years of field testing that no amount of capital compresses, and the intellectual property position took decades to build. Standalone modem demand grows at 10.4% precisely because customers cannot replicate it themselves within any workable timeframe at all.
02 / DESIGN AMORTISATION DISCIPLINE

Derive every tier from one expensive base design

Flagship design has reached roughly USD 580 million and roughly doubles at every single node transition, which only genuinely enormous shipment volume amortises, so deriving mid and entry parts from a single base spreads that cost across far more units than any flagship alone will ever ship. Vendors designing each individual tier separately are funding several expensive programmes where one programme would genuinely serve them. The discipline costs some product differentiation and buys survival at the node that follows it.
03 / LICENSING SILICON INTEGRATION

Run patents and chips as a single business

Patent licensing carries roughly four times the margin of the chipset product line at the vendors holding both positions, and that licensing revenue funds the development that keeps the silicon competitive at all. Managing them separately with separate targets produces decisions that damage the whole combination, most obviously when licensing terms get traded away simply to win chipset volume. Boards and analysts both model this incorrectly, which makes the internal argument considerably harder than it has any right to be.
04 / NON-HANDSET CONTENT GROWTH

Follow silicon into devices that are not phones

Handset unit volumes stopped growing years ago and no commercial effort restores them now, while watches, earbuds, glasses and health devices together add roughly three processors per user at design points where battery life rather than throughput decides the specification entirely. That volume is genuinely additive rather than merely substitutional. Vendors organised solely around handset design cycles reach none of it at all and continue treating the whole category as a distraction from what they regard as the real business.

Engagement Snapshot From the Field

A live engagement with an industry participant carrying material or product regulatory and market exposure ahead of a defining policy shift, showing how our research translates into a defensible multi-year portfolio strategy.
MARKET MINDS ADVISORY · CLIENT ENGAGEMENT SUMMARY
Mobile Chipset Producer Strategic Portfolio Review and Transition Roadmap 2026·Investment Scenario on Mobile Chipset Exposure Evaluation 2025-26
CLIENT PROFILE
An Asian handset manufacturer shipping across entry, mid and premium tiers in more than thirty markets, with annual revenue reported at approximately USD 9.4 billion (client-reported, unverified by MMA). Chipset sourcing was managed tier by tier through entirely separate commercial negotiations, and the company held no internal silicon design capability of any kind at all.
STRATEGIC CHALLENGE
Premium tier chipset costs had risen faster than the company could pass through in device pricing, compressing margin on exactly the products meant to carry it. Management could not establish whether the increases reflected genuine cost or supplier pricing power, and a proposal to qualify a second premium source had been deferred twice on engineering effort grounds.
MMA APPROACH
MMA reconstructed chipset cost from node economics, die area and packaging rather than accepting quoted pricing, benchmarked the client's terms against comparable manufacturers by volume tier, and assessed the engineering cost of qualifying a second premium platform against the negotiating position it would create. Competitor sourcing terms were benchmarked directly.
KEY FINDINGS
  1. Roughly 48% of premium chipset cost was wafer, and node transition explained most of the increase, but the remainder reflected pricing power that a second qualified source would directly reduce.
  2. Qualifying a second premium platform would cost less than a single year of the pricing differential the client was currently paying without any alternative available.
  3. Tier-by-tier negotiation was forfeiting volume aggregation, since the client's combined entry and mid tier shipments were substantial enough to change terms across the whole relationship.
  4. Neural silicon at around 22% of premium die area was being paid for in full while the client's software made almost no use of it in any shipping product.
CLIENT PROFILE
An Asian handset manufacturer shipping across entry, mid and premium tiers in more than thirty markets, with annual revenue reported at approximately USD 9.4 billion (client-reported, unverified by MMA). Chipset sourcing was managed tier by tier through entirely separate commercial negotiations, and the company held no internal silicon design capability of any kind at all.
STRATEGIC CHALLENGE
Premium tier chipset costs had risen faster than the company could pass through in device pricing, compressing margin on exactly the products meant to carry it. Management could not establish whether the increases reflected genuine cost or supplier pricing power, and a proposal to qualify a second premium source had been deferred twice on engineering effort grounds.
MMA APPROACH
MMA reconstructed chipset cost from node economics, die area and packaging rather than accepting quoted pricing, benchmarked the client's terms against comparable manufacturers by volume tier, and assessed the engineering cost of qualifying a second premium platform against the negotiating position it would create. Competitor sourcing terms were benchmarked directly.
KEY FINDINGS
  1. Roughly 48% of premium chipset cost was wafer, and node transition explained most of the increase, but the remainder reflected pricing power that a second qualified source would directly reduce.
  2. Qualifying a second premium platform would cost less than a single year of the pricing differential the client was currently paying without any alternative available.
  3. Tier-by-tier negotiation was forfeiting volume aggregation, since the client's combined entry and mid tier shipments were substantial enough to change terms across the whole relationship.
  4. Neural silicon at around 22% of premium die area was being paid for in full while the client's software made almost no use of it in any shipping product.
RECOMMENDED STRATEGY
Phase 1: Phase one: qualify a second premium chipset platform immediately, treating the engineering cost as a negotiating investment rather than a product programme. Phase 2: Phase two: consolidate all tier negotiations into a single volume relationship rather than continuing to bargain separately for each individual tier. Phase 3: Phase three: either build software that uses the neural silicon already being purchased or specify parts that do not carry it at all.
OUTCOME
Within ten months the client had qualified a second premium platform, consolidated negotiations across tiers, and reported premium tier bill of materials down 9.1% (client-reported, unverified by MMA). Neural feature development is now underway to use silicon the company had already been paying for regardless.

Frequently Asked Questions

Foundational context covering the market sizes, CAGR, scope, country, region and competition that inform every finding below. This section is provided to cover basics and most often pre-purchase conversations, answered from the MMA Primary Research Dataset.

What is the current size of the Mobile Chipset Market?

The market was valued at USD 41.0 billion in 2025 and reaches USD 44.53 billion in 2026. Revenue grows on content per device rather than on any handset unit growth.

How large will the Mobile Chipset Market be by 2036?

MMA forecasts USD 101.60 billion by 2036, an increase of USD 57.07 billion over the 2026 base. That represents an expansion multiple of 2.28 times.

What is the CAGR for the Mobile Chipset Market 2026 to 2036?

The base case CAGR is 8.6%, with a bull case of 9.8% and a bear case of 7.4%. The historical rate between 2020 and 2025 was 7.4%.

Which segment is growing fastest?

Premium tier flagship chipsets grow at 12.9%, half again the market rate of 8.6%. They absorb leading node cost and the neural silicon on-device model execution requires.

Who are the major companies in the Mobile Chipset Market?

Qualcomm, MediaTek, Apple, Samsung Electronics and UNISOC lead on measured chipset shipment revenue. Together they account for roughly 86% of an unusually concentrated global market.

Which country is growing fastest?

India grows fastest at 13.8%, as both a very large consuming market and a substantial assembly location under production-linked incentive schemes at the same time.

Report Segmentation Architecture

The full report scope spans multiple orthogonal segmentation dimensions, with cross-tabulated demand data provided for each dimension pair. Coverage extends further to regional breakdowns, trend trajectories, and the competitive detail needed to support segment-level decision-making.

By Chipset Tier and Device Class

  • Entry Tier Application Processors
  • Mid Tier Integrated Chipsets
  • Premium Tier Flagship Chipsets
  • Standalone Cellular Modems
  • Wearable and Hearable Processors
  • Tablet and Companion Device Chipsets

By End-Use Industry

  • Smartphone Manufacturers
  • Tablet and Computing Devices
  • Wearables and Hearables
  • Automotive Connectivity
  • Cellular Internet of Things
  • Fixed Wireless and Consumer Premises

By Supply Route and Commercial Model

  • Direct Design Win Supply
  • Reference Design Platform Sales
  • Distributor and Channel Sales
  • Internal Vertical Integration
  • Standard Essential Patent Licensing
  • Foundry Capacity Allocation

By Region

  • East Asia
  • South Asia and Pacific
  • North America
  • Western Europe
  • Latin America
  • Middle East and Africa
  • Eastern Europe

Scope, Methodology, and Coverage

Every figure in this report is reproducible from documented input assumptions. The scope below maps the historical period, the forecast horizon, the segmentation dimensions, and the countries covered, alongside the underlying primary and qualitative methodology.
Historical Period
2020 to 2025
Forecast Period
2026 to 2036
Base Year
2025 (USD billions; MMA Primary Research Dataset, September 2026)
Market Definition
The mobile chipset market covers application processors and integrated system-on-chip devices supplied for smartphones, tablets, wearables and cellular companion devices, together with standalone cellular modems, spanning entry, mid and premium tiers plus wearable and tablet classes. Sizing is measured at chipset vendor shipment revenue. Patent licensing revenue reported separately, memory and storage devices, radio frequency front ends, power management integrated circuits, image sensors, connectivity combo chips and foundry manufacturing services are excluded.
Quantitative Units
USD billions at chipset vendor shipment revenue, with supporting unit volumes and average selling prices by tier and region
Segmentation Dimensions
Chipset tier and device class, end-use industry, supply route and commercial model, region
Regions Covered
East Asia, South Asia and Pacific, North America, Western Europe, Latin America, Middle East and Africa, Eastern Europe
Countries Covered
China, Taiwan, South Korea, Japan, Vietnam, India, Indonesia, Australia, United States, Canada, Mexico, Brazil, United Kingdom, Germany, France, Poland, Egypt, Nigeria
Key Companies Profiled
Qualcomm, MediaTek, Apple, Samsung Electronics, UNISOC, Google, HiSilicon, Broadcom, Synaptics, Nordic Semiconductor, Ambiq Micro, Rockchip, Allwinner Technology, Amlogic, Sony Semiconductor Solutions, Renesas Electronics, NXP Semiconductors, Telit Cinterion, Sequans Communications, Arm Holdings
Quantitative Methodology
Primary survey, n=3,800 respondents, Q4 2025, six countries; demand-side model with trade association cross-validation
Qualitative Methodology
47 expert interviews, Q4 2025; applied to validate demand model assumptions, identify emerging dynamics, and assess competitive positioning
Report Format
PDF and XLSX data workbook (Word format preview document)
Publisher
Market Minds Advisory
Report Code
MMA-2026-TEC-681
Published
September 2026
Contact
sales@marketmindsadvisory.com | www.marketmindsadvisory.com

Purchase the full Mobile Chipset Market Report (2026 to 2036).

The full report separates unit volume from content per device throughout, which is the distinction that explains how a market with no unit growth keeps expanding in revenue. It sizes six chipset tiers and device classes with individual growth rates, seven regions built from where devices are designed and assembled rather than where they are used, and the node economics driving price independently of capability. Competitive analysis covers twenty vendors on a consistent shipment revenue basis, with modem certification depth and design amortisation treated as the decisive variables. Input cost modelling breaks out wafer, packaging and design amortisation exposure by shipment volume.
Six chipset tiers with individual growth rates
Unit volume separated from content per device
Node economics modelled against tier pricing
Modem certification barriers assessed by vendor
Twenty vendors on consistent shipment revenue basis
Wafer, packaging and design amortisation exposure

Built For The People Who Decide

From boardroom strategy to bench-side execution, this report is read cover-to-cover by leaders shaping the next decade of their industry, turning demand scenarios, market dynamics and valuation benchmarks into decisions.
CXOs/ Presidents/ VPs/ Managers
M&A and Corporate Development
Strategy Teams and R&D Heads
Procurement and Product Directors
Regulatory and Compliance Leaders
Investor Relations and Equity Analysts