Market Minds Advisory
Mobile Car Wash and Detailing Market

Mobile Car Wash and Detailing Market: Coating Economics, Water Regulation and the Technician Constraint

Ceramic coatings turned a low-ticket convenience service into skilled work worth hundreds per appointment, water discharge rules keep pushing customers off driveways, and technician recruitment now caps how fast anybody grows.

Lead Analyst

David Horsley

Published

September 2026

Make Smarter Decisions with Customized Research Insights

Request a free sample report and evaluate market opportunities, growth trends, and competitive dynamics relevant to your business needs.

2025 MARKET VALUE$7.6BMarket Size 2025
2036 FORECAST VALUE$22.6BBase Case , 2026 to 2036
CAGR 2026 TO 203610.4 %Bull 11.6% / Bear 9.2%
INCREMENTAL OPPORTUNITY$14.2BNet 10- year value creation
EXPANSION MULTIPLE2.69x2036 value over 2026 base
Strategic Levers
M&A Pipeline
Regional Outlook
Country Rankings
Competitive Intelligence
Segmental Deep-dive
Call-Us : 91 93563 13602

Executive Snapshot and Market Trajectory

This industry sells convenience, and increasingly it sells skill instead. A routine wash is a low-ticket errand somebody else performs, but a ceramic coating applied correctly takes a trained technician most of a day and commands several hundred dollars, which changes what kind of business an operator is actually running.
Ceramic and graphene coating application grows at 15.6%, a full 1.50 times the market rate, because owners keeping vehicles longer see paint protection as an investment rather than an indulgence, and the work carries margins routine washing never approaches. North America holds 38% of global value, outside the standard band, because a very large parc, suburban driveways and high labour rates all coincide here.
Concentration is extraordinarily low at 6% for the top five, which is the defining commercial fact about this market. It is overwhelmingly independent operators with a van and a pressure washer. The franchises and booking platforms building genuine scale are doing something the industry has never had, and fleet contracts are how most of them are doing it. Nothing about washing a car improves with scale, but contracting and compliance certainly do.
Market Definition
This report covers mobile vehicle washing and detailing services delivered at the customer's location, spanning exterior washing, interior cleaning, paint correction, ceramic and graphene coating application, and commercial fleet detailing across consumer, fleet, dealership and rental customers. Fixed-site car wash tunnels and bays, self-service washing facilities, retail sales of detailing chemicals and equipment, paint protection film supply, and vehicle mechanical servicing are excluded from the sizing.
Base Year Value
$7.6B in 2025 (MMA Primary Research Dataset, August 2026)
Forecast Period
2026 to 2036, eleven discrete annual values
CAGR
10.4% base case. Bull 11.6%. Bear 9.2%.
Fastest Growth Segment
Ceramic and Graphene Coating Application: 15.6% CAGR
Fastest Growth Country
India: 13.2% CAGR
Fastest Growth Region
South Asia and Pacific: 12.6% CAGR
Largest Region
North America: 38% of 2025 global value
Market Leaders
Get Spiffy, DetailXPerts, Ziebart International, Ceramic Pro and MobileWash lead on service revenue and certified network participation. Source: MMA Analysis, July 2026.
Primary Survey
n=3,800 procurement and R&D decision-makers, Q4 2025, six countries
Methodology
Demand-side build-up, cross-validated against public data, 47 expert interviews

Mobile Car Wash and Detailing Market Forecast Scenarios

mobile-car-wash-detailing-market-size-forecast-scenario-1787317060974
Between 2020 and 2025 the market compounded at 9.0%, and two quite different forces produced that number. Pandemic conditions made a service performed at somebody's home unusually attractive and pulled demand forward sharply. What followed was not the correction most operators feared, because ceramic coating adoption grew straight through the period and lifted average ticket values well beyond anything routine washing had ever generated.
The base case at 10.4% rests on three mechanisms. Coating and paint correction work keeps growing as owners hold vehicles longer and treat protection as an investment with a calculable return. Water discharge regulation across Europe, water-scarce American states and Gulf markets keeps pushing customers away from driveway washing toward operators with compliant recovery systems. Fleet outsourcing by rental operators, dealerships and corporate car pools adds contracted revenue that consumer bookings never provide.
The bull case at 11.6% turns on fleet contract adoption accelerating as rental and dealership operators outsource presentation work systematically rather than staffing it internally. The bear case at 9.2% is the technician constraint biting harder: labour is 52% of revenue, skilled coating applicators take months to train, and operators unable to recruit simply cannot serve the demand they have already generated.

What Actually Drives Mobile Detailing Value

Two businesses share one name here and they behave nothing alike. Routine mobile washing is a convenience errand with a ticket around a hundred dollars, thin margins and a technician completing perhaps seven vehicles a day. Coating and correction work is skilled labour, one vehicle per technician per day, and several hundred dollars of revenue.
TOP FIVE CONCENTRATION6%Share held by the five largest mobile detailing operators
AVERAGE SERVICE TICKET$118Typical customer spend on a single mobile appointment
WATER USE PER VEHICLE8 litresWater consumed by a low-water mobile wash service
LABOUR COST SHARE52% of revenueTechnician wages as portion of delivered service revenue
FLEET CONTRACT SHARE27%Portion of revenue from commercial fleet service agreements
DAILY VEHICLE THROUGHPUT7 vehiclesVehicles a mobile technician completes across a single shift
The shift toward the second is what has made this industry interesting. Owners keeping vehicles eight or nine years increasingly treat paint protection as spending that returns something measurable at resale, and the coating chemistry has improved enough that the claim holds up. An operator who can apply coatings competently earns in a day what a washing operator earns in a week, which is why every serious participant is moving up that ladder as fast as recruitment allows.
Recruitment is the whole constraint. Labour runs 52% of revenue, a competent coating applicator takes months to train and years to become genuinely good, and the work is physically demanding in conditions nobody controls. Operators consistently report that demand exceeds what they can staff, which is an unusual and rather enviable problem, but it caps growth precisely as effectively as weak demand would.
"Everybody analysing this industry counts vehicles and nobody counts technicians, which is backwards. The binding constraint is not how many people want their car detailed, it is how many people can be trained to apply a coating without leaving high spots that the customer will notice in three weeks."
Practice Director, Automotive Services and Aftermarket, Market Minds Advisory ·

Market Trends

Ceramic Coating Converts Convenience Work Into Skilled Trade

Coating application has moved from a specialist niche into the core revenue driver for serious mobile operators, and it changes the economics completely. A routine wash generates roughly $118 across an appointment lasting under an hour, while a full coating application occupies a trained technician for most of a day and commands several hundred dollars at margins routine washing cannot approach. Owners holding vehicles eight or nine years increasingly treat the spend as protecting resale value rather than as indulgence, which makes the purchase considerably easier for them to justify to themselves.
Market Impact: Parc averages 13 years

Water Discharge Rules Push Customers Off Their Driveways

Wastewater regulation across Western Europe, water-scarce American states and Gulf jurisdictions increasingly prohibits washing vehicles where runoff enters storm drains untreated, which makes driveway washing legally awkward for the owner and commercially valuable for compliant operators. Closed-loop recovery systems and waterless methods using around 8 litres per vehicle satisfy those rules easily where a garden hose plainly does not. Compliance capability that operators initially treated purely as a cost has now become a genuine differentiator, particularly for fleet and corporate customers who now need documented environmental practice before awarding any work.
Market Impact: Supplies 27% of revenue

Market Opportunities and Growth Drivers

Longer Vehicle Ownership Makes Paint Protection An Investment

Average vehicle age across major markets keeps rising, and North American owners now hold cars close to thirteen years. An owner planning to keep a vehicle that long calculates paint protection differently from one trading every three years, because degradation they will personally live with, and eventually sell against, becomes a genuine financial consideration rather than a cosmetic one. Coating chemistry has improved enough that durability claims hold up over several years rather than several months, which has removed most of the scepticism that limited adoption when the category first appeared.
Market Impact: Training takes 9 months

Fleet Outsourcing Creates Contracted Rather Than Booked Revenue

Rental operators, dealership groups, corporate car pools and rideshare drivers all need vehicles presented consistently, and staffing that work internally means managing exactly the labour most of them would rather not employ at all. Fleet contracts already supply 27% of revenue across formal operators and grow faster than consumer bookings, because the work is scheduled rather than requested and the customer is buying reliability rather than convenience. Contracted revenue also transforms an operator's ability to plan technician capacity, which is the single constraint that everything else in this business depends upon.
Market Impact: Top five hold 6% share

Market Restraints and Challenges

Technician Recruitment Caps Growth More Than Demand Does

Labour runs 52% of revenue and a competent coating applicator takes months to train and years to become genuinely skilled at it. The root cause is that the work is physically demanding, performed outdoors in whatever conditions arise, and competes for the same people that construction and logistics recruit continuously. Commercially this caps growth regardless of order book, and operators consistently report demand they simply cannot serve. Participants are responding with structured apprenticeships, certification pathways that create visible progression, and pay levels set considerably above where this industry historically sat.
Market Impact: Commands 4 times wash ticket

Fragmentation Prevents Scale Economics From Ever Materialising

The top five participants together hold roughly 6% of this market, and the rest is independent operators running one or two vans. The root cause is a genuinely low entry barrier: a vehicle, a pressure washer and some chemicals establish a business, and nothing about scale improves service quality directly. Commercially this compresses pricing wherever routine washing is the offer and makes brand building expensive. Participants are responding by pursuing fleet contracts that independents cannot service, by building certification credibility, and by using booking platforms to aggregate demand across whole metropolitan markets.
Market Impact: Uses 8 litres per vehicle
4 additional market trends, 3 additional growth drivers, and 2 additional restraints and challenges are covered in the full report. Contact sales@marketmindsadvisory.com to access the complete intelligence.

Segment CAGR and Growth Architecture

Segmentation follows service type, because what is actually performed on the vehicle determines the technician skill required, the time an appointment occupies, the chemicals and equipment involved and the ticket value the customer will accept. Booking channel, customer type and geography all sit downstream of that service decision and are priced directly against it.
mobile-car-wash-detailing-market-market-share-analysis-1787317061507

Ceramic and Graphene Coating Application

The fastest segment at 15.6%, a full 1.50 times the market rate, covering application of ceramic, graphene and comparable protective coatings to paint, glass, wheels and interior surfaces at the customer's location. Ownership duration is what created the segment. An owner keeping a vehicle eight or nine years calculates paint protection as spending that returns something measurable at resale, which is an entirely different decision from one made by somebody trading every three years. Coating chemistry improved enough that durability claims now hold up across several years rather than months. Application is skilled work occupying a trained technician for most of a day, and the resulting ticket runs several times a routine wash at margins washing never approaches.
CAGR 15.6%

Paint Correction and Restoration

Growing at 12.4% on machine polishing, swirl removal, oxidation correction and scratch repair performed before coating or as standalone restoration work. Two customer groups drive it. Owners preparing a vehicle for sale correct paint because the return at resale is visible and immediate, while enthusiast owners buy correction as maintenance in its own right. The work also precedes almost every coating application, since sealing defects under a ceramic layer preserves them permanently, which ties the two segments together commercially. Skill is the entire constraint here: correction removes clear coat that cannot be replaced, and an inexperienced technician can easily damage a panel beyond what any amount of polishing will recover.
CAGR 12.4%
Full segment breakdown across 5 segments available in the complete report.

Regional Architecture and Country Demand Map

North America holds 38% of global value because a very large parc, suburban driveways and high labour rates coincide here as they do nowhere else. East Asia follows on water restriction and booking platforms, while growth runs fastest across South Asia and Pacific on labour economics and water scarcity.

North America

Note: North America holds 38% against a 22 to 32% band because three conditions coincide here that exist together nowhere else. The vehicle parc runs above 290 million with owners keeping cars longer than ever, suburban geography puts most vehicles in driveways where a mobile technician can work while the owner does something else, and labour rates are high enough that convenience carries genuine willingness to pay. Franchise and platform infrastructure developed on that base earlier than anywhere. Fleet outsourcing by rental operators, dealerships and rideshare drivers adds a second stream that fixed-site washes cannot serve at the customer's own location. Nowhere else in the world combines all three of those conditions together.
Share: 38% | CAGR: 9.9% (2026 to 2036)

East Asia

Water scarcity and application platforms define this region rather than parc size alone. Northern Chinese cities restrict conventional car washing during dry periods, which pushed low-water and waterless mobile services from novelty into practical necessity considerably earlier than Western markets. On-demand service applications are embedded in daily life across China in ways Western equivalents have never matched, and mobile washing slotted into that habit naturally. Japanese and Korean demand skews toward premium detailing and coating work rather than routine washing, reflecting both a smaller domestic parc and a cultural expectation of vehicle presentation that supports high ticket values. Necessity rather than convenience is what built the habit here, and that origin still shapes what customers expect.
Share: 22% | CAGR: 11.6% (2026 to 2036)
Regional intelligence for 5 additional markets available in the complete report: Western Europe, South Asia and Pacific, Latin America, Middle East and Africa, Eastern Europe. Contact sales@marketmindsadvisory.com.
mobile-car-wash-detailing-market-country-cagr-analysis-1787317062031

Where Detailing Margin Is Actually Won

Four positions separate operators building real businesses from those running a van at commodity rates: moving revenue mix toward coating and correction work, winning fleet contracts that independents cannot service, building a technician pipeline internally rather than recruiting it, and holding the water compliance capability that corporate and fleet customers now require documented before awarding anything.

Move Revenue Mix Toward Coating And Correction Work

A routine wash generates around $118 across an appointment lasting under an hour, while coating application occupies a trained technician for most of a day and commands several hundred dollars. Operators shifting mix toward coating and correction hold 18 to 26 points more gross margin on the same technician hour, because the customer in that case is buying demonstrable skill rather than mere convenience. The constraint is training rather than demand, which means the mix shift happens only as fast as an operator can develop people genuinely capable of doing the work properly.
Market Impact: Adds 26 margin points on every tech

Win Fleet Contracts Independent Operators Cannot Service

Rental operators, dealership groups and corporate car pools all need invoicing, insurance certificates, documented environmental compliance and consistent scheduling, none of which a single-van independent operator can provide credibly at all. Operators meeting all of those requirements win contracted work at 22% to 30% better revenue predictability than consumer bookings ever deliver, and fleet revenue already supplies 27% of the formal market across this industry. Contracted volume also lets an operator plan technician capacity against known demand rather than guessing at it, which addresses the constraint that everything else here depends upon.
Market Impact: Improves revenue predictability by

Build The Technician Pipeline Internally Not By Recruiting

Competent coating applicators take months to train and years to become genuinely skilled, and every operator in this market is bidding for the same scarce people against construction and logistics employers. Structured apprenticeship with visible certification progression adds capacity at roughly 45% of the cost of recruiting trained technicians from competitors, and retention runs considerably better because the progression pathway is real. It is slow to build, which is precisely why so few operators have ever started one, and why those who did now hold a genuine and durable advantage.
Market Impact: Adds capacity at 45% of external re

Hold Water Compliance Capability Customers Now Require Documented

Wastewater discharge rules across Western Europe, water-scarce American states and Gulf jurisdictions all make driveway washing legally awkward, and corporate and fleet customers increasingly require documented environmental practice before awarding any work at all. Closed-loop recovery and waterless systems using around 8 litres per vehicle satisfy those requirements easily where a garden hose plainly does not. Operators holding that capability win 15% to 22% more fleet tenders than delivered price alone would ever predict, and the equipment cost involved is genuinely modest against the value of contracts it opens up.
Market Impact: Wins 22% more fleet tender awards t

Who Controls the Margin Pool

Concentration sits at 6% for the top five measured on service revenue and certified network participation, the basis used throughout this section, and it is the lowest figure in any market this practice covers. Get Spiffy and DetailXPerts lead through franchise and fleet operations, Ziebart holds established brand recognition across both fixed and mobile service, and Ceramic Pro operates a certified installer network at genuine scale internationally.
Competitive activity runs on three fronts. Coating certification is the first, since installer networks give product brands a service position and give operators credibility they cannot build alone. Fleet contracting is the second, and it is where scale genuinely matters because independents cannot meet the compliance requirements. The third is technician development, which every serious participant now treats as a capability rather than a personnel issue.

Pressure comes almost entirely from the fragmented base rather than from any named competitor. Independent operators enter continuously because the barrier is a van and a pressure washer, and they compress pricing wherever routine washing is the offer. Rankings will shift on who builds technician capacity fastest, since demand across this market already exceeds what the industry can collectively staff.
mobile-car-wash-detailing-market-company-positioning-matrix-1787317062556

Competitive Moat and Risk Dimensions

GET SPIFFY

Moat: Fleet contracting and scheduling technology

Technology built around route scheduling, fleet reporting and compliance documentation lets the business serve rental, dealership and corporate customers that independent operators simply cannot bid for credibly. Contracted fleet revenue also allows technician capacity to be planned against known demand, which converts the industry's binding constraint into something manageable rather than a permanent ceiling.
GET SPIFFY

Risk: Capital intensity of van fleets

Growth requires vehicles, equipment and technicians ahead of the revenue they generate, which makes expansion considerably more capital hungry than an asset-light platform model would be. Independent operators carry those costs personally and can undercut on price in any market where routine washing rather than coating work is what the customer actually wants.
CERAMIC PRO

Moat: Certified installer network reach

A certified installer network converts product supply into service market participation without owning technicians or vehicles, and the certification itself gives independent operators credibility they could never build alone. That structure scales internationally at very low capital intensity while the brand captures value from work performed by thousands of businesses it does not employ.
CERAMIC PRO

Risk: Limited control over service quality

Certification governs training and product use but not day-to-day workmanship, and a poor application by one installer damages a brand promise the customer associates with the coating rather than the operator. Competing coating brands recruit from the same installer base continuously, which makes network loyalty considerably less durable than it appears from outside.

Players Tracked

Prominent Players

Get Spiffy
DetailXPerts
Ziebart International
Ceramic Pro
MobileWash

Other Key Players

Washos
Rightlook Automotive
Auto Bella
Ecowash Mobile
System X Ceramic
IGL Coatings
Gtechniq
Turtle Wax
SONAX
Autoglym
Detailing Devils
Exppress Car Wash
Squeaky Clean Car Care
Meguiar's
XPEL

Recent Developments

FEBRUARY 2025

Rental operator outsources full fleet presentation programme

A national rental operator contracted mobile detailing across all of its airport and city centre locations rather than continuing to staff vehicle presentation internally, which transfers labour recruitment, equipment investment and environmental compliance obligations onto a supplier able to document all three of them properly.
Signal: Fleet operators are now outsourcing presen
JUNE 2025

Water discharge enforcement tightens across several jurisdictions

Municipal enforcement of vehicle wastewater discharge rules tightened materially across several water-scarce American and European jurisdictions during the year, which now makes driveway washing genuinely awkward legally for vehicle owners and steers that demand steadily toward mobile operators running closed-loop water recovery or genuinely waterless systems instead.
Signal: Environmental enforcement rather than conv
OCTOBER 2025

Certification pathway launched for coating application technicians

A recognised industry body launched a new structured certification pathway for coating application technicians, covering surface preparation, paint correction, application discipline and final inspection, which addresses the skills shortage that operators across this market consistently identify as the single binding constraint on their own growth.
Signal: Technician certification is being treated

What Drives Mobile Detailing Cost

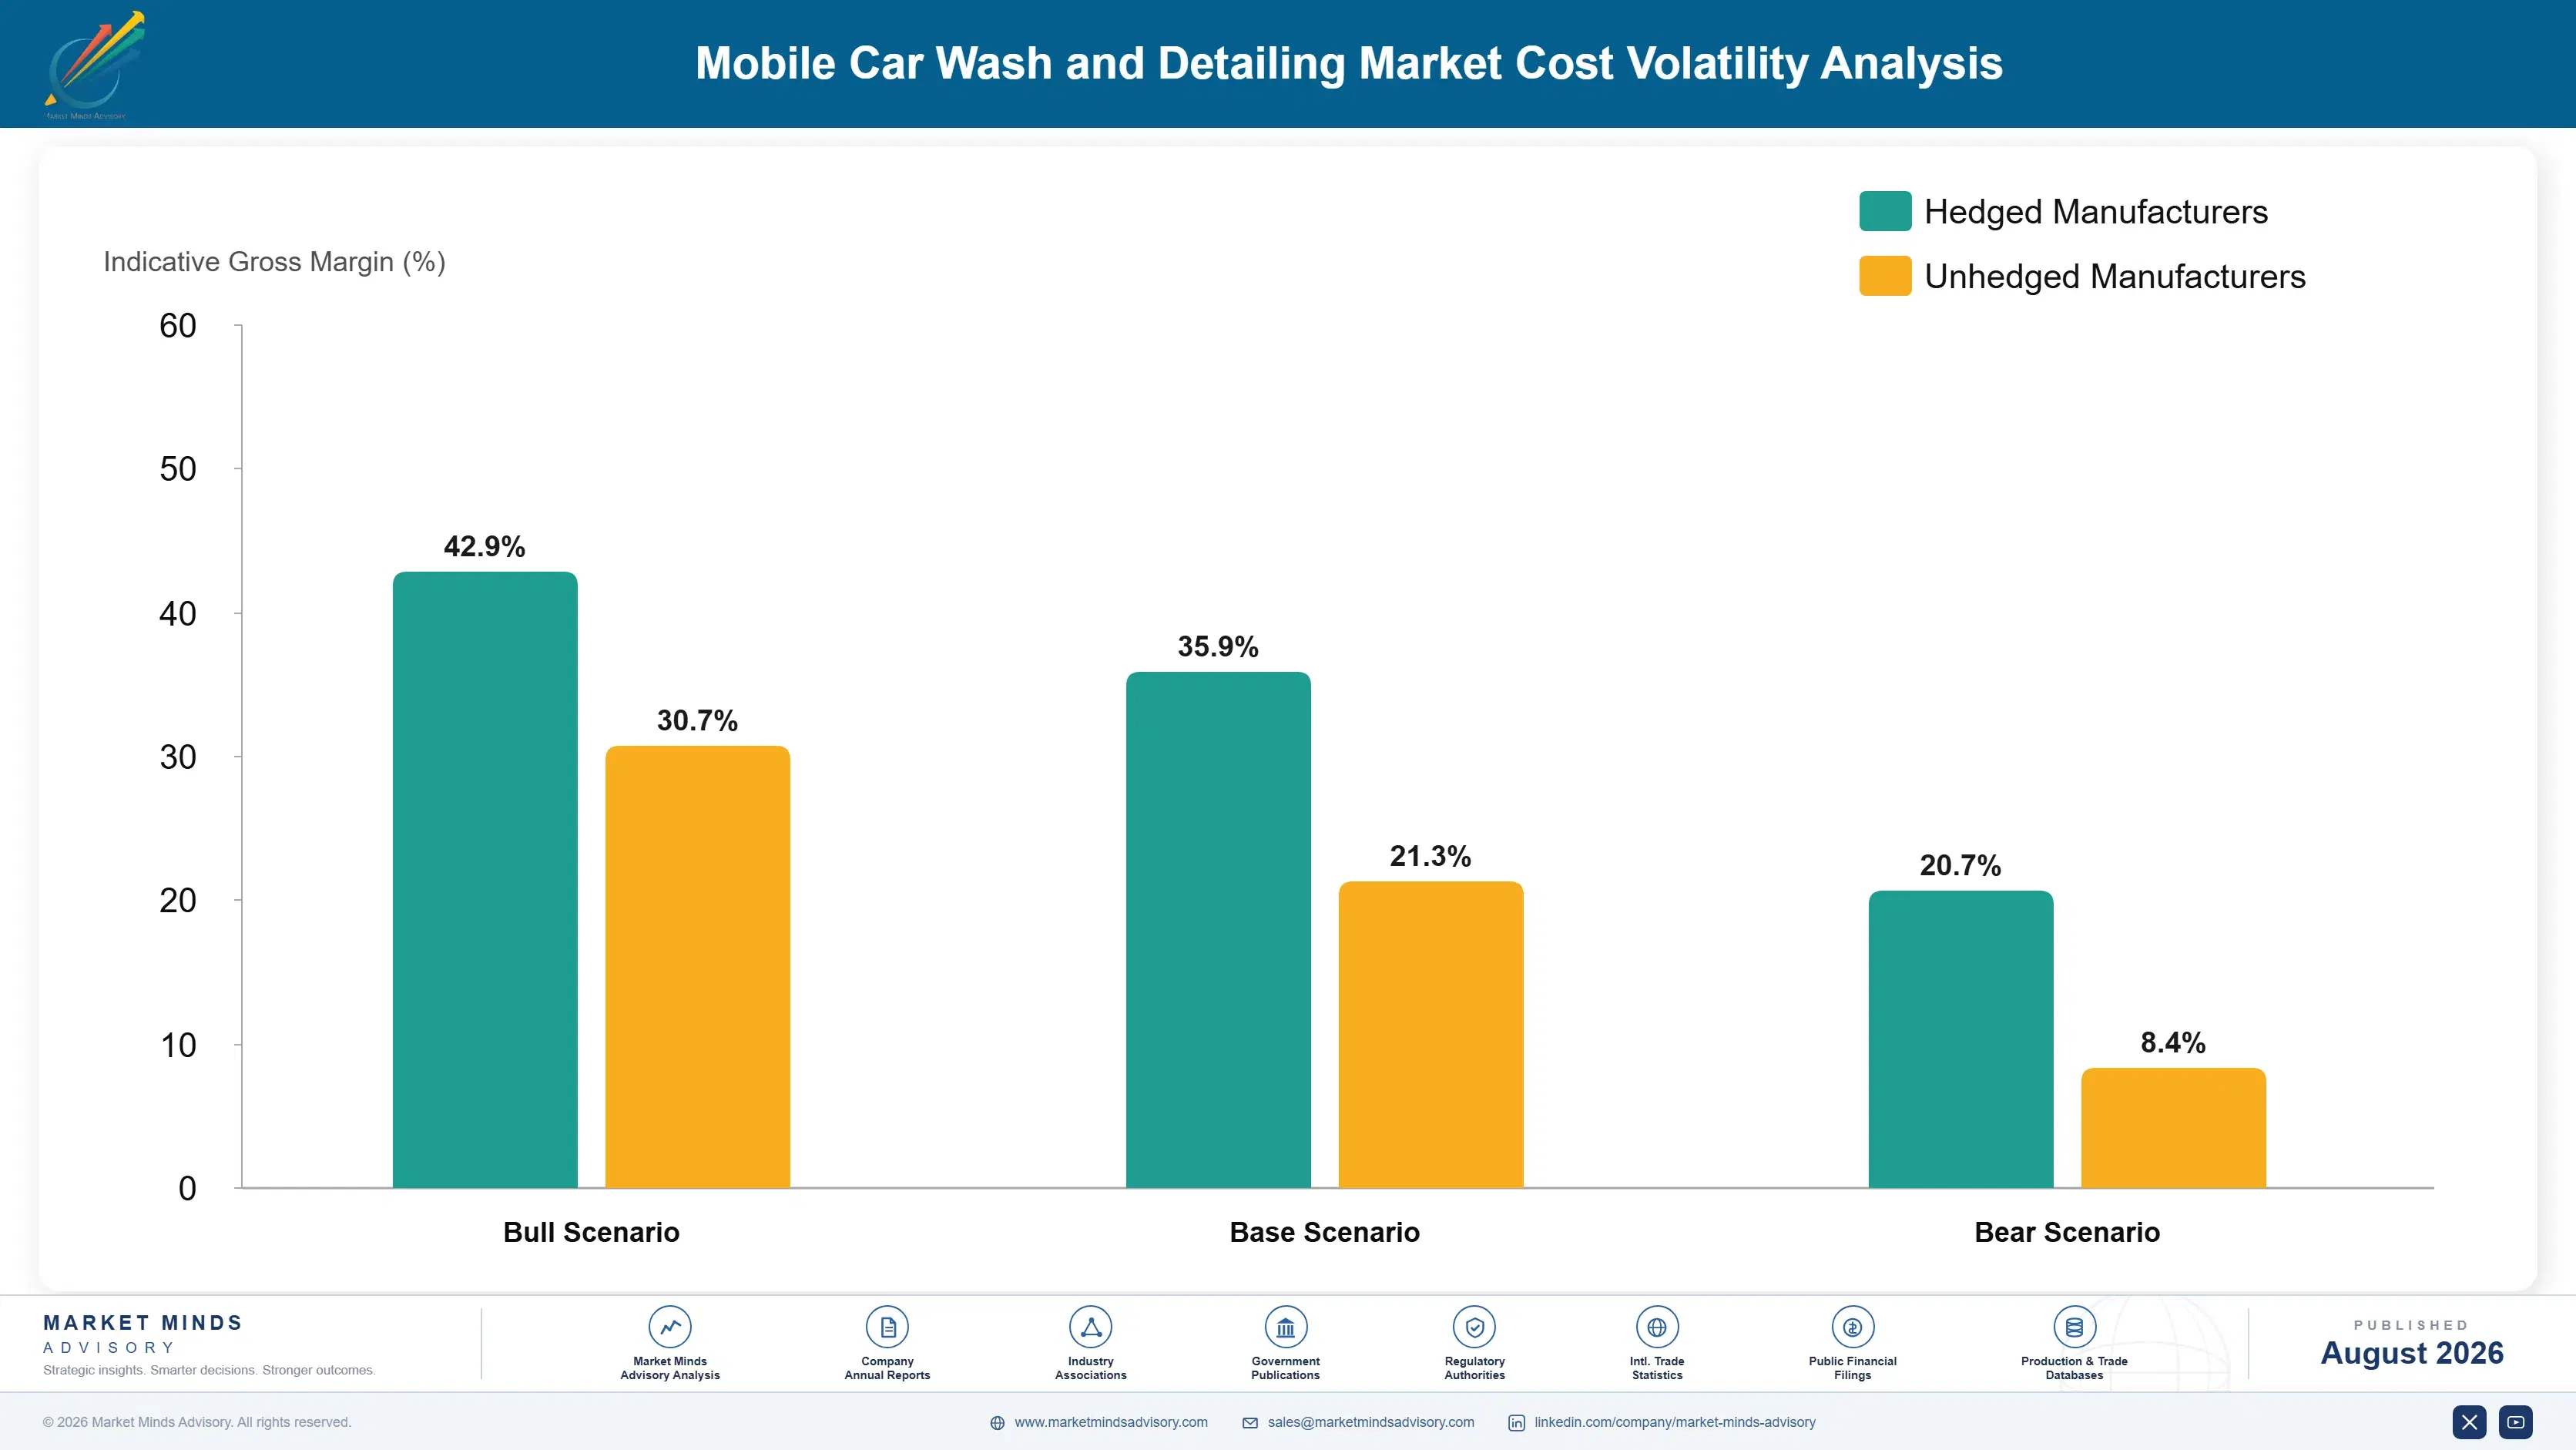
Labour dominates in a way manufacturing markets never see. Technician wages account for roughly 52% of delivered service revenue, and that share rises further on coating and correction work where one vehicle occupies a technician all day. Vehicle acquisition, equipment and depreciation add around 14%, chemicals and consumables roughly 11%, fuel about 6%, and insurance plus licensing a further 5%.
Technician wage inflation since 2021 has been the defining cost event and it has not reversed. Competition for the same workers from construction and logistics pushed rates up sharply, and operators who could not follow lost people rather than paying more. United States Bureau of Labor Statistics wage data shows that trajectory clearly. Fuel moved separately with energy markets, and chemical pricing followed surfactant and polymer feedstock costs through the same period.

The disadvantage mechanism here is service mix rather than input purchasing. An operator whose revenue is mostly routine washing carries labour at 52% against a ticket around $118, while one doing coating work carries similar labour against several hundred dollars, and the margin gap is enormous. Exposure varies by geography too: Indian and Southeast Asian operators serve ordinary owners profitably at price points Western labour rates make impossible.
mobile-car-wash-detailing-market-cost-volatility-analysis-1787317062752

Shift service mix toward higher ticket skilled work

Coating and correction work carries similar labour hours against several times the revenue of routine washing, which dilutes wage exposure without reducing wages at all. The constraint is training capacity rather than customer demand. Operators who invested in technician development ahead of the wage inflation now carry a cost structure that competitors stuck on routine washing simply cannot match.

Build route density to cut unproductive travel time

A technician travelling between scattered appointments is paid for hours that generate no revenue, and in dispersed suburban markets that can consume a quarter of the shift. Scheduling for geographic density, or anchoring routes around fleet sites with multiple vehicles, converts travel time into billable work. It requires booking software and route discipline rather than any capital investment at all.

Standardise chemical systems across the whole operation

Technicians using whatever product they prefer create inconsistent results, unpredictable consumption and purchasing that captures no volume benefit. Standardising on one chemical system across every van concentrates purchasing, simplifies training and makes quality genuinely repeatable. The trade is flexibility on unusual jobs, which experienced technicians resist but which matters less than consistency does at any real scale.

Portfolio Architecture for Margin Defence

Portfolio economics here divide almost entirely on technician skill rather than on customer type. Routine mobile washing earns gross margins in the high teens, because labour is 52% of a ticket around $118, the work requires little training, and any independent with a van and a pressure washer competes on identical terms in the same neighbourhood. Nothing about scale improves the service itself.
The premium tier is fleet contract work. Scheduled volume, invoicing, insurance and documented environmental compliance are requirements independents cannot meet, and contracted revenue lets an operator plan technician capacity rather than guess at it. Margins run in the high twenties, and the predictability is worth as much as the margin itself. Compliance documentation is what actually excludes the competition.

Above both sits coating and correction. The same technician hour that generates around $118 washing a car generates several hundred dollars applying a coating, and the customer is buying demonstrable skill rather than convenience they could arrange elsewhere. Margins reach the low forties, the competitive field narrows sharply to operators who can actually do the work, and certification credibility rather than price is what wins the booking.

Volume / Commodity-Adjacent

Routine mobile exterior and interior washing at consumer appointments. Labour dominates a modest ticket, training requirements are minimal, and any independent operator with a van competes on identical terms locally.
Gross Margin: 16 to 22%

Premium / Certified

Contracted fleet, rental and dealership detailing delivered under scheduled multi-site agreements. The range reflects contract size and how much compliance documentation, reporting and site access management the customer actually requires.
Gross Margin: 26 to 33%

Sustainability / Regulatory / Next-Generation

Ceramic coating application and paint correction work at consumer and enthusiast level. The wide range spans single-stage coatings through to multi-day correction and layered protection packages applied to high-value vehicles.
Gross Margin: 38 to 46%
mobile-car-wash-detailing-market-portfolio-architecture-1787317063253

High-value Sub-segments and Strategic Watch-out

Ceramic Coating Consumer Application

High value and high growth sitting squarely together. The same technician hour generates several times routine washing revenue, longer vehicle ownership periods make paint protection a genuinely calculable investment, and certification credibility rather than delivered price is what actually wins the booking in this segment.
Gross Margin: 40 to 47%

Contracted Fleet Detailing Agreements

High value running on genuinely strong underlying growth. Compliance documentation, invoicing and insurance requirements together exclude independent operators entirely, and scheduled contracted volume lets an operator plan technician capacity properly against known demand rather than simply guessing at it from one month to the next.
Gross Margin: 26 to 33%

Paint Correction And Restoration Work

The skilled core that feeds almost everything else sitting above it in this portfolio. Correction precedes almost every coating application, because sealing defects underneath a coating preserves them permanently, and the work demands experience that separates genuinely capable operators from those who merely own the equipment.
Gross Margin: 33 to 40%

Routine Consumer Wash Appointments

The strategic watch-out sitting squarely inside this particular service portfolio. Volumes here keep technicians occupied and generate exactly the customer relationships that later carry coating work, but labour consumes over half of the ticket, and any independent operator with a van competes on entirely identical terms.
Gross Margin: 16 to 22%

How Detailing Demand Repeats

Repeat business here divides sharply by service. Routine washing repeats naturally on a two to six week cadence and converts readily into subscription arrangements that smooth operator revenue. Coating work repeats every three to five years, which is far too infrequent to build a business on alone, but it generates maintenance washing in between that the applying operator is best placed to capture and usually does.
Stickiness varies considerably by customer. Fleet contracts are the stickiest, because switching supplier means renegotiating compliance documentation, retraining site access and disrupting a schedule the customer depends upon. Coating customers are sticky through the warranty period since maintenance requirements are tied to it. Subscription washing customers churn moderately on convenience and pricing. One-off consumer bookings show almost no loyalty at all, comparing operators on availability and price alone.

The buyer profile has shifted noticeably. Early mobile detailing customers were enthusiasts who cared intensely about their vehicles and would have done the work themselves given time. Today's growth customer is either a fleet manager outsourcing labour they no longer wish to employ, or an ordinary owner protecting an asset they intend to keep for a decade, and neither buys on enthusiasm at all.
mobile-car-wash-detailing-market-end-use-penetration-index-1787317063739

Where To Compete And Why

These are among the four positions where our research anticipates prominent divergence between winners and laggards over the coming forecast period. Each is grounded in the demand model, the regulatory perimeter, and the announced capacity pipeline.
01 / SERVICE MIX ELEVATION

Same hour, several times the revenue

A routine wash generates around $118 in under an hour while coating application occupies a trained technician for most of a day at several hundred dollars, and the labour cost per hour is broadly identical. Operators shifting mix toward coating and correction hold 18 to 26 points more gross margin on the same technician hour. The constraint is training capacity rather than customer demand, which means the shift happens only as fast as an operator develops people who can do the work properly.
02 / FLEET CONTRACT CAPTURE

Independents cannot meet the requirements

Rental operators, dealership groups and corporate car pools require invoicing, insurance certificates, documented environmental compliance and reliable scheduling, none of which a single-van independent operator can provide credibly at all. Operators meeting all of those requirements win contracted work at 22% to 30% better revenue predictability than consumer bookings ever deliver. Contracted volume also lets technician capacity be planned properly against known demand rather than guessed at, which directly addresses the single constraint that limits everything else in this business.
03 / TECHNICIAN PIPELINE DEVELOPMENT

Train the people nobody else is training

Competent coating applicators take months to train and years to master, and every operator in this market is bidding for the same scarce people against construction and logistics employers who pay comparably. Structured apprenticeship with visible certification progression adds capacity at roughly 45% of the cost of recruiting trained technicians from competitors, with considerably better retention afterwards. It is slow to build, which is exactly why so few operators ever started one, and why those who did now hold genuinely real advantage.
04 / WATER COMPLIANCE CAPABILITY

Regulation turns cost into competitive position

Wastewater discharge rules across Europe, water-scarce American states and Gulf jurisdictions make driveway washing legally awkward, and corporate customers now increasingly require documented environmental practice before awarding any contracts. Closed-loop recovery and waterless systems using around 8 litres per vehicle satisfy requirements a garden hose does not. Operators holding that capability win 15% to 22% more fleet tenders than delivered price alone would ever predict, and the equipment cost involved is genuinely modest against the value of contracts it opens up.

Engagement Snapshot From the Field

A live engagement with an industry participant carrying material or product regulatory and market exposure ahead of a defining policy shift, showing how our research translates into a defensible multi-year portfolio strategy.
MARKET MINDS ADVISORY · CLIENT ENGAGEMENT SUMMARY
Mobile Car Wash and Detailing Producer Strategic Portfolio Review and Transition Roadmap 2026·Investment Scenario on Mobile Car Wash and Detailing Exposure Evaluation 2025-26
CLIENT PROFILE
A North American mobile detailing operator running 62 service vans across four metropolitan markets, with annual revenue near $34 million (client-reported, unverified by MMA), roughly 74% of it from routine consumer washing appointments booked through its own application. The business held strong brand recognition and booking volume but limited coating capability, and technician turnover was running above 60% annually.
STRATEGIC CHALLENGE
Gross margin had compressed as wage inflation outpaced what the market would accept for routine washing, and turnover meant the business was continuously training people who left before becoming productive. Management needed to decide whether to invest in coating capability, pursue fleet contracts that would require compliance infrastructure it did not hold, or consolidate into fewer markets and manage for cash.
MMA APPROACH
MMA modelled revenue and margin per technician hour across each service type using the client's own scheduling data, benchmarked wage and retention against comparable service employers by market, and assessed the capability and capital requirements for coating and fleet entry. Nineteen expert interviews with technicians, fleet managers and coating brand representatives tested where capacity and demand actually constrained each other.
KEY FINDINGS
  1. Routine washing generated roughly a fifth of the gross margin per technician hour that coating work produced, and the client's mix was almost entirely weighted toward the lower figure.
  2. Technician turnover above 60% meant the business spent heavily on training people who left before productivity, and exit interviews consistently cited absence of any visible progression pathway.
  3. Fleet opportunities across the four markets were substantial but required environmental compliance documentation and insurance the client had never needed for consumer work.
  4. Route density in two of the four markets was poor enough that travel consumed around a quarter of paid technician hours, which was correctable through scheduling alone.
CLIENT PROFILE
A North American mobile detailing operator running 62 service vans across four metropolitan markets, with annual revenue near $34 million (client-reported, unverified by MMA), roughly 74% of it from routine consumer washing appointments booked through its own application. The business held strong brand recognition and booking volume but limited coating capability, and technician turnover was running above 60% annually.
STRATEGIC CHALLENGE
Gross margin had compressed as wage inflation outpaced what the market would accept for routine washing, and turnover meant the business was continuously training people who left before becoming productive. Management needed to decide whether to invest in coating capability, pursue fleet contracts that would require compliance infrastructure it did not hold, or consolidate into fewer markets and manage for cash.
MMA APPROACH
MMA modelled revenue and margin per technician hour across each service type using the client's own scheduling data, benchmarked wage and retention against comparable service employers by market, and assessed the capability and capital requirements for coating and fleet entry. Nineteen expert interviews with technicians, fleet managers and coating brand representatives tested where capacity and demand actually constrained each other.
KEY FINDINGS
  1. Routine washing generated roughly a fifth of the gross margin per technician hour that coating work produced, and the client's mix was almost entirely weighted toward the lower figure.
  2. Technician turnover above 60% meant the business spent heavily on training people who left before productivity, and exit interviews consistently cited absence of any visible progression pathway.
  3. Fleet opportunities across the four markets were substantial but required environmental compliance documentation and insurance the client had never needed for consumer work.
  4. Route density in two of the four markets was poor enough that travel consumed around a quarter of paid technician hours, which was correctable through scheduling alone.
RECOMMENDED STRATEGY
Phase 1: Phase one: fix scheduling density and launch a certification pathway giving technicians visible progression, addressing turnover before adding any new service capability. Phase 2: Phase two: build coating capability progressively as certified technicians become available, rather than committing to volumes the workforce cannot yet support. Phase 3: Phase three: pursue fleet contracts once compliance documentation and coating capacity are both genuinely in place across the core markets.
OUTCOME
The client cut technician turnover from above 60% to 34% within a year and reported travel time falling to 16% of paid hours (client-reported, unverified by MMA). Coating revenue reached $6 million in the first full year against a $4 million plan, blended gross margin improved by roughly seven points, and two fleet contracts have since been won.

Frequently Asked Questions

Foundational context covering the market sizes, CAGR, scope, country, region and competition that inform every finding below. This section is provided to cover basics and most often pre-purchase conversations, answered from the MMA Primary Research Dataset.

What is the current size of the Mobile Car Wash and Detailing Market?

The global mobile car wash and detailing market was valued at $7.60 billion in 2025, reaching an estimated $8.39 billion in 2026. That covers washing, detailing, correction and coating services delivered at the customer's location.

How large will the Mobile Car Wash and Detailing Market be by 2036?

MMA forecasts the market reaching $22.57 billion by 2036, an increase of $14.18 billion over the 2026 base. That represents an expansion multiple of 2.69 times across the forecast period.

What is the CAGR for the Mobile Car Wash and Detailing Market 2026 to 2036?

The base case compound annual growth rate is 10.4%, with a bull case of 11.6% and a bear case of 9.2%. Historical growth between 2020 and 2025 ran at 9.0% annually.

Which segment is growing fastest?

Ceramic and graphene coating application grows at 15.6%, a full 1.50 times the market rate, as longer ownership makes protection a calculable investment. Paint correction follows at 12.4% annually.

Who are the major companies in the Mobile Car Wash and Detailing Market?

Get Spiffy, DetailXPerts, Ziebart International, Ceramic Pro and MobileWash lead on service revenue and certified network participation. Together they account for roughly 6%, making this exceptionally fragmented.

Which country is growing fastest?

India grows fastest at 13.2% annually, driven by labour economics that put mobile service pricing within reach of ordinary owners plus water scarcity in major cities. Vietnam and Indonesia follow.

Report Segmentation Architecture

The full report scope spans multiple orthogonal segmentation dimensions, with cross-tabulated demand data provided for each dimension pair. Coverage extends further to regional breakdowns, trend trajectories, and the competitive detail needed to support segment-level decision-making.

By Service Type

  • Ceramic and Graphene Coating Application
  • Paint Correction and Restoration
  • Fleet and Commercial Vehicle Detailing
  • Interior Deep Cleaning and Sanitisation
  • Express Exterior Washing

By End-Use Industry

  • Private Vehicle Owners
  • Rental and Leasing Fleets
  • Dealership and Used Vehicle Groups
  • Corporate and Executive Car Pools
  • Rideshare and Delivery Drivers
  • Municipal and Utility Fleets

By Commercial Dimension

  • On-Demand Application Booking
  • Subscription and Membership Plans
  • Contracted Fleet Service Agreements
  • Franchise and Licensed Operator Networks
  • Certified Coating Installer Networks

By Region

  • North America
  • Western Europe
  • East Asia
  • South Asia and Pacific
  • Latin America
  • Middle East and Africa
  • Eastern Europe

Scope, Methodology, and Coverage

Every figure in this report is reproducible from documented input assumptions. The scope below maps the historical period, the forecast horizon, the segmentation dimensions, and the countries covered, alongside the underlying primary and qualitative methodology.
Historical Period
2020 to 2025
Forecast Period
2026 to 2036
Base Year
2025 (USD billions; MMA Primary Research Dataset, August 2026)
Market Definition
This report covers vehicle washing and detailing services delivered at the customer's location by mobile operators, spanning exterior washing, interior cleaning and sanitisation, paint correction and restoration, ceramic and graphene coating application, and contracted fleet detailing across consumer, rental, dealership, corporate and municipal customers. Fixed-site car wash tunnels and bays, self-service facilities, retail sales of detailing chemicals and equipment, paint protection film supply and installation, and any vehicle mechanical servicing are excluded from the sizing.
Quantitative Units
USD billions at operator realised service revenue; service appointments in millions; average ticket value in USD per appointment.
Segmentation Dimensions
By service type; by end-use industry; by commercial dimension; by region.
Regions Covered
North America, Western Europe, East Asia, South Asia and Pacific, Latin America, Middle East and Africa, Eastern Europe
Countries Covered
United States, Canada, Mexico, United Kingdom, Germany, Netherlands, Switzerland, Sweden, Spain, Italy, China, Japan, South Korea, India, Australia, Thailand, Brazil, United Arab Emirates, South Africa, Poland.
Key Companies Profiled
Get Spiffy, DetailXPerts, Ziebart International, Ceramic Pro, MobileWash, Washos, Rightlook Automotive, System X Ceramic, IGL Coatings, Gtechniq, Turtle Wax, SONAX, Autoglym, XPEL and others.
Quantitative Methodology
Primary survey, n=3,800 respondents, Q4 2025, six countries; demand-side model with trade association cross-validation
Qualitative Methodology
47 expert interviews, Q4 2025; applied to validate demand model assumptions, identify emerging dynamics, and assess competitive positioning
Report Format
PDF and XLSX data workbook (Word format preview document)
Publisher
Market Minds Advisory
Report Code
MMA-2026-AUT-984
Published
August 2026
Contact
sales@marketmindsadvisory.com | www.marketmindsadvisory.com

Purchase the full Mobile Car Wash and Detailing Market Report (2026 to 2036).

The full report sizes the mobile car wash and detailing market across five service types, six end-use industries and seven regions, with appointment volume and ticket value detail behind every estimate. It profiles twenty operators and coating networks on service mix, fleet contracting and technician development capability. Regional chapters cover wastewater discharge regulation, water scarcity policy and labour cost structure by market. Unit economics analysis quantifies margin per technician hour across every service type. Workforce analysis examines training pathways, retention and the capacity constraint limiting industry growth.
Appointment volume and ticket value by service type
Margin per technician hour across service categories
Ceramic coating adoption forecasts through to 2036
Wastewater regulation status across major markets
Competitive position assessments across twenty operators and networks
Technician retention and training pathway benchmarking

Built For The People Who Decide

From boardroom strategy to bench-side execution, this report is read cover-to-cover by leaders shaping the next decade of their industry, turning demand scenarios, market dynamics and valuation benchmarks into decisions.
CXOs/ Presidents/ VPs/ Managers
M&A and Corporate Development
Strategy Teams and R&D Heads
Procurement and Product Directors
Regulatory and Compliance Leaders
Investor Relations and Equity Analysts