Market Minds Advisory
Mobile Broadband Modem Market

Mobile Broadband Modem Market: Mobile Broadband Modem Market: Carrier Certification Queues, Band Fragmentation and Devices Nobody Can Ship 2026 to 2036

A modem that works perfectly cannot ship until carriers say so, and that takes longer than building it. Certification queues rather than radio engineering set the pace of this entire market.

Lead Analyst

Published

September 2026

Make Smarter Decisions with Customized Research Insights

Request a free sample report and evaluate market opportunities, growth trends, and competitive dynamics relevant to your business needs.

2025 MARKET VALUE$19.6BMarket Size 2025
2036 FORECAST VALUE$52.3BBase Case , 2026 to 2036
CAGR 2026 TO 20369.3 %Bull 10.6% / Bear 8.1%
INCREMENTAL OPPORTUNITY$30.8BNet 10- year value creation
EXPANSION MULTIPLE2.43x2036 value over 2026 base
Strategic Levers
M&A Pipeline
Regional Outlook
Country Rankings
Competitive Intelligence
Segmental Deep-dive
Call-Us : 91 93563 13602

Executive Snapshot and Market Trajectory.

A modem that works perfectly cannot ship until carriers say it can, and getting that permission takes longer than building the thing did. Certification queues rather than radio engineering set the pace of this entire market. Certifying across major operator networks runs around nine months.
The market reaches USD 21.5 billion in 2026 and USD 52.3 billion by 2036, a 2.43 times expansion at 9.3% annually. Modems for fixed wireless and industrial routers grow at 14.0%, half again the market rate of 9.3%, because those applications add subscribers where laying fibre never made economic sense. East Asia holds 47% of consumption, far above the usual band, on device manufacturing. Certification portfolios rather than radio performance decide addressable markets.
Five suppliers hold 82% of consumption value, which is extremely high and reflects certification portfolios and intellectual property positions rather than radio performance. Qualcomm, MediaTek, Samsung Electronics, UNISOC and Huawei HiSilicon lead. Carrier certification coverage decides which devices can be sold where. Standard essential patent obligations absorb around 18% of device cost, paid to holders whose positions were established when the standards themselves were originally written by them.
Market Definition
This report covers mobile broadband modems: the baseband and radio frequency silicon providing cellular connectivity in devices. It spans modems for fixed wireless access and industrial routers, smartphone application processor integrated modems, discrete modem devices for tablets and computing, automotive telematics modems, module-integrated modems for machine connectivity, and the carrier certification and intellectual property licensing attached to them. It excludes network infrastructure equipment, wireless local area networking silicon, satellite communication terminals, complete devices and handsets, and radio frequency front end components sold separately.
Base Year Value
$19.6B in 2025 (MMA Primary Research Dataset, September 2026)
Forecast Period
2026 to 2036, eleven discrete annual values
CAGR
9.3% base case. Bull 10.6%. Bear 8.1%.
Fastest Growth Segment
Modems For Fixed Wireless And Industrial Routers: 14.0% CAGR
Fastest Growth Country
India: 15.6% CAGR
Fastest Growth Region
South Asia and Pacific: 11.5% CAGR
Largest Region
East Asia: 47% of 2025 global value
Market Leaders
Qualcomm, MediaTek, Samsung Electronics, UNISOC and Huawei HiSilicon lead on mobile broadband modem consumption value. Source: MMA Analysis.
Primary Survey
n=3,800 procurement and R&D decision-makers, Q4 2025, six countries
Methodology
Demand-side build-up, cross-validated against public data, 47 expert interviews

Mobile Broadband Modem Market Forecast Scenarios

mobile-broadband-modem-market-size-forecast-scenario-1790004151559
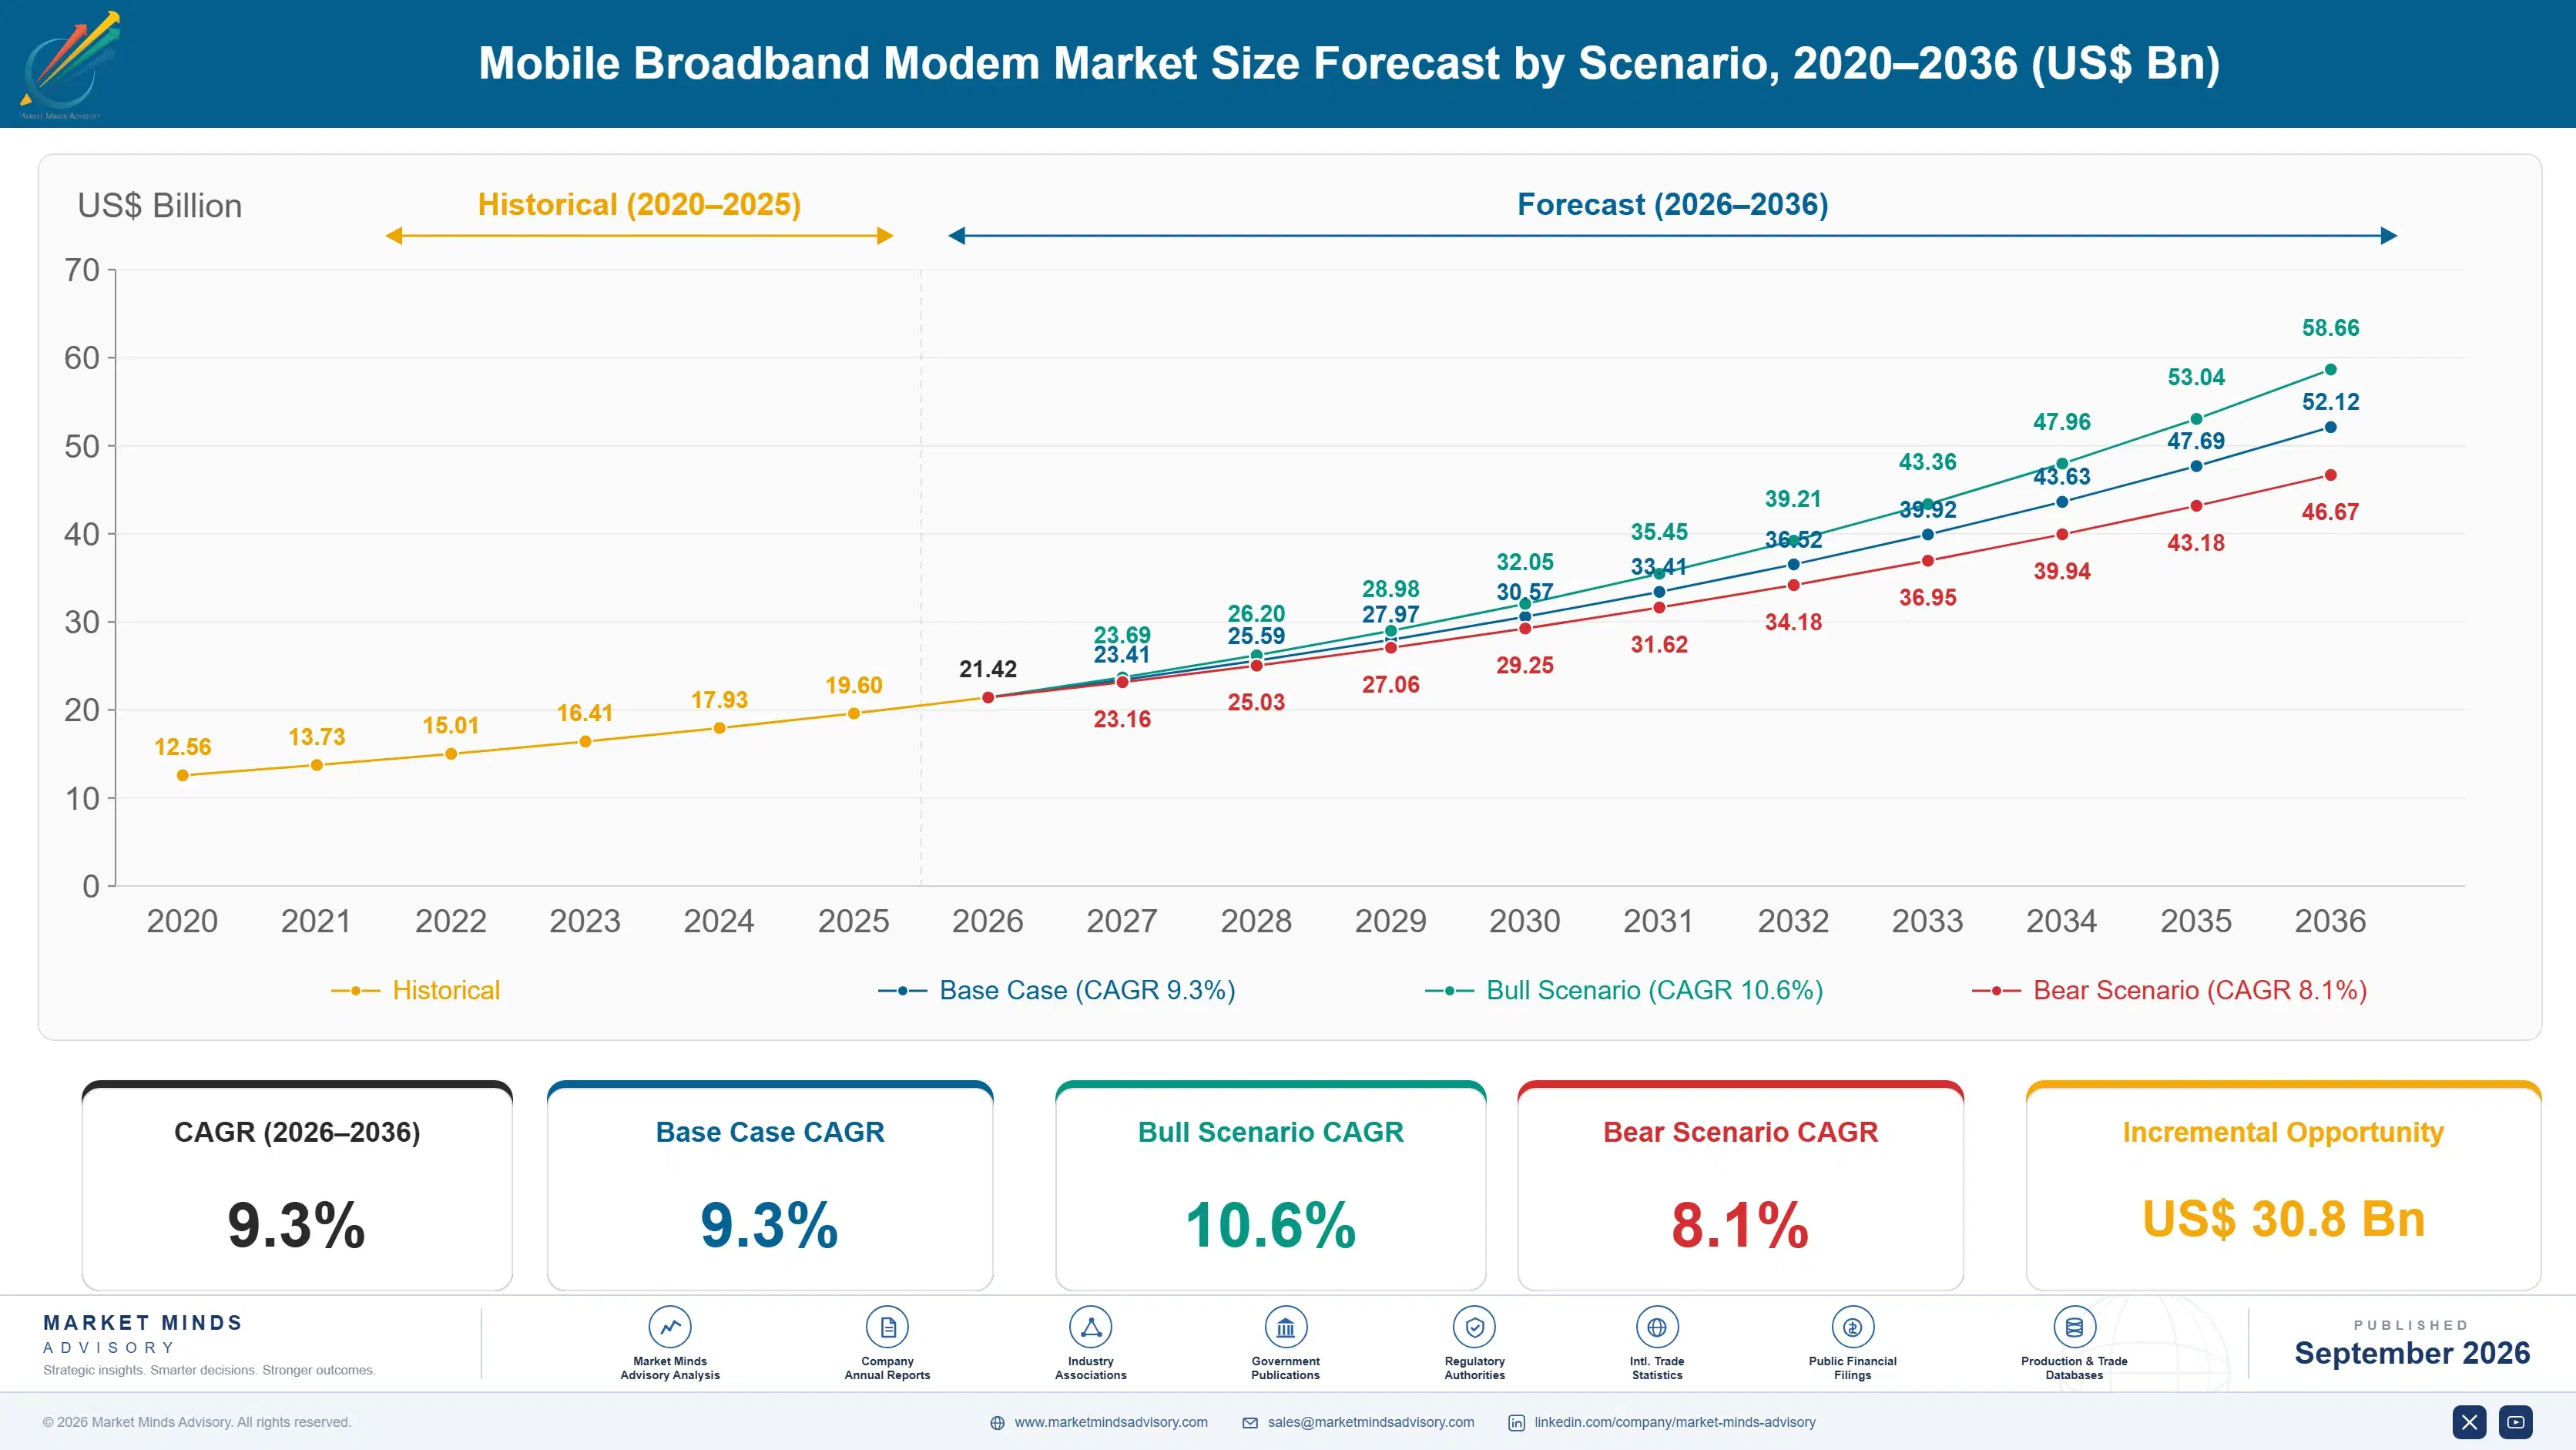
Between 2020 and 2025 the category compounded at 8.1%, and handset volume stopped being the story. Smartphone unit shipments flattened while modem content moved into fixed wireless terminals, vehicles, industrial routers and machine modules that had never carried cellular connectivity before. The device count grew far more slowly than the number of things containing a modem, which are quite different measures.
The base case holds 9.3% on three mechanisms. Fixed wireless access keeps adding subscribers in places where laying fibre never made economic sense, and each one needs a terminal. Vehicle telematics keeps becoming standard rather than optional across model ranges. And industrial and machine connectivity keeps expanding into applications that previously ran on wired links or on nothing at all. Those three mechanisms run largely independently of one another across the whole forecast.
The bull case at 10.6% assumes fixed wireless deployment accelerates as operators use spectrum they already hold rather than funding fibre, which is a genuinely cheaper route to a subscriber. The bear case at 8.1% is handset replacement cycles extending further, since smartphones still carry the largest single share of modem volume regardless of how fast newer applications grow.

Carriers Decide What Ships

Permission takes longer than engineering. Certifying a device across major operator networks runs around nine months, and a global product must support around 64 band combinations before anybody will test it. That certification portfolio, rather than radio performance, determines which suppliers can serve which markets. It also explains concentration at 82% in a category where the underlying standards are published and available to everybody.
TOP FIVE CONCENTRATION82%Extremely high, reflecting certification portfolios and licensing positions held
CARRIER CERTIFICATION PERIOD9 monthsTime to certify a device across major operator networks
SUPPORTED BAND COMBINATIONS64Frequency band combinations a global device must support today
LICENSING COST SHARE18%Device cost consumed by standard essential patent licensing obligations
NON-HANDSET VOLUME SHARE39%Modem shipments going to devices other than smartphones and tablets
DESIGN CYCLE DURATION3 yearsFrom modem architecture decision to volume shipping in devices
Licensing is a cost line nobody escapes. Standard essential patent obligations absorb around 18% of device cost, paid to holders whose positions were established when the standards were written. A supplier without its own patent position pays that and receives nothing back, which is a permanent handicap that no manufacturing efficiency addresses. Suppliers holding portfolios collect from competitors while paying less themselves.
The growth moved off the phone. Around 39% of modem shipments now go into devices other than smartphones and tablets, covering fixed wireless terminals, vehicles, industrial routers and machine modules. Modems for fixed wireless and industrial routers grow at 14.0% against 9.3% for the market, because those applications reach subscribers and assets that wired connectivity never economically served. Handset volume has flattened while everything else grew.
"Everybody benchmarks throughput and nobody ships on it. What decides your market is whether you hold certification on the operators that matter and whether you are paying licensing or collecting it. Those two things are the whole business and neither one is engineering."
Director, Wireless Silicon and Connectivity Practice · MMA Technology Practice · September 2026

Market Trends

Certification Portfolios Decide Every Addressable Market

Certifying a device across major operator networks takes around nine months, and a global product must support roughly 64 band combinations before testing begins at all. That portfolio rather than radio performance determines which suppliers can serve which markets, which is why concentration sits at 82% in a category built on published standards. Suppliers without certification coverage for an operator cannot sell into that market whatever their silicon achieves in a laboratory. The portfolio also compounds, since a supplier already certified adds a new device faster than any competitor entering from nothing at all.
Market Impact: India compounds at 15.6% yearly

Modem Volume Moved Away From Smartphones

Around 39% of modem shipments now go into devices other than smartphones and tablets, covering fixed wireless terminals, vehicles, industrial routers and machine modules that never carried cellular connectivity before. Modems for fixed wireless and industrial routers grow at 14.0% against 9.3% for the market as those applications expand. Suppliers organised entirely around handset design cycles are serving the flattest part of a market that is growing elsewhere. Those applications also carry lighter certification burden, since a terminal serves one operator on known bands rather than roaming globally across every network.
Market Impact: Design cycles run 3 years

Market Opportunities and Growth Drivers

Fixed Wireless Reaches Subscribers Fibre Never Would

Operators are using spectrum they already hold to serve subscribers where laying fibre never made economic sense, and each connection requires a terminal containing a modem. India compounds at 15.6%, ahead of every other market, largely on that basis across a subscriber base that wired broadband barely reached. Modems for fixed wireless and industrial routers grow at 14.0% against 9.3% for the market as that deployment proceeds across several regions simultaneously. Terminal certification is far simpler than handset certification, which opens the segment to suppliers who could never fund global coverage.
Market Impact: Licensing absorbs 18% of cost

Vehicle Telematics Becomes Standard Across Model Ranges

Cellular connectivity is moving from optional feature to standard fitment across vehicle ranges, driven by regulation on emergency calling, over-the-air software updates and connected services that manufacturers now build products around. Those modems carry automotive qualification and design cycles running around three years from architecture decision to volume, which narrows the supplier field considerably and produces positions lasting a full model generation. Emergency calling regulation drove fitment in Europe before other markets required it, and over-the-air update capability has since made connectivity architectural rather than optional. Positions last a generation.
Market Impact: Devices support 64 band combinations

Market Restraints and Challenges

Licensing Obligations Handicap Suppliers Without Portfolios

Standard essential patent obligations absorb around 18% of device cost and are paid to holders whose positions were established when the standards themselves were written. The root cause is that participation in standards development produced the patents that now govern the economics. Commercially this handicaps entrants permanently. Mitigation runs through cross-licensing arrangements, through participation in current standards work to build future positions, and through applications where licensing terms are more favourable. Participation in current standards work is the only route to a position in the next generation. Absence is expensive.
Market Impact: Certification consumes 9 months

Band Fragmentation Multiplies Development And Test Cost

A global device must support around 64 band combinations, and each additional one adds radio frequency design, test coverage and certification effort without adding any subscriber the device could not otherwise reach. The root cause is that spectrum allocation differs by country and operator. Commercially this raises the cost of global products enormously. Mitigation runs through regional device variants, through configurable radio frequency front ends, and through prioritising bands by addressable subscriber volume. Regional variants achieve equivalent subscriber coverage at considerably lower total development and certification effort than any global product does.
Market Impact: Non-handset takes 39% of volume
3 additional market trends, 4 additional growth drivers, and 2 additional restraints and challenges are covered in the full report. Contact sales@marketmindsadvisory.com to access the complete intelligence.

Segment CAGR and Growth Architecture

Segmentation follows device application, since each carries quite different certification burden, design cycle and volume profile. Six classes cover the market: modems for fixed wireless and industrial routers, automotive telematics modems, smartphone application processor integrated modems, module-integrated modems for machine connectivity, discrete modems for tablets and computing, and certification and licensing services. Industry and route sit elsewhere.
mobile-broadband-modem-market-market-share-analysis-1790004152145

Modems For Fixed Wireless And Industrial Routers

Modems for fixed wireless and industrial routers grow at 14.0%, half again the market rate of 9.3%, because operators are using spectrum they already hold to reach subscribers where laying fibre never made economic sense and each connection requires a terminal. These devices also sit still rather than moving, which relaxes some radio requirements while raising throughput expectations considerably. Certification burden is lower than handsets face since the device serves one operator on known bands, which opens the segment to suppliers who cannot fund global handset certification. Terminal cost against subscriber acquisition economics is the argument that decides these awards. Suppliers who cannot fund global certification compete effectively here for the first time.
CAGR 14.0%

Automotive Telematics Modems

Automotive telematics modems compound at 11.8% as cellular connectivity moves from optional feature to standard fitment under regulation on emergency calling and the over-the-air update capability manufacturers now design products around. Design cycles run around three years from architecture decision to volume shipping, and automotive qualification narrows the supplier field before any capability is compared. A position won lasts a full model generation, which makes these among the most durable sockets available anywhere in wireless silicon. Qualification takes years and cannot be accelerated, which keeps the competing field narrow and the positions unusually stable across a model cycle. Model generations are long. Stability rather than volume is the attraction here.
CAGR 11.8%
Full segment breakdown across 6 segments available in the complete report.

Regional Architecture and Country Demand Map

East Asia holds 47% of consumption, far above the usual band, because device manufacturing and modem design both concentrate there and silicon is consumed where products are built. South Asia and Pacific follows at 15% on fixed wireless deployment. India compounds fastest at 15.6% on fixed wireless reaching unserved households.

East Asia

East Asia takes 47% of consumption, far above the 30% band ceiling, because device manufacturing and modem design both concentrate here and silicon is consumed where products are physically assembled rather than where they are sold. MediaTek, Samsung Electronics, UNISOC and Huawei HiSilicon all design within the region, and Chinese device makers absorb enormous modem volume across handsets, routers and machine modules. Growth at 10.2% runs above the global rate on non-handset applications rather than smartphone volume. Regional suppliers compete hard at price points where flagship specification is irrelevant, which is where most global unit volume actually sits. Design and manufacturing both sit here, which is unusual. Volume dominates globally.
Share: 47% | CAGR: 10.2% (2026 to 2036)

South Asia and Pacific

Growth of 11.5% makes South Asia and Pacific the fastest region on 15% of consumption, well above the usual band because Indian fixed wireless deployment reaches subscribers that wired broadband barely served at all. India compounds at 15.6%, ahead of every other market, as operators use spectrum they already hold rather than funding fibre to households that could never justify it. Handset volume across the region is substantial and price-sensitive, which favours suppliers competing at lower specification points. Terminals serving one operator on known bands open the market to suppliers who cannot fund global handset certification at all. Price sensitivity favours lower specification suppliers. Spectrum was already paid for. Volume is enormous.
Share: 15% | CAGR: 11.5% (2026 to 2036)
Regional intelligence for 5 additional markets available in the complete report: North America, Western Europe, Latin America, Middle East and Africa, Eastern Europe. Contact sales@marketmindsadvisory.com.
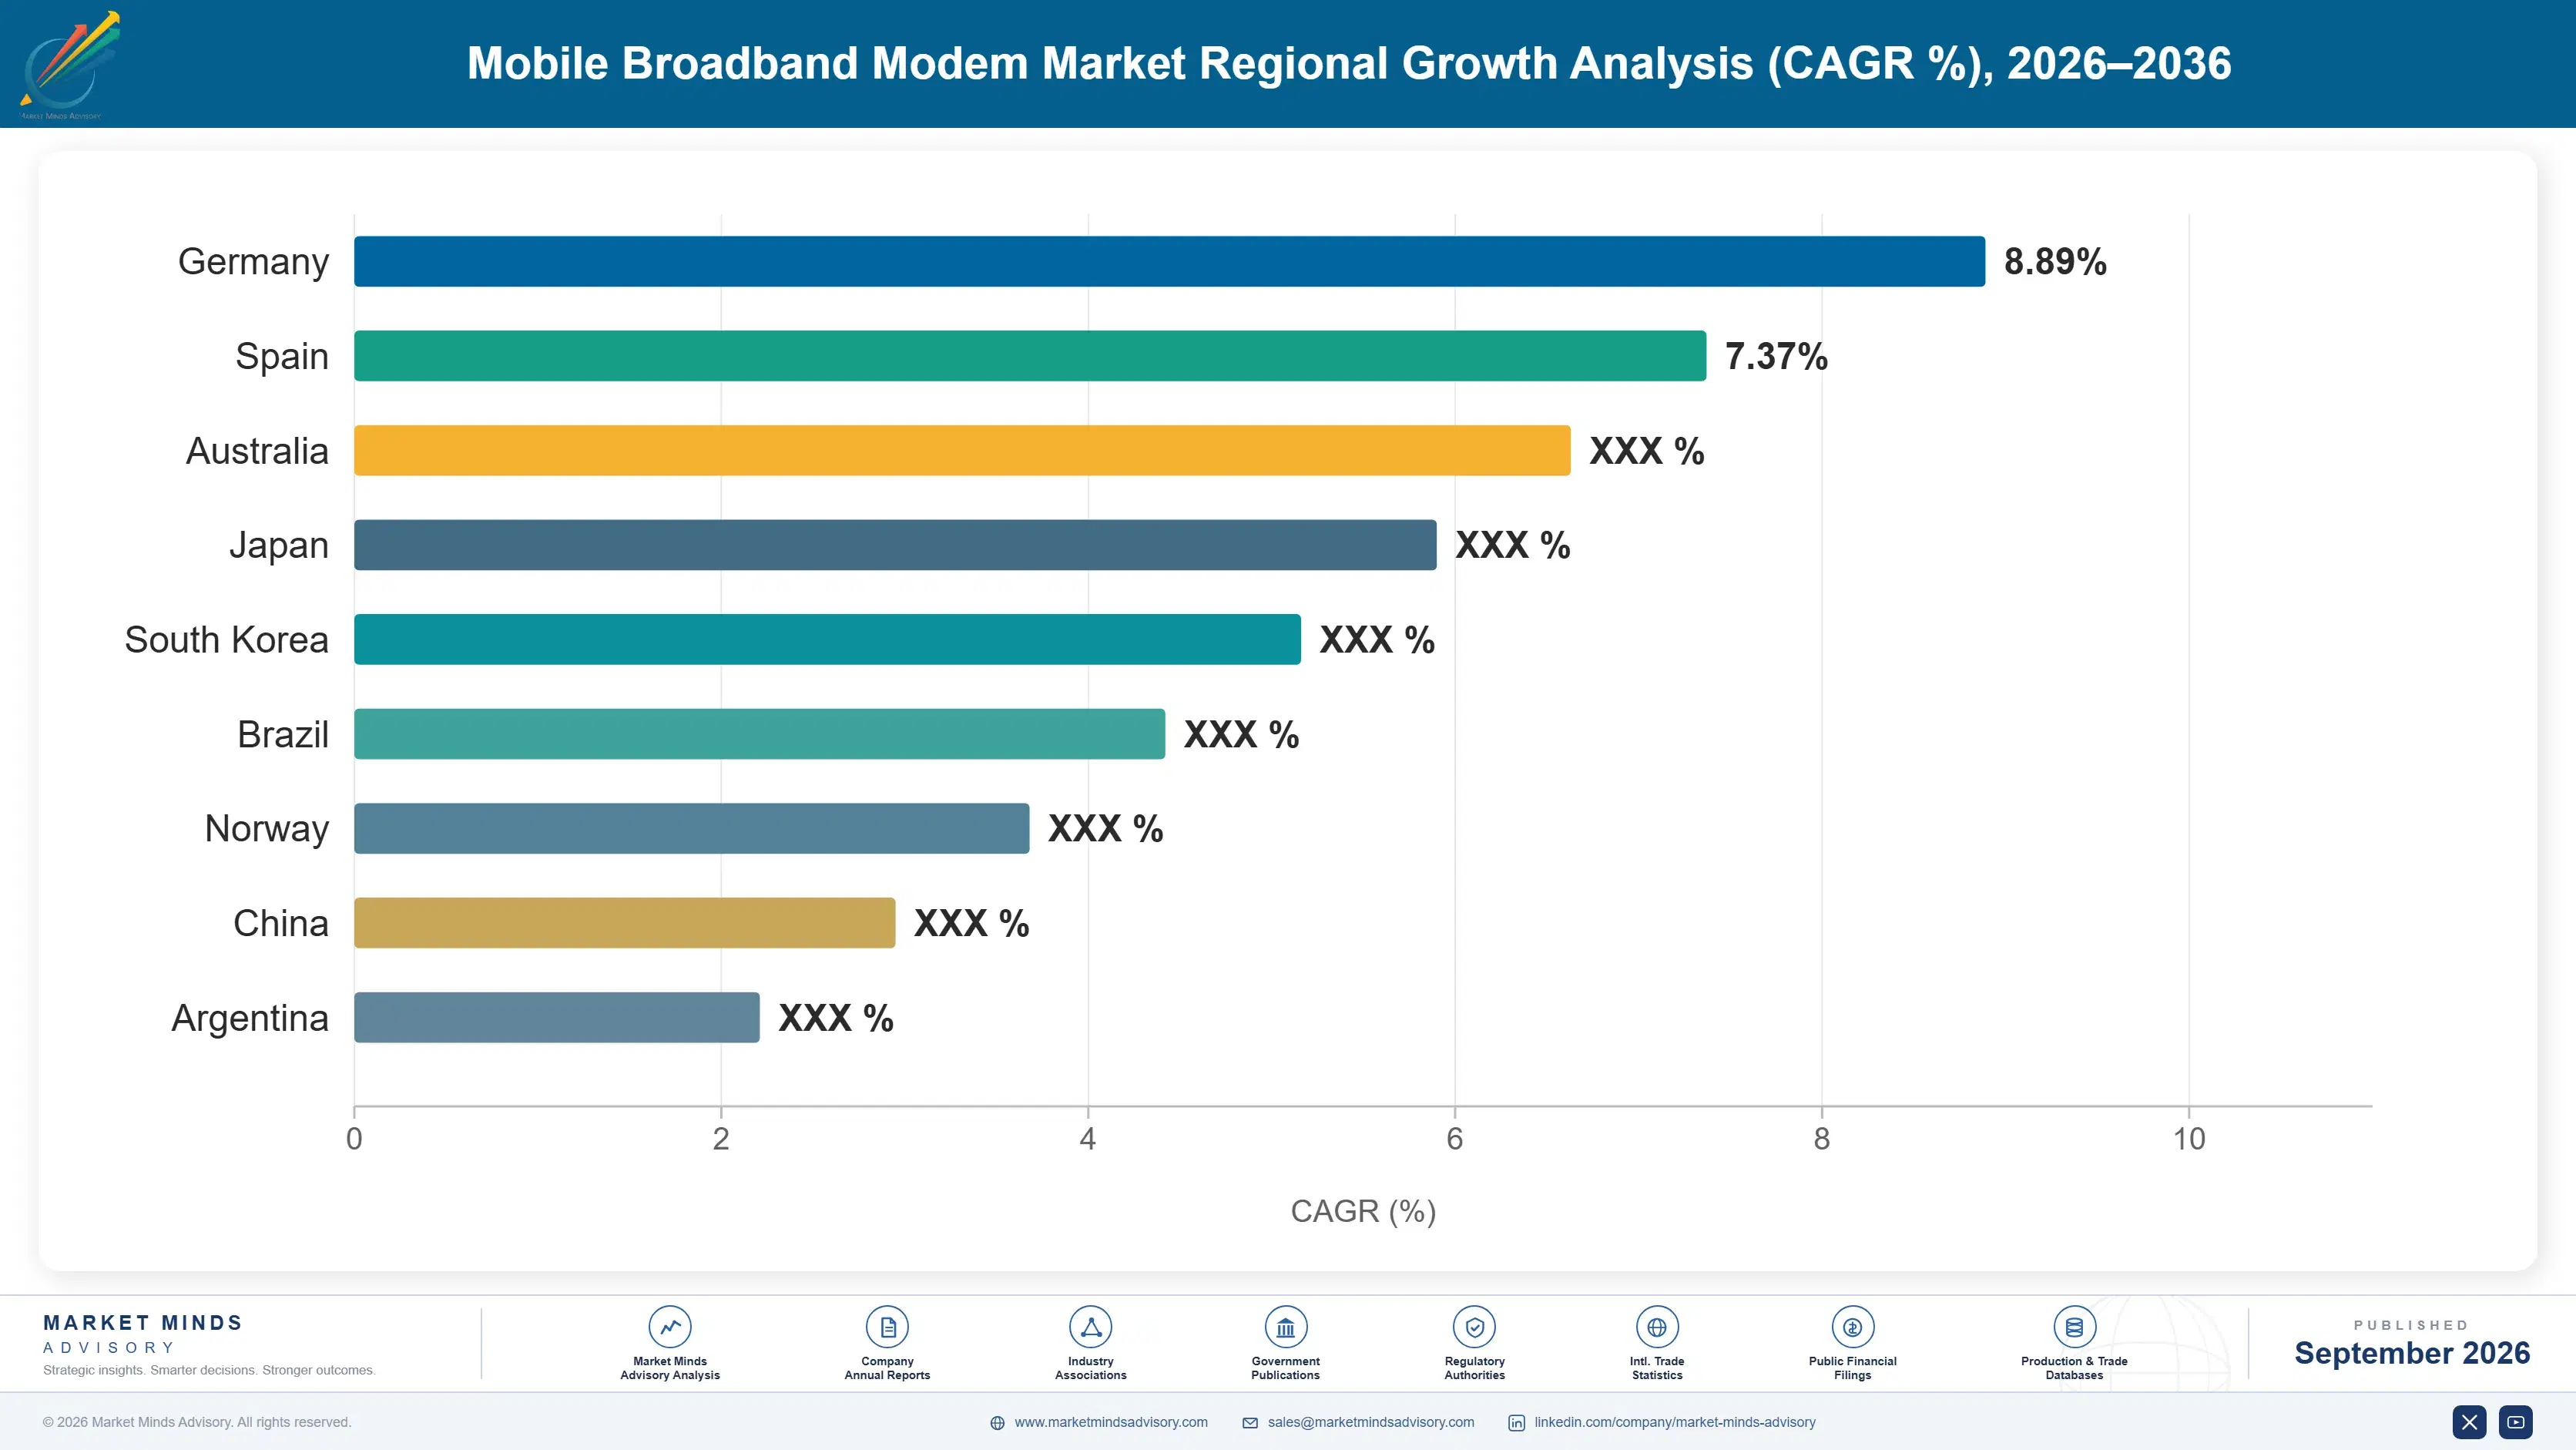
mobile-broadband-modem-market-country-cagr-analysis-1790004152680

Where Modem Positions Are Won

Certification portfolios rather than radio performance determine addressable markets, licensing obligations handicap anybody without a patent position, and volume growth has moved off the smartphone entirely. The four levers below follow those conditions rather than any argument about throughput. Each addresses a regulatory or economic condition rather than an engineering one, which is where most supplier investment still goes.

Build Certification Coverage Before Building Silicon

Certifying across major operator networks takes around 9 months and a global product must support roughly 64 band combinations before testing even begins. That portfolio determines which markets a supplier can serve at all, which is why concentration sits at 82% on published standards. Suppliers investing in certification coverage reach markets that competitors with better silicon simply cannot sell into, whatever any benchmark demonstrates. Benchmarks decide nothing here. Around 64 band combinations must be supported before testing starts, and each one adds effort without adding reach. Paperwork gates the market.
Market Impact: Certification now consumes a full 9 long months

Hold Patents Or Accept A Permanent Handicap

Standard essential patent obligations absorb around 18% of device cost, paid to holders whose positions were established when the standards were written. A supplier without a portfolio pays that and collects nothing, which no manufacturing efficiency addresses. Participation in current standards development builds the positions that govern the next generation, and suppliers absent from that work are accepting the same handicap for another decade. Participation cost is small against what licensing eventually takes every year. A permanent handicap compounds across every generation. Nothing else fixes the rate. Another decade otherwise.
Market Impact: Licensing now absorbs 18% of every device cost

Follow Volume Into Fixed Wireless And Machines

Around 39% of modem shipments now go into devices other than smartphones and tablets, and fixed wireless terminals grow at 14.0% against 9.3% for the market. Those applications also carry lighter certification burden, since a terminal serves one operator on known bands rather than roaming globally. Suppliers organised around handset design cycles are serving the flattest part of a market growing quickly somewhere else entirely. Handset volume has flattened. Terminals certify far more simply than any roaming handset does, which changes who can realistically compete. Growth sits elsewhere entirely. Certification opens it.
Market Impact: Non-handset now takes fully 39% of all volume

Win Automotive Sockets That Last A Generation

Vehicle design cycles run around 3 years from modem architecture decision to volume shipping, and a position won then ships for a full model generation without further competition. Automotive qualification narrows the field before capability is compared at all. Suppliers timing engagement to vehicle programme starts reach the only moment selection is open, and those sockets are the most durable available anywhere in wireless silicon. Programme calendars matter more than any competitive comparison a supplier could construct. Qualification narrows the field first. Openings are rare and brief. Timing decides everything.
Market Impact: Design cycles now run a full 3 years

Who Controls the Margin Pool

Five suppliers hold 82% of mobile broadband modem consumption, which is extremely high even for semiconductors, and that position rests on certification portfolios and standard essential patent holdings rather than on radio performance between comparable devices. Qualcomm, MediaTek, Samsung Electronics, UNISOC and Huawei HiSilicon lead. All participants are assessed on modem consumption value rather than on broader semiconductor, handset or infrastructure businesses they also operate. Concentration this extreme has persisted for years because both certification and licensing positions compound rather than resetting.
Competition runs on certification coverage and licensing position far more than on throughput, which converged across serious suppliers years ago. The second dimension is application breadth, because volume moved off the smartphone and suppliers organised around handset cycles are absent from the segments actually growing. Radio performance competes a distant third.

Pressure is emerging from device makers integrating modems into their own application processors, which removes the discrete purchase entirely. Rankings shift where fixed wireless deploys and where automotive fitment becomes standard, particularly across India, the Gulf and Western Europe at present. Suppliers dependent on handset volume carry the most exposure to that integration.
mobile-broadband-modem-market-company-positioning-matrix-1790004153207

Competitive Moat and Risk Dimensions

QUALCOMM

Moat: Standard Essential Patent Position

Qualcomm holds standard essential patents established through decades of participation in standards development, and licensing obligations absorb around 18% of device cost across the whole industry. That position means competitors pay while it collects, which is an economic advantage no manufacturing efficiency addresses. Certification portfolio breadth across operators compounds the position further across every market a device might reach.
QUALCOMM

Risk: Customer Integration Pressure

Large device makers increasingly integrate modems into their own application processors, which removes the discrete purchase rather than competing for it on price or performance. Patent licensing continues regardless but the silicon revenue does not. A position resting partly on selling modems to customers capable of building them faces that erosion in its highest volume accounts.
MEDIATEK

Moat: Cost Tier Coverage

MediaTek serves price-sensitive handset and device segments where flagship specification is irrelevant and cost decides everything, which is where most unit volume across Asia and Africa actually sits. That coverage builds certification breadth and scale that flagship-only suppliers cannot match. Competitors positioned at premium specification address a smaller share of shipments than headline revenue figures suggest.
MEDIATEK

Risk: Licensing Cost Exposure

Serving price-sensitive segments means standard essential patent obligations near 18% of device cost bite hardest, since there is less margin to absorb them at lower price points. A supplier paying licensing without collecting comparable amounts carries that handicap into exactly the segments where price competition is fiercest and margin thinnest across the whole market.

Players Tracked

Prominent Players

Qualcomm
MediaTek
Samsung Electronics
UNISOC
Huawei HiSilicon

Other Key Players

Apple
Sequans Communications
Telit Cinterion
Quectel Wireless Solutions
Fibocom Wireless
Sierra Wireless
u-blox
Nordic Semiconductor
Sony Semiconductor
Murata Manufacturing
Rolling Wireless
Cavli Wireless
GosunCn Technology
Neoway Technology
Thundercomm

Recent Developments

MARCH 2025

Operators Expand Fixed Wireless Using Existing Spectrum Holdings

Mobile operators expanded fixed wireless access deployment using spectrum they already held rather than funding fibre to lower density housing, a network economics decision rather than any corporate transaction. Each connection requires a terminal containing a modem, and around 39% of shipments now go to devices other than smartphones.
Signal: Spectrum already paid for now reaches subscribers that fibre economics could never justify serving at all.
SEPTEMBER 2024

Vehicle Programmes Standardise Cellular Connectivity Across Ranges

Vehicle manufacturers moved cellular connectivity from optional feature to standard fitment across model ranges, a product development rather than any acquisition. Design cycles run around three years from modem architecture decision to volume shipping, and a socket won at that point ships for a complete model generation afterwards.
Signal: Automotive sockets last a full model generation, which no handset socket has ever once approached anywhere.
JUNE 2025

Indian Fixed Wireless Deployment Reaches Unserved Households

Indian operators deployed fixed wireless access to households that wired broadband had never reached, a deployment development rather than any corporate event. India compounds at 15.6%, and terminals serving one operator on known bands carry considerably lighter certification burden than globally roaming handsets ever do.
Signal: Single operator terminals now open the market to suppliers who cannot fund any global certification at all.

What A Modem Costs

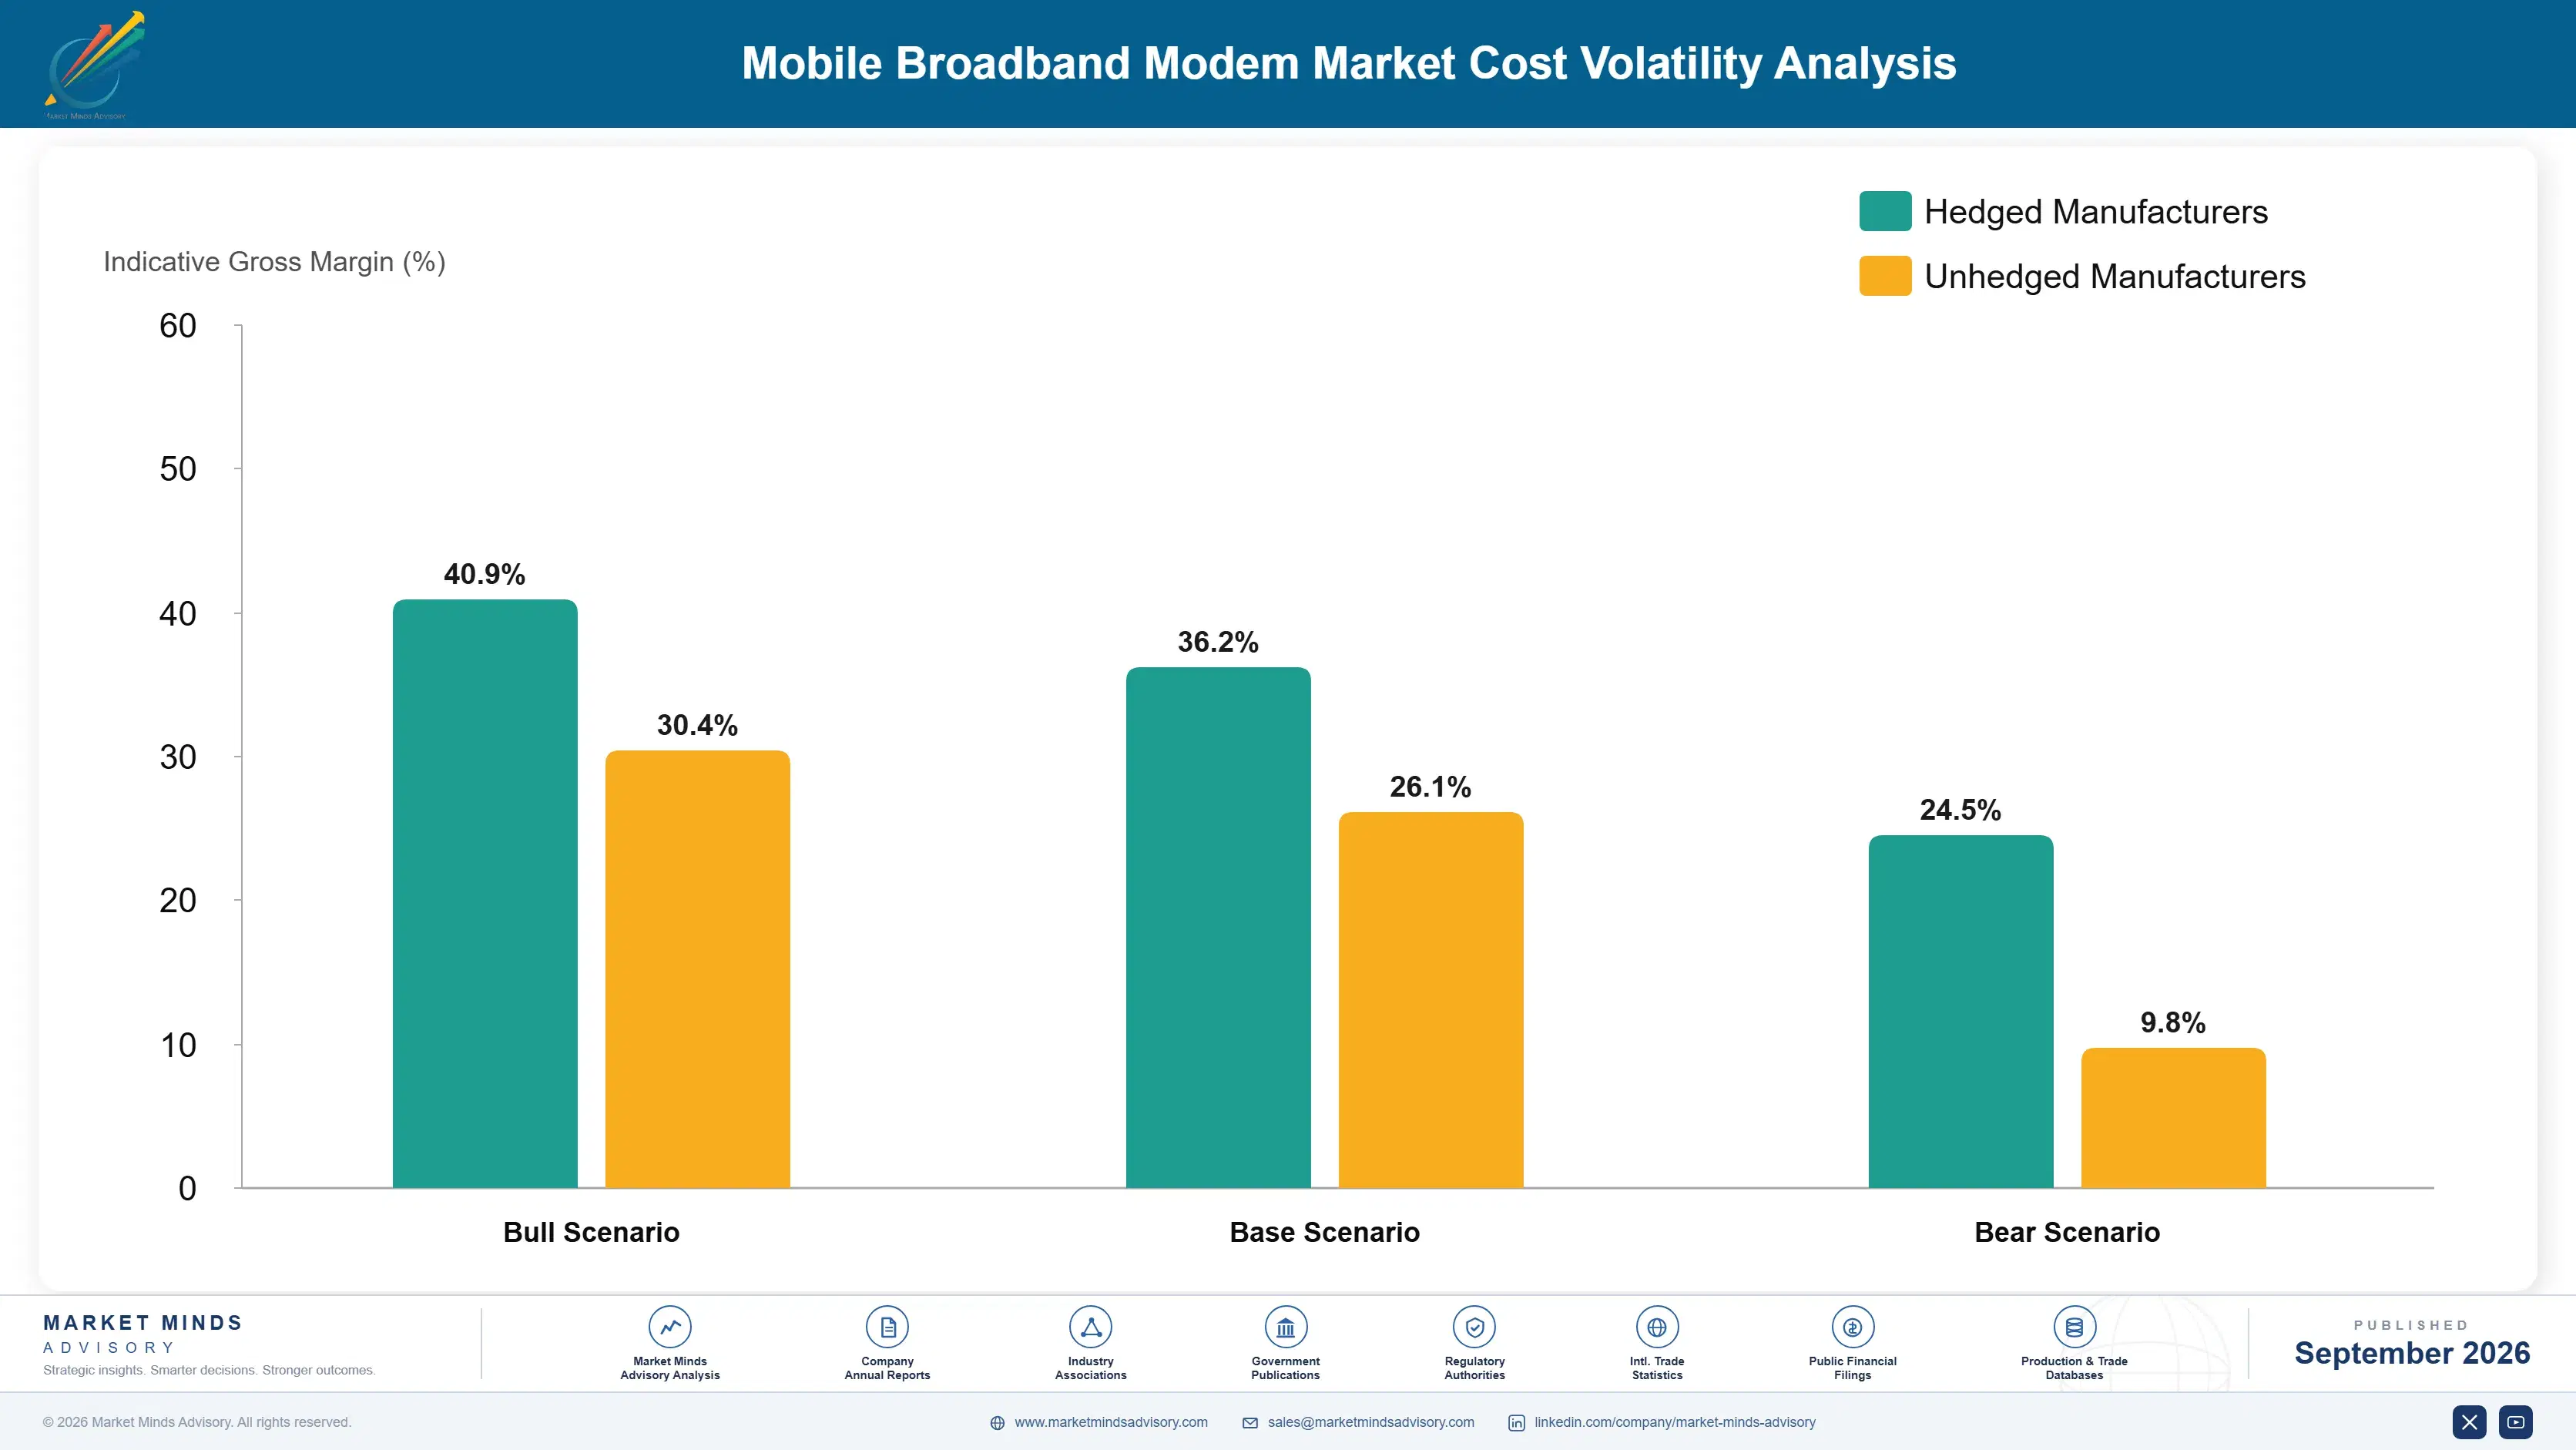
Wafer fabrication at advanced nodes absorbs roughly 38% of modem cost, and baseband complexity keeps pushing designs toward processes where capacity is expensive and allocated years ahead. Standard essential patent licensing takes around 18%, paid regardless of what a supplier holds itself. Radio frequency front end integration absorbs about 16%, with certification and test taking most of the remaining balance.
Advanced node wafer costs rose through 2023 and 2024 while certification test capacity tightened as operators added band combinations faster than laboratories expanded. Qualcomm Annual Report 2024 and MediaTek Annual Report 2024 both record foundry costs and licensing arrangements among principal operating variables. Suppliers holding cross-licensing agreements carried materially lower effective licensing cost than those paying gross rates to every holder. Cross-licensing changes the effective rate entirely.

The competitive disadvantage mechanism is licensing position rather than manufacturing cost. A supplier paying standard essential patent obligations without collecting comparable amounts carries around 18% of device cost as a permanent handicap that no process node or design improvement addresses. Exposure concentrates among suppliers absent from standards development, since the patents governing the next generation are being written now by the participants attending those meetings.
mobile-broadband-modem-market-cost-volatility-analysis-1790004153404

Participate In Standards Development For Future Positions

Standard essential patent obligations absorb around 18% of device cost and are paid to holders whose positions came from participating when the standards were written. The patents governing the next generation are being created now in current working groups. Absence from that work accepts the same handicap for another decade entirely. Meetings are cheap.

Prioritise Bands By Addressable Subscriber Volume

A global device must support around 64 band combinations and each additional one adds radio frequency design, test and certification cost without reaching any subscriber the device could not otherwise serve. Prioritising bands by actual subscriber volume rather than by completeness cuts that materially. Regional variants achieve the same coverage at considerably lower total development and certification effort.

Secure Advanced Node Capacity Years Ahead

Wafer fabrication absorbs roughly 38% of modem cost at advanced nodes where capacity is expensive and allocated years before production. Long-term foundry commitments secure allocation and support device programme schedules that manufacturers plan around. Missing a device launch window loses a socket that ships somebody else's silicon for the full product life without any further opportunity.

Portfolio Architecture for Margin Defence

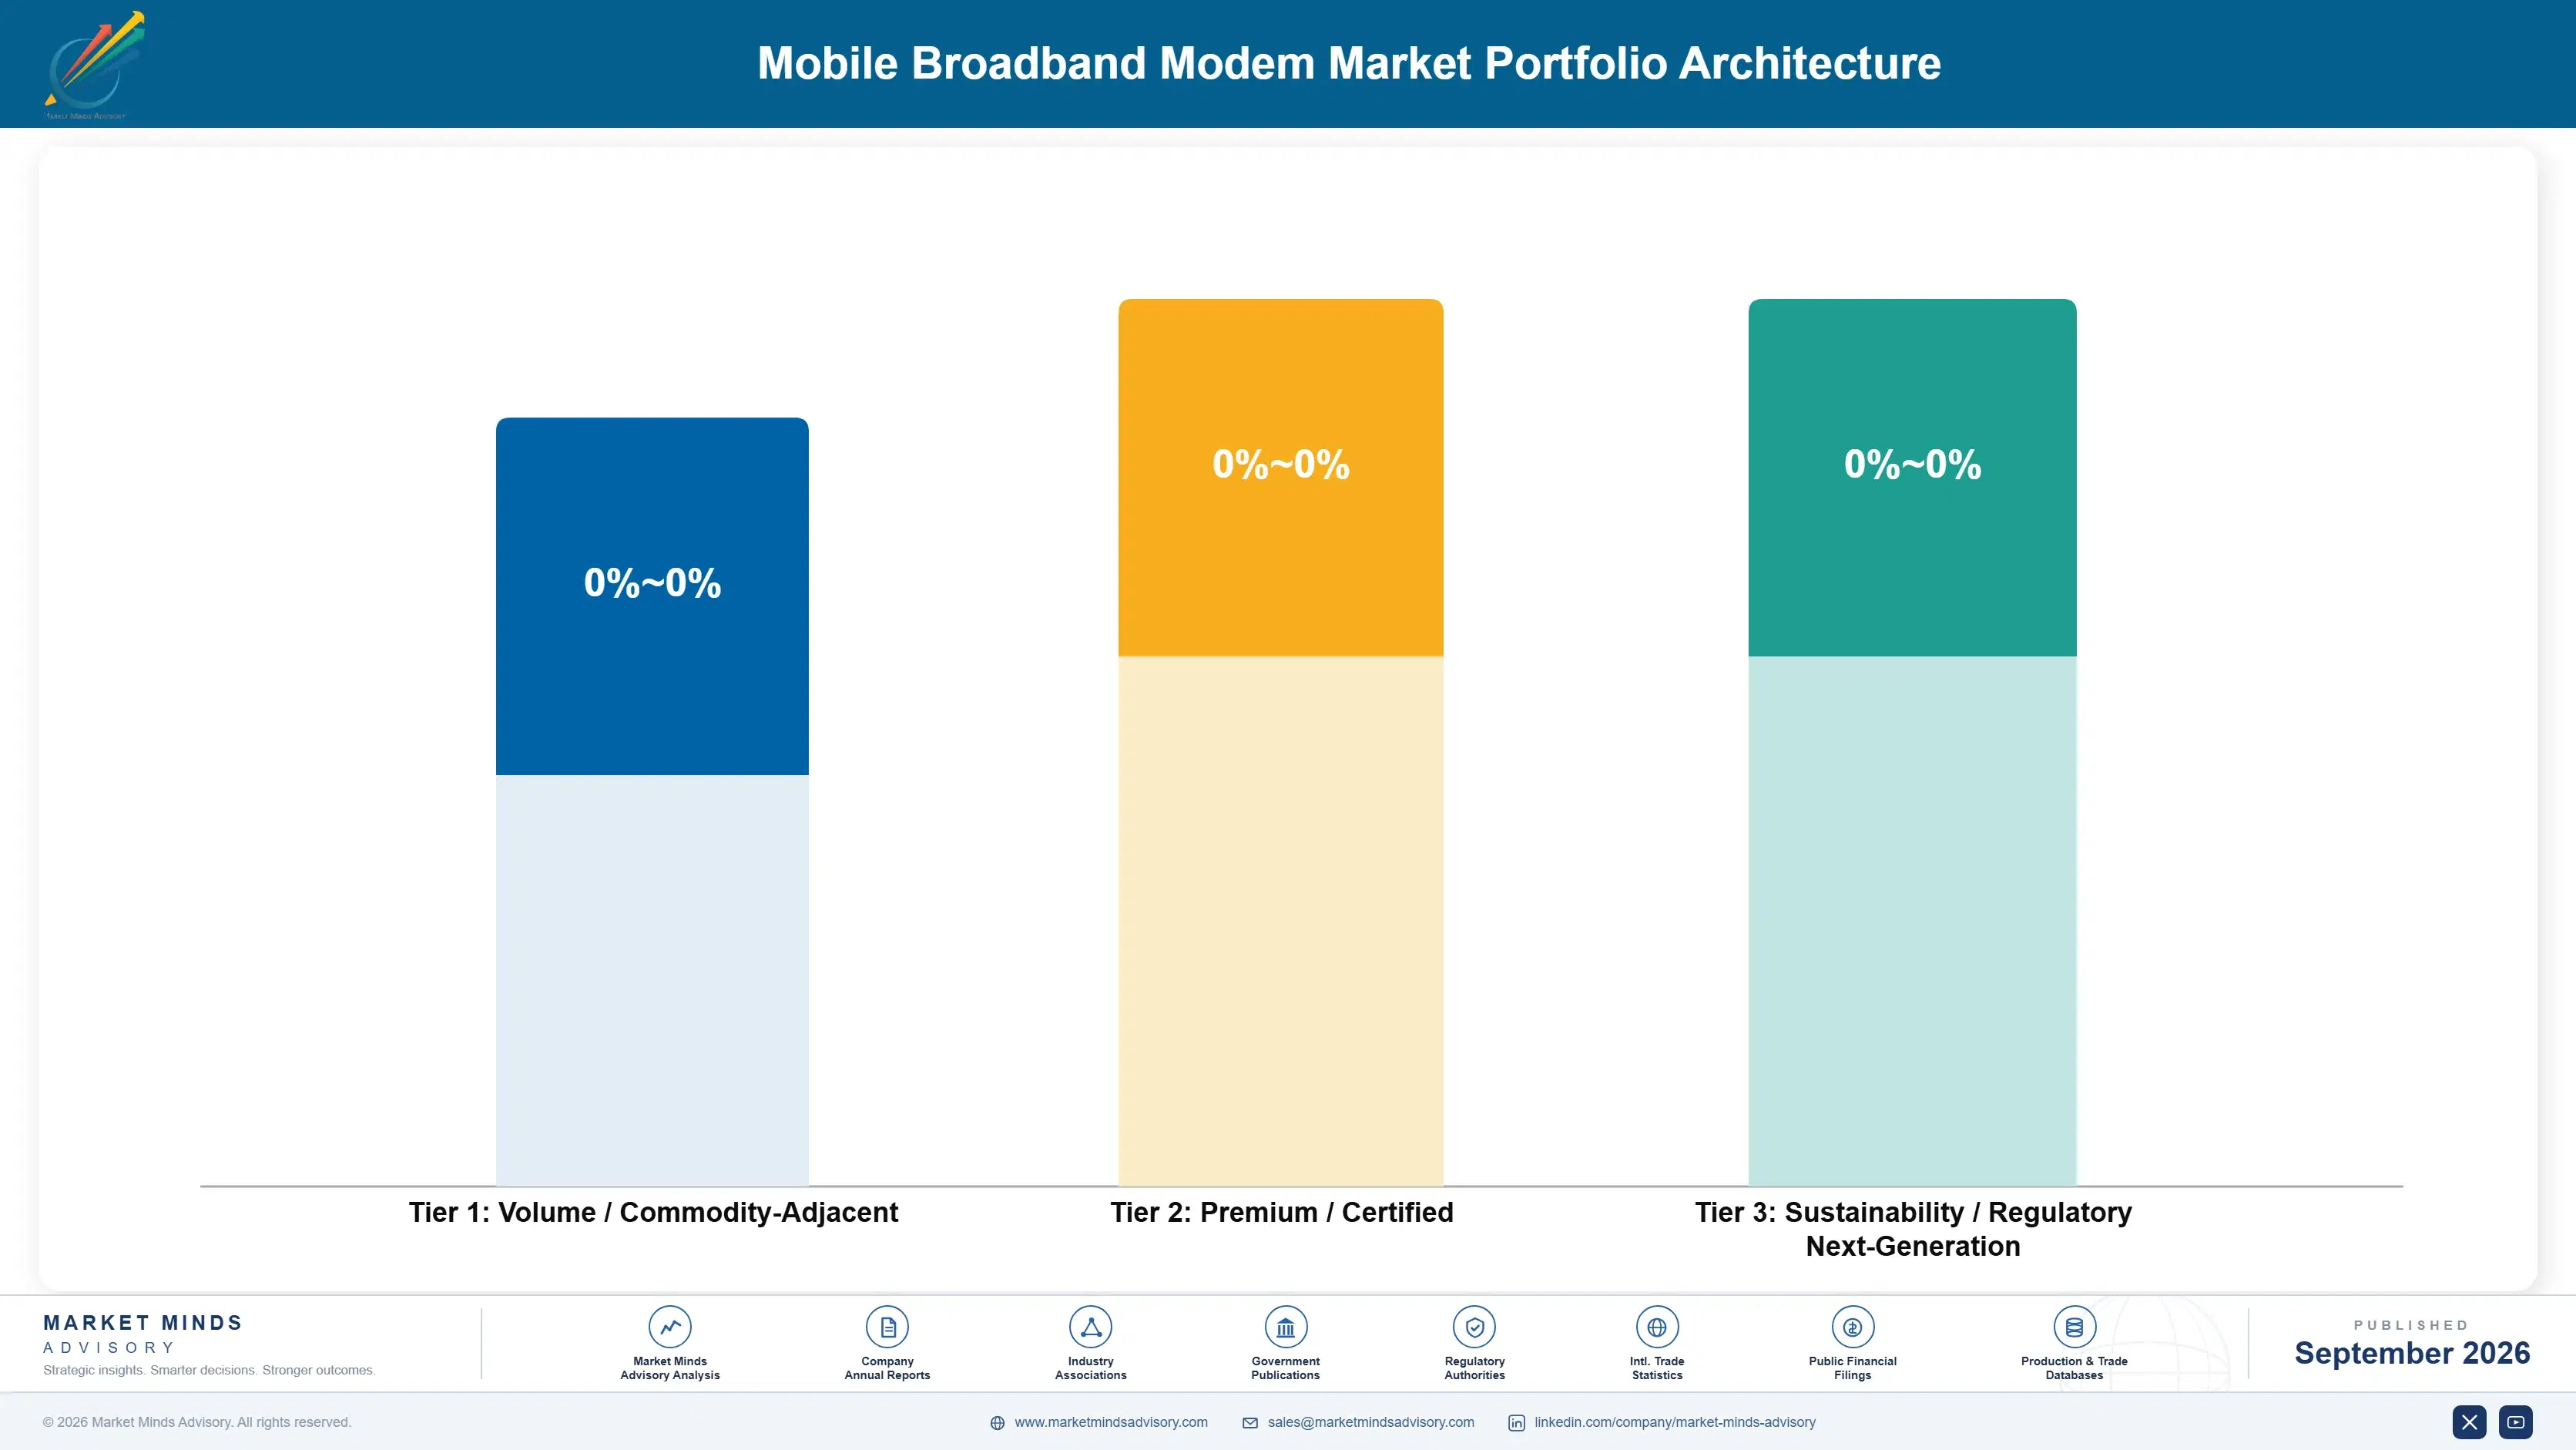
Margin architecture separates on licensing position and certification barrier rather than on silicon difficulty. Discrete modems for tablets and computing earn least, since volumes are modest and integration is displacing them steadily. Module-integrated modems sit above on packaging and application value. Automotive telematics, fixed wireless modems and licensing revenue earn most, because each carries a qualification barrier or an economic position competitors cannot replicate.
The volume versus premium tension runs between handset volume and qualified applications, which reward opposite investments entirely. Handset volume requires cost leadership and certification breadth against enormous unit counts at thin margin. Automotive and industrial require qualification investment amortised across far smaller volumes at much better pricing. Suppliers carrying handset cost structures into qualified applications rarely fund the qualification properly.

High-value pools concentrate in automotive modems and in licensing revenue, and neither is reached through silicon capability. Automotive requires qualification and three year design engagement ahead of any revenue. Licensing requires patent positions established through standards participation over decades. Both explain why five suppliers hold 82% while the standards underneath are published and available to anybody who wants to read them.

Volume / Commodity-Adjacent

Discrete modems for tablets and computing devices, where volumes are modest and application processor integration is steadily displacing standalone parts across most platforms. The twelve point spread separates suppliers with secured advanced node allocation from those buying foundry capacity against uncertain demand.
Gross Margin: 22% to 34%

Premium / Certified

Smartphone application processor integrated modems and module-integrated modems for machine connectivity, where certification breadth and cost position determine selection across very large unit volumes. The thirteen point spread tracks effective licensing cost after cross-licensing against gross rates paid to every holder.
Gross Margin: 39% to 52%

Sustainability / Regulatory / Next-Generation

Automotive telematics modems, modems for fixed wireless and industrial routers and certification and licensing revenue, each carrying a qualification barrier or economic position competitors cannot replicate. The seventeen point spread reflects patent portfolio strength and automotive qualification breadth together.
Gross Margin: 57% to 74%
mobile-broadband-modem-market-portfolio-architecture-1790004153905

High-value Sub-segments and Strategic Watch-out

Modems For Fixed Wireless And Industrial Routers

Grows at 14.0% because operators use spectrum they already hold to reach subscribers fibre never justified serving. The seventeen point spread reflects certification position. Single operator terminals carry lighter certification burden than globally roaming handsets do. Terminal cost decides these awards. Certification is lighter here.
Gross Margin: 57% to 74%

Automotive Telematics Modems

Grows at 11.8% as cellular connectivity becomes standard fitment under emergency calling regulation and update requirements. The seventeen point spread reflects qualification breadth. A socket won ships for a complete model generation without further competition. Qualification narrows the field first. Sockets last a generation. Regulation drove it.
Gross Margin: 57% to 74%

Module-Integrated Modems For Machine Connectivity

Grows at 10.6% on industrial and asset connectivity reaching applications that previously ran on wired links. The thirteen point spread reflects licensing position. Module makers rather than device brands make most of these selection decisions themselves. Wired links are being replaced steadily. Module makers decide selection.
Gross Margin: 39% to 52%

Discrete Modems For Tablets And Computing

Grows at 4.8%, slowest of the six classes, as application processor integration steadily displaces standalone parts across computing platforms. The twelve point spread reflects foundry allocation. Volumes are modest against handset and machine connectivity shipments anywhere. Integration keeps taking designs. Volumes stay modest overall. Foundry allocation matters.
Gross Margin: 22% to 34%

Why Certification Gates Everything

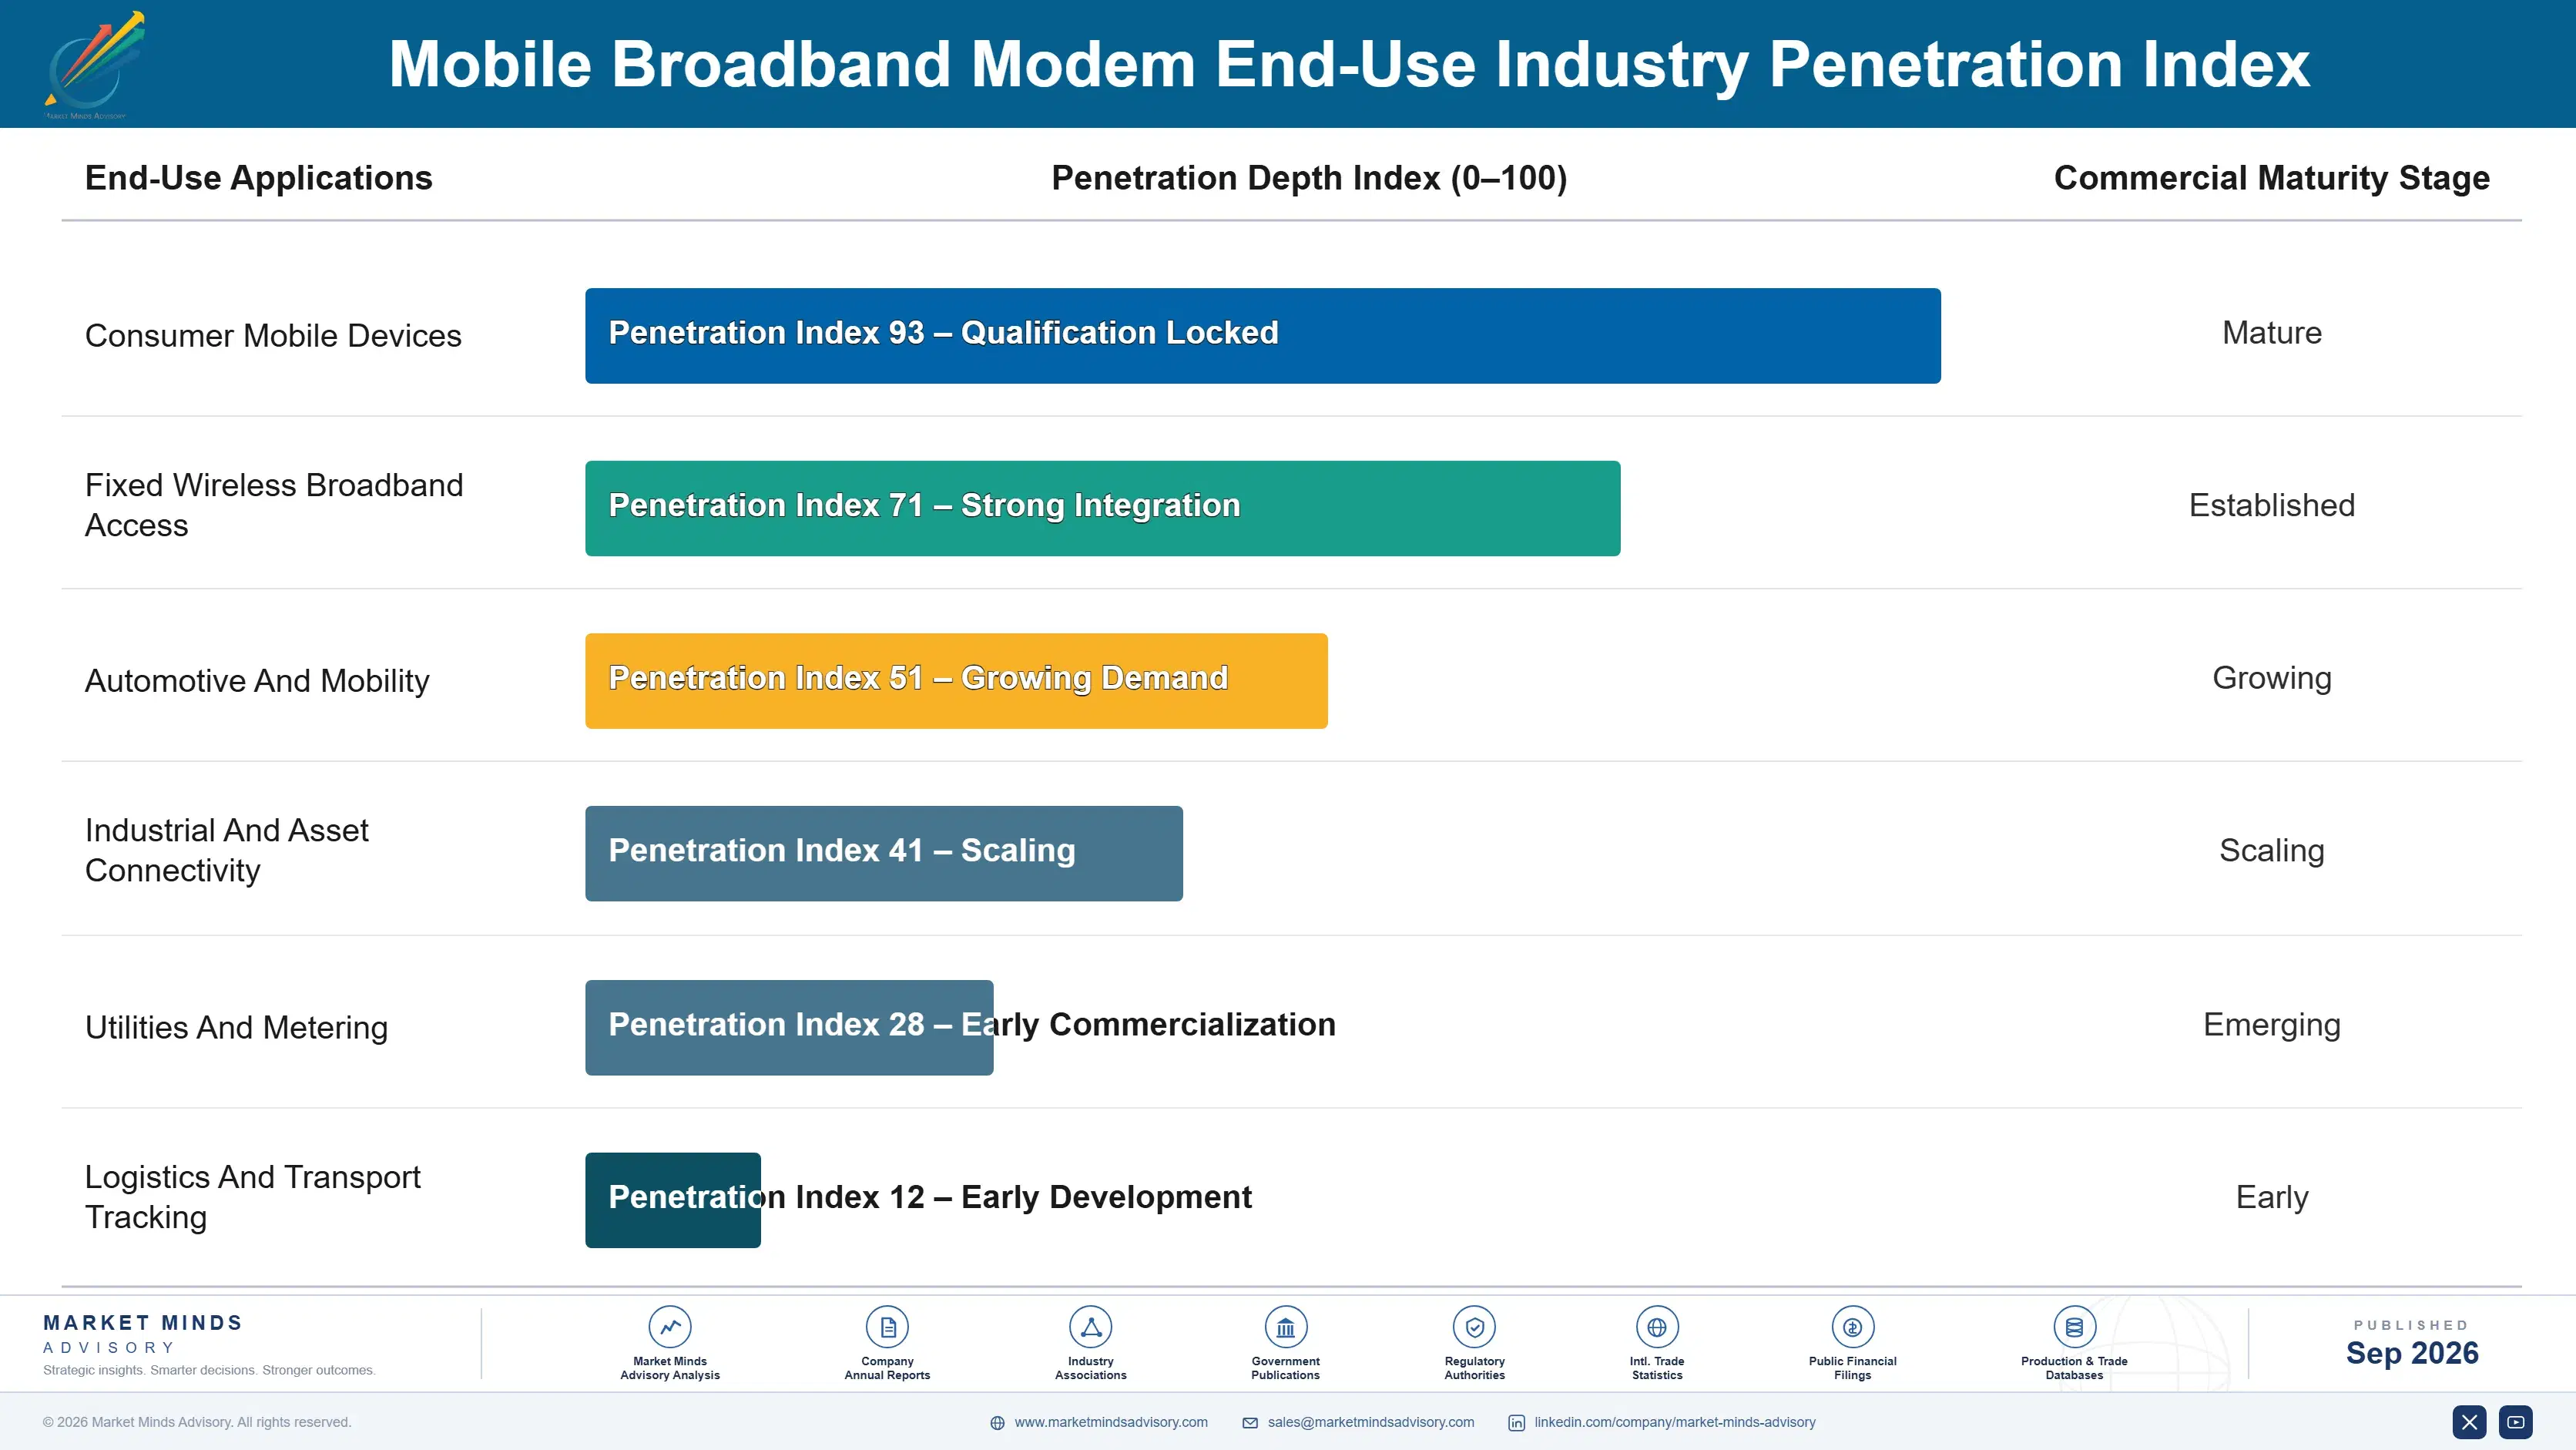
The annuity here is the certification portfolio rather than any customer relationship. Certifying across major operator networks takes around 9 months and covers band combinations that differ by market, which means a supplier's addressable geography is set by paperwork rather than by silicon. That portfolio compounds: a supplier already certified adds a new device faster than a competitor entering from nothing, and the gap widens with every generation.
Depth varies by application. A handset must roam globally across around 64 band combinations and satisfy every operator it might touch. A fixed wireless terminal serves one operator on known bands and certifies far more simply. That difference is why the fastest growing segment is also the most accessible to suppliers who could never fund global handset certification, and it is reshaping who competes where.

The buyer has moved beyond the handset maker. A smartphone designer evaluated modem performance, power and cost against a flagship specification. A fixed wireless operator evaluates terminal cost against subscriber acquisition economics. A vehicle manufacturer evaluates qualification and a three year design cycle. Only the first buyer ever cared much about throughput, and that buyer is no longer where growth is.
mobile-broadband-modem-market-end-use-penetration-index-1790004154404

What Wins Modem Business

These are among the four positions where our research anticipates prominent divergence between winners and laggards over the coming forecast period. Each is grounded in the demand model, the regulatory perimeter, and the announced capacity pipeline.
01 / CERTIFICATION PORTFOLIO BUILDING

Collect Approvals Before Improving Radios

Certifying a device across major operator networks takes around nine months and a global product must support roughly 64 band combinations before any testing even begins. That portfolio rather than radio performance determines which markets a supplier can serve at all, which is why concentration sits at 82% on standards that are published openly. Suppliers investing in certification reach markets that competitors with better silicon simply cannot sell into at any price or on any terms whatever it costs them.
02 / PATENT POSITION PRIORITY

Attend The Meetings Or Pay Forever

Standard essential patent obligations absorb around 18% of device cost and are paid to holders whose positions came from participating when the standards were originally written. A supplier without a portfolio pays that and collects nothing back, which no manufacturing or design efficiency addresses at all. The patents governing the next generation are being created now in current working groups, and absence from that work accepts the handicap for another decade of standards work and the cost is small against the alternative.
03 / APPLICATION MIX REBALANCING

Leave The Phone, Follow The Terminals

Around 39% of modem shipments now go into devices other than smartphones and tablets, and fixed wireless terminals grow at 14.0% against 9.3% for the market as operators use spectrum they already hold. Those applications also carry lighter certification burden since a terminal serves one operator on known bands. Suppliers organised around handset design cycles are serving the flattest part of a market growing quickly elsewhere entirely and reachable more cheaply for smaller suppliers competing on cost for the same subscribers.
04 / VEHICLE PROGRAMME TIMING

Win Sockets That Ship For Generations

Vehicle design cycles run around three years from modem architecture decision to volume shipping, and a position won at that moment ships for a full model generation without any further competition arising. Automotive qualification narrows the supplier field considerably before capability is ever compared between candidates. Suppliers timing engagement to vehicle programme starts reach the only moment selection is genuinely open, and those sockets are the most durable in wireless silicon by a considerable margin over any other application in wireless silicon.

Engagement Snapshot From the Field

A live engagement with an industry participant carrying material or product regulatory and market exposure ahead of a defining policy shift, showing how our research translates into a defensible multi-year portfolio strategy.
MARKET MINDS ADVISORY · CLIENT ENGAGEMENT SUMMARY
Mobile Broadband Modem Producer Strategic Portfolio Review and Transition Roadmap 2026·Investment Scenario on Mobile Broadband Modem Exposure Evaluation 2025-26
CLIENT PROFILE
A wireless module maker with competitive modem integration losing bids in handset-adjacent markets while its industrial router business grew, and paying gross standard essential patent rates with no portfolio of its own. Management had approved further radio performance investment, without establishing why the losses were happening at all. Nobody had traced where the bids were actually failing.
STRATEGIC CHALLENGE
Engineering wanted radio performance investment to close a benchmark gap against larger competitors. Finance wanted the licensing cost reduced. Nobody had examined at what stage bids were being lost, and a substantial fixed wireless opportunity was opening across several operators within the following year. Both proposals assumed the losses were technical.
MMA APPROACH
MMA traced lost bids to establish whether they failed on performance, certification coverage or landed cost including licensing. We compared certification burden across handset, fixed wireless and industrial applications and modelled entry economics for each. Work drew on 47 expert interviews conducted in Q4 2025 with device makers, operators and modem suppliers.
KEY FINDINGS
  1. Bids were lost on certification coverage rather than radio performance in around 78% of cases, which further engineering investment would not have changed.
  2. Fixed wireless terminals serving 1 operator on known bands required only a fraction of the certification effort that global handset products demanded.
  3. Gross licensing rates absorbed roughly 18% of device cost while cross-licensed competitors paid materially less for the same obligations (client-reported, unverified by MMA).
  4. Standards working group participation would have cost far less annually than the licensing differential the company was already paying out every single year.
CLIENT PROFILE
A wireless module maker with competitive modem integration losing bids in handset-adjacent markets while its industrial router business grew, and paying gross standard essential patent rates with no portfolio of its own. Management had approved further radio performance investment, without establishing why the losses were happening at all. Nobody had traced where the bids were actually failing.
STRATEGIC CHALLENGE
Engineering wanted radio performance investment to close a benchmark gap against larger competitors. Finance wanted the licensing cost reduced. Nobody had examined at what stage bids were being lost, and a substantial fixed wireless opportunity was opening across several operators within the following year. Both proposals assumed the losses were technical.
MMA APPROACH
MMA traced lost bids to establish whether they failed on performance, certification coverage or landed cost including licensing. We compared certification burden across handset, fixed wireless and industrial applications and modelled entry economics for each. Work drew on 47 expert interviews conducted in Q4 2025 with device makers, operators and modem suppliers.
KEY FINDINGS
  1. Bids were lost on certification coverage rather than radio performance in around 78% of cases, which further engineering investment would not have changed.
  2. Fixed wireless terminals serving 1 operator on known bands required only a fraction of the certification effort that global handset products demanded.
  3. Gross licensing rates absorbed roughly 18% of device cost while cross-licensed competitors paid materially less for the same obligations (client-reported, unverified by MMA).
  4. Standards working group participation would have cost far less annually than the licensing differential the company was already paying out every single year.
RECOMMENDED STRATEGY
Phase 1: Phase one: stop the radio performance investment, since around 78% of lost bids failed on certification coverage rather than on any measured performance. Phase 2: Phase two: concentrate certification spending on fixed wireless and industrial applications, where single operator terminals need far less coverage overall. Phase 3: Phase three: join standards working groups now, since the patents governing the next generation are being written by whoever attends them.
OUTCOME
The module maker redirected spending from radio performance into certification coverage for fixed wireless applications (client-reported, unverified by MMA). Win rates improved once certification matched the applications targeted, and standards participation began ahead of the next generation. Bid losses are now analysed by failure stage rather than assumed, which outlasted the engagement.

Frequently Asked Questions

Foundational context covering the market sizes, CAGR, scope, country, region and competition that inform every finding below. This section is provided to cover basics and most often pre-purchase conversations, answered from the MMA Primary Research Dataset.

What is the current size of the Mobile Broadband Modem Market?

Global value reaches USD 21.5 billion in 2026, measured as modem consumption value across six device applications. The 2025 base was USD 19.6 billion on the same basis.

How large will the Mobile Broadband Modem Market be by 2036?

The market reaches USD 52.3 billion by 2036, an increase of USD 30.8 billion across the forecast period. That represents 2.43 times expansion from the 2026 base.

What is the CAGR for the Mobile Broadband Modem Market 2026 to 2036?

The base case runs at 9.3% annually, with a bull case at 10.6% if fixed wireless deployment accelerates and a bear case at 8.1% if handset replacement cycles extend further.

Which segment is growing fastest?

Modems for fixed wireless and industrial routers grow at 14.0%, half again the market rate of 9.3%. Operators reach subscribers where laying fibre never made economic sense.

Who are the major companies in the Mobile Broadband Modem Market?

Qualcomm, MediaTek, Samsung Electronics, UNISOC and Huawei HiSilicon lead on consumption value, holding 82% between them. Sequans and Quectel hold smaller positions in the category.

Which country is growing fastest?

India leads at 15.6%, as operators use spectrum they already hold to reach subscribers that wired broadband barely served. Indonesia and Brazil follow behind it.

Report Segmentation Architecture

The full report scope spans multiple orthogonal segmentation dimensions, with cross-tabulated demand data provided for each dimension pair. Coverage extends further to regional breakdowns, trend trajectories, and the competitive detail needed to support segment-level decision-making.

By Device Application

  • Modems For Fixed Wireless And Industrial Routers
  • Automotive Telematics Modems
  • Smartphone Application Processor Integrated Modems
  • Module-Integrated Modems For Machine Connectivity
  • Certification And Licensing Revenue
  • Discrete Modems For Tablets And Computing

By End-Use Industry

  • Consumer Mobile Devices
  • Fixed Wireless Broadband Access
  • Automotive And Mobility
  • Industrial And Asset Connectivity
  • Utilities And Metering
  • Logistics And Transport Tracking

By Commercial Dimension

  • Device Maker Design Win
  • Module Manufacturer Supply
  • Operator Specified Terminal Programmes
  • Automotive Tier One Contracting
  • Standard Essential Patent Licensing
  • Reference Platform Distribution

By Region

  • East Asia
  • South Asia and Pacific
  • North America
  • Western Europe
  • Latin America
  • Middle East and Africa
  • Eastern Europe

Scope, Methodology, and Coverage

Every figure in this report is reproducible from documented input assumptions. The scope below maps the historical period, the forecast horizon, the segmentation dimensions, and the countries covered, alongside the underlying primary and qualitative methodology.
Historical Period
2020 to 2025
Forecast Period
2026 to 2036
Base Year
2025 (USD billions; MMA Primary Research Dataset, September 2026)
Market Definition
This report covers mobile broadband modems: the baseband and radio frequency silicon providing cellular connectivity in devices, spanning modems for fixed wireless access and industrial routers, smartphone application processor integrated modems, discrete modems for tablets and computing, automotive telematics modems, module-integrated modems for machine connectivity, and the carrier certification and intellectual property licensing attached. It excludes network infrastructure equipment, wireless local area networking silicon, satellite terminals, complete devices, and radio frequency front end components sold separately.
Quantitative Units
USD millions, modem consumption value basis; modems shipped; carrier certification periods in months; supported band combinations per device; licensing share of device cost; non-handset share of shipments; design cycle duration in years.
Segmentation Dimensions
Device application; end-use industry; commercial design win route; geography across seven regions.
Regions Covered
East Asia, South Asia and Pacific, North America, Western Europe, Latin America, Middle East and Africa, Eastern Europe
Countries Covered
China, Taiwan, South Korea, Japan, Vietnam, India, Indonesia, Singapore, United States, Canada, Mexico, Brazil, Germany, France, United Kingdom, Italy, Poland, Saudi Arabia, Nigeria, South Africa.
Key Companies Profiled
Qualcomm, MediaTek, Samsung Electronics, UNISOC, Huawei HiSilicon, Apple, Sequans Communications, Telit Cinterion, Quectel Wireless Solutions, Fibocom Wireless, Sierra Wireless, u-blox, Nordic Semiconductor, Sony Semiconductor, Murata Manufacturing.
Quantitative Methodology
Primary survey, n=3,800 respondents, Q4 2025, six countries; demand-side model with trade association cross-validation
Qualitative Methodology
47 expert interviews, Q4 2025; applied to validate demand model assumptions, identify emerging dynamics, and assess competitive positioning
Report Format
PDF and XLSX data workbook (Word format preview document)
Publisher
Market Minds Advisory
Report Code
MMA-2026-TEC-321
Published
September 2026
Contact
sales@marketmindsadvisory.com | www.marketmindsadvisory.com

Purchase the full Mobile Broadband Modem Market Report (2026 to 2036).

This report sizes the global mobile broadband modem market from 2026 to 2036 across six device applications, six industries and seven regions. It explains why carrier certification taking around nine months across roughly 64 band combinations determines addressable markets more than radio performance ever does. Standard essential patent obligations absorbing around 18% of device cost are analysed as a permanent handicap for suppliers without portfolios. Non-handset applications reaching around 39% of shipments are examined as where growth actually moved. Regional analysis explains why East Asia holds 47% of consumption.
Six device applications sized through to 2036
Carrier certification periods quantified against addressable market access
Licensing obligations analysed as a permanent cost handicap
Twenty named suppliers assessed on modem consumption value
Four revenue levers with quantified commercial impact
Anonymised module maker entry engagement documented in full

Built For The People Who Decide

From boardroom strategy to bench-side execution, this report is read cover-to-cover by leaders shaping the next decade of their industry, turning demand scenarios, market dynamics and valuation benchmarks into decisions.
CXOs/ Presidents/ VPs/ Managers
M&A and Corporate Development
Strategy Teams and R&D Heads
Procurement and Product Directors
Regulatory and Compliance Leaders
Investor Relations and Equity Analysts