Market Minds Advisory
Mobile Application Store Market

Mobile Application Store Market: Mobile Application Store Market. Alternative Storefronts Reshape Distribution Economics

App developers and consumers are adopting alternative mobile app storefronts as regulatory mandates force platform openness, reshaping commission structures and distribution economics that Apple and Google have controlled for over a decade.

Lead Analyst

Published

September 2026

Make Smarter Decisions with Customized Research Insights

Request a free sample report and evaluate market opportunities, growth trends, and competitive dynamics relevant to your business needs.

2025 MARKET VALUE$145.0BMarket Size 2025
2036 FORECAST VALUE$529.7BBase Case , 2026 to 2036
CAGR 2026 TO 203612.5 %Bull 13.8% / Bear 11.2%
INCREMENTAL OPPORTUNITY$366.6BNet 10- year value creation
EXPANSION MULTIPLE3.25x2036 value over 2026 base
Strategic Levers
M&A Pipeline
Regional Outlook
Country Rankings
Competitive Intelligence
Segmental Deep-dive
Call-Us : 91 93563 13602

Executive Snapshot and Market Trajectory.

Regulatory mandates in the European Union and elsewhere are now increasingly forcing both Apple and Google to permit alternative app storefronts, ending over a decade of closed distribution control and reshaping developer economics industry-wide across every app category, price tier, platform, and geographic region tracked in this report.
Third-party alternative app storefronts are growing fastest as regulatory sideloading mandates create genuine competitive entry opportunities that did not previously exist within the dominant platform structures controlling nearly all consumer app distribution channels worldwide until only recently. Gaming and entertainment app categories drive the largest current share of alternative storefront activity, reflecting developer frustration with standard platform commission rates on high-revenue in-app purchase transactions processed daily across millions of devices and users.
Competitive intensity is rising as Epic Games Store and other alternative storefronts compete directly with Apple and Google on commission rates and developer terms rather than pure catalog breadth or brand recognition alone across every category. Regulatory enforcement timelines and platform compliance approaches are shaping which alternative storefronts can credibly establish meaningful user bases without facing continued platform-level friction and discoverability barriers built into device defaults.
Market Definition
This market covers digital storefronts and marketplace platforms that distribute mobile applications to consumers, including dominant platform-owned stores and alternative third-party storefronts. It excludes web-based application delivery, enterprise mobile device management software, and app development tools unrelated to consumer distribution and discovery.
Base Year Value
$145.0B in 2025 (MMA Primary Research Dataset, September 2026)
Forecast Period
2026 to 2036, eleven discrete annual values
CAGR
12.5% base case. Bull 13.8%. Bear 11.2%.
Fastest Growth Segment
Third-Party Alternative App Storefronts: 19.0% CAGR
Fastest Growth Country
India: 15.5% CAGR
Fastest Growth Region
South Asia and Pacific: 14.5% CAGR
Largest Region
North America: 30% of 2025 global value
Market Leaders
Apple App Store, Google Play, Samsung Galaxy Store, Epic Games Store, AptoideMarket
Primary Survey
n=3,800 procurement and R&D decision-makers, Q4 2025, six countries
Methodology
Demand-side build-up, cross-validated against public data, 47 expert interviews

Mobile Application Store Market Forecast Scenarios

mobile-application-stores-market-size-forecast-scenario-1788503302110
Mobile application store demand between 2020 and 2025 grew steadily as smartphone penetration expanded and in-app purchase transaction volume climbed, even as regulatory scrutiny of platform commission structures intensified meaningfully in major markets. The European Union's Digital Markets Act enforcement beginning in 2024 marked a genuine inflection point, forcing platform openness changes that had previously seemed commercially unlikely given platform owner resistance.
The base case assumes continued expansion driven by three commercial mechanisms: regulatory mandates in additional jurisdictions following the European Union's lead in forcing platform openness and alternative storefront permission, developers increasingly distributing through multiple storefronts simultaneously to capture lower commission rates on high-margin transactions, and alternative storefronts investing in discovery and marketing capability to overcome the platform default advantage that incumbent app stores retain. Gaming publishers in particular are testing direct distribution models that bypass traditional storefronts entirely for certain transaction types.
A bull scenario centers on additional major markets adopting comparable regulatory openness mandates, accelerating alternative storefront adoption well beyond currently modeled European Union-driven growth alone. The bear risk is platform owners successfully defending commission structures through technical or contractual friction that neutralizes regulatory mandates in practice, which would slow the alternative storefront growth projected here.

Where Regulation Meets Platform Distribution Control

Mobile application stores sit at the intersection of digital distribution infrastructure and platform economics, controlling the commission structures and discovery mechanisms that determine which apps reach consumers and how developers monetize their products. The category remained remarkably stable for over a decade until regulatory intervention began forcing genuine competitive entry points that platform owners had successfully resisted. This shift is reshaping decade-old assumptions about mobile distribution economics.
MARKET CONCENTRATIONCR5 71%Top five storefronts hold a dominant combined revenue share
STANDARD COMMISSION RATE15% to 30%Typical revenue share platforms retain on digital transactions processed
TOP COUNTRY USER SHAREUnited States leadsSingle country contributes the largest share of app spending
ALTERNATIVE STOREFRONT PENETRATION~4% of installsPortion of app installs occurring outside dominant platform storefronts
IN-APP PURCHASE REVENUE SHARE~65% of totalPortion of total app store revenue from in-app transactions
DEVELOPER COMMISSION DISPUTE RATE~8% of large developersShare of major developers formally disputing platform commission terms
Alternative storefronts increasingly compete on commission rate and developer terms rather than pure catalog breadth, since most popular apps remain available across multiple storefronts simultaneously once sideloading becomes technically and legally permitted. Discovery and default installation advantage remain the primary barrier facing alternative storefronts, since consumers rarely seek out a second app store absent a specific reason to do so.
Competitive advantage increasingly rests on payment processing integration and developer relationship depth rather than raw catalog size alone, since developers choosing where to distribute weigh total cost of ownership across commission rates, payment processing fees, and marketing support. Platforms lacking demonstrated regulatory compliance posture face growing legal and reputational risk as enforcement actions accelerate across multiple jurisdictions simultaneously. Storefronts investing early in compliance infrastructure increasingly gain a meaningful trust advantage with developers.
"Commission rate is no longer a fixed cost of doing business, it is now a negotiating variable. Developers who understood that first are the ones capturing the margin platforms used to keep."
Principal Analyst, Digital Platform Economics and App Distribution Practice · MMA Mobile Application Distribution Platforms and App Marketplace Services Practice · September 2026

Market Trends

Regulatory Sideloading Mandates Force Platform Openness

The European Union's Digital Markets Act now requires Apple and Google to permit alternative app storefronts and sideloading on their respective mobile operating systems, ending over a decade of closed distribution control that platform owners had successfully defended against prior legal and regulatory challenges. Similar regulatory approaches are advancing in additional jurisdictions including Japan and several United States state legislatures considering comparable openness mandates. This shift matters because it creates genuine competitive entry points for alternative storefronts that previously could not gain meaningful distribution regardless of commission rate or developer terms offered.
Market Impact: Commissions range 15 to 30 percent
Developers Increasingly Distribute Across Multiple Storefronts

Major developers increasingly distribute their applications across multiple storefronts simultaneously, maintaining a presence on both dominant platform stores and emerging alternative storefronts to capture lower commission rates on high-margin in-app purchase transactions wherever regulatory and technical conditions permit multi-storefront distribution. This multi-homing behavior represents a genuine shift from the historical practice of treating platform store presence as effectively mandatory and exclusive by default. Epic Games has been particularly vocal about pursuing this strategy, directing high-value transactions toward its own storefront and payment processing infrastructure wherever legally and technically feasible under current regulatory frameworks.
Market Impact: Regulatory jurisdictions expanded to 4 markets

Market Opportunities and Growth Drivers

Developer Frustration With Standard Commission Rates Grows

Developers increasingly view standard platform commission rates of 15 to 30 percent as excessive relative to the actual payment processing and distribution costs platforms incur, particularly for high-revenue transactions where the marginal cost of serving an additional sale is minimal compared to the commission collected. This frustration has translated into active political and regulatory advocacy, with major developers funding lobbying efforts and legal challenges specifically targeting platform commission structures in multiple jurisdictions simultaneously. Alternative storefronts explicitly market lower commission rates as their primary competitive differentiator, directly addressing this well-documented developer grievance.
Market Impact: Adds 12 to 18 months

Regulatory Enforcement Expands Beyond the European Union

Regulatory bodies beyond the European Union are increasingly scrutinizing platform commission structures and distribution exclusivity practices, with Japan implementing comparable smartphone competition legislation and several United States state legislatures actively considering similar app store openness requirements. This expanding regulatory footprint reduces platform owners' ability to treat European Union compliance as an isolated, contained cost of doing business in a single market. Alternative storefronts benefit directly from this regulatory expansion, since each additional jurisdiction mandating openness expands their addressable, legally permitted market opportunity meaningfully. Smaller alternative storefronts increasingly benefit from this broader regulatory momentum regardless of their own individual scale.
Market Impact: Adds 5 to 8pp fees

Market Restraints and Challenges

Platform Default Installation Advantage Limits Adoption

Dominant platform app stores retain a powerful default installation advantage since they arrive pre-installed on virtually every device sold, while alternative storefronts require consumers to actively seek out and install a separate application before accessing any alternative catalog. The root cause is that consumer behavior strongly favors default options absent a specific, compelling reason to seek alternatives, and most consumers remain unaware that alternative storefronts exist or offer meaningfully different terms. This default advantage significantly limits alternative storefront user acquisition regardless of commission rate advantages offered to developers. Some storefronts mitigate this through developer-driven promotions directing users toward alternative channels.
Market Impact: Alternative installs reached roughly 4 percent

Platform Compliance Friction Undermines Regulatory Intent

Platform owners have implemented compliance approaches that technically satisfy regulatory sideloading mandates while introducing additional friction, warning screens, and fee structures that meaningfully discourage consumer adoption of alternative storefronts in practice. The root cause is that regulatory mandates typically specify required capabilities without fully prescribing implementation details, leaving platform owners meaningful discretion over how compliance actually manifests in the consumer experience. This friction has drawn continued regulatory scrutiny and enforcement action in multiple jurisdictions. Regulators are mitigating this by issuing increasingly specific implementation requirements following initial compliance disputes. This regulatory back-and-forth continues shaping how compliance actually functions across major markets.
Market Impact: Multi-homing developers exceed 20 percent
3 additional market trends, 4 additional growth drivers, and 2 additional restraints and challenges are covered in the full report. Contact sales@marketmindsadvisory.com to access the complete intelligence.

Segment CAGR and Growth Architecture

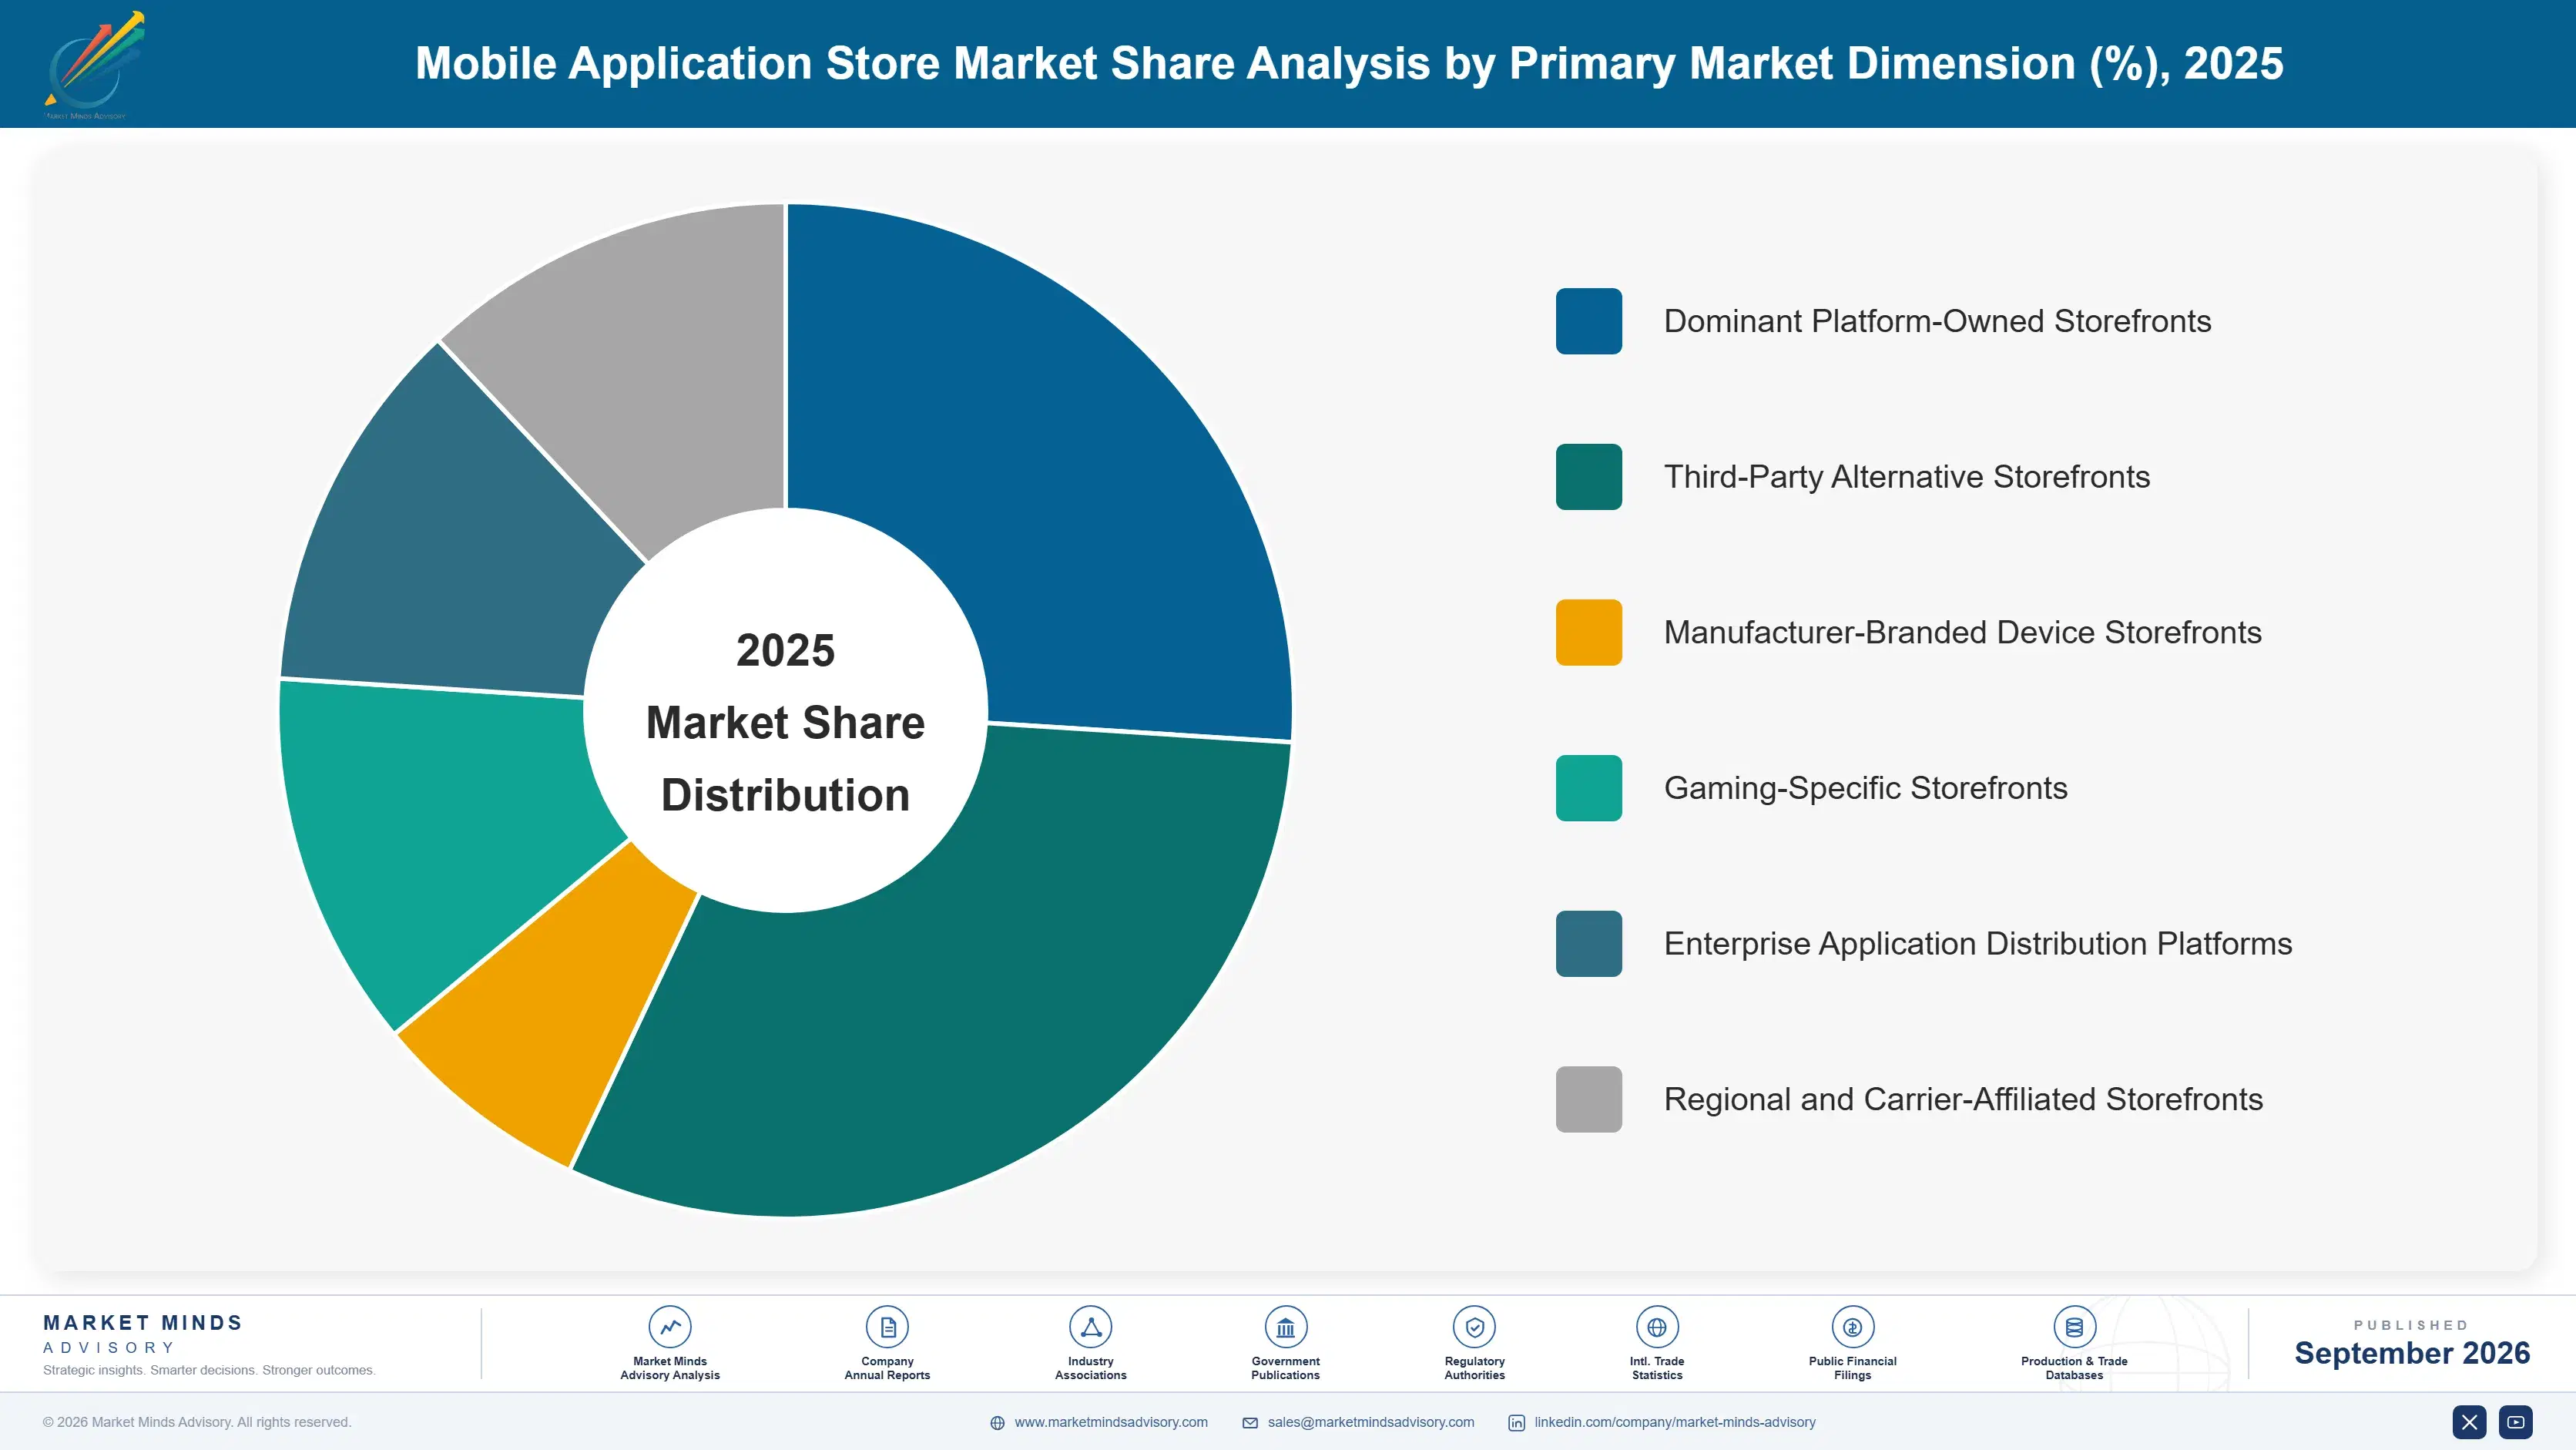
Mobile application stores segment by the primary platform ownership and distribution model, spanning dominant platform-owned storefronts, third-party alternative storefronts, manufacturer-branded device storefronts, gaming-specific storefronts, enterprise application distribution platforms, and regional or carrier-affiliated storefronts serving distinct geographic markets, device platforms, consumer segments, pricing structures, regulatory environments, and underlying technology stacks across the global mobile industry.
mobile-application-stores-market-market-share-analysis-1788503302721

Third-Party Alternative App Storefronts

Third-party alternative app storefronts operate independently of Apple and Google, competing directly on commission rate and developer terms now that regulatory sideloading mandates permit their technical existence on major mobile operating systems for the first time in over a decade. Growth outpaces the broader market by a wide margin because this segment essentially did not exist as a meaningful commercial category before recent regulatory intervention, meaning any growth from a near-zero base registers as extremely high percentage terms. Epic Games Store leads this category given its existing developer relationships built through gaming distribution, though numerous other alternative storefronts are actively entering the category to capture regulatory-driven opportunity across multiple jurisdictions simultaneously.
CAGR 19.0%

Manufacturer-Branded Device Storefronts

Manufacturer-branded device storefronts, led by Samsung Galaxy Store, ship pre-installed on specific device brands and benefit from meaningful default installation advantage similar to the dominant platform stores, though limited to a single manufacturer's device lineup rather than an entire operating system. This segment grows more slowly than pure third-party alternatives because its addressable market remains inherently limited to a single manufacturer's device installed base rather than expanding across the entire mobile operating system regardless of hardware brand. Samsung has invested meaningfully in exclusive content and developer incentives to differentiate its storefront beyond simple device pre-installation, seeking to build genuine independent consumer habit formation. This exclusive content strategy has yielded measurable but modest gains in independent app discovery behavior so far.
CAGR 8.5%
Full segment breakdown across 6 segments available in the complete report.

Regional Architecture and Country Demand Map

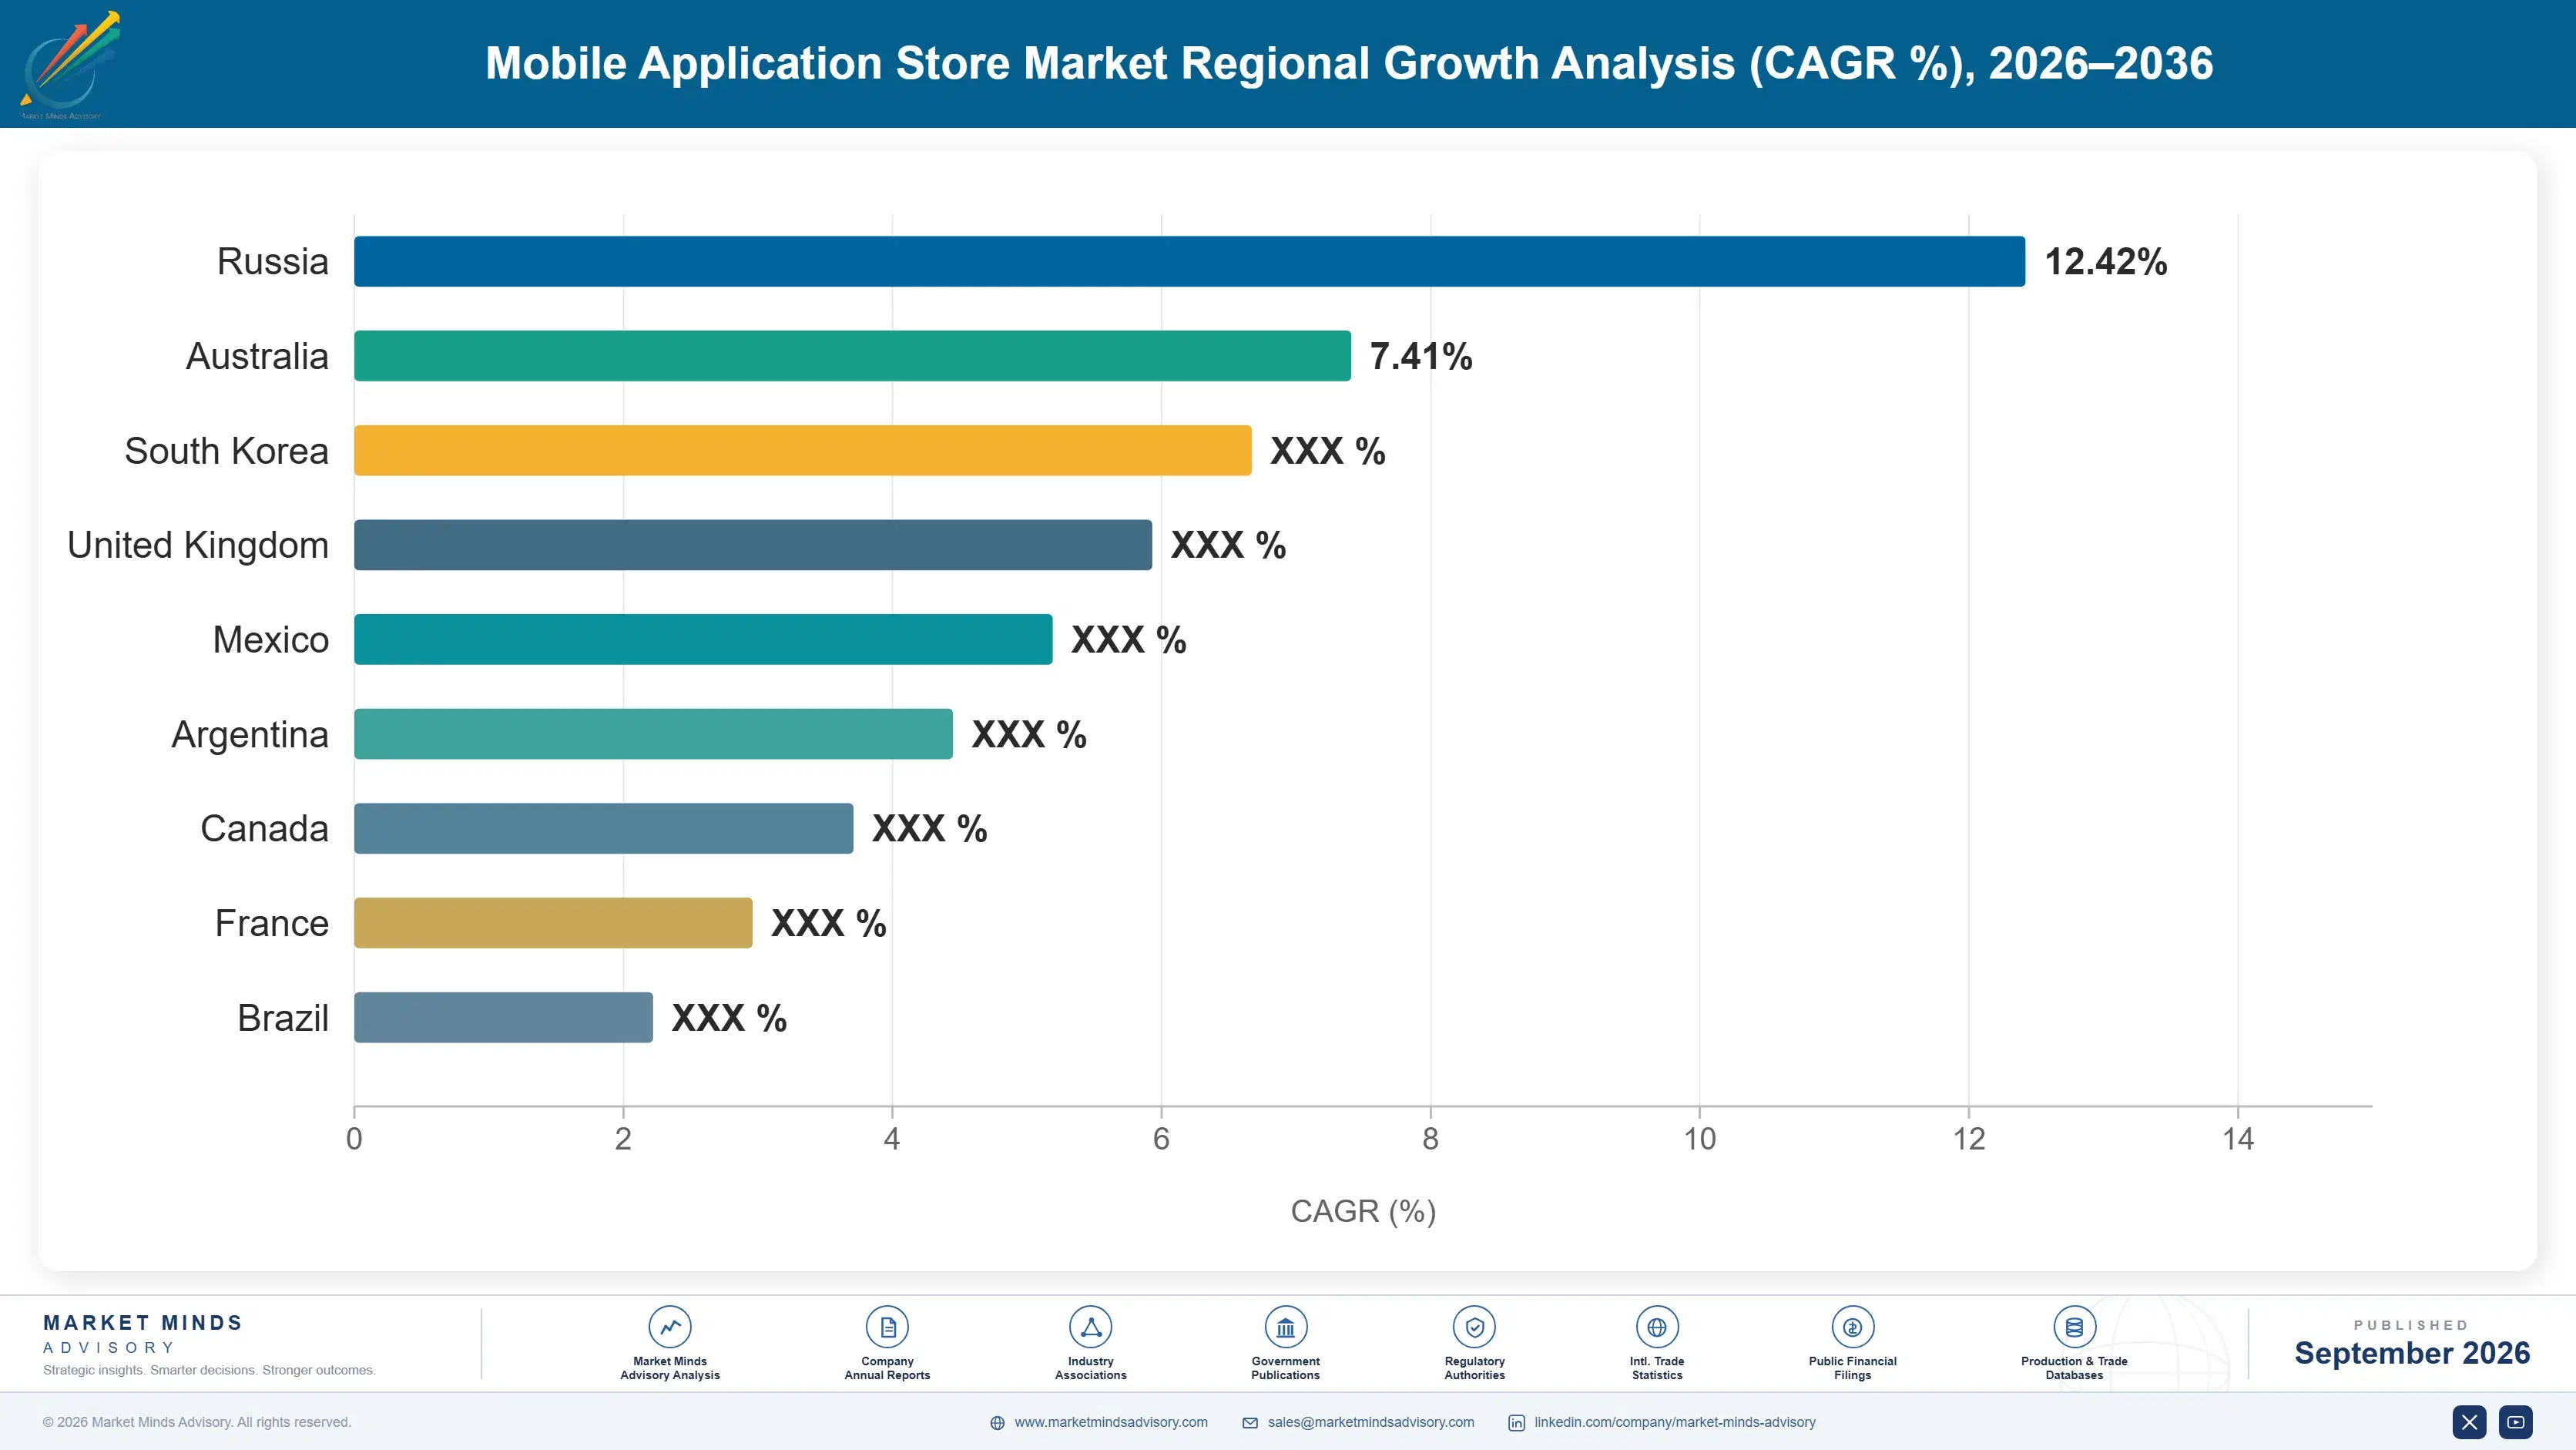
North America leads given Apple, Google, and Epic Games headquarters concentration, the highest per-user app spending globally, and the earliest wave of alternative storefront legal challenges, while South Asia and Pacific posts the fastest growth as smartphone penetration expands rapidly across a huge population base.

North America

The United States hosts the deepest concentration of app store activity globally, with Apple, Google, and Epic Games all headquartered domestically and driving the earliest wave of legal and regulatory challenges targeting platform commission structures. American developers also generate the highest per-capita in-app purchase revenue among tracked markets, supporting richer platform commission revenue even as alternative storefronts begin capturing early market share. Several United States state legislatures are actively considering app store openness legislation modeled partly on the European Union's Digital Markets Act, extending regulatory pressure beyond the single European jurisdiction that initiated this broader shift. Canada's smaller but comparable market tracks similar regulatory and consumer behavior trends closely. Mexico's growing smartphone market also contributes modestly to this regional grouping.
Share: 30% | CAGR: 13.5% (2026 to 2036)

Western Europe

The European Union's Digital Markets Act directly drives regional demand growth, having forced Apple and Google to permit alternative storefronts and sideloading across the entire European single market starting in 2024. Germany and France host the most active alternative storefront adoption within the region, reflecting both strong existing gaming communities and heightened consumer awareness of platform commission debates covered extensively in regional media. Growth trails North America and East Asia somewhat, reflecting the region's smaller overall smartphone user base relative to more populous global markets. The United Kingdom, though outside the European Union, is closely watching regional enforcement developments for potential domestic adoption. Regional developers increasingly view multi-storefront distribution as standard practice rather than an exceptional strategy.
Share: 25% | CAGR: 11.0% (2026 to 2036)
Regional intelligence for 5 additional markets available in the complete report: East Asia, South Asia and Pacific, Latin America, Middle East and Africa, Eastern Europe. Contact sales@marketmindsadvisory.com.
mobile-application-stores-market-country-cagr-analysis-1788503303255

Where App Stores Defend Recurring Margin

Beyond standard commission collection, app store operators build durable revenue through mechanisms that deepen developer dependency and demonstrate measurable discovery value over multi-year platform relationships, rewarding operators that invest early in payment processing breadth, developer tooling depth, and compliance infrastructure rather than pure commission rate defense alone across every developer segment and geography served.

Bundling Advertising and App Discovery Placement

App stores increasingly bundle paid advertising placement and search ranking boost services alongside standard app distribution, letting developers pay separately for discovery advantage beyond what organic app ranking algorithms would otherwise provide. This advertising revenue stream typically generates 5 to 8 percent of total platform revenue, providing meaningful incremental income independent of transaction commission rates that regulatory pressure increasingly targets. Developers increasingly view discovery advertising as a necessary cost of doing business given the sheer volume of competing apps within any given category on major storefronts. Larger developers increasingly treat this spend as a standard line item.
Market Impact: Discovery advertising reaches roughly 5 to 8pp yearly

Offering Developer Analytics and Tooling Subscriptions

Platforms increasingly charge separately for advanced developer analytics, crash reporting, and user acquisition attribution tools beyond the basic distribution and payment processing services included in standard commission arrangements. This tiered software subscription layer, typically priced at 3 to 5 percent of a developer's platform revenue, generates predictable recurring revenue independent of transaction volume fluctuations, providing a valuable revenue diversification beyond pure commission dependency that regulatory scrutiny increasingly targets. Larger developers managing complex, multi-market app portfolios increasingly pay for these premium tooling subscriptions to manage operations more efficiently across their full app catalog. Smaller developers often forgo these tools entirely.
Market Impact: Tooling subscriptions add roughly 3 to 5pp yearly

Charging Payment Processing Fees Separately From Commission

Platforms facing regulatory pressure to reduce standard commission rates increasingly unbundle payment processing into a separately charged fee, preserving meaningful revenue even as headline commission percentages decline under regulatory or competitive pressure from alternative storefronts. This unbundling strategy, following Apple's approach in several jurisdictions, typically charges a payment processing fee of 3 to 5 percent even when developers use alternative payment methods for the underlying transaction itself. Regulators have scrutinized this practice closely, questioning whether it effectively neutralizes the commission reduction mandates that prompted the change. This dynamic remains a central point of contention in ongoing regulatory proceedings.
Market Impact: Processing fees reach roughly 3 to 5pp yearly

Selling Enterprise App Distribution and Management Services

Platforms increasingly sell enterprise application distribution and mobile device management services to corporate customers deploying internal applications across employee device fleets, a revenue stream distinct from consumer app store commission and typically carrying contract values 2 to 3 times larger than comparable consumer relationships. Enterprise customers require compliance documentation and security certification that consumer app distribution rarely demands, raising the bar for platform infrastructure investment considerably. This enterprise revenue stream diversifies platform income beyond consumer commission dependency, reducing overall exposure to regulatory pressure targeting standard consumer transaction commission structures specifically.
Market Impact: Enterprise services reach roughly 6 to 10pp yearly

Who Controls the Margin Pool

Concentration among the top five mobile application storefronts sits at roughly seventy-one percent, reflecting the category's extreme default-installation advantage held by platform-owned stores with default installation privileges built into every device sold. Apple App Store and Google Play lead overwhelmingly on installed base and transaction volume, while the gap separating them from emerging alternative storefronts like Epic Games Store remains enormous, though narrowing gradually as regulatory mandates take effect across additional jurisdictions.
Current competitive activity centers on regulatory compliance positioning and alternative storefront discovery investment, since both directly determine whether alternative storefronts can translate legal permission into meaningful consumer adoption against entrenched default installation advantage. Several alternative storefronts have also launched developer incentive programs, offering lower commission rates and marketing support to attract high-profile app launches away from dominant platforms.

Emerging pressure comes from developers increasingly multi-homing across several storefronts simultaneously, gradually normalizing alternative storefront usage in ways that could compound over multiple years as consumer habits shift incrementally. Ranking shifts are most likely among mid-tier alternative storefronts lacking either meaningful developer incentive programs or genuine discovery marketing investment, since both dimensions increasingly separate durable emerging challengers from stalled entrants.
mobile-application-stores-market-company-positioning-matrix-1788503303783

Competitive Moat and Risk Dimensions

APPLE APP STORE

Moat: Default Device Installation Privilege

Apple's App Store ships pre-installed as the exclusive default distribution channel on every iPhone sold, giving it consumer habit formation and discovery advantage that alternative storefronts requiring active separate installation cannot easily replicate regardless of commission rate or developer terms offered. This installed base advantage compounds each year as consumer habit formation deepens further.
APPLE APP STORE

Risk: Concentrated Regulatory Enforcement Target

Apple faces the most concentrated regulatory enforcement attention among all app store operators, with the European Union's Digital Markets Act and multiple national competition authorities specifically targeting its historically closed distribution model and payment processing requirements. Continued unfavorable rulings could force additional changes to its core distribution and payment business model.
GOOGLE PLAY

Moat: Broad Android Device Distribution

Google Play benefits from pre-installation across the vast majority of Android devices sold globally by numerous manufacturers, giving it a broader device footprint than any single competing storefront despite Android's technical openness to alternative app installation methods. This scale advantage extends across a far more fragmented device manufacturer landscape than Apple faces.
GOOGLE PLAY

Risk: Greater Sideloading Technical Exposure

Android's underlying technical architecture has historically permitted sideloading more readily than Apple's iOS, exposing Google Play to somewhat greater competitive pressure from alternative storefronts and manufacturer-branded stores already established on many Android devices. Google has responded by adding friction and warnings that regulators increasingly scrutinize closely.

Players Tracked

Prominent Players

Apple App Store
Google Play
Samsung Galaxy Store
Epic Games Store
AptoideMarket

Other Key Players

Huawei AppGallery
Xiaomi GetApps
Amazon Appstore
F-Droid
APKPure
Uptodown
SlideME
Aurora Store
Cafe Bazaar
Tencent MyApp
Oppo App Market
Vivo App Store
Baidu Mobile Assistant
GetJar
Mobango

Recent Developments

MARCH 2026

Epic Games Store Launches Developer Revenue Guarantee Program

Epic Games Store launched a developer revenue guarantee program offering minimum payment commitments to attract high-profile game launches away from dominant platform storefronts, extending its aggressive customer acquisition strategy in mobile distribution. The program represents an internal marketing and incentive initiative rather than an acquisition of another company.
Signal: Demonstrates the developer incentive competitive pattern this report identifies as central to sustained platform growth strategy
DECEMBER 2025

Google Signs Compliance Agreement With European Regulators

Google signed a compliance agreement with European Union regulators modifying its Android sideloading warning screens and alternative payment processing terms following extended enforcement negotiations under the Digital Markets Act. The agreement resolves an active regulatory dispute rather than representing an acquisition or corporate transaction. Google maintains the agreement satisfies obligations.
Signal: Signals continued regulatory pressure reshaping platform compliance implementation details across every major global enforcement action currently underway
SEPTEMBER 2025

Samsung Expands Galaxy Store Exclusive Content Partnerships

Samsung expanded its Galaxy Store exclusive content partnerships with several major game publishers, extending timed exclusivity arrangements designed to differentiate its manufacturer-branded storefront beyond simple device pre-installation advantage. The expansion represents new content partnership agreements rather than an acquisition or joint venture. Terms of individual agreements were not disclosed.
Signal: Extends manufacturer-branded storefront differentiation strategy into premium exclusive gaming content and long-term developer partnerships worldwide today

Compliance and Infrastructure Cost Exposure

Mobile application store cost structures are dominated by cloud hosting and content delivery network infrastructure, payment processing fees, and increasingly substantial legal and regulatory compliance expense, rather than physical inputs or manufacturing costs. Regulatory compliance spending has risen sharply as platforms navigate simultaneous enforcement actions across multiple jurisdictions, each imposing distinct implementation requirements that increase legal and engineering overhead considerably.
Legal and compliance spending at major platform operators rose substantially during 2024 and 2025 as the European Union's Digital Markets Act enforcement intensified, according to public company financial disclosures discussing rising regulatory affairs and legal department expenditure across multiple simultaneous jurisdictions. Platforms without dedicated regulatory affairs teams in each major market absorbed proportionally higher external legal counsel costs than larger operators with established internal compliance infrastructure and expertise.

Smaller alternative storefronts lacking dedicated compliance and legal infrastructure face a genuine competitive disadvantage versus larger platforms able to absorb regulatory compliance costs across a much larger existing revenue base. This exposure varies by player type: platform-owned dominant stores with substantial existing legal departments weathered the recent compliance cost increases more smoothly than smaller alternative storefronts operating with leaner administrative structures and limited legal budgets.
mobile-application-stores-market-cost-volatility-analysis-1788503303978

Centralize Compliance Infrastructure Across Jurisdictions

Platforms are centralizing regulatory compliance infrastructure and legal expertise to serve multiple jurisdictions simultaneously rather than building fully separate teams for each market, capturing efficiency gains from shared documentation and implementation approaches across similar regulatory frameworks. This centralization also improves consistency in how the platform responds to similar regulatory questions raised in different markets.

Negotiate Volume-Based Cloud Infrastructure Agreements

Platforms are negotiating multi-year reserved cloud infrastructure capacity agreements rather than paying on-demand pricing, converting a volatile per-use cost into a predictable, discounted annual expense that simplifies financial planning considerably across product and compliance cycles. Vendors report these agreements have meaningfully reduced unplanned infrastructure cost spikes during periods of sudden, unexpected user traffic growth.

Automate Regulatory Reporting and Documentation Processes

Platforms are investing in automated regulatory reporting and compliance documentation tools that reduce the manual legal and administrative burden of demonstrating compliance across multiple simultaneous jurisdictions, freeing legal staff to focus on substantive regulatory strategy rather than paperwork. Larger platforms increasingly view this automation investment as essential given the sheer volume of ongoing regulatory obligations.

Portfolio Architecture for Margin Defence

Portfolio economics across mobile application stores split between high-volume consumer app distribution competing on transaction scale, and premium enterprise or developer tooling services commanding meaningfully higher margins per relationship given specialized compliance and analytics capability sold alongside standard distribution across every developer segment served today, from small independent developers to large multinational publishers managing hundreds of live titles simultaneously.
The tension between volume and premium positioning shows clearly in commission structure: standard consumer app distribution commands headline commission rates now under regulatory pressure to decline, while enterprise services and developer tooling subscriptions command substantially higher effective margins less exposed to regulatory scrutiny targeting consumer transaction commission structures specifically across every major jurisdiction and enforcement timeline currently unfolding worldwide.

High-value margin pools concentrate around enterprise distribution services and developer tooling subscriptions, both requiring specialized infrastructure and compliance capability that smaller alternative storefronts cannot easily replicate without years of accumulated engineering investment, customer trust, and regulatory expertise. Platforms positioned purely on consumer commission revenue will struggle to capture this premium tier without meaningful, sustained investment in enterprise sales and tooling capability over time. Larger platforms with existing enterprise sales infrastructure increasingly capture this premium tier ahead of smaller competitors.

Volume / Commodity-Adjacent

Standard consumer app distribution and commission collection facing increasing regulatory pressure to reduce headline commission rates across major jurisdictions and app categories, with margins under sustained downward pressure from enforcement actions.
Gross Margin: 20-30%

Premium / Certified

Developer analytics and tooling subscriptions sold to larger developers managing complex, multi-market app portfolios requiring advanced attribution and reporting capability beyond what standard distribution services provide by default at no extra cost.
Gross Margin: 35-50%

Sustainability / Regulatory / Next-Generation

Enterprise application distribution and compliance-conscious developer services requiring specialized infrastructure that smaller alternative storefronts cannot easily replicate quickly, commanding the category's strongest and most defensible margin position across the entire portfolio.
Gross Margin: 40-55%
mobile-application-stores-market-portfolio-architecture-1788503304486

High-value Sub-segments and Strategic Watch-out

Third-Party Alternative App Storefronts

The fastest-growing, highest-value segment as regulatory sideloading mandates create genuine competitive entry opportunities that did not previously exist within closed platform structures, letting alternative operators compete directly on commission rate and developer terms for the first time in over a decade of platform history and market structure.
Gross Margin: 20-35%

Enterprise App Distribution Services

High-value and steadily growing as corporate customers increasingly demand compliance-certified mobile device management services distinct from standard consumer app distribution channels, rewarding platforms that invest early in enterprise sales and security certification capability across every served industry vertical, customer segment, and geographic market region tracked.
Gross Margin: 40-55%

Dominant Platform Commission Revenue

The volume core of the market, generating massive revenue but facing sustained regulatory pressure that could meaningfully compress headline commission rates over time, requiring dominant platforms to diversify revenue toward enterprise and tooling services across every major geography, developer segment, and app category tracked here.
Gross Margin: 60-75%

Regulatory Enforcement Expansion Risk

A strategic watch-out category where additional jurisdictions adopting comparable openness mandates could accelerate alternative storefront growth beyond currently modeled projections meaningfully, potentially reshaping which operators capture the regulatory-driven opportunity this report identifies as the category's central near-term growth driver and primary future revenue and margin source.
Gross Margin: N/A, external

How Platform Defaults Compound Revenue

Dominant platform commission revenue functions like an annuity built on default installation privilege, since most consumers never actively seek an alternative storefront absent a specific compelling reason, letting platforms collect standard commission on the overwhelming majority of transactions year after year regardless of whether commission rates genuinely reflect the underlying cost of providing distribution and payment processing services to developers and consumers alike.
Adoption stickiness varies by end-use vertical: gaming publishers show the deepest willingness to multi-home across storefronts given the high-value in-app purchase transactions at stake and the meaningful commission savings available, while smaller utility and productivity app developers switch more readily given simpler distribution needs and lower per-transaction value that makes alternative storefront management overhead less worthwhile relative to potential savings captured.

Generational shifts in developer expectations are reshaping buyer profiles, as newer app studios entering the market now expect multi-storefront distribution as a baseline strategic consideration rather than treating platform-exclusive distribution as an unquestioned default assumption. This mindset shift extends to consumers too, with younger users showing somewhat greater willingness to install alternative storefronts than older consumers accustomed to a single default app store.
mobile-application-stores-market-end-use-penetration-index-1788503304975

MMA Verdict on App Stores

These are among the four positions where our research anticipates prominent divergence between winners and laggards over the coming forecast period. Each is grounded in the demand model, the regulatory perimeter, and the announced capacity pipeline.
01 / COMPLIANCE INVESTMENT PRIORITY

Invest proactively in multi-jurisdiction compliance capability

Platforms treating regulatory compliance as a reactive, market-by-market response will face higher legal costs and continued enforcement friction compared to competitors building centralized, proactive compliance infrastructure spanning multiple jurisdictions simultaneously and consistently across every product line. Investing early in this capability reduces the marginal cost of complying with each additional jurisdiction's requirements as regulatory momentum spreads beyond the European Union into other major consumer markets worldwide. Platforms should treat this as a durable strategic capability, not a one-time legal expense.
02 / ALTERNATIVE STOREFRONT DISCOVERY

Invest heavily in discovery to overcome default disadvantage

Alternative storefronts winning legal permission to exist without meaningful discovery investment will struggle to translate regulatory openness into genuine consumer adoption against entrenched platform default installation advantage built over more than a decade of market dominance. Discovery marketing, developer-driven promotional campaigns, and exclusive content partnerships all represent viable paths to building the consumer habit formation that default installation privilege currently provides dominant platforms automatically and at no marginal cost. Alternative storefronts should prioritize this investment over pure catalog expansion alone.
03 / ENTERPRISE REVENUE DIVERSIFICATION

Diversify into enterprise services ahead of commission pressure

Platforms overly dependent on consumer commission revenue face meaningful exposure to regulatory pressure that could compress headline commission rates further as enforcement expands into additional major markets beyond current jurisdictions already under active regulatory scrutiny and review. Building enterprise distribution and developer tooling revenue streams diversifies platform income beyond consumer commission dependency, reducing overall regulatory exposure while capturing genuinely underserved corporate customer demand across every major industry vertical and geography. Platforms delaying this diversification risk facing compressed margins with no offsetting revenue growth.
04 / DEVELOPER RELATIONSHIP INVESTMENT

Deepen developer relationships beyond pure commission collection

Platforms treating developers purely as a commission revenue source risk losing high-value developers to alternative storefronts explicitly marketing better terms and more supportive developer relationships as their primary competitive differentiator across every major app category, price tier, and geography. Investing in developer tooling, analytics, and genuine partnership programs builds switching costs that pure commission rate competition alone cannot easily overcome for platforms lacking comparable developer-facing investment and support infrastructure. Platforms should treat developer relationship depth as a durable competitive moat.

Engagement Snapshot From the Field

A live engagement with an industry participant carrying material or product regulatory and market exposure ahead of a defining policy shift, showing how our research translates into a defensible multi-year portfolio strategy.
MARKET MINDS ADVISORY · CLIENT ENGAGEMENT SUMMARY
Mobile Application Store Producer Strategic Portfolio Review and Transition Roadmap 2026·Investment Scenario on Mobile Application Store Exposure Evaluation 2025-26
CLIENT PROFILE
The client is a mid-sized mobile game publisher generating meaningful in-app purchase revenue across several live titles, previously distributing exclusively through Apple App Store and Google Play but facing rising interest in evaluating alternative storefronts following recent regulatory changes permitting sideloading in key markets. The company had no prior experience managing multi-storefront distribution and needed guidance on strategy and expected commission savings.
STRATEGIC CHALLENGE
Leadership needed to decide whether and how to pursue multi-storefront distribution without disrupting existing player relationships or creating technical complexity that could delay game updates, weighing potential commission savings against the operational overhead of managing multiple simultaneous distribution relationships, payment processing systems, and customer support channels across every affected title.
MMA APPROACH
MMA conducted a structured analysis of alternative storefront options across the client's key markets, assessing commission rate structures, technical integration requirements, and player migration risk against the client's existing revenue base and platform relationships, supplementing public data with reference conversations with comparable game publishers already actively pursuing similar multi-storefront strategies.
KEY FINDINGS
  1. Alternative storefronts in the client's largest market offered meaningfully lower commission rates on high-value in-app purchase transactions above a certain spending threshold.
  2. Technical integration complexity for supporting a second storefront was lower than initially expected given existing payment processing infrastructure already in place beforehand.
  3. Player migration risk appeared minimal in reference client experiences, since most players continued using their original storefront out of habit and convenience.
  4. Reference publishers reported meaningful commission savings within the first year that more than offset the incremental technical integration investment required upfront overall.
CLIENT PROFILE
The client is a mid-sized mobile game publisher generating meaningful in-app purchase revenue across several live titles, previously distributing exclusively through Apple App Store and Google Play but facing rising interest in evaluating alternative storefronts following recent regulatory changes permitting sideloading in key markets. The company had no prior experience managing multi-storefront distribution and needed guidance on strategy and expected commission savings.
STRATEGIC CHALLENGE
Leadership needed to decide whether and how to pursue multi-storefront distribution without disrupting existing player relationships or creating technical complexity that could delay game updates, weighing potential commission savings against the operational overhead of managing multiple simultaneous distribution relationships, payment processing systems, and customer support channels across every affected title.
MMA APPROACH
MMA conducted a structured analysis of alternative storefront options across the client's key markets, assessing commission rate structures, technical integration requirements, and player migration risk against the client's existing revenue base and platform relationships, supplementing public data with reference conversations with comparable game publishers already actively pursuing similar multi-storefront strategies.
KEY FINDINGS
  1. Alternative storefronts in the client's largest market offered meaningfully lower commission rates on high-value in-app purchase transactions above a certain spending threshold.
  2. Technical integration complexity for supporting a second storefront was lower than initially expected given existing payment processing infrastructure already in place beforehand.
  3. Player migration risk appeared minimal in reference client experiences, since most players continued using their original storefront out of habit and convenience.
  4. Reference publishers reported meaningful commission savings within the first year that more than offset the incremental technical integration investment required upfront overall.
RECOMMENDED STRATEGY
Phase 1: Phase one: launch a single title on one alternative storefront in the client's largest market to validate technical integration and player response. Phase 2: Phase two: expand successful alternative storefront distribution to additional titles once initial commission savings and player retention metrics clear thresholds. Phase 3: Phase three: evaluate expansion into additional markets as regulatory permission and alternative storefront maturity develop further over the subsequent several years.
OUTCOME
The client launched its pilot title on the selected alternative storefront, reporting meaningful commission savings on high-value transactions during the pilot period without measurable player migration disruption across its existing user base (client-reported, unverified by MMA). Leadership credited the phased approach with limiting technical risk during initial validation.

Frequently Asked Questions

Foundational context covering the market sizes, CAGR, scope, country, region and competition that inform every finding below. This section is provided to cover basics and most often pre-purchase conversations, answered from the MMA Primary Research Dataset.

What is the current size of the Mobile Application Store Market?

The Mobile Application Store Market is valued at 145.0 billion dollars in 2025. It is expected to reach 163.12 billion dollars by 2026 as alternative storefronts expand.

How large will the Mobile Application Store Market be by 2036?

The market is projected to reach 529.7 billion dollars by 2036, up from 163.12 billion dollars in 2026. That represents a 3.25 times expansion over the forecast period.

What is the CAGR for the Mobile Application Store Market 2026 to 2036?

The market is forecast to grow at a 12.5 percent compound annual growth rate between 2026 and 2036. This reflects regulatory-driven expansion of alternative distribution channels.

Which segment is growing fastest?

Third-Party Alternative App Storefronts lead at a 19.0 percent CAGR, roughly 1.52 times the overall market rate. Regulatory sideloading mandates are driving this rapid growth.

Who are the major companies in the Mobile Application Store Market?

Leading storefronts include Apple App Store, Google Play, Samsung Galaxy Store, Epic Games Store, and AptoideMarket. Together these five hold an estimated 71 percent combined market share.

Which country is growing fastest?

India leads at a 15.5 percent CAGR, driven by its massive smartphone user base and strong price sensitivity favoring alternative storefronts. Local developer relationships are also accelerating adoption.

Report Segmentation Architecture

The full report scope spans multiple orthogonal segmentation dimensions, with cross-tabulated demand data provided for each dimension pair. Coverage extends further to regional breakdowns, trend trajectories, and the competitive detail needed to support segment-level decision-making.

By Primary Market Dimension

  • Dominant Platform-Owned Storefronts
  • Third-Party Alternative Storefronts
  • Manufacturer-Branded Device Storefronts
  • Gaming-Specific Storefronts
  • Enterprise Application Distribution Platforms
  • Regional and Carrier-Affiliated Storefronts

By End-Use Industry

  • Gaming and Entertainment
  • Productivity and Business Apps
  • Social Media and Communication
  • Enterprise Mobile Applications
  • Consumer Utility Apps

By Commercial Dimension

  • Standard Commission Collection
  • Developer Tooling Subscriptions
  • Enterprise Distribution Contracts
  • Discovery Advertising Placement

By Region

  • North America
  • Western Europe
  • East Asia
  • South Asia and Pacific
  • Latin America
  • Middle East and Africa
  • Eastern Europe

Scope, Methodology, and Coverage

Every figure in this report is reproducible from documented input assumptions. The scope below maps the historical period, the forecast horizon, the segmentation dimensions, and the countries covered, alongside the underlying primary and qualitative methodology.
Historical Period
2020 to 2025
Forecast Period
2026 to 2036
Base Year
2025 (USD billions; MMA Primary Research Dataset, September 2026)
Market Definition
This market covers digital storefronts and marketplace platforms that distribute mobile applications to consumers, including dominant platform-owned stores and alternative third-party storefronts. It excludes web-based application delivery, enterprise mobile device management software, and app development tools unrelated to consumer distribution and discovery.
Quantitative Units
USD billions, market share percentages, CAGR percentages
Segmentation Dimensions
Platform ownership type, end-use industry, commercial dimension, region
Regions Covered
North America, Western Europe, East Asia, South Asia and Pacific, Latin America, Middle East and Africa, Eastern Europe
Countries Covered
United States, United Kingdom, Germany, Japan, China, South Korea, India, Brazil, United Arab Emirates, and 30 additional countries across all seven global regions
Key Companies Profiled
Apple App Store, Google Play, Samsung Galaxy Store, Epic Games Store, AptoideMarket, and 15 additional storefronts
Quantitative Methodology
Primary survey, n=3,800 respondents, Q4 2025, six countries; demand-side model with trade association cross-validation
Qualitative Methodology
47 expert interviews, Q4 2025; applied to validate demand model assumptions, identify emerging dynamics, and assess competitive positioning
Report Format
PDF and XLSX data workbook (Word format preview document)
Publisher
Market Minds Advisory
Report Code
MMA-2026-TEC-163
Published
September 2026
Contact
sales@marketmindsadvisory.com | www.marketmindsadvisory.com

Purchase the full Mobile Application Store Market Report (2026 to 2036).

This report examines the Mobile Application Store Market across its full 2026 to 2036 forecast horizon, covering market sizing, segmentation, competitive dynamics, and regional demand patterns in depth. It draws on primary survey data from 3,800 respondents and 47 expert interviews conducted in the fourth quarter of 2025. The analysis profiles twenty leading storefronts and quantifies revenue levers, compliance cost exposure, and portfolio economics across the category's major segments. Strategic recommendations address compliance investment, discovery strategy, and enterprise diversification priorities for platform operators and investors.
Full 2026-2036 market sizing and forecast data
Seven-region demand and growth rate breakdown
Twenty-company competitive profiles and moat analysis
Segment-level CAGR and market share detail
Revenue lever and compliance cost exposure analysis
Anonymised client case study with strategy recommendations

Built For The People Who Decide

From boardroom strategy to bench-side execution, this report is read cover-to-cover by leaders shaping the next decade of their industry, turning demand scenarios, market dynamics and valuation benchmarks into decisions.
CXOs/ Presidents/ VPs/ Managers
M&A and Corporate Development
Strategy Teams and R&D Heads
Procurement and Product Directors
Regulatory and Compliance Leaders
Investor Relations and Equity Analysts