Market Minds Advisory
Mobile Analytics Market

Mobile Analytics Market: Mobile Analytics Market: Measurement Classes, Consent Economics and Modelled Attribution 2026 to 2036

This industry was built on a device identifier that platform owners then made optional. Around a quarter of users now say yes, and everything else has to be modelled from what remains.

Lead Analyst

Published

September 2026

Make Smarter Decisions with Customized Research Insights

Request a free sample report and evaluate market opportunities, growth trends, and competitive dynamics relevant to your business needs.

2025 MARKET VALUE$4.1BMarket Size 2025
2036 FORECAST VALUE$12.7BBase Case , 2026 to 2036
CAGR 2026 TO 203610.8 %Bull 12.1% / Bear 9.5%
INCREMENTAL OPPORTUNITY$8.1BNet 10- year value creation
EXPANSION MULTIPLE2.79x2036 value over 2026 base
Strategic Levers
M&A Pipeline
Regional Outlook
Country Rankings
Competitive Intelligence
Segmental Deep-dive
Call-Us : 91 93563 13602

Executive Snapshot and Market Trajectory.

The foundation of this industry was removed and it is still rebuilding on top of the gap. Attribution depended on a persistent device identifier, platform owners made that identifier optional, and consent settled near 25%. Deterministic measurement stopped working for three quarters of users overnight.
The market reaches USD 4.54 billion in 2026 and USD 12.66 billion by 2036, a 2.79 times expansion at 10.8%. Privacy-preserving aggregate measurement grows at 16.2%, half again the market rate of 10.8%, while classic attribution compounds at 3.6% on identifiers that mostly no longer exist. East Asia holds 32% of subscription revenue on mobile game monetisation depth, and Indonesia grows fastest at 18.4% in a genuinely mobile-only market where nothing else exists.
Five vendors hold 39% of subscription revenue, unusually fragmented because attribution, product analytics and performance monitoring grew up as separate categories with separate buyers. AppsFlyer and AppLovin lead the attribution category between them. Amplitude and Contentsquare hold product and experience analytics. Datadog reached the same applications from infrastructure monitoring. Consolidation has been predicted repeatedly across this category for years and has still not really happened anywhere at all.
Market Definition
This report covers software that measures and analyses mobile application usage and marketing outcomes: attribution and install measurement, product behaviour and funnel analytics, application performance and crash monitoring, session replay and interaction recording, monetisation and in-app revenue analytics, and privacy-preserving aggregate measurement. It excludes advertising networks and demand side platforms, web-only analytics, customer data platforms, marketing automation and messaging tools, and app store optimisation services.
Base Year Value
$4.1B in 2025 (MMA Primary Research Dataset, September 2026)
Forecast Period
2026 to 2036, eleven discrete annual values
CAGR
10.8% base case. Bull 12.1%. Bear 9.5%.
Fastest Growth Segment
Privacy-Preserving Aggregate Measurement: 16.2% CAGR
Fastest Growth Country
Indonesia: 18.4% CAGR
Fastest Growth Region
South Asia and Pacific: 13.0% CAGR
Largest Region
East Asia: 32% of 2025 global value
Market Leaders
AppsFlyer, Amplitude, AppLovin, Datadog and Contentsquare lead on mobile analytics software subscription revenue. Source: MMA Analysis.
Primary Survey
n=3,800 procurement and R&D decision-makers, Q4 2025, six countries
Methodology
Demand-side build-up, cross-validated against public data, 47 expert interviews

Mobile Analytics Market Forecast Scenarios

mobile-analytics-market-size-forecast-scenario-1789990655090
Between 2020 and 2025 the category compounded at 9.6%, and that number hides a clean break in the middle of it. Attribution had been the whole business and it depended entirely on a device identifier that Apple made opt-in during 2021. Consent settled around 25%, deterministic measurement collapsed for most users, and vendors spent three years rebuilding products on modelling rather than observation.
The base case holds 10.8% on three mechanisms. Privacy-preserving measurement approaches keep maturing across both major platforms, and publishers who paused spending during the disruption are returning to measured acquisition. Application performance monitoring grows steadily because it was never affected by identifier changes at all. And app economies across South Asia, Southeast Asia and Latin America keep expanding on populations for whom mobile is the only computing platform they have ever used.
The bull case at 12.1% assumes modelled attribution reaches accuracy that publishers genuinely trust, which would restore acquisition spending and the measurement budget attached to it. The bear case at 9.5% is further platform restriction: both operating system owners continue tightening measurement access, and each tightening removes capability that vendors have already spent heavily to rebuild once.

Measuring What You Cannot Observe

Attribution was this industry and it rested on one thing: a persistent identifier letting a vendor connect an advertisement to an install. Platform owners made that identifier require permission, users grant it around 25% of the time, and the deterministic measurement every pricing model assumed simply stopped working. Attribution now compounds at 3.6% while the approaches replacing it grow at four times that rate.
TOP FIVE CONCENTRATION39%Fragmented across attribution, product and performance analytics specialists
TRACKING CONSENT RATE25%Users permitting device identifier access when prompted directly today
SDK STARTUP COST38 millisecondsAdded application launch time per analytics kit installed
ANALYTICS KITS PER APPLICATION4Separate vendor software development kits in a typical application
MODELLED CONVERSION SHARE63%Attributed outcomes estimated rather than observed directly at present
ANNUAL CONTRACT VALUEUSD 46,000Median subscription across mid-market application publisher accounts everywhere
The gap turned into a business model rather than a crisis. When only a quarter of outcomes can be observed, around 63% of attributed conversions have to be modelled from aggregate signals, and modelling well requires data volume rather than better instrumentation. Vendors with enough aggregate observation to build credible models hold an advantage entirely unrelated to their software development kit. Scale in data replaced scale in identifiers.
Nobody talks about the weight problem and it decides more renewals than features do. Every vendor ships a development kit into the application, each adding around 38 milliseconds to launch and a share of binary size and battery draw. A typical application carries four of them. Engineering teams now audit that weight and remove vendors on milliseconds, which means footprint wins contracts that no demonstration ever would.
"Every vendor in this category will show you a dashboard. Ask what percentage of the conversions on it were actually observed rather than modelled, and watch the conversation change. Two thirds is the honest answer almost everywhere and almost nobody volunteers it."
Principal, Application Analytics and Measurement Practice · MMA Technology Practice · September 2026

Market Trends

Consent Collapse Rebuilt The Entire Product Category

Platform owners made the device identifier opt-in and consent settled around 25%, which removed deterministic measurement for three quarters of users in a single release cycle. Vendors whose products, pricing and sales arguments all assumed observation had to rebuild on modelling instead, and several spent three years doing it. Privacy-preserving aggregate measurement now compounds at 16.2% against 10.8% for the market, while classic attribution grows at 3.6%. The industry did not shrink at all. It moved, and the firms that moved slowly lost positions they had held for a decade.
Market Impact: Indonesia compounds at 18.4% annually

Software Development Kit Weight Decides Quiet Renewals

Every analytics vendor ships a development kit into the application, and each adds roughly 38 milliseconds to launch time alongside binary size and battery consumption. A typical application carries four of them, and engineering teams now audit that footprint as a performance discipline rather than a procurement question. Vendors get removed on milliseconds by people who never saw the dashboard and were never sold anything. Kit efficiency has quietly become a competitive attribute that appears in no marketing material and decides a meaningful share of renewals. Nothing in any marketing material mentions it.
Market Impact: Performance monitoring compounds at 13.7%

Market Opportunities and Growth Drivers

Mobile-Only Economies Keep Adding Application Publishers

Across Southeast Asia, South Asia and much of Africa mobile is not the preferred computing platform, it is the only one most people have ever used. That produces application publishers building for audiences with no desktop equivalent and no web fallback, which makes mobile measurement the entire analytics requirement rather than a channel within it. Indonesia compounds at 18.4%, ahead of any other country, on local super-applications and a payments layer that made in-application monetisation genuinely work. Publishers there buy analytics as core infrastructure rather than as marketing tooling. Local vendors keep winning that work.
Market Impact: Just 2 platform owners set rules

Performance Monitoring Was Never Touched By Privacy Changes

Crash reporting, launch time measurement and application performance monitoring observe the application rather than the person, so none of it depended on device identifiers and none of it broke when consent collapsed. That segment compounds at 13.7% on steady demand from engineering teams who buy it independently of any marketing budget. It also survives the software development kit audit more comfortably than marketing tools do, because the engineers running the audit are the ones who need the data. Different buyer, different budget, and considerably more stable. Stability of that kind is genuinely rare here.
Market Impact: About 63% of conversions modelled

Market Restraints and Challenges

Platform Owners Control What Anybody Can Measure

Both major operating system owners decide what measurement is available, and each has tightened access repeatedly with limited consultation and no negotiation. The root cause is that measurement runs through platform infrastructure the vendors do not own and cannot substitute, so a policy change removes capability regardless of contracts or engineering investment. Commercially this makes every product roadmap conditional on decisions taken elsewhere. Mitigation runs through modelling that assumes less platform data, first party measurement inside the publisher's own systems, and diversifying beyond attribution entirely. Roadmaps here are conditional on decisions taken elsewhere.
Market Impact: Consent settled near 25% of users

Modelled Results Are Hard To Trust And Harder To Audit

Around 63% of attributed conversions are now modelled rather than observed, and a publisher cannot verify a model the way it could verify a click. The root cause is that the underlying observation genuinely does not exist, so no amount of vendor transparency reconstructs it. Commercially this makes acquisition spending harder to justify internally, and several publishers reduced measured spend rather than defend numbers they could not audit. Mitigation runs through incrementality testing, holdout groups and methodology disclosure that very few vendors currently offer openly. Several publishers cut spend rather than defend it.
Market Impact: Each kit adds 38 milliseconds
3 additional market trends, 4 additional growth drivers, and 2 additional restraints and challenges are covered in the full report. Contact sales@marketmindsadvisory.com to access the complete intelligence.

Segment CAGR and Growth Architecture

Segmentation follows what the software measures, since the measurement type determines which buyer funds it, how exposed it is to platform policy and whether it survives a development kit audit. Six classes cover the market: privacy-preserving aggregate measurement, application performance monitoring, product behaviour analytics, session replay, monetisation analytics, and attribution. Publisher category is a separate dimension entirely.
mobile-analytics-market-market-share-analysis-1789990655653

Privacy-Preserving Aggregate Measurement

Privacy-preserving aggregate measurement grows at 16.2%, half again the market rate of 10.8%, and it exists because the alternative stopped working. Device identifier consent settled around 25%, which means roughly 63% of attributed conversions have to be estimated from aggregate signals rather than observed against individuals. Doing that credibly requires observation volume rather than better instrumentation, so vendors with large aggregate data positions hold an advantage that has nothing to do with software quality. The uncomfortable commercial feature is that publishers cannot audit a model the way they audited a click, and several reduced measured acquisition spending rather than defend numbers they could not verify. Verification simply is not available.
CAGR 16.2%

Application Performance And Crash Monitoring

Application performance and crash monitoring compounds at 13.7% and it never broke, because it observes the application rather than the person and depended on no device identifier whatsoever. Engineering teams buy it from engineering budgets independently of anything marketing does, which makes the demand considerably more stable than attribution ever was. It also survives the development kit audit more comfortably than marketing tools do, since the engineers conducting the audit are the people who need the data it produces. The segment grew quietly through a disruption that consumed most of the industry's attention and several of its incumbents. Engineers audit it and engineers need it, which is a considerably more comfortable position than marketing tools occupy.
CAGR 13.7%
Full segment breakdown across 6 segments available in the complete report.

Regional Architecture and Country Demand Map

East Asia leads at 32% of subscription revenue, above the standard band, because mobile game monetisation per user is the highest anywhere and games are by some distance the heaviest buyers of analytics. North America follows at 27% on enterprise application publishing and product analytics spend.

East Asia

East Asia holds 32% of subscription revenue, above the 30% band ceiling, because mobile games monetise better here than anywhere and games spend more on measurement than any other application category. Japanese and Korean publishers generate the highest revenue per player globally, which makes a percentage point of retention worth funding serious analytics to find. Chinese publishers operate through domestic application stores with their own measurement infrastructure, largely outside the international vendor market. Growth at 11.8% sits above the global rate on continued game revenue and rising product analytics adoption. Monetisation depth rather than user count explains this position entirely. Domestic Chinese measurement infrastructure sits largely outside the international vendor market.
Share: 32% | CAGR: 11.8% (2026 to 2036)

North America

North America takes 27% of subscription revenue, weighted toward product analytics and performance monitoring rather than toward attribution. Enterprise application publishers here buy analytics as product infrastructure with dedicated teams operating it, which supports higher contract values than a median around USD 46,000 suggests. Amplitude and Datadog operate from here alongside most of the venture capital funding the category. Apple's measurement policy decisions originate here and affect publishers worldwide, which is an unusual concentration of influence. Growth at 10.0% sits below the global rate on a market where adoption is already deep among serious publishers. Contract values here run well above the global median, and platform policy decisions originate here too. Influence exceeds share.
Share: 27% | CAGR: 10.0% (2026 to 2036)
Regional intelligence for 5 additional markets available in the complete report: Western Europe, South Asia and Pacific, Latin America, Middle East and Africa, Eastern Europe. Contact sales@marketmindsadvisory.com.
mobile-analytics-market-country-cagr-analysis-1789990656181

How This Category Rebuilds Value

Platform owners removed the measurement that this whole industry was built on, two thirds of reported outcomes are now modelled rather than observed, and engineering teams remove vendors on milliseconds without anybody in procurement ever noticing. Each of the four levers below responds to one of those realities rather than to any dashboard argument.

Publish The Modelling Methodology Openly Instead

Around 63% of attributed conversions are modelled rather than observed, and a publisher cannot audit a model the way it audited a click. Several have reduced measured acquisition spending rather than defend numbers internally that they could not verify. Vendors treating methodology as proprietary are asking for trust they have given no basis for, while those publishing method, confidence intervals and holdout validation give a marketing director something defensible to take to a finance meeting. Transparency is uncomfortable and it is currently the scarcest asset in this category. Nobody else in the category is doing it.
Market Impact: Publishers cannot audit the whole 63% modelled result

Compete On Kit Weight, Not On Features

Each analytics development kit adds roughly 38 milliseconds to application launch alongside binary size and battery draw, and a typical application carries four of them. Engineering teams audit that footprint as a performance discipline and remove vendors without any procurement conversation happening at all. Publishing measured launch impact and binary contribution addresses the person who actually decides renewal, who never attended a demonstration and was never sold anything. Efficiency appears in no marketing material and quietly decides a meaningful share of contracts every year. Renewals turn on it more than on anything else.
Market Impact: Four kits cost 38 milliseconds each at launch

Sell Into Engineering Rather Than Marketing Budgets

Application performance and crash monitoring compounds at 13.7% and never broke during the identifier disruption, because it observes the application rather than the person. Engineering teams fund it independently of marketing, which makes the revenue considerably more stable than attribution ever was and less exposed to platform policy. It also survives development kit audits comfortably, since the engineers auditing are the people who need the data. Attribution specialists reaching only marketing buyers are exposed to a budget that shrinks whenever measurement confidence does. Marketing budgets shrink whenever confidence does. Confidence and budget move together here.
Market Impact: Performance monitoring compounds at 13.7% very steadily indeed

Follow Publishers Into Mobile-Only Markets Directly

Across Southeast Asia, South Asia and much of Africa, mobile is the only computing platform most users have ever had, which makes mobile measurement the whole analytics requirement rather than one channel within a broader stack. Indonesia compounds at 18.4% on local super-applications and payments infrastructure that made in-application monetisation genuinely work. Those publishers buy analytics as core infrastructure rather than marketing tooling, and Western products handle their application architectures awkwardly enough that local vendors keep winning. Those publishers treat analytics as core infrastructure rather than as marketing tooling, and they buy accordingly with considerably less price sensitivity.
Market Impact: Indonesia compounds at 18.4% on mobile-only demand alone

Who Controls the Margin Pool

Five vendors hold 39% of mobile analytics subscription revenue, unusually fragmented because attribution, product analytics and performance monitoring grew up as separate categories serving separate buyers. AppsFlyer and AppLovin lead attribution. Amplitude and Contentsquare hold product and experience analytics. Datadog reached the same applications from infrastructure monitoring entirely. All participants are assessed on mobile analytics software subscription revenue.
Competition runs on data scale rather than on software capability, which reversed when identifiers disappeared. Modelling around 63% of conversions credibly requires aggregate observation volume that a smaller vendor genuinely cannot assemble, so the largest attribution platforms improved their relative position during a disruption that was supposed to level the field. Scale in data replaced scale in identifiers as the durable advantage, which very few people predicted at the time.

Rankings shift on platform policy rather than on anything vendors control, since both operating system owners keep tightening measurement access without consultation. The second pressure is consolidation across the three sub-categories: publishers running four kits want fewer, and whichever vendor covers attribution, product and performance credibly reduces both subscription cost and application launch time at the same time, which is an unusually easy argument to make.
mobile-analytics-market-company-positioning-matrix-1789990656708

Competitive Moat and Risk Dimensions

APPSFLYER

Moat: Aggregate Measurement Data Scale

AppsFlyer observes install and engagement activity across a very large share of the application economy, which is exactly what modelling requires now that most conversions cannot be observed individually at all. Model quality follows data volume rather than algorithmic sophistication here, so the advantage compounds with every publisher added. Smaller vendors face the identical problem with less to model from.
APPSFLYER

Risk: Platform Policy Dependency

The product depends on measurement infrastructure that two operating system owners control absolutely and have already restricted repeatedly without consultation. Each tightening removes capability the vendor has already spent heavily to rebuild once. No commercial arrangement or engineering investment addresses a policy decision taken by a platform owner with no obligation to consult anybody.
DATADOG

Moat: Engineering Budget Position

Datadog reaches mobile analytics from infrastructure and application monitoring, which places it inside engineering budgets that never depended on device identifiers and never suffered when consent collapsed. That buyer funds monitoring as operational necessity rather than as marketing measurement. The breadth across backend, frontend and mobile is difficult to assemble from a mobile-only starting position.
DATADOG

Risk: Limited Marketing Measurement Depth

Attribution and monetisation analytics involve advertising network integrations, fraud detection and modelling capability built over a decade by specialists focused on nothing else. Reaching those buyers means competing on ground where infrastructure monitoring provides no advantage. The engineering position is genuinely strong and it does not extend into the marketing budget at all.

Players Tracked

Prominent Players

AppsFlyer
Amplitude
AppLovin
Datadog
Contentsquare

Other Key Players

Mixpanel
Heap
Sensor Tower
Braze
CleverTap
MoEngage
Singular
Kochava
Branch Metrics
Google
New Relic
Dynatrace
Sentry
Quantum Metric
FullStory

Recent Developments

FEBRUARY 2025

AppsFlyer Extends Aggregate Modelling Across Additional Platform Signals

AppsFlyer extended its aggregate measurement modelling to incorporate additional privacy-preserving platform signals, an organic product development rather than an acquisition or joint venture. With consent near 25% and roughly 63% of conversions modelled rather than observed, model quality has become the product rather than the instrumentation underneath it.
Signal: Data volume rather than software capability now decides who models the missing conversions credibly enough today.
AUGUST 2024

Amplitude Reduces Software Development Kit Footprint For Mobile

Amplitude reduced the binary size and launch time impact of its mobile development kit, an organic engineering effort rather than any transaction. Applications typically carry four analytics kits, each adding around 38 milliseconds to startup, and engineering teams increasingly remove vendors on that basis alone.
Signal: Vendors are being removed by engineers who never attended a demonstration and were never sold anything.
MAY 2025

CleverTap Expands Measurement Products For Southeast Asian Publishers

CleverTap expanded measurement and engagement products aimed at Southeast Asian application publishers, an organic expansion rather than a partnership or merger. Mobile-only markets produce super-application architectures that Western measurement products handle awkwardly, which is why regional vendors keep winning work international competitors expected to take.
Signal: Local application architecture beats global product breadth in markets where mobile is the only platform available.

What Analytics Delivery Costs

Cloud infrastructure accounts for roughly 34% of platform cost, driven by event ingestion volume that scales with user activity rather than with subscription revenue. Engineering salaries carry around 38%, weighted toward data engineering and the modelling specialists this category needed only recently. Customer success and integration support absorb about 14%, and the balance covers platform compliance and security certification work.
Cloud pricing rose across major providers through 2023 and 2024, which affects event-driven analytics more than most software categories because ingestion volume is not correlated with what a customer pays. Datadog Annual Report 2024 and Amplitude Annual Report 2024 both record infrastructure cost as a principal operating variable alongside engineering compensation. Vendors on flat-rate subscriptions absorbed volume growth directly, since a contract priced on seats does not reprice when a publisher's audience doubles.

The competitive disadvantage mechanism is pricing structure rather than any infrastructure inefficiency. A vendor charging per seat or per application carries unlimited event volume risk, while one charging per event passes it through and loses deals on predictability instead. Exposure concentrates among vendors serving high-volume consumer applications on flat pricing, which describes a great deal of the attribution market and rather less of the product analytics one.
mobile-analytics-market-cost-volatility-analysis-1789990656904

Price Against Event Volume Rather Than Seats

Cloud infrastructure runs around 34% of platform cost and scales with events ingested, while seat-based subscriptions do not scale with anything the vendor pays for. A publisher whose audience doubles costs twice as much to serve at identical revenue. Volume-linked pricing with committed tiers aligns the two without the unpredictability that pure consumption pricing creates for a customer's budget.

Sample Aggressively Above Statistical Sufficiency

Event ingestion is the largest infrastructure cost and most analytics questions reach statistical sufficiency well below full capture, particularly for very high volume consumer applications. Intelligent sampling that preserves rare events and reduces routine ones cuts ingestion substantially with no analytical consequence. Vendors capture everything because it is simpler, and that simplicity costs them directly.

Consolidate Kit Engineering Across Every Product Line

Engineering runs about 38% of platform cost and vendors offering attribution, product analytics and performance monitoring frequently maintain separate development kits for each, which multiplies both cost and the launch time impact customers audit. One kit covering all products halves the footprint and the maintenance. Product organisations resist this because the teams were built separately and nobody owns the consolidation.

Portfolio Architecture for Margin Defence

Margin architecture separates on exposure to platform policy and to event volume. Attribution and monetisation analytics earn least now, since both depend on measurement the platform owners restrict and both serve high-volume consumer applications on pricing that rarely tracks cost. Session replay sits in the middle on storage intensity. Privacy-preserving measurement, product analytics and performance monitoring earn most, each for entirely different reasons.
The volume versus premium tension is about which budget a vendor sits in. Marketing budgets fund attribution and shrink whenever measurement confidence does, which it has repeatedly. Engineering budgets fund performance monitoring and product analytics as operational necessity that survives every marketing review. Vendors built entirely around marketing buyers discovered during the identifier disruption exactly how conditional that funding was.

High-value pools concentrate in modelled measurement and in engineering-funded monitoring, and neither is reached by better dashboards. Modelled measurement requires aggregate data volume a smaller vendor cannot assemble at any price. Engineering-funded monitoring requires credibility with a buyer who audits kit weight and reads source code. Both are positions rather than products, which is why the margin has settled where it has.

Volume / Commodity-Adjacent

Attribution and monetisation analytics serving high-volume consumer applications, exposed to platform policy and to event costs that flat pricing does not recover. The eight point spread separates vendors with volume-linked pricing from those still charging per seat against unlimited ingestion.
Gross Margin: 58% to 66%

Premium / Certified

Session replay and product behaviour analytics sold to product teams on insight rather than on measurement completeness. The ten point spread tracks storage and sampling discipline, since replay is unusually infrastructure intensive and vendors vary considerably in how aggressively they manage retention.
Gross Margin: 68% to 78%

Sustainability / Regulatory / Next-Generation

Privacy-preserving aggregate measurement and application performance monitoring, one earning on data scale nobody can replicate and the other on engineering budgets that never depended on identifiers. The eight point spread reflects modelling depth and development kit efficiency across the customer base.
Gross Margin: 80% to 88%
mobile-analytics-market-portfolio-architecture-1789990657408

High-value Sub-segments and Strategic Watch-out

Privacy-Preserving Aggregate Measurement

Grows at 16.2% because consent near 25% left roughly 63% of conversions to be modelled from aggregate signals instead. The eight point spread reflects data scale. Publishers cannot audit a model the way they audited a click, which remains genuinely uncomfortable. Nobody has solved that.
Gross Margin: 80% to 88%

Application Performance And Crash Monitoring

Grows at 13.7% because it observes the application rather than the person and never depended on any device identifier at all. The eight point spread reflects kit efficiency. Engineering budgets fund it, which makes the revenue considerably more stable than attribution. Different buyer entirely, different budget.
Gross Margin: 80% to 88%

Product Behaviour And Funnel Analytics

Grows at 12.4% on product teams measuring what users do inside an application rather than how they arrived at it. The ten point spread reflects sampling discipline. First party data inside the publisher's own systems sits outside platform policy entirely. Platform policy does not reach it.
Gross Margin: 68% to 78%

Attribution And Install Measurement

Grows at 3.6%, slowest of the six classes, on identifiers that platform owners made optional and users decline three quarters of the time. The eight point spread reflects pricing structure. This category was the entire industry a decade ago, which is worth remembering. The identifiers are simply gone.
Gross Margin: 58% to 66%

Why These Subscriptions Persist

The annuity is historical continuity rather than the contract. An analytics platform holding several years of event history against a publisher's own definitions and funnels cannot be replaced without losing comparability, and product teams measure everything against prior periods. Switching means running both in parallel for a year and reconciling differences nobody can explain. That cost is analytical rather than commercial, which makes it durable.
Depth varies by how embedded the measurement is in decision making. A product organisation running experiments against platform-defined metrics is effectively permanent, since the experiment history lives there. Performance monitoring wired into on-call alerting is nearly as embedded. Attribution is the shallowest despite once being the whole industry, because modelled numbers from one vendor are no more auditable than modelled numbers from another and publishers switch on price.

The buyer fragmented into three and most vendors still address only one. A marketing director funds attribution and cuts it when confidence falls. A product manager funds behaviour analytics and defends it hard. An engineering lead funds performance monitoring and audits kit weight ruthlessly. Vendors organised around one buyer are exposed to that budget alone, and one has proved far less reliable.
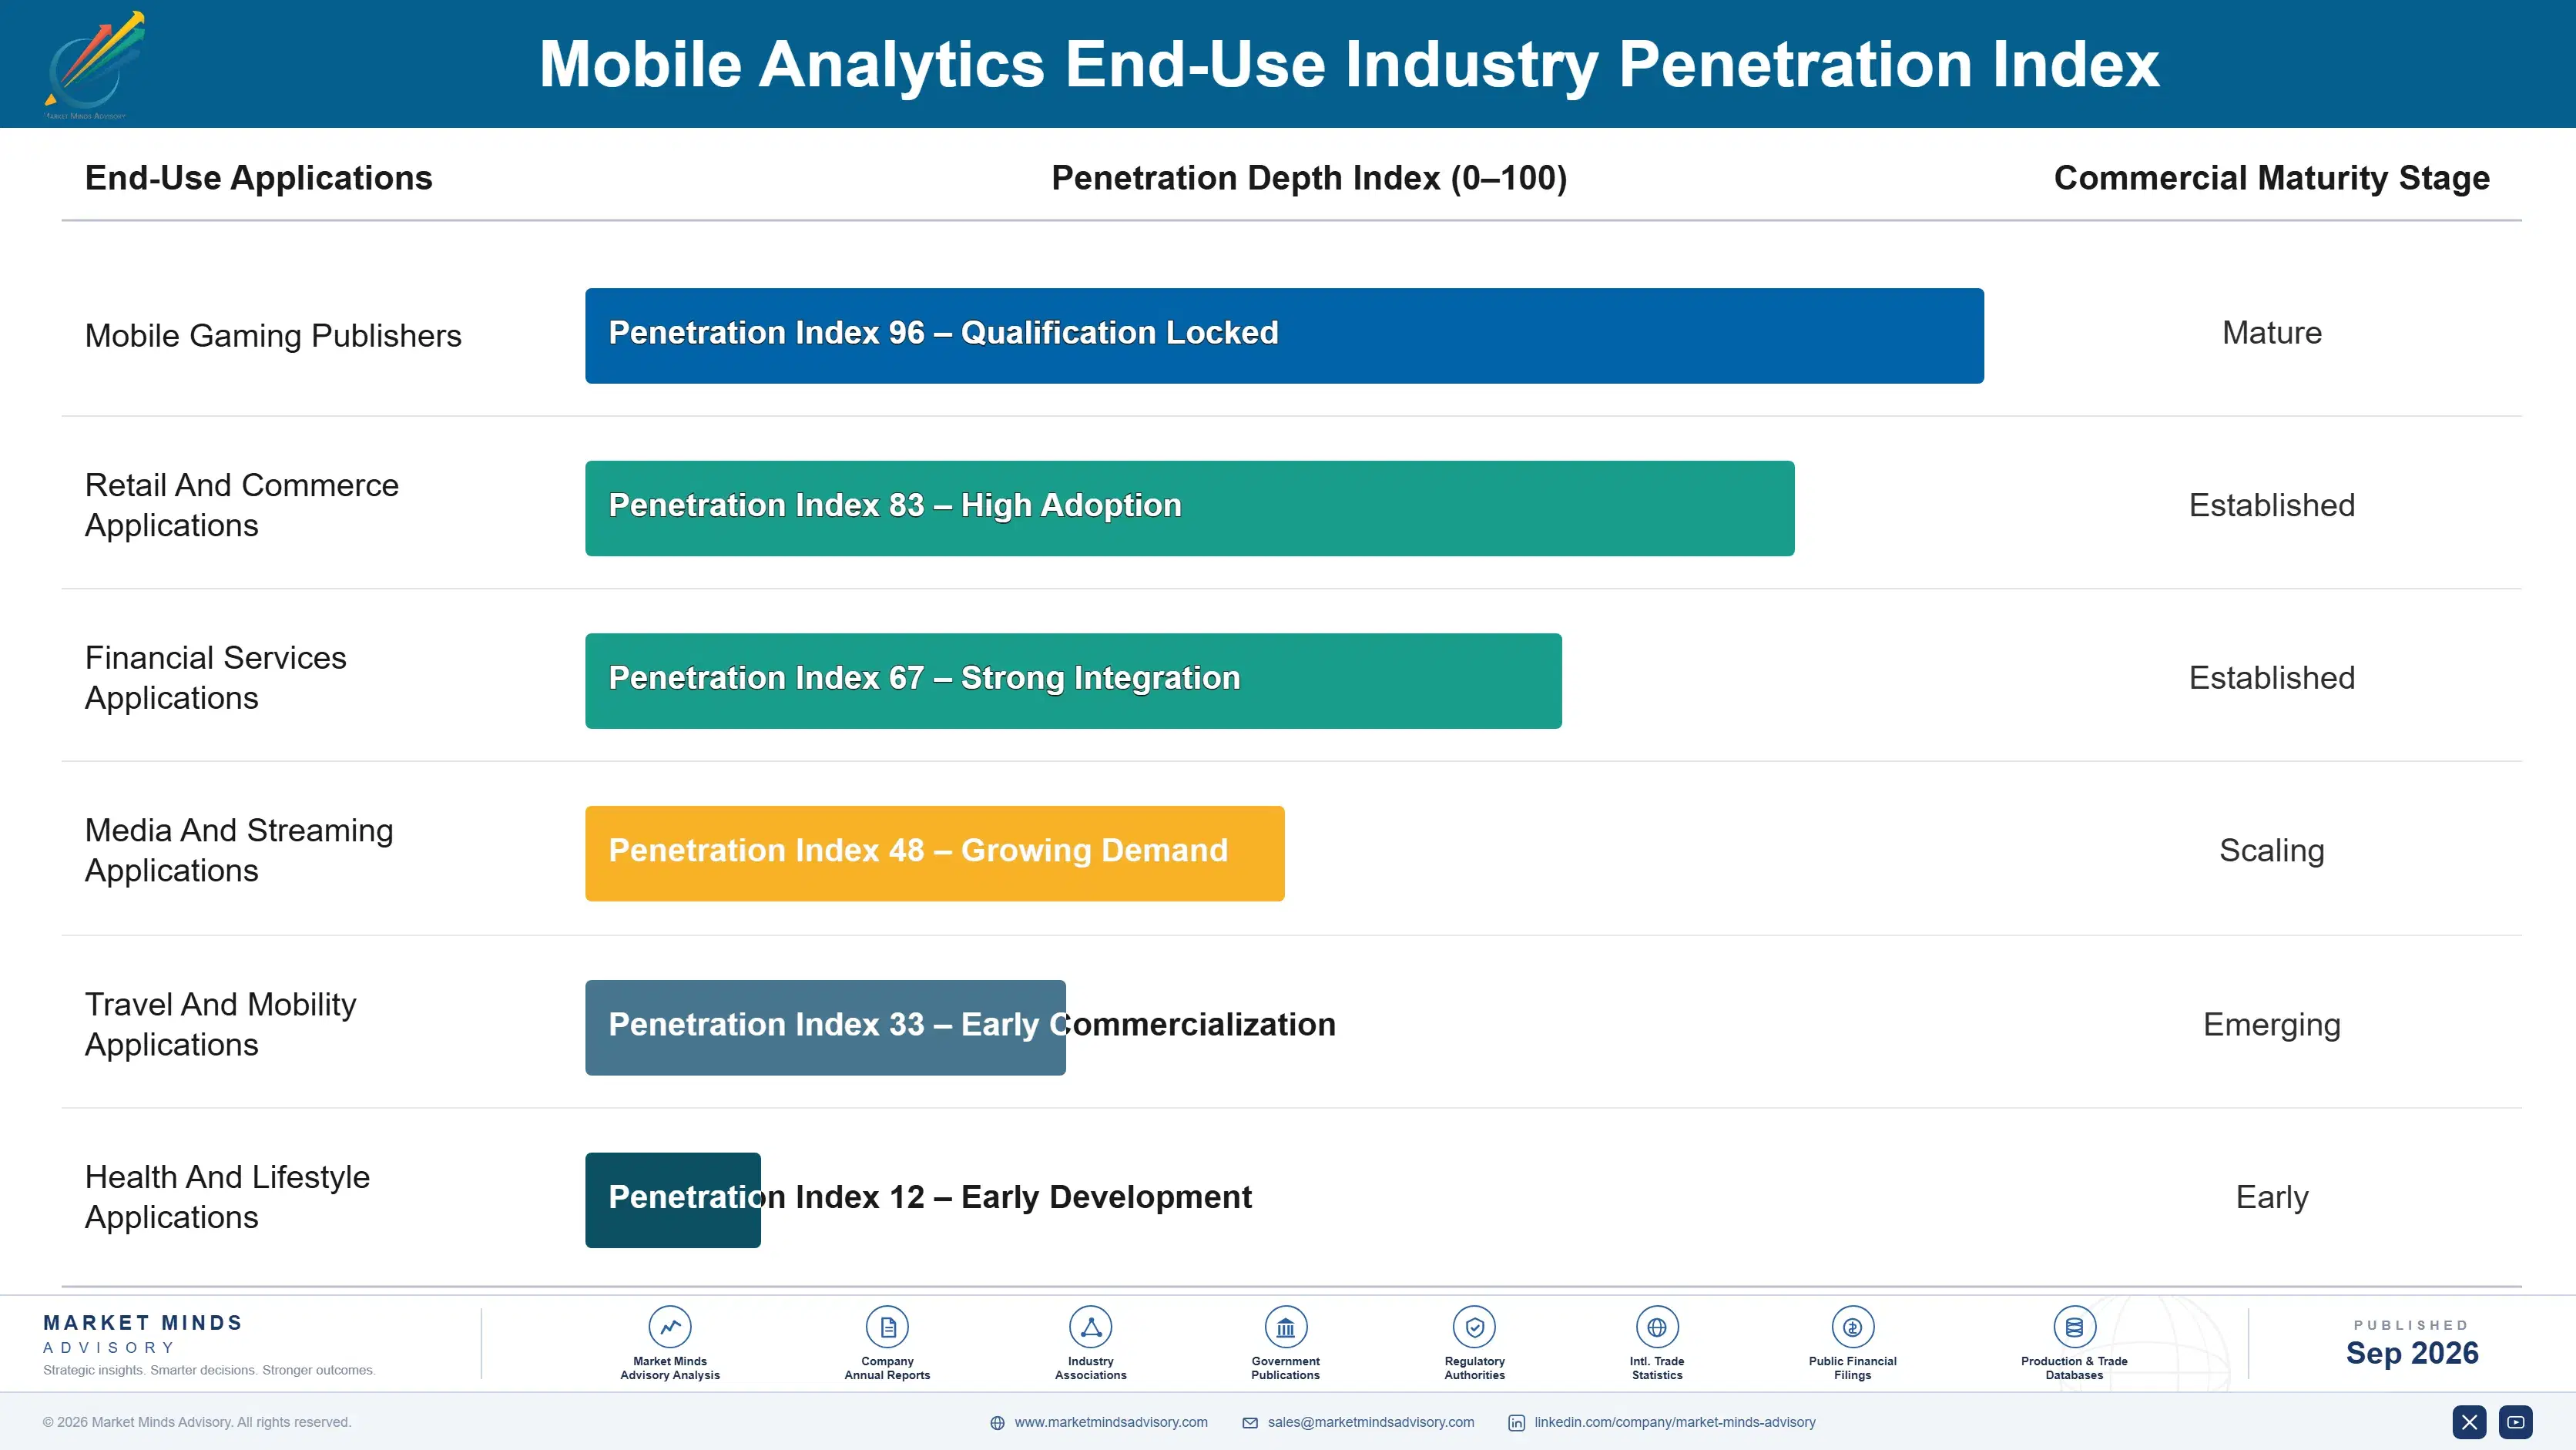
mobile-analytics-market-end-use-penetration-index-1789990657900

Where This Category Rebuilds

These are among the four positions where our research anticipates prominent divergence between winners and laggards over the coming forecast period. Each is grounded in the demand model, the regulatory perimeter, and the announced capacity pipeline.
01 / MODELLING TRANSPARENCY DISCIPLINE

Show The Method Or Lose The Budget

Around 63% of attributed conversions are now modelled rather than observed, and a publisher genuinely cannot audit a model the way it once audited a click through a device identifier. Several have simply reduced measured acquisition spending rather than defend numbers internally that nobody in the organisation could verify or explain. Vendors treating methodology as proprietary intellectual property are requesting trust they have provided no basis for, while those publishing method and holdout validation give a marketing director something defensible.
02 / KIT WEIGHT COMPETITION

Win The Milliseconds Nobody Discusses

Every analytics development kit adds roughly 38 milliseconds to application launch alongside binary size and battery consumption, and a typical application already carries four of them from different vendors. Engineering teams now audit that footprint as a performance discipline and remove vendors entirely without any procurement conversation taking place at all. Publishing measured launch impact and binary contribution addresses the person actually deciding renewal, who never attended a demonstration and was never sold anything at all by anybody in the vendor organisation.
03 / ENGINEERING BUDGET ACCESS

Sit In The Budget That Never Shrinks

Application performance and crash monitoring compounds at 13.7% and it never broke during the identifier disruption, because it observes the application rather than the person using it. Engineering teams fund it independently of marketing as operational necessity, which makes the revenue far more stable and considerably less exposed to platform policy decisions. Attribution specialists reaching only marketing buyers remain exposed to a budget that visibly shrinks whenever measurement confidence does, and it has already done exactly that on more than one occasion since 2021.
04 / MOBILE-ONLY MARKET COVERAGE

Serve Publishers With No Desktop At All

Across Southeast Asia, South Asia and much of Africa mobile is not the preferred computing platform but the only one most users have ever had, which makes mobile measurement the entire analytics requirement rather than one channel inside a broader stack. Indonesia compounds at 18.4% on local super-applications and payments infrastructure that finally made in-application monetisation work properly. Those publishers buy analytics as core infrastructure, and Western products handle their application architectures awkwardly enough that local vendors keep winning work international competitors expected to take easily.

Engagement Snapshot From the Field

A live engagement with an industry participant carrying material or product regulatory and market exposure ahead of a defining policy shift, showing how our research translates into a defensible multi-year portfolio strategy.
MARKET MINDS ADVISORY · CLIENT ENGAGEMENT SUMMARY
Mobile Analytics Producer Strategic Portfolio Review and Transition Roadmap 2026·Investment Scenario on Mobile Analytics Exposure Evaluation 2025-26
CLIENT PROFILE
A Southeast Asian application publisher operating four consumer applications with 31 million monthly active users, carrying six separate analytics development kits accumulated across five years of tooling decisions. Application launch time had degraded noticeably and acquisition measurement had been unreliable since device identifier consent collapsed. Nobody owned the measurement stack as a whole, and each kit had a different internal sponsor.
STRATEGIC CHALLENGE
Engineering wanted kits removed on launch time grounds and had measured the impact carefully. Marketing defended attribution tooling it no longer trusted but could not replace. Product defended behaviour analytics that was genuinely working well. Nobody had reconciled what each kit actually delivered against what it cost in performance, subscription and engineering maintenance combined.
MMA APPROACH
MMA measured the launch time and binary contribution of each kit directly, and mapped the analytical questions each answered against overlaps between them. We assessed attribution accuracy by running holdout tests against modelled results, and priced consolidation options across vendors. The work drew on 47 expert interviews conducted in Q4 2025 with vendors, publishers and measurement specialists across the region.
KEY FINDINGS
  1. Six analytics kits together added roughly 230 milliseconds to application launch, and 3 of them answered questions another kit already answered adequately.
  2. Holdout testing showed an attribution error of about 34% against the modelled conversions, considerably worse than the vendor's own stated confidence range.
  3. A launch time improvement of 200 milliseconds correlated with a measurable retention gain across all four of the applications (client-reported, unverified by MMA).
  4. Total cost of the measurement stack including engineering maintenance ran around 2 times the subscription figure that the finance team had been tracking.
CLIENT PROFILE
A Southeast Asian application publisher operating four consumer applications with 31 million monthly active users, carrying six separate analytics development kits accumulated across five years of tooling decisions. Application launch time had degraded noticeably and acquisition measurement had been unreliable since device identifier consent collapsed. Nobody owned the measurement stack as a whole, and each kit had a different internal sponsor.
STRATEGIC CHALLENGE
Engineering wanted kits removed on launch time grounds and had measured the impact carefully. Marketing defended attribution tooling it no longer trusted but could not replace. Product defended behaviour analytics that was genuinely working well. Nobody had reconciled what each kit actually delivered against what it cost in performance, subscription and engineering maintenance combined.
MMA APPROACH
MMA measured the launch time and binary contribution of each kit directly, and mapped the analytical questions each answered against overlaps between them. We assessed attribution accuracy by running holdout tests against modelled results, and priced consolidation options across vendors. The work drew on 47 expert interviews conducted in Q4 2025 with vendors, publishers and measurement specialists across the region.
KEY FINDINGS
  1. Six analytics kits together added roughly 230 milliseconds to application launch, and 3 of them answered questions another kit already answered adequately.
  2. Holdout testing showed an attribution error of about 34% against the modelled conversions, considerably worse than the vendor's own stated confidence range.
  3. A launch time improvement of 200 milliseconds correlated with a measurable retention gain across all four of the applications (client-reported, unverified by MMA).
  4. Total cost of the measurement stack including engineering maintenance ran around 2 times the subscription figure that the finance team had been tracking.
RECOMMENDED STRATEGY
Phase 1: Phase one: remove the three redundant kits immediately, since the questions they answer are already covered by tooling that stays. Phase 2: Phase two: require holdout validation from the attribution vendor quarterly, and treat the stated confidence range as unverified until it is demonstrated. Phase 3: Phase three: appoint a single owner for the measurement stack, with launch time and total cost reported together every quarter.
OUTCOME
The publisher removed three kits and recovered around 200 milliseconds of launch time (client-reported, unverified by MMA). Retention improved measurably across all four applications and total measurement cost fell substantially. Kit weight and total stack cost are now reported together to one owner, which is the change that outlasted the engagement itself.

Frequently Asked Questions

Foundational context covering the market sizes, CAGR, scope, country, region and competition that inform every finding below. This section is provided to cover basics and most often pre-purchase conversations, answered from the MMA Primary Research Dataset.

What is the current size of the Mobile Analytics Market?

Global value reaches USD 4.54 billion in 2026, measured as mobile analytics software subscription revenue across all six measurement classes. The 2025 base is USD 4.1 billion.

How large will the Mobile Analytics Market be by 2036?

Subscription revenue reaches USD 12.66 billion by 2036, an increase of USD 8.12 billion over the forecast period. That represents 2.79 times expansion from the 2026 base.

What is the CAGR for the Mobile Analytics Market 2026 to 2036?

The base case runs at 10.8% annually, with a bull case at 12.1% if modelled attribution reaches accuracy publishers trust and a bear case at 9.5% if platform owners restrict measurement further.

Which segment is growing fastest?

Privacy-preserving aggregate measurement grows at 16.2%, half again the market rate of 10.8%. Device identifier consent settled near 25%, so roughly 63% of attributed conversions must now be modelled rather than observed.

Who are the major companies in the Mobile Analytics Market?

AppsFlyer, Amplitude, AppLovin, Datadog and Contentsquare lead on subscription revenue, together holding 39%. Mixpanel, CleverTap and Branch Metrics hold smaller positions across the three sub-categories.

Which country is growing fastest?

Indonesia leads at 18.4%, because mobile is the only computing platform most users have ever had and local super-applications generate measurement requirements at genuine scale. India and Brazil follow.

Report Segmentation Architecture

The full report scope spans multiple orthogonal segmentation dimensions, with cross-tabulated demand data provided for each dimension pair. Coverage extends further to regional breakdowns, trend trajectories, and the competitive detail needed to support segment-level decision-making.

By Measurement Class

  • Privacy-Preserving Aggregate Measurement
  • Application Performance And Crash Monitoring
  • Product Behaviour And Funnel Analytics
  • Session Replay And Interaction Recording
  • Monetisation And In-App Revenue Analytics
  • Attribution And Install Measurement

By End-Use Industry

  • Mobile Gaming Publishers
  • Retail And Commerce Applications
  • Financial Services Applications
  • Media And Streaming Applications
  • Travel And Mobility Applications
  • Health And Lifestyle Applications

By Commercial Dimension

  • Direct Publisher Subscription
  • Enterprise Platform Agreements
  • Agency And Reseller Channel
  • Usage Based Consumption Pricing
  • Cloud Marketplace Distribution
  • Free Tier Conversion Funnel

By Region

  • North America
  • Western Europe
  • East Asia
  • South Asia and Pacific
  • Latin America
  • Middle East and Africa
  • Eastern Europe

Scope, Methodology, and Coverage

Every figure in this report is reproducible from documented input assumptions. The scope below maps the historical period, the forecast horizon, the segmentation dimensions, and the countries covered, alongside the underlying primary and qualitative methodology.
Historical Period
2020 to 2025
Forecast Period
2026 to 2036
Base Year
2025 (USD billions; MMA Primary Research Dataset, September 2026)
Market Definition
This report covers software that measures and analyses mobile application usage and marketing outcomes: attribution and install measurement, product behaviour and funnel analytics, application performance and crash monitoring, session replay and interaction recording, monetisation and in-app revenue analytics, and privacy-preserving aggregate measurement. It excludes advertising networks and demand side platforms, web-only analytics, customer data platforms, marketing automation and messaging tools, and app store optimisation services.
Quantitative Units
USD millions, software subscription revenue basis; monthly active users measured; consent rates as a percentage; development kit launch impact in milliseconds; annual contract value in USD.
Segmentation Dimensions
Measurement class; publisher industry; commercial distribution model; geography across seven regions.
Regions Covered
North America, Western Europe, East Asia, South Asia and Pacific, Latin America, Middle East and Africa, Eastern Europe
Countries Covered
China, Japan, South Korea, India, Indonesia, Vietnam, Australia, United States, Canada, Mexico, Brazil, United Kingdom, France, Germany, Sweden, Netherlands, Poland, Ukraine, Israel, United Arab Emirates.
Key Companies Profiled
AppsFlyer, Amplitude, AppLovin, Datadog, Contentsquare, Mixpanel, Heap, Sensor Tower, Braze, CleverTap, MoEngage, Singular, Branch Metrics, New Relic, Sentry.
Quantitative Methodology
Primary survey, n=3,800 respondents, Q4 2025, six countries; demand-side model with trade association cross-validation
Qualitative Methodology
47 expert interviews, Q4 2025; applied to validate demand model assumptions, identify emerging dynamics, and assess competitive positioning
Report Format
PDF and XLSX data workbook (Word format preview document)
Publisher
Market Minds Advisory
Report Code
MMA-2026-TEC-531
Published
September 2026
Contact
sales@marketmindsadvisory.com | www.marketmindsadvisory.com

Purchase the full Mobile Analytics Market Report (2026 to 2036).

This report sizes the global mobile analytics market from 2026 to 2036 across six measurement classes, six publisher industries and seven regions. It explains why device identifier consent near 25% left roughly 63% of conversions to be modelled rather than observed, how software development kit weight decides renewals that no demonstration influences, and why attribution now grows slowest in a category it once defined entirely. Cost composition is sourced to company annual reports, with event ingestion pricing analysed as the margin variable. Regional analysis explains why East Asia leads at 32% while Indonesia grows at 18.4%.
Six measurement classes sized through to 2036
Consent economics modelled across the whole category
Event ingestion cost composition from company annual filings
Twenty named vendors assessed on subscription revenue
Four revenue levers with quantified commercial impact
Anonymised publisher stack rationalisation engagement included in full

Built For The People Who Decide

From boardroom strategy to bench-side execution, this report is read cover-to-cover by leaders shaping the next decade of their industry, turning demand scenarios, market dynamics and valuation benchmarks into decisions.
CXOs/ Presidents/ VPs/ Managers
M&A and Corporate Development
Strategy Teams and R&D Heads
Procurement and Product Directors
Regulatory and Compliance Leaders
Investor Relations and Equity Analysts