Market Minds Advisory
Mining Remanufacturing Component Market

Mining Remanufacturing Component Market: Mining Remanufacturing Component Market. Fleet Cost Pressure Sustains Rebuild Demand Over New Parts

Rising new equipment costs and extended mine fleet life expectations are sustaining remanufactured component demand, as operators rebuild engines, transmissions, and hydraulic systems to cut capital spending without sacrificing reliability.

Lead Analyst

Published

October 2026

Make Smarter Decisions with Customized Research Insights

Request a free sample report and evaluate market opportunities, growth trends, and competitive dynamics relevant to your business needs.

2025 MARKET VALUE$3.1BMarket Size 2025
2036 FORECAST VALUE$5.6BBase Case , 2026 to 2036
CAGR 2026 TO 20365.5 %Bull 6.7% / Bear 4.3%
INCREMENTAL OPPORTUNITY$2.3BNet 10- year value creation
EXPANSION MULTIPLE1.71x2036 value over 2026 base
Strategic Levers
M&A Pipeline
Regional Outlook
Country Rankings
Competitive Intelligence
Segmental Deep-dive
Call-Us : 91 93563 13602

Executive Snapshot and Market Trajectory.

Mining remanufacturing component demand continues climbing as operators extend haul truck and excavator fleet life, favoring certified rebuilds over new component purchases that carry substantially higher capital cost under sustained commodity price pressure across major mining economies worldwide, from Australia to Latin America.
Remanufactured hydraulic and drivetrain systems are growing fastest within the category, expanding at nearly eight percent annually as operators seek certified rebuild quality for the components most critical to haul truck uptime and operator safety across shifts. East Asia and Latin America anchor volume given large mining equipment fleets operating in both regions, while Australia leads on certified rebuild adoption tied to mature mine maintenance contracting culture and strict safety compliance standards across its sites.
Competition splits between original equipment manufacturers offering certified rebuild programs and independent remanufacturing specialists competing mainly on turnaround time and price, a division shaping how mine operators source rebuilt components across diverse fleet compositions and geographies. Expanding fleet life extension programs and tightening equipment reliability requirements are pulling specifications toward certified rebuild standards, while proven failure rate data separates qualified remanufacturers from smaller competitors lacking a comparable, documented track record.
Market Definition
This report covers remanufactured engines, transmissions, hydraulic systems, and drivetrain components restored to original equipment specification for reuse in mining haul trucks, excavators, and drilling equipment. It excludes new component manufacturing, basic repair and maintenance services that do not involve full component rebuild, and remanufactured components sold for non-mining industrial applications.
Base Year Value
$3.1B in 2025 (MMA Primary Research Dataset, October 2026)
Forecast Period
2026 to 2036, eleven discrete annual values
CAGR
5.5% base case. Bull 6.7%. Bear 4.3%.
Fastest Growth Segment
Remanufactured Hydraulic and Drivetrain Systems: 7.6% CAGR
Fastest Growth Country
Australia: 6.9% CAGR
Fastest Growth Region
South Asia and Pacific: 7.3% CAGR
Largest Region
East Asia: 23% of 2025 global value
Market Leaders
Caterpillar Inc, Komatsu Ltd, Liebherr Mining, Finning International, Cummins Inc. Source: MMA Analysis based on company annual reports.
Primary Survey
n=3,800 procurement and R&D decision-makers, Q4 2025, six countries
Methodology
Demand-side build-up, cross-validated against public data, 47 expert interviews

Mining Remanufacturing Component Market Forecast Scenarios

mining-remanufacturing-component-market-size-forecast-scenario-1791020254101
Mining remanufacturing component demand grew steadily across 2020 to 2025 at roughly 4.4 percent annually, supported throughout by sustained commodity price pressure that pushed operators toward cost-effective fleet life extension regardless of broader economic conditions affecting other industrial equipment categories. Growth accelerated modestly toward the end of the period as certified rebuild programs gained wider acceptance across major mining fleet operators.
The base case assumes 5.5 percent annual growth through 2036, anchored on three concurrent mechanisms: continued capital discipline that favors component rebuild over new equipment purchases across major mining regions, expanding certified rebuild program adoption that improves reliability confidence relative to uncertified alternatives, and rising mining fleet utilization that increases component wear and rebuild frequency across haul truck and excavator populations. These mechanisms reinforce one another across most major mining economies, sustaining demand even where new equipment orders soften.
The bull case centers on accelerated commodity price weakness that would push operators toward substantially more aggressive cost reduction through component rebuild programs than currently budgeted. The bear case assumes a sustained commodity price rally that encourages operators to prioritize new equipment purchases over rebuild investment, extending replacement cycles for existing remanufacturing contracts beyond typical timelines.

Certified Rebuild Programs Redraw Procurement Priorities

The mining remanufacturing component market reaches an estimated 3.271 billion dollars in 2026, continuing steady growth driven by capital discipline and fleet life extension across most major mining economies. Large mining operators account for the large majority of unit demand, though independent contract miners represent a smaller but steadily growing buyer segment as equipment costs rise.
MARKET CONCENTRATION LEVEL43%Reflects fragmentation among established equipment manufacturers and specialists
AVERAGE COMPONENT COST$285,000Varies substantially between standard and certified premium rebuild configurations
LEADING SUPPLIER SHARE15%No single vendor dominates despite decades of fleet relationship building
CERTIFIED REBUILD PENETRATION36%Represents growing share of installed base shifting from uncertified alternatives
AVERAGE REBUILD TURNAROUND TIME45 daysExtends further for complex drivetrain systems requiring specialized engineering
FLEET LIFE EXTENSION RATE68 percentReflects share of operators actively pursuing component rebuild over replacement
Average component costs vary substantially across the category, from moderate pricing for basic hydraulic rebuilds to significantly higher pricing for certified drivetrain systems with extended warranty coverage, which fragments the market into distinct procurement tiers rather than one uniform price curve. East Asia and Latin America's mining fleet scale give these regions outsized influence over unit volume even though Australia commands higher average component value on certified premium rebuilds tied to stricter compliance expectations.
Looking ahead, remanufacturers are racing to expand certified rebuild capability and extended warranty coverage, since margins on basic rebuild services continue compressing under competitive mine operator tender pressure. The companies that control certification breadth and failure rate data transparency, not just basic rebuild manufacturing, are positioned to capture disproportionate value as fleet life extension programs intensify through the decade.
"A rebuilt engine used to be the budget option. Now it is the option with better data behind it than the new one."
Director, Mining Equipment and Fleet Lifecycle Practice · MMA Construction and Industrial Equipment Practice · October 2026

Market Trends

Certified Rebuild Programs Displace Uncertified Shop Rebuilds

Original equipment manufacturers and leading independent remanufacturers have expanded certified rebuild programs that guarantee original specification tolerances and extended warranty coverage, directly displacing uncertified local rebuild shops that previously served smaller contract mining operators. Caterpillar's Cat Reman program and Komatsu's Reman network now cover engines, transmissions, and hydraulic systems across more than forty component families, with documented failure rate data that mine operators increasingly require before awarding multi-year rebuild contracts. This shift raises entry barriers for smaller regional rebuilders lacking comparable testing infrastructure and extends average contract tenure for established certified providers across major mining basins.
Market Impact: Extends cycles by 2 years

Core Exchange Programs Shorten Equipment Downtime Windows

Mining operators are increasingly adopting core exchange arrangements, where a rebuilt component ships before the worn core is returned, cutting equipment downtime from several weeks to a few days on critical haul truck drivetrain repairs. Finning International and Liebherr Mining have both expanded regional exchange depots near major mine sites in Chile, Western Australia, and Indonesia to support this model, which requires pre-positioned rebuilt inventory rather than build-to-order fulfillment. Operators running high-utilization fleets now favor suppliers offering exchange programs over those requiring full teardown-and-rebuild cycles, reshaping procurement criteria beyond price alone toward logistics capability.
Market Impact: Saves 40 to 60 percent

Market Opportunities and Growth Drivers

Capital Discipline Favors Rebuild Over New Equipment Purchase

Sustained commodity price volatility has pushed mining companies toward capital discipline that favors extending existing fleet life through component rebuild rather than committing to new haul truck and excavator purchases that can exceed five million dollars per unit. BHP, Rio Tinto, and several mid-tier operators have publicly extended average haul truck replacement cycles by two to three years over the past five years, directing freed capital toward rebuild contracts instead. This dynamic has proven durable across both high and low price periods, reinforcing remanufacturing as a lasting feature of mine capital planning.
Market Impact: Extends lead times 4 weeks

Rising New Component Costs Widen Rebuild Cost Advantage

New engine and transmission component prices have risen faster than general industrial equipment inflation over the past three years, driven by steel, copper, and specialty alloy cost increases that flow directly into original equipment manufacturer pricing. A certified rebuild typically costs forty to sixty percent less than an equivalent new component while delivering comparable warranty coverage, a gap that has widened as new component list prices climbed roughly eighteen percent since 2022. This widening cost advantage is pulling additional budget-constrained mid-tier and contract mining operators toward rebuild programs that larger operators adopted years earlier.
Market Impact: Drove 15 percent supplier consolidation

Market Restraints and Challenges

Core Availability Constraints Limit Rebuild Capacity Growth

Remanufacturing output depends on a steady supply of worn cores returned from the field, and core availability has tightened as mine operators extend fleet life and delay retiring older equipment that would otherwise supply rebuild cores. The root cause traces to the same capital discipline driving rebuild demand: operators keep aging units running longer, reducing the pool of components available for teardown. This constrains rebuilder capacity utilization and extends lead times during peak demand periods, raising effective costs for operators needing fast turnaround. Leading remanufacturers are mitigating the squeeze through expanded core banking agreements and cross-fleet sourcing partnerships.
Market Impact: Covers 40+ component families

Rebuild Quality Variability Undermines Smaller Provider Trust

Inconsistent rebuild quality among smaller, uncertified regional shops has produced documented premature failure incidents that undermine mine operator confidence in remanufactured components generally, not just the specific provider involved. The root cause lies in uneven testing infrastructure and inspection rigor across the fragmented independent rebuild segment, where capital investment in diagnostic equipment lags that of certified program providers. The commercial impact shows up as operators consolidating rebuild spend toward fewer, larger certified suppliers, a trend some independents are countering by pursuing third-party quality certification and joining cooperative testing consortiums to rebuild buyer trust.
Market Impact: Cuts downtime to 3 days
3 additional market trends, 4 additional growth drivers, and 2 additional restraints and challenges are covered in the full report. Contact sales@marketmindsadvisory.com to access the complete intelligence.

Segment CAGR and Growth Architecture

Mining remanufacturing components segment by component type across six distinct categories spanning engines, transmissions, hydraulic and drivetrain systems, undercarriage systems, electrical and control components, and structural and chassis components, with each category following its own rebuild complexity, certification requirements, and wear characteristics observed across varied global mine site operating conditions and fleet duty cycles.
mining-remanufacturing-component-market-market-share-analysis-1791020254368

Remanufactured Hydraulic and Drivetrain Systems

Hydraulic and drivetrain systems are the fastest growing segment, expanding at 7.6 percent annually as mine operators prioritize certified rebuild quality for components most critical to haul truck uptime and operator safety. These systems carry the highest failure consequence severity among rebuildable components, since a drivetrain failure can halt a multi-million dollar haul truck for days and create safety exposure on active mine sites. Certified providers have invested heavily in dynamometer testing and pressure cycling validation specific to this segment, widening the quality gap against uncertified alternatives. Growth concentrates among operators running high-utilization fleets in Australia, Chile, and Indonesia, where extended duty cycles accelerate wear and shorten rebuild intervals relative to lower utilization fleets elsewhere.
CAGR 7.6%

Remanufactured Undercarriage Systems

Undercarriage systems form the second fastest growing segment at 6.8 percent annually, driven by the sheer wear intensity these components experience in direct ground contact across excavators and track-mounted drilling equipment. Rebuild economics are particularly favorable here because undercarriage wear is gradual and predictable, allowing operators to schedule rebuild cycles well ahead of failure rather than reacting to unplanned breakdowns on active sites. Component remanufacturers have expanded track chain and roller rebuild capacity specifically to serve surface mining operations where undercarriage wear rates run highest. Latin American and East Asian operators, running large excavator fleets across extended shift patterns, represent the largest and fastest growing buyer base for this segment specifically, ahead of other geographies.
CAGR 6.8%
Full segment breakdown across 6 segments available in the complete report.

Regional Architecture and Country Demand Map

Regional demand concentrates where large mining fleets operate at high utilization, placing East Asia and Latin America ahead on volume while Australia leads on certified rebuild adoption tied to mature contracting and safety compliance culture across its mine sites, well ahead of smaller mining economies.

North America

Canadian and United States mine operators sustain steady remanufacturing demand anchored by large oil sands and copper mining fleets, where certified rebuild programs from Caterpillar and Komatsu dealers hold strong penetration. Regional share sits below the standard band here because North America's mining fleet is smaller in absolute scale than East Asia's or Latin America's, not because adoption lags. Mine safety regulation under the Mine Safety and Health Administration pushes operators toward documented rebuild quality over cheaper uncertified alternatives, reinforcing demand for traceable component history. Replacement cycles here run longer than in faster growing regions, since much of the regional fleet already operates under mature long-term rebuild contracts signed years earlier, limiting near-term volume expansion.
Share: 18% | CAGR: 5.9% (2026 to 2036)

Western Europe

Western Europe's modest mining base, concentrated in Scandinavian iron ore and limited remaining coal operations, keeps regional share below the standard band, a deliberate outcome of the region's declining extractive footprint rather than weak rebuild adoption among the operators that remain active today. What volume exists skews toward highly certified, premium rebuild contracts given strict European environmental and safety compliance standards governing mine equipment across member states. LKAB's fleet renewal programs in northern Sweden represent a meaningful share of regional demand on their own, since few other large-scale mining operations remain active across the region to diversify the buyer base further. This positions the region as a stable, low-volume niche rather than a growth priority.
Share: 10% | CAGR: 3.8% (2026 to 2036)
Regional intelligence for 5 additional markets available in the complete report: East Asia, South Asia and Pacific, Latin America, Middle East and Africa, Eastern Europe. Contact sales@marketmindsadvisory.com.
mining-remanufacturing-component-market-country-cagr-analysis-1791020254638

Where Rebuild Margins Concentrate Through 2036

Revenue growth in mining remanufacturing concentrates around three commercial levers: certified program expansion, core exchange logistics, and extended warranty monetization, with each lever capturing a distinct share of value as operators shift procurement spend toward documented rebuild quality over price alone across most major mining fleet segments worldwide and across both large and small fleet sizes.

Certified Program Expansion Into New Component Families

Original equipment manufacturers and leading independents are extending certified rebuild coverage into component families previously served only by uncertified regional shops, including auxiliary hydraulics and smaller electrical control modules. Each new certified family typically commands a 15 to 25 percent price premium over uncertified equivalents, since operators value documented failure rate data and extended warranty coverage across every covered component. Caterpillar and Komatsu have both added more than ten new certified families over the past three years, a pace expected to continue as operator demand for traceable rebuild history extends further.
Market Impact: Adds 15 to 25 percent to component pricing

Core Exchange Network Densification Near Mine Clusters

Building regional exchange depots closer to major mine clusters cuts turnaround time from several weeks to a few days, allowing remanufacturers to charge a premium for guaranteed fast-turnaround service rather than competing purely on base rebuild price. Finning and Liebherr Mining have both reported double-digit revenue growth from exchange-based contracts in Chile and Western Australia specifically, where operators pay roughly 10 to 15 percent more for the reduced downtime exchange programs deliver reliably. Expanding this network into Indonesia and additional African copper basins represents the next phase of densification remanufacturers are pursuing.
Market Impact: Commands 10 to 15 percent in extra revenue

Who Controls the Margin Pool

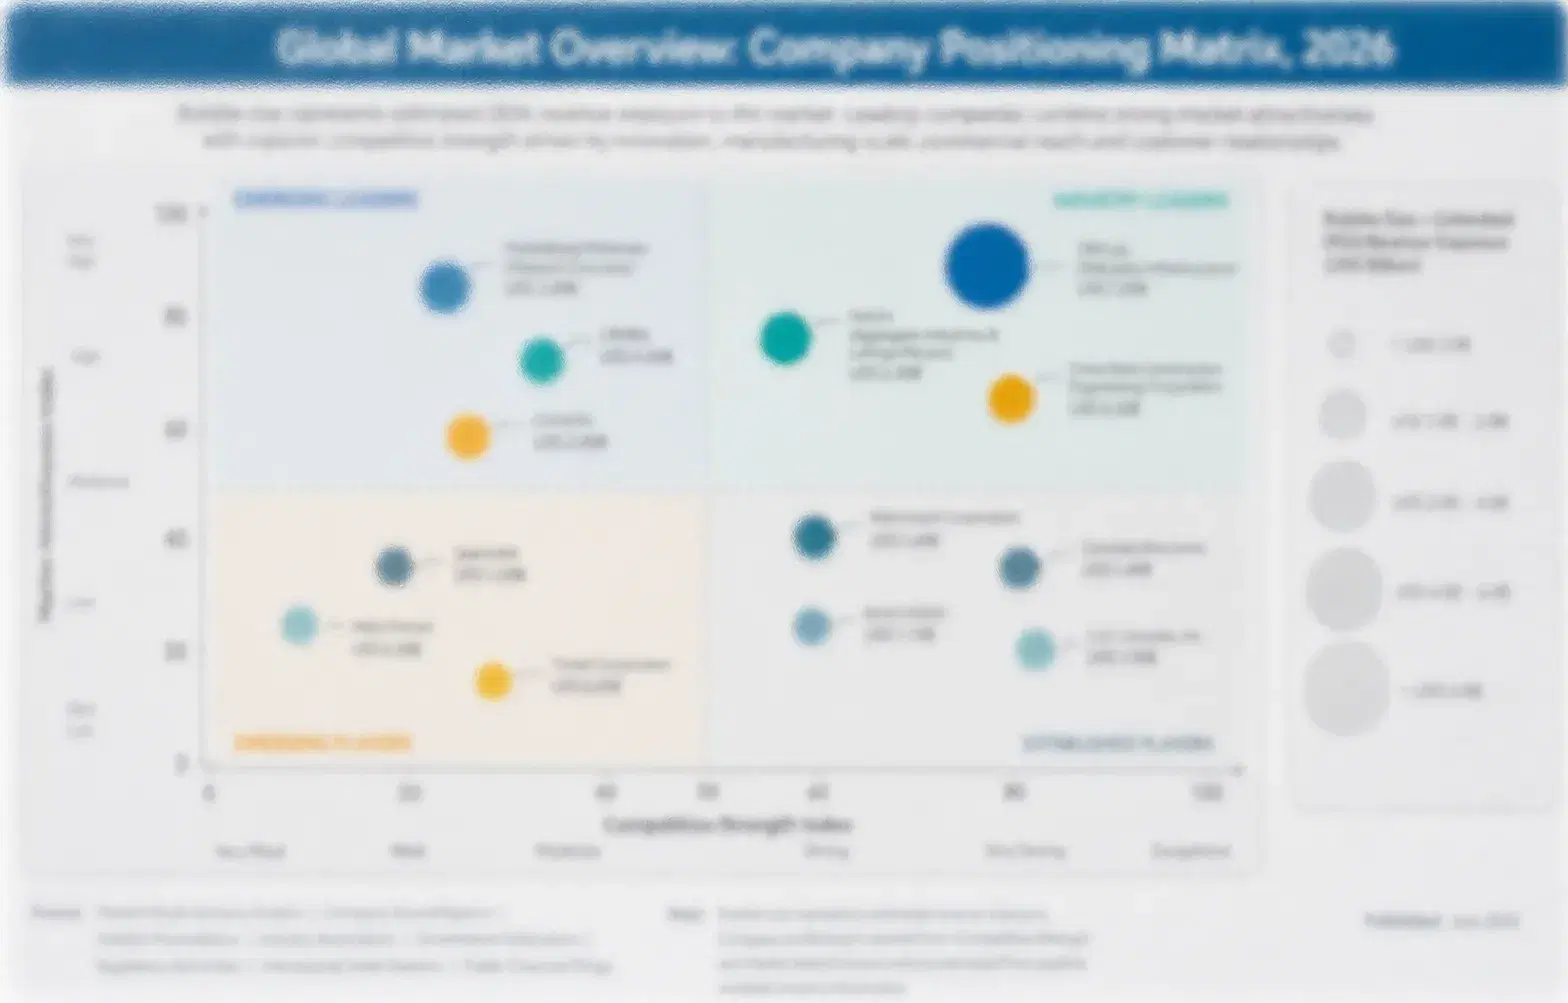
Mining remanufacturing shows moderate concentration, with the top five participants, assessed on production capacity across certified rebuild facilities, holding 43 percent combined share. Caterpillar and Komatsu lead through decades of original equipment relationships and dealer network reach, while the gap to the next tier of independent specialists remains wide given the capital investment required for comparable testing infrastructure.
Current competitive activity centers on certified program expansion into new component families, core exchange network densification near major mine clusters, and third-party quality certification pursuits among independent remanufacturers seeking to close the trust gap with dealer-backed programs. Several independents have formed testing consortiums to share dynamometer and diagnostic infrastructure costs, a response to rising capital requirements that smaller single-site rebuilders cannot absorb individually without losing price competitiveness against larger certified providers.

Emerging pressure comes from regional Chinese and Indian remanufacturers scaling domestic capacity to serve growing local mining fleets without reliance on imported rebuilt components or Western certification standards. These entrants compete primarily on price and logistics proximity rather than premium certification, and their growing scale could shift rankings meaningfully in East Asia and South Asia over the next decade.
mining-remanufacturing-component-market-company-positioning-matrix-1791020254949

Competitive Moat and Risk Dimensions

CATERPILLAR INC

Moat: Dealer Network Depth

Caterpillar's global dealer network provides unmatched access to core collection, field diagnostics, and distribution for its Cat Reman program, a logistics advantage competitors cannot replicate without decades of comparable dealer relationship building across every major mining basin worldwide, spanning both established and newly developing mine regions.
CATERPILLAR INC

Risk: Dealer Margin Pressure

Heavy reliance on third-party dealers for rebuild distribution creates margin pressure as dealers negotiate harder on rebuild pricing, particularly in price-sensitive emerging markets where independent competitors undercut dealer-backed pricing significantly on comparable rebuild quality and turnaround time performance across comparable component categories and geographic territories.
KOMATSU LTD

Moat: Integrated Diagnostics Platform

Komatsu's integrated telematics and diagnostics platform across its equipment fleet gives it early visibility into component wear, allowing proactive rebuild scheduling that independent remanufacturers lacking equivalent fleet data access cannot match on timing precision or predictive accuracy across diverse operating environments and duty cycle intensities.
KOMATSU LTD

Risk: Limited Non-Komatsu Coverage

Komatsu's rebuild program focuses primarily on its own equipment platforms, limiting addressable market relative to independents willing to service mixed fleets, a constraint that caps growth as mine operators increasingly run multi-brand equipment populations across their expanding site portfolios and long-term procurement and budgeting strategies.

Players Tracked

Prominent Players

Caterpillar Inc
Komatsu Ltd
Liebherr Mining
Finning International
Cummins Inc

Other Key Players

Hitachi Construction Machinery
Sandvik AB
Epiroc AB
Zoomlion Heavy Industry
XCMG Group
SANY Group
Terex Corporation
Metso Outotec
Weir Group
Joy Global
Wirtgen Group
Doosan Infracore
Hyundai Construction Equipment
John Deere Construction and Forestry
Volvo Construction Equipment

Recent Developments

MARCH 2026

Caterpillar announced an expansion of its Cat Reman certified program to cover eight additional hydraulic component families, adding dynamometer testing capacity at two existing North American rebuild facilities to support the expanded scope and meet rising operator demand for documented rebuild quality across previously uncertified categories.
Signal: Signals OEMs are racing to certify categories previously left to independents, narrowing the addressable market available to uncertified regional competitors.
SEPTEMBER 2025

Finning International opened a new core exchange depot near the Escondida copper mine in Chile, reducing average drivetrain component turnaround time from three weeks to four days for operators enrolled in its exchange program, part of a broader regional densification push across Latin American copper basins.
Signal: Confirms exchange-based logistics is becoming a primary competitive battleground in high-volume copper mining regions, not just a service add-on.

Steel and Labor Cost Exposure in Rebuilds

Steel and specialty alloy inputs represent roughly thirty-five percent of total rebuild cost of goods sold, sourced primarily from mills in China, India, and South Korea that supply the forged and cast components central to drivetrain and hydraulic rebuilds. Skilled labor represents a second major cost category, accounting for close to twenty-five percent given the specialized technician training rebuild work requires across every certified facility.
Steel prices spiked roughly twenty-two percent during 2022 following supply disruption tied to the conflict in Ukraine, a major source of pig iron and semi-finished steel feeding global mills, according to IEA commodity tracking data. This pushed average rebuild costs higher across the industry for several quarters, compressing margins for remanufacturers unable to pass the full increase through to mine operator customers under existing multi-year contracts signed before the spike.

Smaller independent remanufacturers face a persistent cost disadvantage against Caterpillar and Komatsu's scale purchasing power, since large original equipment manufacturers can lock in steel and alloy pricing through long-term supply agreements unavailable to single-site rebuilders. This gap widens further for remanufacturers in regions without domestic steel production, who absorb additional import logistics cost that scale players largely avoid through regional sourcing diversification.
mining-remanufacturing-component-market-cost-volatility-analysis-1791020255274

Multi-Year Steel Supply Agreements

Leading remanufacturers are locking in multi-year steel and alloy supply agreements with mills spread across multiple regions, reducing exposure to short-term price spikes and giving procurement teams greater cost predictability when bidding on long-term rebuild contracts with mine operators seeking firm pricing certainty across multi-year engagement terms. Several large operators now require evidence of this hedging before awarding contracts.

Regional Sourcing Diversification for Core Materials

Remanufacturers are diversifying steel and alloy sourcing across multiple geographies to reduce dependence on any single supply region, a direct response to the 2022 disruption that exposed concentration risk in previous sourcing strategies across the broader rebuild supply chain network. Several firms now publish supplier diversity targets within annual sustainability and procurement disclosures to mine operator customers.

Portfolio Architecture for Margin Defence

Mining remanufacturing's margin economics split across three distinct tiers, with volume-oriented basic rebuild services carrying the thinnest margins due to intense price competition among regional independents lacking certification differentiation. Premium certified rebuild work commands meaningfully higher margins given the testing infrastructure and warranty backing certification requires, while next-generation predictive rebuild services built around telematics-driven scheduling represent the newest and highest-margin tier.
The tension between volume and premium positioning plays out differently across company types. Caterpillar and Komatsu push toward certified premium rebuild across their dealer networks, accepting lower unit volume in exchange for pricing power and customer stickiness. Independent remanufacturers face a harder choice, since competing purely on volume pricing erodes margin while pursuing certification requires capital many single-site operators cannot easily access without outside investment or consortium partnerships.

High-value margin pools concentrate in certified drivetrain and hydraulic rebuild work for high-utilization fleets, where failure consequence severity justifies premium pricing regardless of base commodity price conditions. Predictive, telematics-integrated rebuild scheduling represents the clearest path to margin expansion over the next decade, since it shifts the value proposition from reactive repair toward proactive fleet management that mine operators increasingly value.

Basic rebuild services for non-critical components sold primarily on price to cost-sensitive independent and contract mining operators without certification requirements or extended warranty expectations attached to the purchase decision. Margins stay thin here as a result.
Gross Margin

Certified rebuild programs backed by documented failure rate data and extended warranty coverage, sold to large mining groups requiring traceable component history and consistent quality across every rebuilt unit delivered to their active fleet sites.
Gross Margin

Telematics-integrated predictive rebuild scheduling and emissions-compliant rebuild configurations sold to operators prioritizing fleet uptime and regulatory compliance together as a single bundled service offering across their equipment lifecycle. Adoption is still early but accelerating.
Gross Margin
mining-remanufacturing-component-market-portfolio-architecture-1791020255624

High-value Sub-segments and Strategic Watch-out

Certified Hydraulic and Drivetrain Rebuilds

High-value, high-growth segment where certification premiums and critical failure consequence combine to support the strongest margin expansion across the category, drawing the heaviest capital investment from both original equipment manufacturers and leading independents pursuing comparable credentials. This segment is expected to keep widening its lead over the full

Core Exchange Logistics Services

High-value, moderate-growth segment where regional depot densification supports premium service pricing, though growth moderates once major mine clusters already have adequate depot coverage and turnaround times plateau near practical minimums achievable given logistics constraints. Providers are now exploring adjacent service bundling to sustain growth once depot buildout slows.

Basic Engine and Transmission Rebuilds

Volume core segment representing the largest unit base and most established rebuild category, growing steadily but facing continuous margin pressure from price competition among numerous regional independent rebuild shops lacking certified program differentiation. Consolidation among smaller shops is likely as scale advantages compound over the next several years.

Uncertified Regional Rebuild Capacity

Strategic watch-out segment facing consolidation pressure as certified programs expand into previously uncertified categories, threatening the viability of smaller shops lacking capital for testing infrastructure upgrades needed to remain competitive. Some may pursue mergers with larger, better-capitalized peers to survive the coming wave of industry consolidation pressure.

Rebuild Contracts Behave Like Service Annuities

Mining remanufacturing demand increasingly behaves like an annuity business rather than a transactional equipment sale, since certified rebuild contracts typically span three to five years with scheduled rebuild intervals tied to component wear curves rather than one-off purchase decisions. This recurring revenue structure gives leading remanufacturers greater earnings visibility than pure new equipment manufacturers face, since rebuild timing is largely predictable years in advance based on utilization data.
Adoption depth varies meaningfully by end-use vertical. Copper and iron ore operations, running the highest utilization haul truck fleets, show the deepest certified rebuild penetration since failure consequence severity justifies premium pricing regardless of commodity price swings. Coal operations show shallower penetration given declining long-term fleet investment in several regions, while gold mining sits in between, with adoption depth tracking individual operator sophistication and contract scale more than commodity category alone.

Buyer profiles are shifting generationally as procurement teams increasingly include data-literate maintenance engineers who evaluate rebuild vendors on documented failure rate transparency rather than relationship history alone. This generational shift favors certified providers with detailed diagnostic data over legacy regional rebuilders whose value proposition rested primarily on long-standing personal relationships with procurement decision-makers rather than verifiable performance records.
mining-remanufacturing-component-market-end-use-penetration-index-1791020255956

Four Calls For Mining Equipment Strategy

These are among the four positions where our research anticipates prominent divergence between winners and laggards over the coming forecast period. Each is grounded in the demand model, the regulatory perimeter, and the announced capacity pipeline.
01 / CERTIFICATION INVESTMENT PRIORITY

Build certified rebuild capability before competitors close the gap

Certified rebuild programs are capturing share from uncertified regional shops at an accelerating pace, and the testing infrastructure required to compete takes years to build credibly across every certified component family. Companies that delay certification investment risk losing access to the largest mining operators, who increasingly require documented failure rate data before awarding multi-year contracts, a requirement that is only getting stricter. Early movers in dynamometer and pressure cycling validation are already locking in preferential positioning with top-tier mine operators across several major basins.
02 / LOGISTICS NETWORK BUILDOUT

Prioritize core exchange depots near high-utilization mine clusters

Core exchange logistics are becoming a primary competitive battleground, not a service add-on, since turnaround time increasingly determines contract awards among operators running high-utilization fleets across copper, iron ore, and coal basins. Companies without depot presence near these major mine clusters face a lasting cost disadvantage against competitors offering guaranteed fast turnaround through pre-positioned rebuilt inventory held close to the point of need. Depot buildout in Chile, Western Australia, and Indonesia represents the clearest near-term expansion priority for most players today.
03 / REGIONAL PORTFOLIO BALANCE

Weight investment toward East Asia and South Asia over mature markets

Fleet scale and growth both favor East Asia and South Asia and Pacific over North America and Western Europe, where mature contracts and smaller fleets cap near-term volume expansion regardless of certification quality improvements made by individual vendors. Companies allocating capital proportionally to current revenue rather than forward growth risk under-investing in the regions driving most future demand over the coming decade. Domestic Chinese and Indian capacity growth also means regional partnership strategies matter more here than in slower-growing mature markets.
04 / COST HEDGING DISCIPLINE

Secure multi-year steel supply agreements before the next price shock

Steel and alloy price volatility has repeatedly compressed rebuild margins for companies without long-term supply agreements, as the 2022 disruption demonstrated clearly across the industry and across nearly every major rebuild cost category. Companies relying on spot market purchasing remain exposed to the next geopolitical or supply shock, while those with locked-in multi-year agreements preserve margin and contract pricing stability over time. Diversifying sourcing across multiple geographies further reduces concentration risk that single-region buyers cannot avoid otherwise, regardless of scale.

Engagement Snapshot From the Field

A live engagement with an industry participant carrying material or product regulatory and market exposure ahead of a defining policy shift, showing how our research translates into a defensible multi-year portfolio strategy.
MARKET MINDS ADVISORY · CLIENT ENGAGEMENT SUMMARY
Mining Remanufacturing Component Producer Strategic Portfolio Review and Transition Roadmap 2026·Investment Scenario on Mining Remanufacturing Component Exposure Evaluation 2025-26
CLIENT PROFILE
The client operates three open-pit copper mines across Chile and Peru with a combined haul truck and excavator fleet exceeding two hundred units, generating roughly 1.8 billion dollars in annual revenue (client-reported, unverified by MMA). Facing rising new equipment costs and sustained copper price volatility, the operator sought to extend fleet life through structured component rebuild rather than continuing its historical new-equipment replacement cycle across all three sites.
STRATEGIC CHALLENGE
The client lacked a consistent framework for deciding which components to rebuild versus replace, resulting in inconsistent vendor selection across its three mine sites and no centralized failure rate tracking. Maintenance teams at each site had developed independent relationships with local rebuild shops of varying certification quality, creating uneven reliability outcomes and limiting the operator's negotiating leverage with larger certified providers.
MMA APPROACH
MMA conducted a fleet-wide component failure analysis across all three sites, benchmarking existing vendor performance against certified program alternatives from Caterpillar, Komatsu, and independent specialists. The engagement included structured interviews with maintenance leadership at each site and a comparative total cost of ownership model spanning rebuild, exchange, and new-purchase scenarios across the fleet's largest component categories.
KEY FINDINGS
  1. Uncertified local rebuilds carried a documented failure rate nearly three times higher than certified alternatives across comparable drivetrain components over a two-year tracking window.
  2. Consolidating rebuild spend with two certified providers instead of six regional vendors reduced average unit cost by twelve percent through volume contract pricing negotiated across all three sites.
  3. Core exchange arrangements reduced average fleet downtime per rebuild event from eighteen days to five days across the highest-utilization haul truck population at the largest site.
  4. Centralized failure rate tracking surfaced one component family, hydraulic cylinders, where premature failure was traced to a specific uncertified vendor rather than normal wear patterns.
CLIENT PROFILE
The client operates three open-pit copper mines across Chile and Peru with a combined haul truck and excavator fleet exceeding two hundred units, generating roughly 1.8 billion dollars in annual revenue (client-reported, unverified by MMA). Facing rising new equipment costs and sustained copper price volatility, the operator sought to extend fleet life through structured component rebuild rather than continuing its historical new-equipment replacement cycle across all three sites.
STRATEGIC CHALLENGE
The client lacked a consistent framework for deciding which components to rebuild versus replace, resulting in inconsistent vendor selection across its three mine sites and no centralized failure rate tracking. Maintenance teams at each site had developed independent relationships with local rebuild shops of varying certification quality, creating uneven reliability outcomes and limiting the operator's negotiating leverage with larger certified providers.
MMA APPROACH
MMA conducted a fleet-wide component failure analysis across all three sites, benchmarking existing vendor performance against certified program alternatives from Caterpillar, Komatsu, and independent specialists. The engagement included structured interviews with maintenance leadership at each site and a comparative total cost of ownership model spanning rebuild, exchange, and new-purchase scenarios across the fleet's largest component categories.
KEY FINDINGS
  1. Uncertified local rebuilds carried a documented failure rate nearly three times higher than certified alternatives across comparable drivetrain components over a two-year tracking window.
  2. Consolidating rebuild spend with two certified providers instead of six regional vendors reduced average unit cost by twelve percent through volume contract pricing negotiated across all three sites.
  3. Core exchange arrangements reduced average fleet downtime per rebuild event from eighteen days to five days across the highest-utilization haul truck population at the largest site.
  4. Centralized failure rate tracking surfaced one component family, hydraulic cylinders, where premature failure was traced to a specific uncertified vendor rather than normal wear patterns.
RECOMMENDED STRATEGY
Phase 1: Phase one: consolidate rebuild spend with two certified providers across all three mine sites within twelve months, phasing out underperforming local vendors. Phase 2: Phase two: establish centralized failure rate tracking across the fleet to inform future vendor negotiations and rebuild timing decisions systematically. Phase 3: Phase three: negotiate multi-year exchange agreements with certified providers to lock in turnaround time guarantees and reduce fleet downtime further.
OUTCOME
Within eighteen months of implementation, the client reported a 15 percent reduction in total component lifecycle cost across its fleet and a measurable decline in unplanned downtime incidents tied to premature component failure (client-reported, unverified by MMA). The operator has since extended the consolidated rebuild framework to its newest mine site acquisition.

Frequently Asked Questions

Foundational context covering the market sizes, CAGR, scope, country, region and competition that inform every finding below. This section is provided to cover basics and most often pre-purchase conversations, answered from the MMA Primary Research Dataset.

What is the current size of the Mining Remanufacturing Component Market?

The market reached an estimated 3.1 billion dollars in 2025, with steady expansion continuing. Growth is driven by capital discipline favoring component rebuild over costly new equipment purchases industry-wide.

How large will the Mining Remanufacturing Component Market be by 2036?

The market is projected to reach 5.586 billion dollars by 2036, nearly doubling from 2025 levels. This reflects sustained demand for certified rebuild programs across major mining fleets worldwide.

What is the CAGR for the Mining Remanufacturing Component Market 2026 to 2036?

The market is forecast to grow at a 5.5 percent compound annual rate through the forecast period. Bull and bear scenarios range from 4.3 to 6.7 percent depending on commodity prices.

Which segment is growing fastest?

Remanufactured hydraulic and drivetrain systems lead at 7.6 percent annual growth, well above the market average. This is 1.38 times the overall market rate, driven by certified quality demand.

Who are the major companies in the Mining Remanufacturing Component Market?

Caterpillar, Komatsu, Liebherr Mining, Finning International, and Cummins lead the market through established dealer networks. Together they hold an estimated 43 percent combined share of total participation.

Which country is growing fastest?

Australia leads growth at 6.9 percent annually, tied to mature contract mining culture and scale. Strict safety compliance standards push rebuild adoption ahead of most global mining peers.

Report Segmentation Architecture

The full report scope spans multiple orthogonal segmentation dimensions, with cross-tabulated demand data provided for each dimension pair. Coverage extends further to regional breakdowns, trend trajectories, and the competitive detail needed to support segment-level decision-making.

By Component Type

    By End-Use Industry

      By Commercial Dimension

        By Region

        • North America
        • Western Europe
        • East Asia
        • South Asia and Pacific
        • Latin America
        • Middle East and Africa
        • Eastern Europe

        Scope, Methodology, and Coverage

        Every figure in this report is reproducible from documented input assumptions. The scope below maps the historical period, the forecast horizon, the segmentation dimensions, and the countries covered, alongside the underlying primary and qualitative methodology.
        Historical Period
        2020 to 2025
        Forecast Period
        2026 to 2036
        Base Year
        2025 (USD billions; MMA Primary Research Dataset, October 2026)
        Market Definition
        This report covers remanufactured engines, transmissions, hydraulic systems, and drivetrain components restored to original equipment specification for reuse in mining haul trucks, excavators, and drilling equipment. It excludes new component manufacturing and basic repair services that do not involve full component rebuild.
        Quantitative Units
        USD billions
        Segmentation Dimensions
        Regions Covered
        North America, Western Europe, East Asia, South Asia and Pacific, Latin America, Middle East and Africa, Eastern Europe
        Countries Covered
        Key Companies Profiled
        Caterpillar Inc, Komatsu Ltd, Liebherr Mining, Finning International, Cummins Inc, Hitachi Construction Machinery, Sandvik AB, Epiroc AB, Zoomlion Heavy Industry, XCMG Group, SANY Group, Terex Corporation, Metso Outotec, Weir Group, Joy Global, Wirtgen Group, Doosan Infracore, Hyundai Construction Equipment, John Deere Construction and Forestry, Volvo Construction Equipment
        Quantitative Methodology
        Primary survey, n=3,800 respondents, Q4 2025, six countries; demand-side model with trade association cross-validation
        Qualitative Methodology
        47 expert interviews, Q4 2025; applied to validate demand model assumptions, identify emerging dynamics, and assess competitive positioning
        Report Format
        PDF and XLSX data workbook (Word format preview document)
        Publisher
        Market Minds Advisory
        Report Code
        MMA-2026-CON-447
        Published
        October 2026
        Contact
        sales@marketmindsadvisory.com | www.marketmindsadvisory.com

        Purchase the full Mining Remanufacturing Component Market Report (2026 to 2036).

        The full report provides comprehensive coverage of the mining remanufacturing component market, including detailed segmentation by component type, regional demand analysis across all seven global regions, and competitive benchmarking of twenty leading participants assessed on a consistent basis. It examines certified rebuild program expansion, core exchange logistics trends, and input cost exposure across the rebuild value chain in depth. Forecast scenarios extend through 2036 with bull and bear case analysis grounded in primary survey and expert interview data collected across six countries. Analyst commentary throughout highlights where rankings are likely to shift.
        Seven-region market sizing and growth forecasts
        Twenty-company competitive benchmarking and positioning assessment
        Six-segment component type breakdown and analysis
        Certified rebuild program adoption tracking data
        Input cost exposure and mitigation analysis
        Anonymized client case study with outcomes

        Built For The People Who Decide

        From boardroom strategy to bench-side execution, this report is read cover-to-cover by leaders shaping the next decade of their industry, turning demand scenarios, market dynamics and valuation benchmarks into decisions.
        CXOs/ Presidents/ VPs/ Managers
        M&A and Corporate Development
        Strategy Teams and R&D Heads
        Procurement and Product Directors
        Regulatory and Compliance Leaders
        Investor Relations and Equity Analysts