Market Minds Advisory
Mining Lubricants Market

Mining Lubricants Market: Autonomous Fleet Demands Meet Extended Service Interval Economics

Autonomous haul truck fleets and extended service interval targets are reshaping mining lubricant specifications, forcing suppliers to defend commodity engine oil volume while chasing certified synthetic hydraulic and gear contracts.

Lead Analyst

Bilal Shaikh

Published

September 2026

Make Smarter Decisions with Customized Research Insights

Request a free sample report and evaluate market opportunities, growth trends, and competitive dynamics relevant to your business needs.

2025 MARKET VALUE$8.5BMarket Size 2025
2036 FORECAST VALUE$13.8BBase Case , 2026 to 2036
CAGR 2026 TO 20364.5 %Bull 5.7% / Bear 3.3%
INCREMENTAL OPPORTUNITY$4.9BNet 10- year value creation
EXPANSION MULTIPLE1.55x2036 value over 2026 base
Strategic Levers
M&A Pipeline
Regional Outlook
Country Rankings
Competitive Intelligence
Segmental Deep-dive
Call-Us : 91 93563 13602

Executive Snapshot and Market Trajectory

Mining lubricants have quietly become a data product as much as a chemical one. Autonomous haul trucks now report real-time fluid condition telemetry that determines replacement timing, shifting purchasing decisions away from calendar-based schedules toward condition-based contracts that reward suppliers with proven monitoring capability across most fleet operations.
ExxonMobil and Shell continue supplying the bulk conventional engine oils and gear lubricants that haul trucks and excavators have relied on for decades, since fleet operators still specify proven formulations for baseline equipment regardless of technology cycles elsewhere in the industry and its evolving product lines. Specialty and synthetic lubricants for extreme conditions are capturing disproportionate growth as autonomous fleet operators specify extended service interval formulations that reduce costly unplanned downtime considerably.
Chevron and FUCHS Petrolub are investing specifically in condition-monitoring partnerships and synthetic formulation capability to serve customers seeking fleet uptime guarantees, betting that autonomous mining investment sustains premium pricing for years across most product categories and end markets served today. Suppliers without monitoring integration increasingly find themselves confined to price-competitive commodity contracts rather than the higher-margin service programs fleet operators increasingly prefer for new equipment.
Market Definition
The mining lubricants market covers engine oils, hydraulic fluids, gear and transmission lubricants, greases, specialty and synthetic lubricants, and coolants sold for haul trucks, excavators, crushers, and conveyor equipment used in surface and underground mining operations. It excludes lubricants for on-road transport vehicles and general industrial machinery outside mining applications.
Base Year Value
$8.5B in 2025 (MMA Primary Research Dataset, August 2026)
Forecast Period
2026 to 2036, eleven discrete annual values
CAGR
4.5% base case. Bull 5.7%. Bear 3.3%.
Fastest Growth Segment
Specialty and Synthetic Lubricants for Extreme Conditions: 7.5% CAGR
Fastest Growth Country
Australia: 6.0% CAGR
Fastest Growth Region
South Asia and Pacific: 6.5% CAGR
Largest Region
East Asia: 29% of 2025 global value
Market Leaders
ExxonMobil, Shell, Chevron, TotalEnergies, FUCHS Petrolub. Source: MMA Analysis based on company annual reports.
Primary Survey
n=3,800 procurement and R&D decision-makers, Q4 2025, six countries
Methodology
Demand-side build-up, cross-validated against public data, 47 expert interviews

Mining Lubricants Market Forecast Scenarios

mining-lubricants-market-size-forecast-scenario-1787554439830
Between 2020 and 2025 the market grew at roughly 4.5 percent a year, as steady commodity extraction volume combined with gradual adoption of extended service interval formulations to lift overall demand modestly above the flat pattern this category had shown through most of the previous decade, setting the stage for the specialty grade growth now underway.
The base case assumes 4.5 percent annual growth to 2036, built on three mechanisms: autonomous haul truck fleets expanding across major mining regions and specifying condition-monitored synthetic lubricants for extended service intervals, hydraulic fluid demand scaling as equipment complexity increases across excavation and loading applications worldwide, and emerging market mining capacity expanding steadily as commodity extraction investment continues across developing economies specifically over the coming decade of continued capacity investment, buildout, and modernization.
A bull case near 5.7 percent depends on autonomous mining fleet adoption accelerating faster than currently planned across major producing regions worldwide and beyond current expectations. The bear case near 3.3 percent assumes commodity extraction volume softens amid a cyclical mining downturn, delaying lubricant demand and pressuring suppliers reliant on that legacy channel specifically each quarter.

Fleet Uptime, Not Volume, Now Sets Price

Mining lubricants sit at an unusual crossroads between commodity fluid supply and condition-monitoring service, and that split now defines competitive strategy across the category. Conventional engine oils and gear lubricants for legacy equipment behave like a mature commodity, priced on delivered volume with thin single-digit margins that reward refining scale above all else consistently across most producers.
MARKET CONCENTRATIONCR5 42%Top five suppliers hold substantial combined global market share
AVERAGE SELLING PRICE$5.20/literBlended price varies sharply by formulation and service tier
TOP PRODUCING COUNTRY SHAREChina 24%Leading producer nation supplies bulk commodity formulation volume
CAPACITY UTILIZATION79%Utilization reflects steady but not fully stretched output
FEEDSTOCK COST SHARE52%Base oil and additive costs dominate total input structure
REPLACEMENT CYCLE LENGTH3 to 6 monthsCycle length varies with equipment duty and severity conditions
Synthetic lubricants for autonomous haul truck fleets occupy the opposite end of the spectrum, where extended service interval guarantees now matter as much as basic lubrication function and fleet operators treat fluid condition telemetry as an uptime variable rather than a procurement line item. Specialty formulations for extreme temperature and dust conditions sit further out still, commanding premium pricing tied directly to documented equipment protection performance.
Condition-monitoring data and fluid analysis programs increasingly shape total cost of ownership conversations with mining operators, who now evaluate lubricant suppliers on uptime guarantees rather than delivered cost alone in most contract negotiations. Suppliers able to document reduced unplanned downtime are winning contract renewals even at a price premium, a shift that favors established players with genuine monitoring infrastructure over low-cost regional entrants and new market participants.
"Buying mining lubricant used to mean buying a drum of oil. Now it means buying an uptime guarantee, and autonomous fleet operators are the ones writing that contract."
Practice Lead, Industrial Lubricants and Fleet Service Solutions · MMA Construction and Industrial Equipment Practice · August 2026

Market Trends

Autonomous Haul Trucks Redefine Lubricant Service Standards

Autonomous haul truck operators are pushing lubricant service interval requirements well beyond the standards that satisfied manually operated fleets a decade ago, since unplanned downtime on remote autonomous routes carries genuinely higher cost than on conventionally staffed sites. Fleet operators increasingly specify condition-monitored synthetic formulations directly in equipment maintenance contracts rather than treating lubricants as a generic consumable, giving suppliers with proven monitoring integration a genuine seat at the table during fleet procurement decisions. This shift is compressing the addressable supplier pool, since qualifying a new formulation for autonomous fleet use now takes considerable validation testing.
Market Impact: Adds 3 percent fleet expansion demand
Extended Service Intervals Drive Synthetic Formulation Demand

Mining operators are pushing lubricant service intervals from monthly toward quarterly and beyond, treating extended drain intervals as a genuine cost reduction lever rather than a supplier marketing claim. This shift requires synthetic base oil chemistry that conventional mineral-based formulations cannot reliably sustain under heavy-duty operating conditions, giving suppliers with proven synthetic capability a real advantage. Fleet operators increasingly calculate total cost of ownership across the full service interval rather than comparing per-liter pricing alone, a shift that favors synthetic suppliers able to document downtime reduction data across comparable fleet deployments.
Market Impact: Adds 3 percent hydraulic fluid demand

Market Opportunities and Growth Drivers

Global Commodity Demand Sustains Fleet Expansion

Global demand for iron ore, copper, and battery metals continues expanding as infrastructure and electrification investment accelerates worldwide, and every new mine expansion requires equipment fleet growth that translates directly into lubricant volume from the day operations begin. Mining companies typically commit to multi-year equipment procurement plans that are publicly disclosed well in advance, giving lubricant suppliers predictable visibility into upcoming fleet expansion cycles across specific regions and commodity types. This creates a genuinely stable baseline demand driver, since fleet expansion plans rarely reverse once capital has been committed to mine development.
Market Impact: Margins compress 5 to 8 percent

Equipment Complexity Growth Sustains Hydraulic Demand

Modern mining equipment increasingly incorporates more sophisticated hydraulic systems for precision excavation and material handling, and each generation of equipment requires greater hydraulic fluid volume and higher performance specifications than its predecessor across most major equipment classes. Equipment manufacturers increasingly specify hydraulic fluid grades directly in warranty documentation, making fluid choice a genuine compliance requirement rather than a discretionary maintenance decision operators could substitute freely without penalty. This creates predictable replacement demand tied to equipment generation cycles rather than purely commodity price fluctuations that could shift quickly with market sentiment.
Market Impact: Reduces volume 8 percent in downturns

Market Restraints and Challenges

Base Oil Price Volatility Pressures Formulator Margins

Base oil prices swing sharply with crude oil market cycles, and since base oil represents the dominant cost input for lubricant formulations, margin compression follows every upstream price spike almost immediately. The root cause is limited substitutability: performance specifications for heavy-duty mining equipment limit how far formulators can shift base oil grades without losing warranty compliance or performance characteristics. The commercial impact falls hardest on smaller regional formulators lacking long-term supply contracts. Larger players are exploring backward integration into base oil refining and multi-year indexed supply agreements to dampen this exposure.
Market Impact: Autonomous fleet demand grows 35 percent

Mining Downturn Cycles Compress Discretionary Spending

Commodity price downturns periodically force mining operators to defer non-essential maintenance spending and extend equipment service intervals beyond manufacturer-recommended schedules, directly reducing lubricant consumption volume during those periods across most affected fleets. The root cause is genuine capital discipline: mining companies treat lubricant spending as a variable cost lever during commodity downturns, unlike equipment purchases which are harder to defer once committed. The commercial impact concentrates among commodity-exposed suppliers lacking diversified customer bases across multiple mineral types. Suppliers are mitigating this by expanding service contract models that smooth revenue across commodity price cycles.
Market Impact: Adds 20 percent synthetic formulation demand
3 additional market trends, 3 additional growth drivers, and 4 additional restraints and challenges are covered in the full report. Contact sales@marketmindsadvisory.com to access the complete intelligence.

Segment CAGR and Growth Architecture

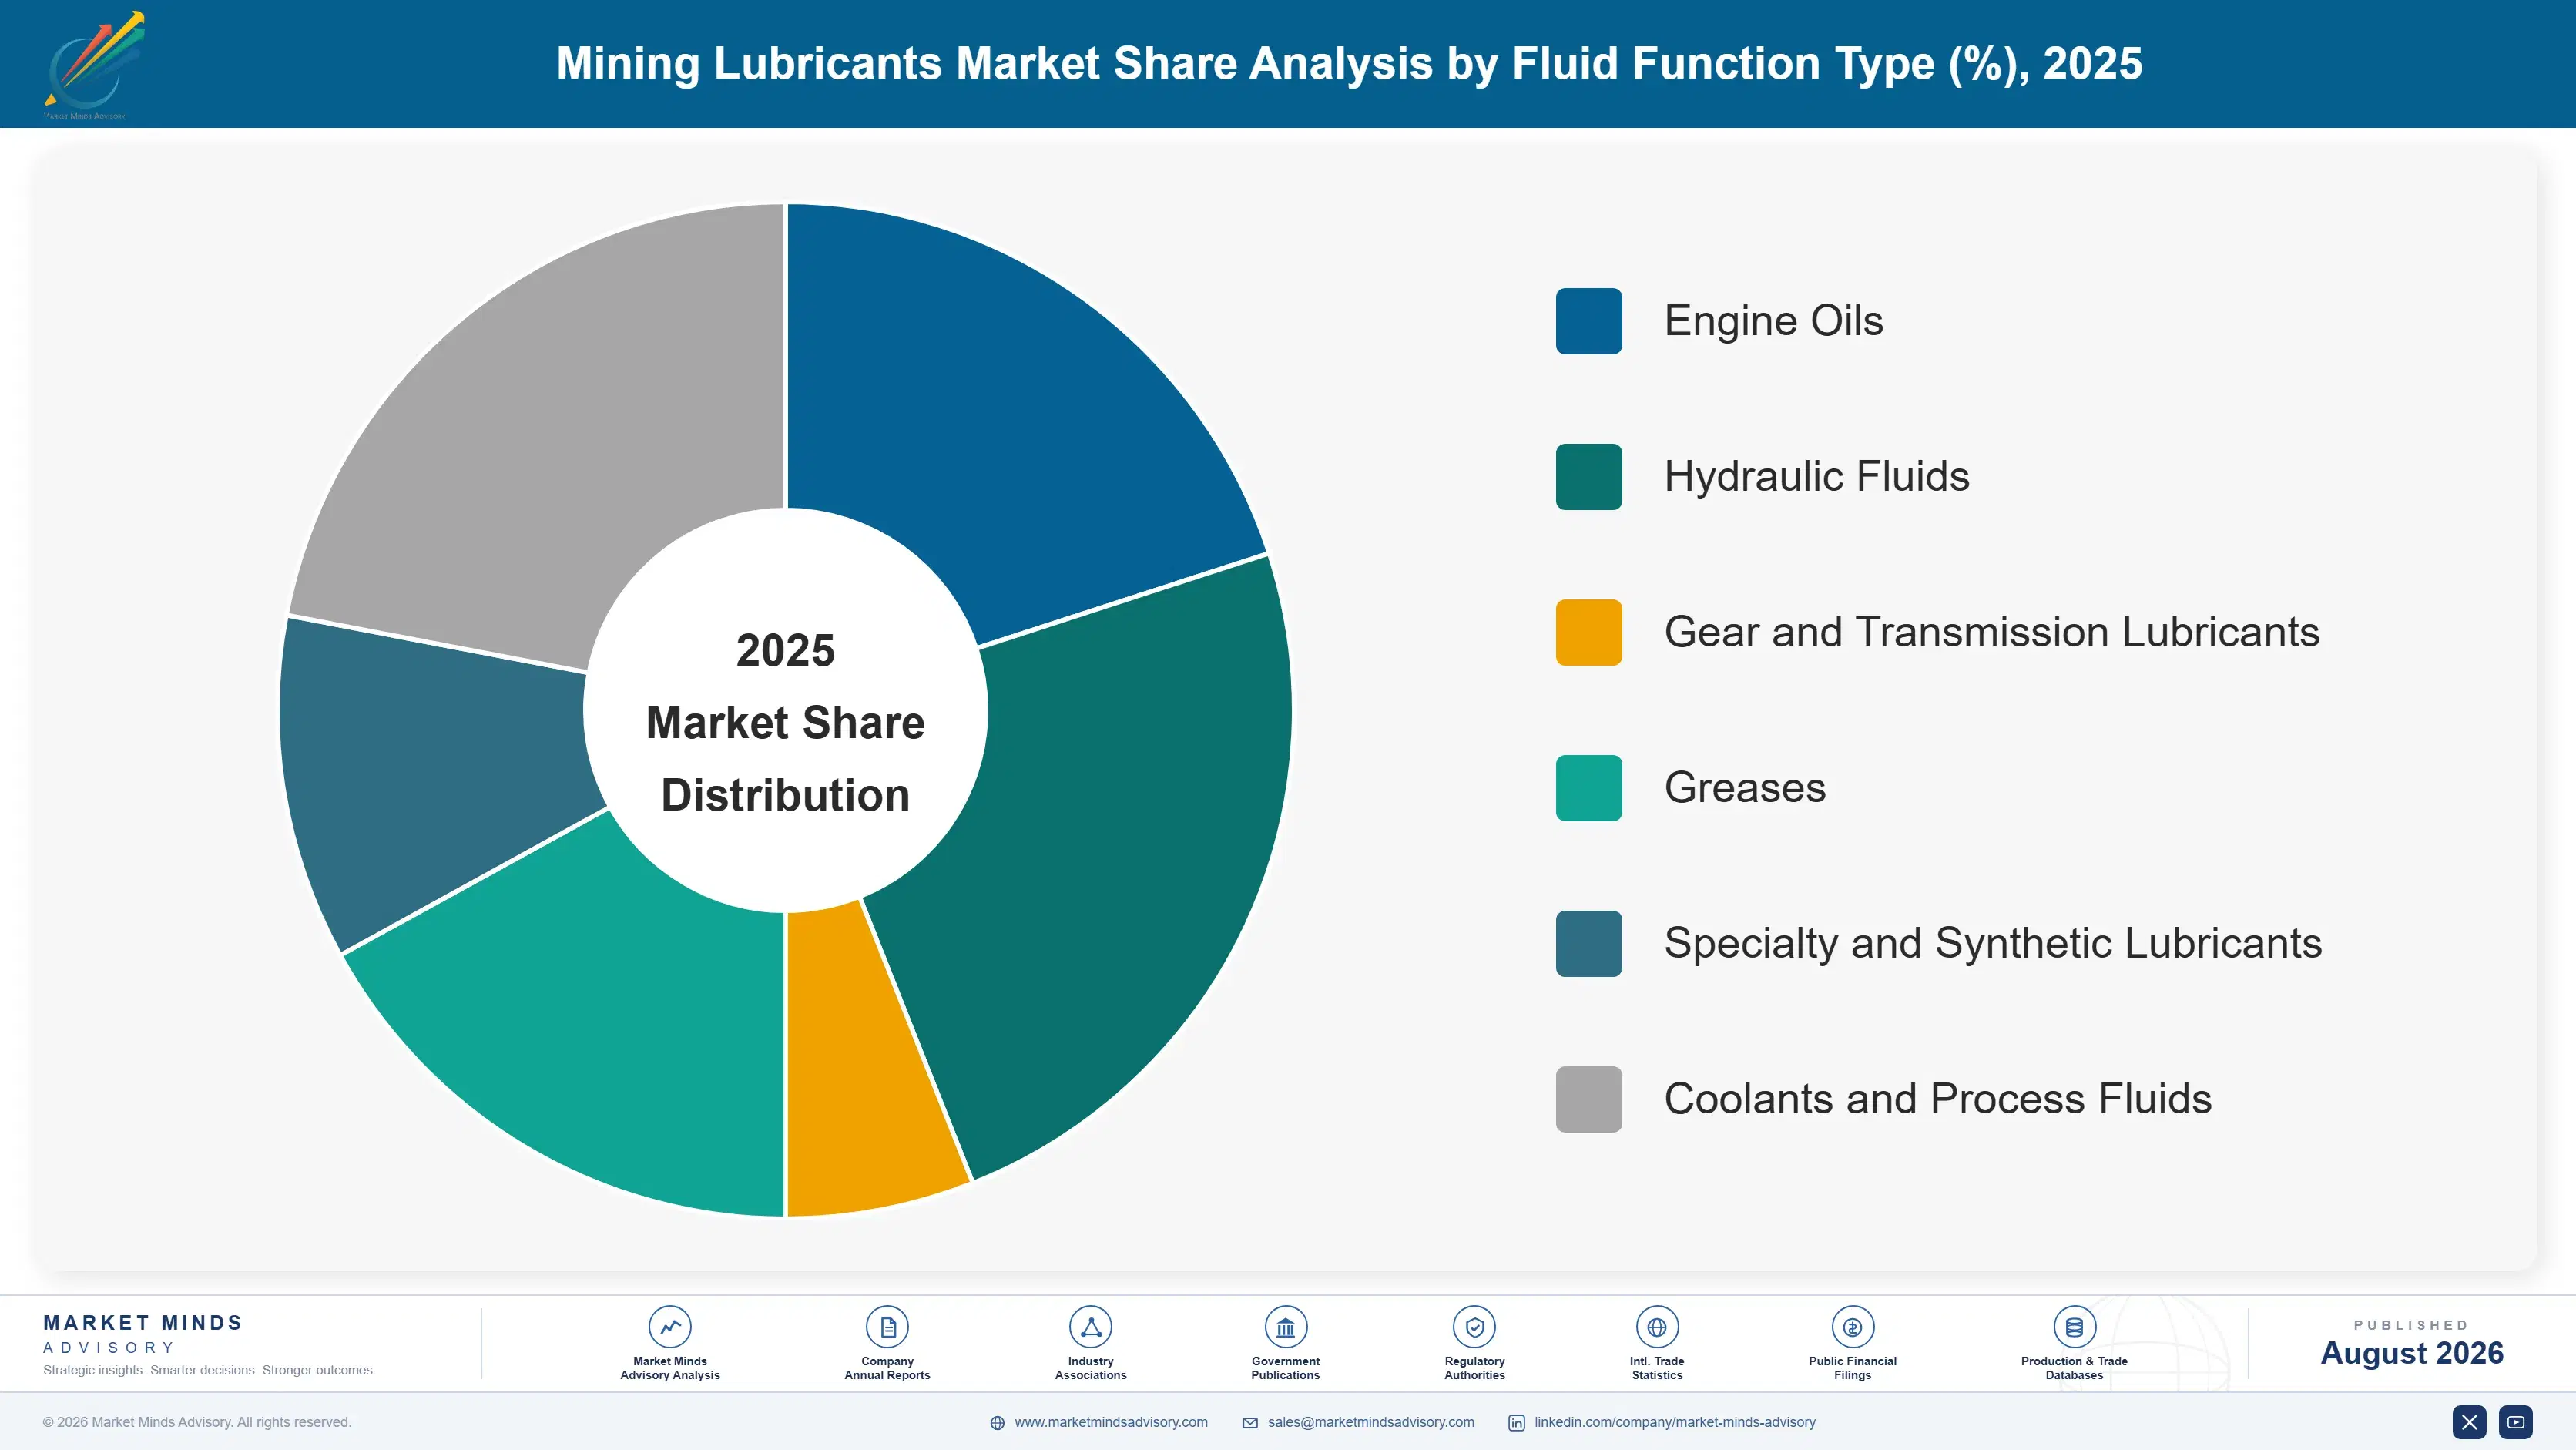
The market divides into six categories by fluid function, spanning engine oils, hydraulic fluids, gear and transmission lubricants, greases, specialty and synthetic lubricants, and coolants and process fluids, each addressing distinct performance requirements across haul trucks, excavators, crushers, and conveyor equipment used across surface and underground mining operations, with differentiated margin structures and service models.
mining-lubricants-market-market-share-analysis-1787554440427

Specialty and Synthetic Lubricants for Extreme Conditions

Specialty and synthetic lubricants lead category growth as autonomous haul truck operators scale extended service interval requirements across major mining regions, each demanding formulation consistency that conventional mineral-based lubricants cannot reliably sustain. Fleet operators increasingly specify synthetic chemistry directly in maintenance contracts, treating fluid performance as a genuine uptime variable rather than a commodity consumable purchased on price. Suppliers with proven synthetic formulation and condition-monitoring integration command pricing flexibility that conventional-only competitors cannot match, since qualification for autonomous fleet deployment requires documented performance testing that takes considerable validation time. This segment's growth trajectory increasingly tracks autonomous fleet investment cycles rather than traditional commodity extraction volume, a genuine decoupling from the category's historical demand drivers.
CAGR 7.5%

Hydraulic Fluids

Hydraulic fluids remain the second-fastest-growing category, driven increasingly by rising equipment complexity across excavation and material handling applications where precision hydraulic systems now demand higher performance specifications than earlier equipment generations required. Equipment manufacturers increasingly specify hydraulic fluid grades directly in warranty documentation, treating fluid choice as a genuine compliance requirement rather than a discretionary maintenance decision operators could substitute freely. Qualification testing for new hydraulic formulations takes considerable time given the precision tolerances modern equipment demands, creating a genuine barrier that protects incumbent suppliers with proven equipment compatibility from new entrants. Demand growth here tracks equipment generation replacement cycles closely, giving this segment steadier exposure than the more technology-driven synthetic category overall.
CAGR 6.0%
Full segment breakdown across 6 segments available in the complete report.

Regional Architecture and Country Demand Map

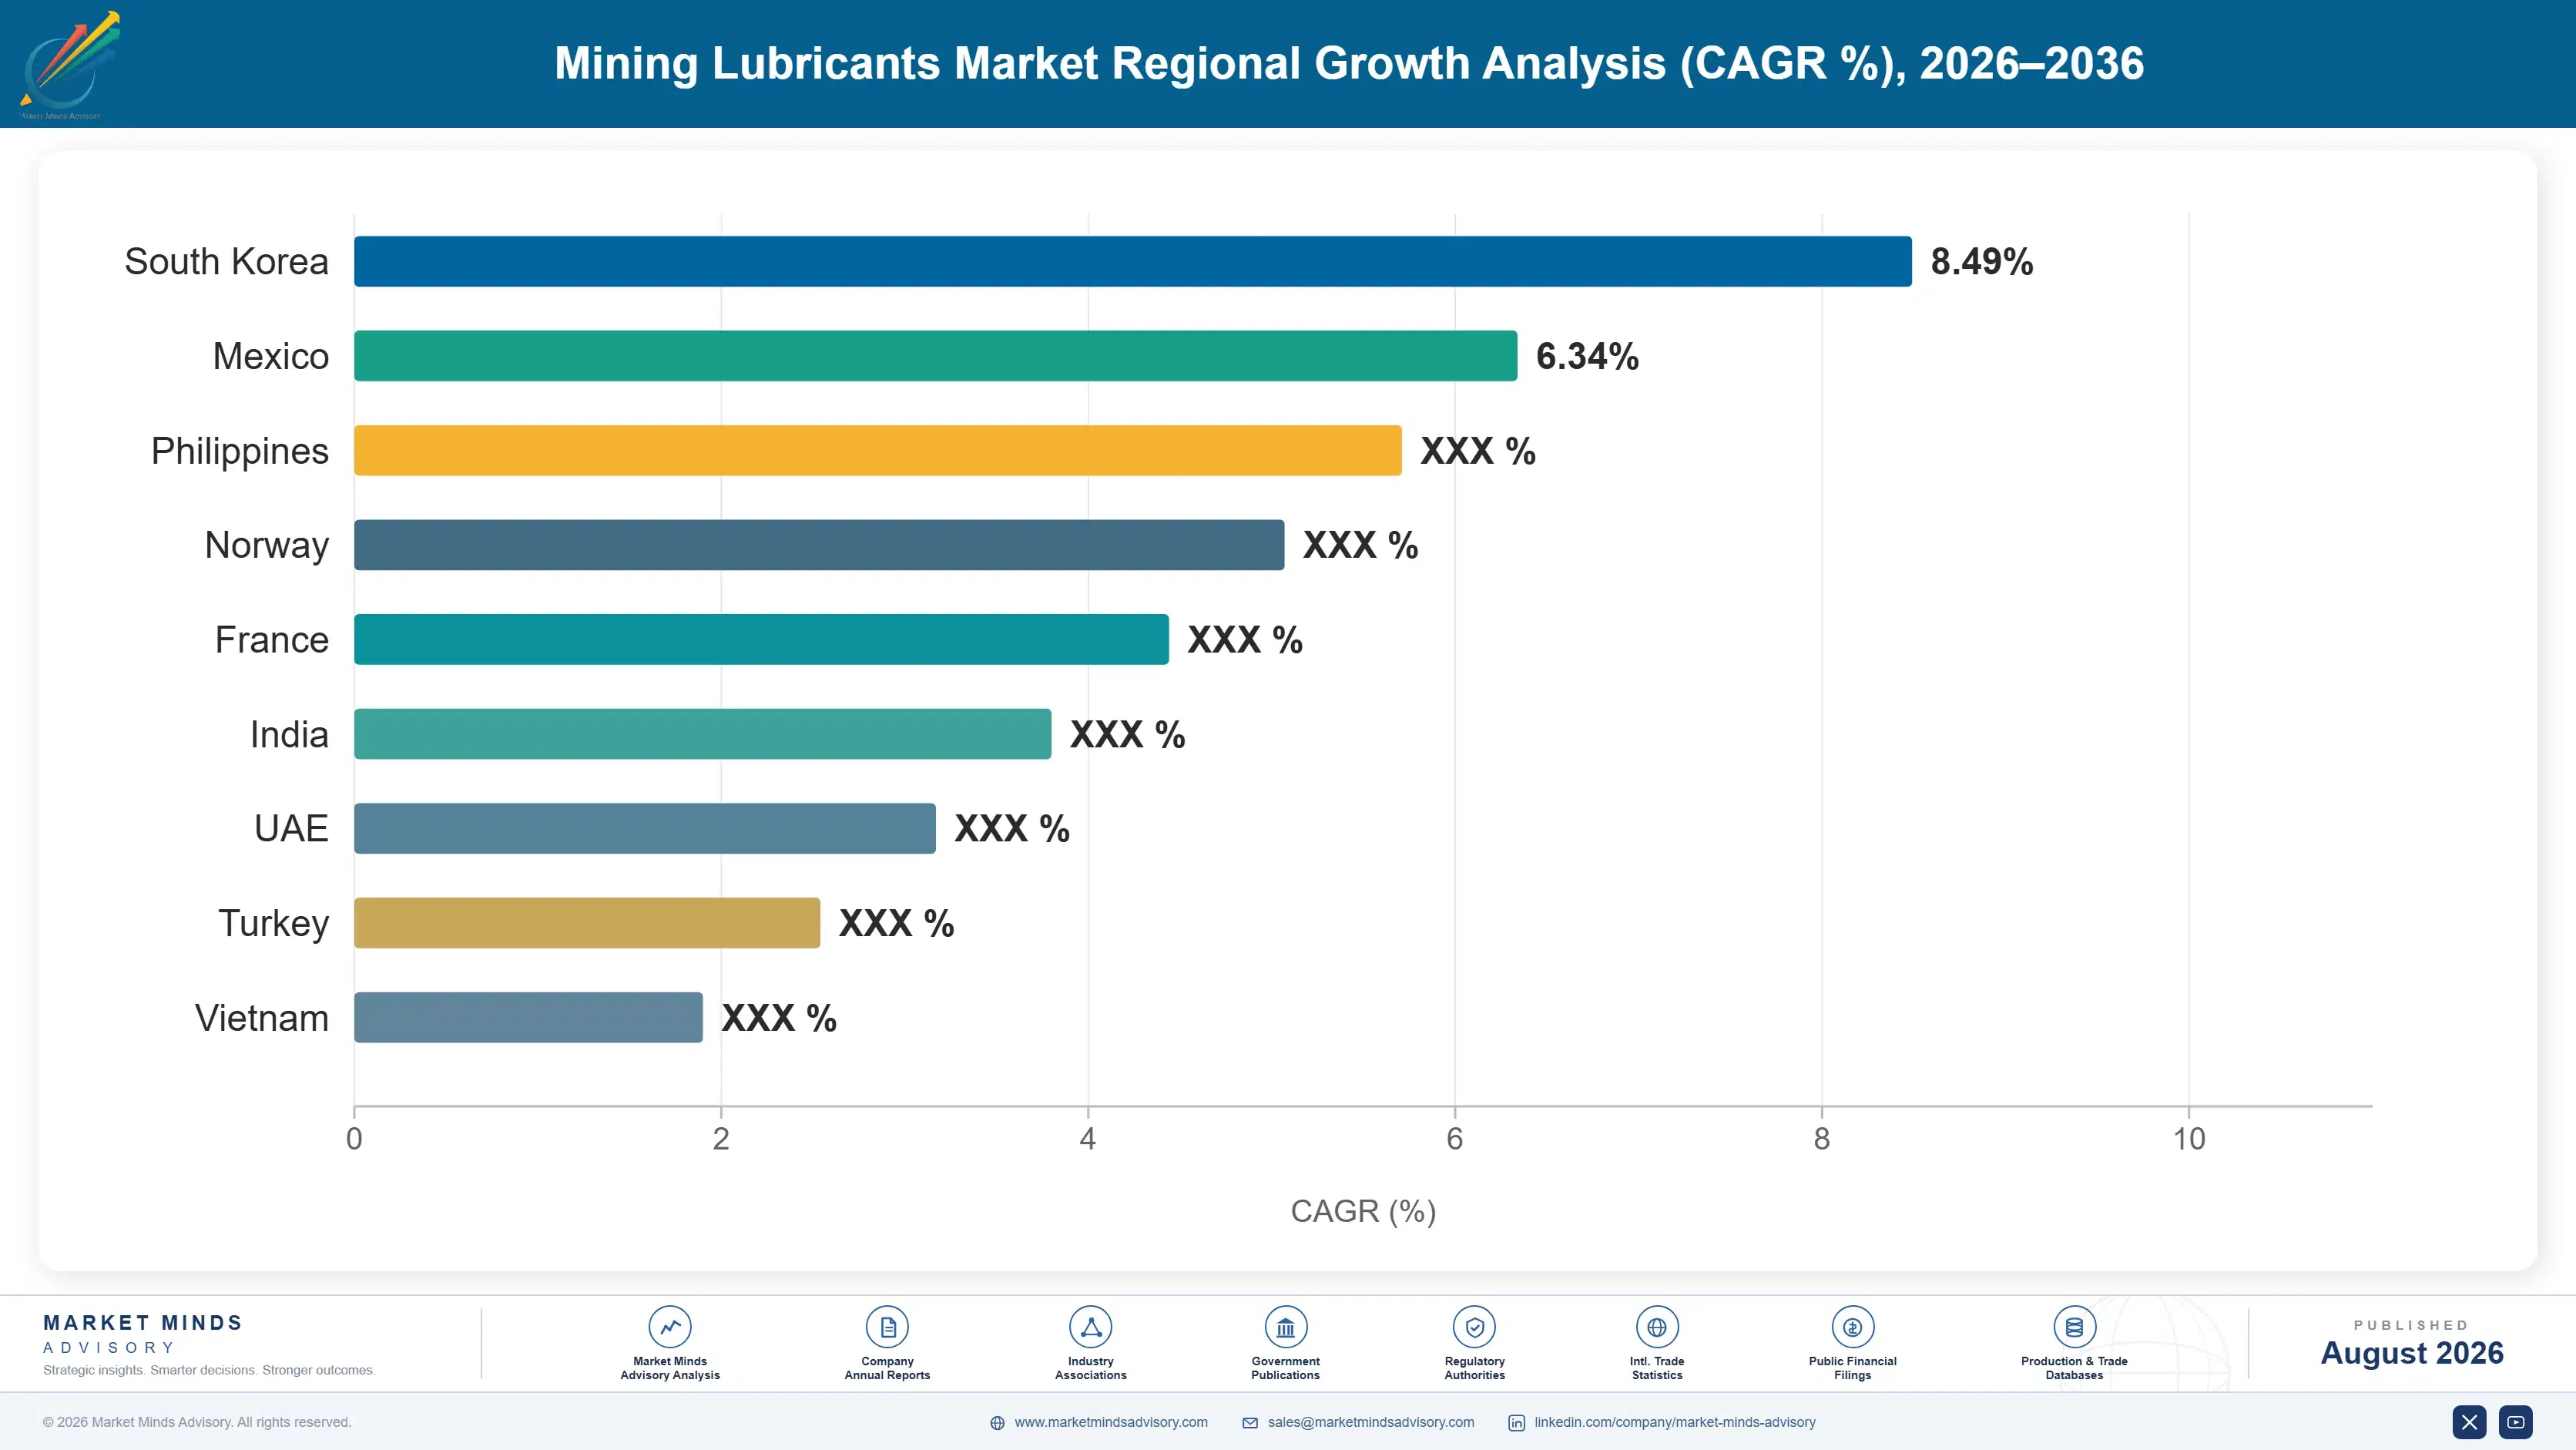
East Asia leads on China's dominant coal and metals mining equipment fleet, while South Asia and Pacific posts the fastest growth as Australian iron ore operations and Indian coal mining capacity both scale automated fleet investment across the region specifically over the coming several years ahead.

East Asia

China's coal mining sector, still the world's largest by production volume despite gradual diversification toward other energy sources, sustains a massive equipment fleet that anchors regional lubricant demand independent of shorter-term commodity price cycles entirely. Domestic Chinese metals mining, spanning iron ore, rare earth, and battery metal extraction, adds further fleet volume tied to the country's broader industrial supply chain ambitions and export goals. South Korea and Japan's equipment manufacturers increasingly specify proprietary lubricant formulations for export machinery, creating a genuine technical relationship layer beyond pure commodity supply. Rising domestic Chinese lubricant formulation capacity has narrowed historical import dependence on Western majors, shifting value capture increasingly toward regional producers building genuine capability.
Share: 29% | CAGR: 5.5% (2026 to 2036)

North America

US and Canadian mining operations, spanning coal, copper, and battery metal extraction, maintain one of the world's most technically sophisticated equipment fleets, sustaining premium synthetic and specialty lubricant demand tied to autonomous fleet deployment nationwide across most major producing basins. Reshoring initiatives targeting critical mineral extraction capacity, supported by federal manufacturing incentive programs, are expanding domestic mining fleet investment beyond historical baseline levels considerably. Major equipment manufacturers headquartered in the region maintain close lubricant formulation partnerships tied to warranty compliance requirements across multiple product lines and platforms. Condition-monitoring service adoption runs ahead of most other regions, reflecting the region's early and aggressive investment in autonomous haul truck technology across multiple major mining operations.
Share: 26% | CAGR: 4.0% (2026 to 2036)
Regional intelligence for 5 additional markets available in the complete report: Western Europe, South Asia and Pacific, Latin America, Middle East and Africa, Eastern Europe. Contact sales@marketmindsadvisory.com.
mining-lubricants-market-country-cagr-analysis-1787554440961

Where Suppliers Capture Fleet Uptime Value

Commodity fluid volume no longer determines profitability in this category. Suppliers capturing outsized returns are the ones layering condition-monitoring technology, synthetic formulation certification, and extended service interval guarantees onto commodity base fluids, converting what was once a low-margin chemical sale into a recurring uptime service relationship with mining fleet operators specifically each fiscal cycle.

Condition-Monitoring Service and Long-Term Contract Programs

Suppliers that bundle condition-monitoring telemetry with recurring lubricant supply contracts capture roughly 30 percent higher account-level margins than fluid-only competitors, because the monitoring service creates switching costs that protect volume from competitive price shopping at contract renewal. Fleet operators increasingly prefer a single vendor relationship covering both fluid supply and condition data, simplifying maintenance planning into one contract rather than separate supplier and service relationships. This model has proven particularly effective for autonomous fleet operators, where unplanned downtime carries genuine cost risk that justifies paying a premium for guaranteed uptime performance.
Market Impact: Adds roughly 30 percent higher account-level margin overall

Synthetic Formulation Certification for Extended Intervals

Formulations carrying documented extended service interval certification command price premiums of 20 to 28 percent over conventional equivalents in autonomous fleet procurement specifically, since fleet operators pay directly for reduced maintenance frequency that lowers total operating cost across the entire fleet lifecycle. This certification barrier also raises the cost of market entry for new competitors, protecting incumbent share among established suppliers with existing equipment manufacturer relationships. Smaller regional formulators lacking certification budgets are increasingly locked out of the highest-margin autonomous fleet segment entirely, ceding that channel to larger players with dedicated testing infrastructure.
Market Impact: Commands 20 to 28 percent extended interval premium

Equipment Manufacturer Warranty Partnership Programs Overall

Suppliers with formal warranty-approved partnership status from major equipment manufacturers capture 15 to 22 percent higher pricing since fleet operators treat manufacturer-approved lubricants as a genuine risk reduction choice that protects equipment warranty coverage across the full service life. Equipment manufacturers increasingly specify approved lubricant suppliers directly in warranty documentation following worker and operator feedback about equipment reliability, giving formulators with proven manufacturer relationships a genuine competitive edge in fleet procurement processes. This premium tier is expanding fastest in autonomous and remote mining operations where equipment reliability carries the highest cost of failure.
Market Impact: Captures 15 to 22 percent warranty partnership premium

Who Controls the Margin Pool

Global revenue concentration sits substantial at a 42 percent CR5, reflecting a market where refining scale and equipment manufacturer relationships matter more than regional presence alone. ExxonMobil leads on breadth across conventional and synthetic channels, while Chevron commands outsized share within condition-monitoring service contracts specifically. The gap between leader and mid-tier challengers has narrowed as Asian formulators scale certified production, though qualification history still separates the top five from smaller players in the broader market.
Current activity centers on condition-monitoring bundling and synthetic certification rather than commodity price competition. Leading players sign multi-year fleet service contracts that lock in volume years ahead, while mid-tier competitors invest in extended service interval formulations to differentiate on total cost of ownership across the fleet lifecycle. Asian producers have expanded conventional capacity aggressively, pressuring pricing in general commodity segments.

Emerging pressure comes from Asian formulators scaling synthetic production capacity fast enough to challenge multinational technical leadership within autonomous fleet applications specifically. Rankings could shift if a leading player secures exclusive equipment manufacturer warranty partnerships that lock competitors out of that fast-growing segment. Consolidation among mid-tier commodity formulators also looks likely as certification costs rise.
mining-lubricants-market-company-positioning-matrix-1787554441657

Competitive Moat and Risk Dimensions

EXXONMOBIL

Moat: Broadest Global Refining Scale

ExxonMobil's global refining and base oil production network spans conventional and synthetic lubricant categories simultaneously, giving it a breadth of formulation capability that narrower specialty competitors cannot match easily. This range lets ExxonMobil serve customers across multiple fleet requirements without losing account relationships, deepening switching costs for mining operators considering alternatives.
EXXONMOBIL

Risk: Commodity Segment Margin Pressure

ExxonMobil's broad commodity lubricant exposure leaves it vulnerable to Asian formulators scaling low-cost conventional production, particularly in price-sensitive commodity mining tenders where technical differentiation matters less than delivered cost and freight terms. Sustained commodity price pressure could compress blended margins across the broader portfolio over time.
CHEVRON

Moat: Condition-Monitoring Service Leadership

Chevron's deep investment in fleet condition-monitoring technology gives it a technical lead in uptime service contracts that took years of data infrastructure development to build. This specialization commands premium pricing under autonomous fleet operator contracts and protects incumbent share from competitors lacking comparable monitoring infrastructure.
CHEVRON

Risk: Autonomous Fleet Concentration Risk

Chevron's revenue growth concentration in autonomous fleet service contracts leaves it more exposed than diversified rivals to any slowdown in autonomous mining equipment adoption, such as capital spending deferrals during commodity price downturns across major producing regions. A broader conventional fleet base would cushion that exposure more effectively.

Players Tracked

Prominent Players

ExxonMobil
Shell
Chevron
TotalEnergies
FUCHS Petrolub

Other Key Players

BP Castrol
Valvoline
Petro-Canada Lubricants
Idemitsu Kosan
ENEOS Corporation
Repsol
PetroChina Lubricant
Sinopec Lubricant
Quaker Houghton
Kluber Lubrication
Whitmore Manufacturing
Bel-Ray Company
Lubrizol Corporation
Amsoil Inc
Southwestern Petroleum Corporation

Recent Developments

JANUARY 2026

Chevron Expands Condition-Monitoring Service Network

Chevron completed an organic expansion of its fleet condition-monitoring service network across Australian mining operations, adding real-time telemetry integration for autonomous haul truck fleets across multiple mine sites. The expansion supports Chevron's multi-year uptime service contracts with major mining operators ahead of expanding autonomous fleet deployment schedules.
Signal: Signals continued investment in condition-monitoring infrastructure to support long-term uptime contracts with autonomous fleet operators worldwide.
AUGUST 2025

FUCHS Petrolub Signs Equipment Manufacturer Warranty Agreement

FUCHS Petrolub entered a formal warranty partnership agreement with a major mining equipment manufacturer to provide approved synthetic lubricants across new haul truck platforms and vehicle programs worldwide. The agreement reflects growing equipment manufacturer preference for certified lubricant partnerships covering warranty compliance nationwide and beyond.
Signal: Signals equipment manufacturers formalizing lubricant partnerships to protect warranty compliance across new autonomous fleet platforms worldwide.
APRIL 2025

Sinopec Expands Chinese Mining Lubricant Production Capacity

Sinopec completed an organic expansion of its mining lubricant production capacity in Shandong province, adding blending lines for both conventional and specialty synthetic formulations serving global customers worldwide today and beyond. The expansion strengthens Sinopec's position serving China's expanding coal and metals mining equipment fleet base.
Signal: Signals Chinese domestic producers scaling capacity to reduce reliance on multinational specialty lubricant imports over time.

Base Oil Volatility Shapes Formulator Margins

Base oil and performance additives together represent roughly 52 percent of cost of goods sold for lubricant formulators, with the balance split across packaging, logistics, and blending labor costs. Base oil supply traces mostly to major refinery operations concentrated along the US Gulf Coast, in the Middle East, and across East Asian petrochemical complexes and refining hubs.
The 2025 Gulf Coast refinery outage cluster, triggered by unplanned maintenance shutdowns, pushed Group II and Group III base oil spot prices up roughly 20 percent within a single quarter, according to EIA petrochemical feedstock reporting. Formulators without long-term indexed base oil contracts absorbed the spike directly into margins, while those with locked annual pricing agreements passed only modest increases through to mining customers. The episode pushed several formulators to diversify base oil sourcing across multiple regional refineries.

Smaller regional formulators lacking multi-year indexed base oil contracts face genuinely sharper margin swings than multinational competitors who negotiate volume-based pricing locks with major refiners directly. This exposure varies meaningfully by geography too, since synthetic formulators face additional Group IV and Group V base stock cost premiums that conventional formulators largely avoid, compounding the disadvantage for undiversified regional players.
mining-lubricants-market-cost-volatility-analysis-1787554441988

Diversify Base Oil Sourcing Across Multiple Refineries

Formulators are qualifying secondary base oil suppliers across multiple regions rather than relying entirely on single-source Gulf Coast contracts, reducing exposure to any single refinery disruption event entirely. This diversification adds modest logistics complexity but has proven worth the cost given repeated feedstock volatility episodes across recent years in the category overall each cycle.

Negotiate Multi-Year Indexed Base Oil Agreements

Large formulators increasingly lock in multi-year base oil pricing agreements indexed to published feedstock benchmarks, trading some negotiating leverage on price for genuine predictability in annual budgeting cycles each year. Smaller players lacking sufficient purchase volume to negotiate favorable index terms remain exposed to spot market pricing, widening the margin gap between scaled and regional competitors.

Portfolio Architecture for Margin Defence

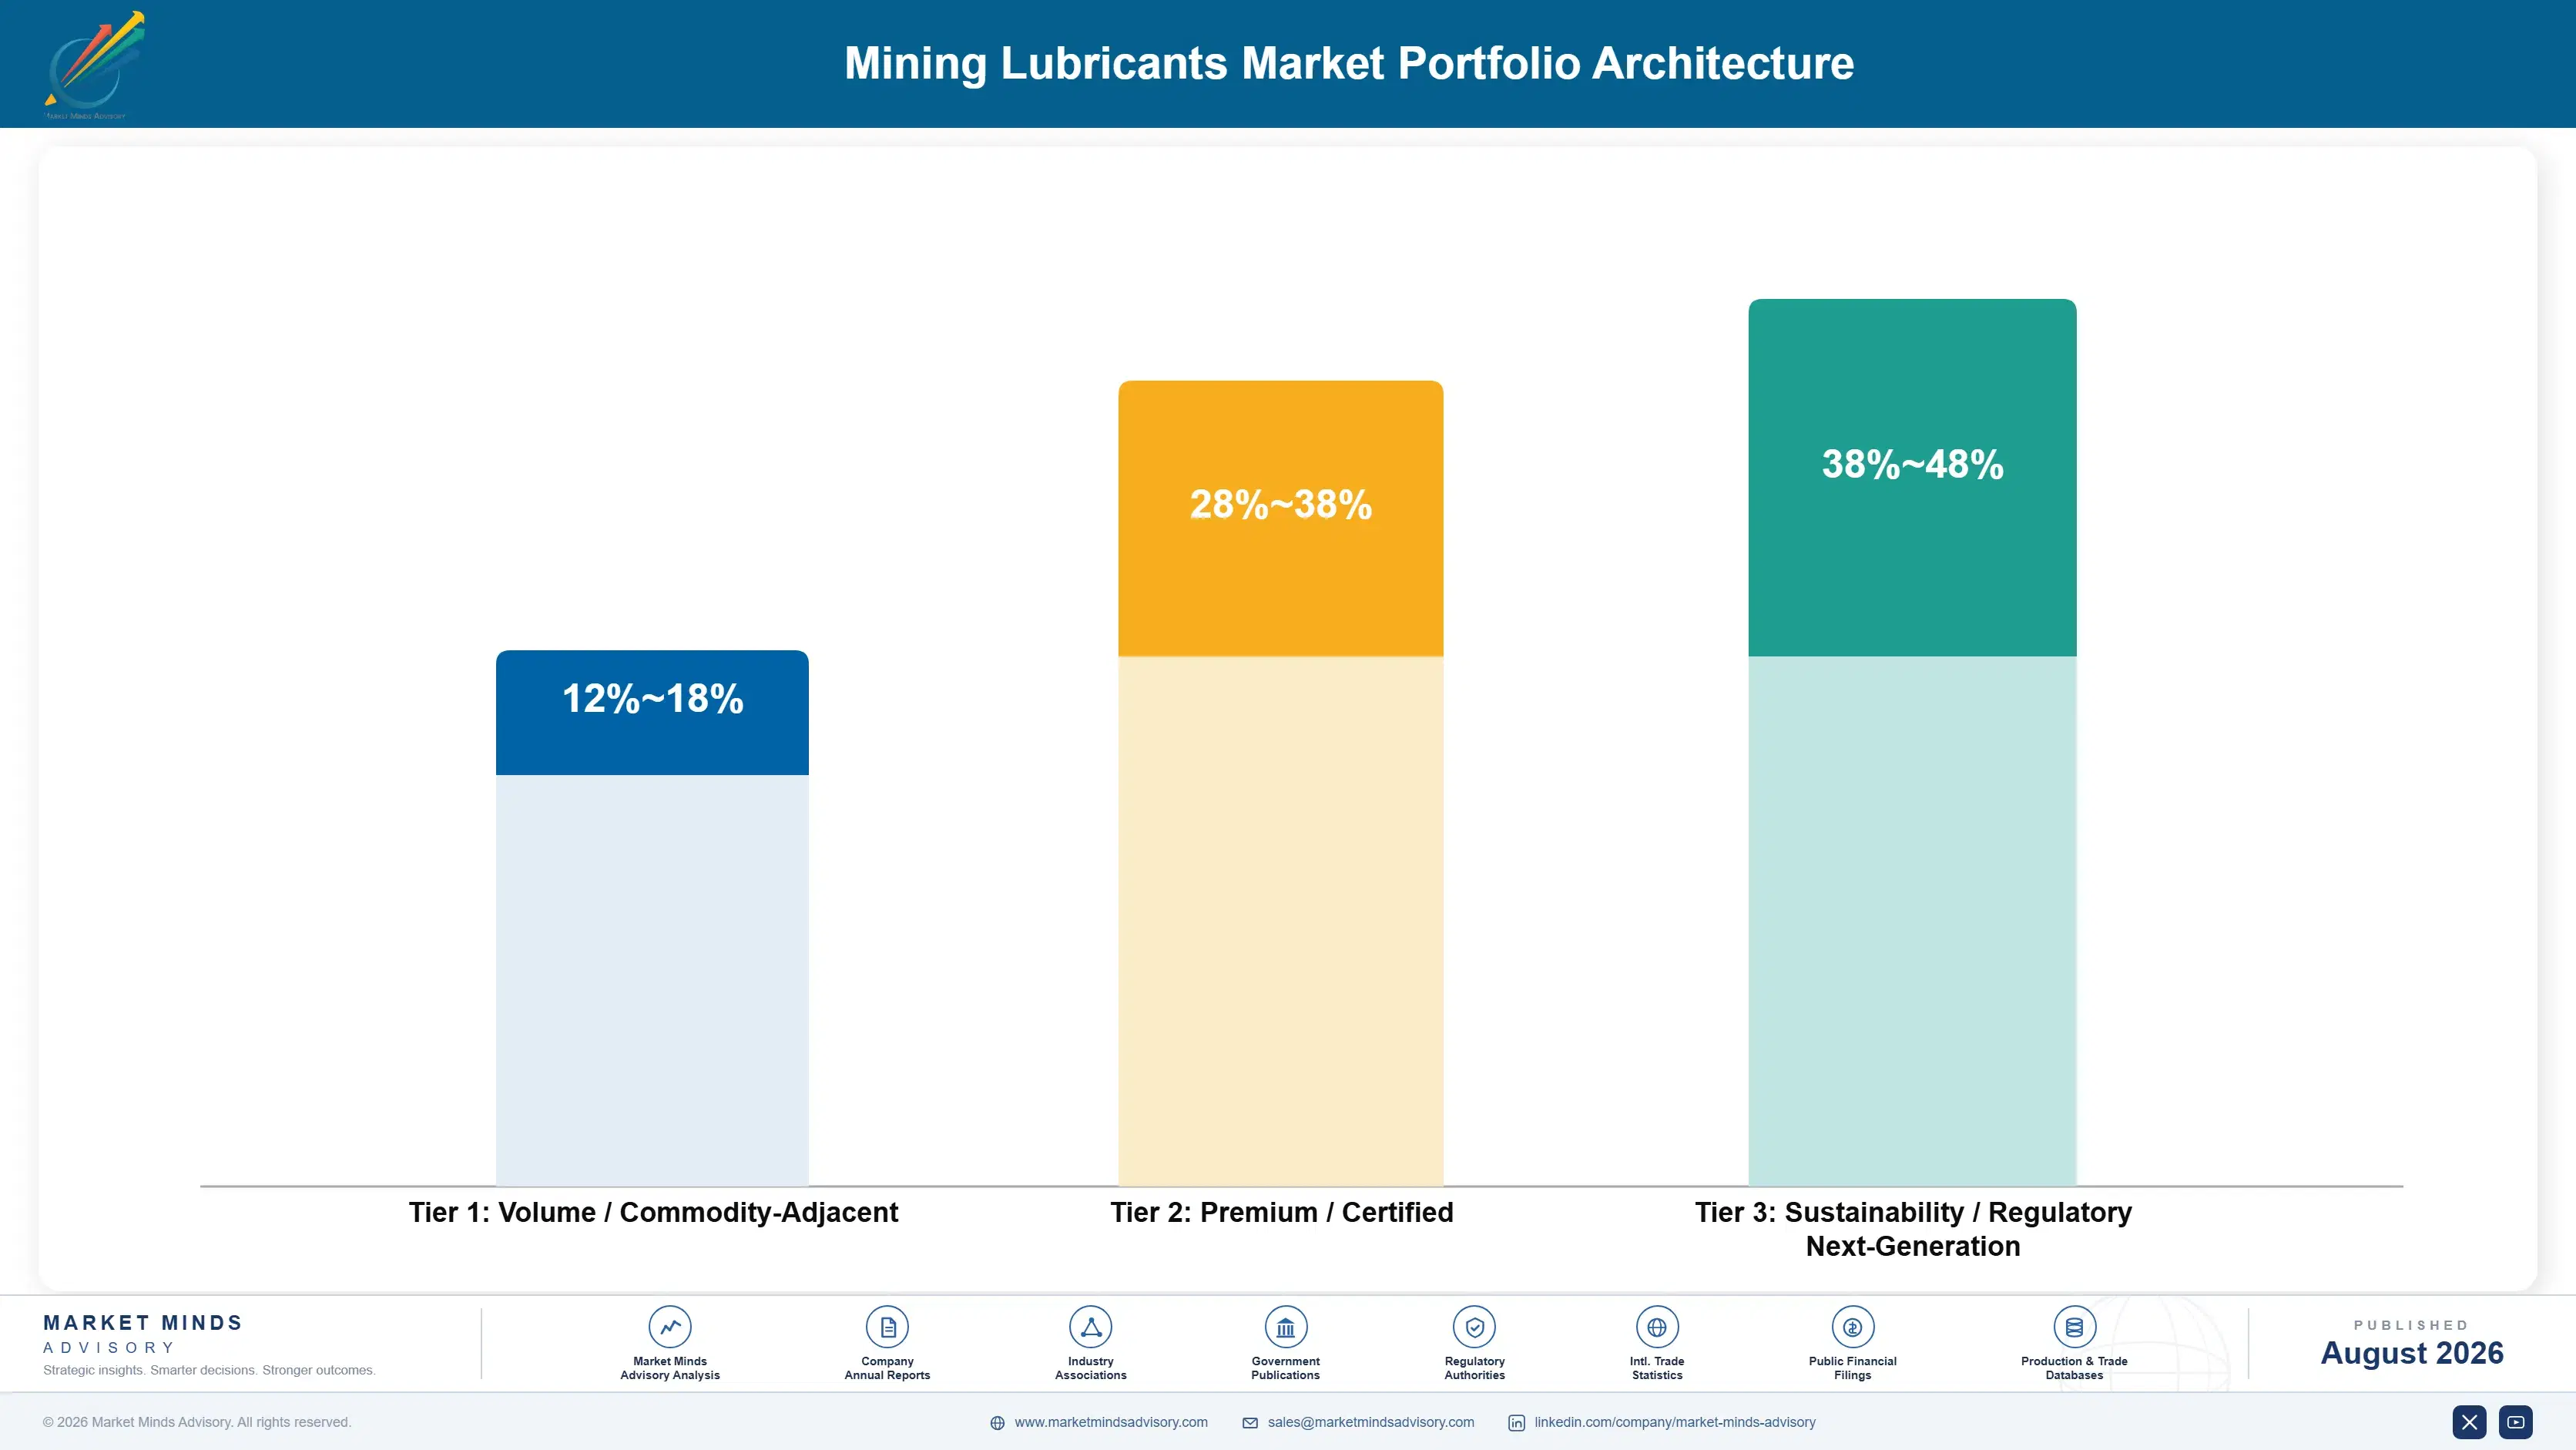
Portfolio economics split cleanly along three tiers, with gross margins ranging from the low teens for commodity conventional lubricants to well above 40 percent for synthetic and condition-monitored formulations sold into premium autonomous fleet accounts. Commodity products compete almost entirely on delivered cost per unit, since general mining fleets treat them as interchangeable products purchased through bid-based tender processes that repeat annually across most large accounts.
Specialty formulations capture disproportionate value because synthetic certification barriers and equipment manufacturer warranty relationships genuinely limit competitive entry, letting incumbents sustain pricing power that commodity products cannot match at all. The tension between volume and premium tiers plays out most visibly in autonomous fleet accounts, where operators balance procurement cost pressure against uptime guarantees demanded by remote operations across multiple mine sites.

High-value pools concentrate specifically in autonomous fleet and condition-monitoring applications, where uptime guarantees and formulation consistency command the steepest premiums available anywhere in the category. Equipment warranty-driven formulations remain a smaller but scaling tier as manufacturer partnerships convert what was once a commodity relationship into a genuine growth pool for early-mover specialty suppliers positioning ahead of demand.

Volume / Commodity-Adjacent

Conventional engine oils and gear lubricants sold through bid-based commodity mining tenders where delivered cost per unit is the dominant purchasing criterion. Competitive intensity is highest here, with margin protection resting almost entirely on refining scale.
Gross Margin: 12-18%

Premium / Certified

Synthetic hydraulic and gear formulations carrying equipment manufacturer warranty approval, sold primarily into premium and autonomous fleet accounts worldwide. Certification barriers protect pricing power against commodity substitution from unqualified competitors in the broader market.
Gross Margin: 28-38%

Sustainability / Regulatory / Next-Generation

Condition-monitored synthetic formulations paired with fleet telemetry services, plus emerging biodegradable lubricant chemistries used across multiple applications. Smaller in absolute volume today but scaling fast as autonomous fleet adoption accelerates across major mining regions.
Gross Margin: 38-48%
mining-lubricants-market-portfolio-architecture-1787554442677

High-value Sub-segments and Strategic Watch-out

Autonomous Fleet Condition-Monitoring Contracts

High-value and high-growth given accelerating autonomous haul truck deployment globally and expanding condition-monitoring service adoption specifically across most major markets today and well into the future. Contracts here command the category's steepest margins, and demand is compounding as automation scales worldwide each year without exception.
Gross Margin: 40-50%

Equipment Manufacturer Warranty Partnerships

High-value with moderate but steady growth as equipment manufacturers continue formalizing approved lubricant partnerships under multi-year warranty agreements across most product lines, platforms, and vehicle classes. Margins here remain attractive though growth trails the autonomous tier since partnership penetration is already substantial among leading manufacturers.
Gross Margin: 28-38%

Conventional Commodity Fleet Lubricants

Volume core segment representing the largest absolute revenue base across general mining fleet accounts worldwide, though margins stay thin given bid-based procurement practices repeated annually across most markets, regions, and mineral categories. This tier anchors total category volume even as growth concentrates elsewhere in the portfolio.
Gross Margin: 12-18%

Commodity Downturn Spending Exposure

Strategic watch-out as commodity price cycles reshape maintenance spending across most producing regions and mineral types worldwide each cycle, since suppliers reliant on discretionary service contracts risk revenue volatility during downturns. This tier could shift material share toward suppliers with locked long-term contracts within several years.
Gross Margin: 15-30%

Annuity Demand, Fleet-Locked Stickiness

Mining lubricant purchasing behaves like an annuity once a supplier completes fleet condition-monitoring integration, since consumption tracks equipment operating hours rather than discretionary demand that swings independently with economic conditions. Fleet operators rarely switch suppliers mid-contract given the telemetry integration costs and equipment warranty risk involved, giving incumbent formulators genuinely durable revenue visibility years into the future once an account is won.
Adoption stickiness varies meaningfully by end-use vertical. Autonomous fleet accounts show the deepest entrenchment, since operators rarely requalify an alternate lubricant supplier absent a specific equipment failure or service breakdown mid-deployment. Conventional fleet accounts switch more readily, chasing modest price concessions at contract renewal since performance specifications there are less stringent than autonomous applications. Equipment manufacturer-approved accounts sit in between, balancing warranty compliance against cost sensitivity.

Generational buyer shifts are underway as younger fleet management and procurement staff, more comfortable evaluating telemetry data and total cost of ownership models, replace veteran purchasing managers who prioritized price and supplier familiarity above all else. This transition favors suppliers with genuine condition-monitoring and synthetic formulation credentials, and it is gradually eroding the advantage long held by legacy suppliers whose relationships rested mainly on tenure rather than differentiated service capability.
mining-lubricants-market-end-use-penetration-index-1787554443273

Where to Compete in Lubricants

These are among the four positions where our research anticipates prominent divergence between winners and laggards over the coming forecast period. Each is grounded in the demand model, the regulatory perimeter, and the announced capacity pipeline.
01 / CONDITION-MONITORING SERVICE INVESTMENT

Bundle Monitoring Service With Supply Now

Suppliers still selling fluid standalone are ceding the highest-margin part of this market to competitors bundling condition-monitoring telemetry with recurring supply contracts across most fleet types. That bundled model captures roughly 30 percent higher account margins and creates genuine switching costs that protect volume through contract renewal cycles year after year. Any supplier without a monitoring strategy by 2028 risks permanent exclusion from the largest autonomous fleet accounts, where operators now expect a single integrated vendor relationship covering both fluid and telemetry.
02 / EXTENDED INTERVAL CERTIFICATION PRIORITY

Fund Certification Now Before Barriers Rise Further

Extended service interval certification is becoming table stakes for autonomous fleet procurement, not a differentiator, and formulators delaying that investment will find themselves locked out of tender shortlists entirely within a few years from now and beyond. Certified formulations already command 20 to 28 percent price premiums, and that gap will widen as fleet operators tighten documentation requirements further across most regions. Mid-sized players lacking dedicated testing capacity should partner or acquire rather than build that capability from scratch given the time pressure involved.
03 / WARRANTY PARTNERSHIP EXPANSION

Secure Manufacturer Partnerships Before Rivals Do

Equipment manufacturer warranty partnerships are becoming the category's most defensible position, not a marketing credential, and suppliers delaying that investment will find themselves excluded from new equipment platforms entirely within a few years from now and beyond. Approved partners already command 15 to 22 percent higher pricing, and that gap will widen as manufacturers formalize approved supplier lists further across major platforms and vehicle classes. Suppliers without partnerships should pursue them now, before manufacturers lock in exclusive arrangements with rivals.
04 / BASE OIL SOURCING DIVERSIFICATION

Diversify Base Oil Sourcing Before Volatility Repeats

Base oil costs are volatile enough that formulators relying on single refinery relationships face genuine margin risk within the next several price cycles ahead of most current forecasts and market projections available today across the entire industry. Formulators still dependent on single-source contracts should diversify supplier relationships now, rather than waiting for the next refinery disruption to force a costly and disruptive reactive response later on down the road. Waiting risks ceding margin entirely to better-diversified competitors positioning right now.

Engagement Snapshot From the Field

A live engagement with an industry participant carrying material or product regulatory and market exposure ahead of a defining policy shift, showing how our research translates into a defensible multi-year portfolio strategy.
MARKET MINDS ADVISORY · CLIENT ENGAGEMENT SUMMARY
Mining Lubricants Producer Strategic Portfolio Review and Transition Roadmap 2026·Investment Scenario on Mining Lubricants Exposure Evaluation 2025-26
CLIENT PROFILE
The client operates a mid-sized iron ore mining operation across three Western Australian sites, currently transitioning its haul truck fleet toward autonomous operation over a multi-year rollout. Facing rising maintenance costs and unplanned downtime on its existing autonomous vehicles, leadership sought an independent assessment of its lubricant sourcing strategy ahead of a multi-year vendor contract renewal covering all three sites.
STRATEGIC CHALLENGE
The client's existing lubricant contract relied on conventional fluids with calendar-based replacement schedules, but leadership lacked clarity on whether switching to condition-monitored synthetic formulations would reduce total cost of ownership enough to justify the premium pricing and telemetry integration investment required across all three operating sites and their equipment fleets.
MMA APPROACH
MMA benchmarked the client's current maintenance costs against comparable autonomous fleet operators, modeled total cost of ownership under both conventional and condition-monitored synthetic scenarios, and interviewed fleet managers at three peer operations directly to surface real-world downtime and cost tradeoffs that sat beyond the headline pricing comparison presented by vendors.
KEY FINDINGS
  1. Condition-monitored synthetic lubricants would have cost approximately 25 percent more upfront but reduced measured unplanned downtime incidents significantly across comparable autonomous fleet deployments.
  2. Peer operations using condition-monitoring reported meaningfully lower total maintenance cost per operating hour once reduced downtime was factored against the higher upfront lubricant pricing.
  3. The telemetry integration investment required upfront capital spending that peer operators typically recovered within eighteen months through reduced unplanned maintenance events and lower parts replacement costs overall.
  4. Conventional lubricants remained cost-competitive for the client's non-autonomous equipment fleet, suggesting a hybrid approach rather than a full fleet-wide conversion across every site and equipment category.
CLIENT PROFILE
The client operates a mid-sized iron ore mining operation across three Western Australian sites, currently transitioning its haul truck fleet toward autonomous operation over a multi-year rollout. Facing rising maintenance costs and unplanned downtime on its existing autonomous vehicles, leadership sought an independent assessment of its lubricant sourcing strategy ahead of a multi-year vendor contract renewal covering all three sites.
STRATEGIC CHALLENGE
The client's existing lubricant contract relied on conventional fluids with calendar-based replacement schedules, but leadership lacked clarity on whether switching to condition-monitored synthetic formulations would reduce total cost of ownership enough to justify the premium pricing and telemetry integration investment required across all three operating sites and their equipment fleets.
MMA APPROACH
MMA benchmarked the client's current maintenance costs against comparable autonomous fleet operators, modeled total cost of ownership under both conventional and condition-monitored synthetic scenarios, and interviewed fleet managers at three peer operations directly to surface real-world downtime and cost tradeoffs that sat beyond the headline pricing comparison presented by vendors.
KEY FINDINGS
  1. Condition-monitored synthetic lubricants would have cost approximately 25 percent more upfront but reduced measured unplanned downtime incidents significantly across comparable autonomous fleet deployments.
  2. Peer operations using condition-monitoring reported meaningfully lower total maintenance cost per operating hour once reduced downtime was factored against the higher upfront lubricant pricing.
  3. The telemetry integration investment required upfront capital spending that peer operators typically recovered within eighteen months through reduced unplanned maintenance events and lower parts replacement costs overall.
  4. Conventional lubricants remained cost-competitive for the client's non-autonomous equipment fleet, suggesting a hybrid approach rather than a full fleet-wide conversion across every site and equipment category.
RECOMMENDED STRATEGY
Phase 1: Convert the autonomous haul truck fleet to condition-monitored synthetic lubricants under the renewed multi-year vendor contract covering all three sites. Phase 2: Retain conventional lubricants for non-autonomous equipment fleets where condition-monitoring investment would not justify the additional upfront cost incurred at this time. Phase 3: Negotiate telemetry integration cost-sharing with the vendor tied directly to documented downtime reduction performance measured over the full contract term.
OUTCOME
The client adopted the hybrid strategy, converting the autonomous fleet to condition-monitored synthetic lubricants while retaining conventional fluids (client-reported, unverified by MMA) for non-autonomous equipment across all sites. Unplanned downtime incidents declined measurably within the first year, and the telemetry investment tracked toward the projected recovery timeline.

Frequently Asked Questions

Foundational context covering the market sizes, CAGR, scope, country, region and competition that inform every finding below. This section is provided to cover basics and most often pre-purchase conversations, answered from the MMA Primary Research Dataset.

What is the current size of the Mining Lubricants Market?

The global market reached an estimated 8.5 billion dollars in 2025. Growth is driven mainly by autonomous fleet expansion and extended service interval formulation demand worldwide.

How large will the Mining Lubricants Market be by 2036?

The market is projected to reach approximately 13.79 billion dollars by 2036. That represents a 1.55 times expansion over the eleven-year forecast period from 2026 onward.

What is the CAGR for the Mining Lubricants Market 2026 to 2036?

The market is forecast to grow at a 4.5 percent compound annual rate through 2036. Bull and bear scenarios range from 3.3 to 5.7 percent depending on autonomous fleet adoption pace.

Which segment is growing fastest?

Specialty and synthetic lubricants for extreme conditions lead growth at a 7.5 percent CAGR, roughly 1.7 times the overall market rate. Autonomous fleet deployment drives this outsized pace.

Who are the major companies in the Mining Lubricants Market?

ExxonMobil, Shell, Chevron, TotalEnergies, and FUCHS Petrolub lead the competitive field globally. Together they hold a 42 percent combined revenue share across the global market.

Which country is growing fastest?

Australia leads country-level growth at a 6.0 percent CAGR, outpacing the global average meaningfully. Expanding autonomous haul truck fleets and condition-monitoring adoption both underpin that pace.

Report Segmentation Architecture

The full report scope spans multiple orthogonal segmentation dimensions, with cross-tabulated demand data provided for each dimension pair. Coverage extends further to regional breakdowns, trend trajectories, and the competitive detail needed to support segment-level decision-making.

By Fluid Function Type

  • Engine Oils
  • Hydraulic Fluids
  • Gear and Transmission Lubricants
  • Greases
  • Specialty and Synthetic Lubricants
  • Coolants and Process Fluids

By End-Use Equipment

  • Haul Trucks
  • Excavators and Loaders
  • Crushers and Screening Equipment
  • Conveyor Systems
  • Underground Mining Equipment

By Commercial Dimension

  • Direct Fleet Supply Contracts
  • Distributor and Channel Sales
  • Condition-Monitoring Service Agreements
  • Equipment Manufacturer Warranty Programs

By Region

  • East Asia
  • North America
  • Western Europe
  • South Asia and Pacific
  • Latin America
  • Middle East and Africa
  • Eastern Europe

Scope, Methodology, and Coverage

Every figure in this report is reproducible from documented input assumptions. The scope below maps the historical period, the forecast horizon, the segmentation dimensions, and the countries covered, alongside the underlying primary and qualitative methodology.
Historical Period
2020 to 2025
Forecast Period
2026 to 2036
Base Year
2025 (USD billions; MMA Primary Research Dataset, August 2026)
Market Definition
This report covers lubricants sold for surface and underground mining equipment, including engine oils, hydraulic fluids, gear and transmission lubricants, greases, specialty and synthetic lubricants, and coolants. It excludes lubricants for on-road transport vehicles and general industrial machinery outside mining applications.
Quantitative Units
USD billions (current prices)
Segmentation Dimensions
By Fluid Function Type; By End-Use Equipment; By Commercial Dimension; By Region
Regions Covered
East Asia, North America, Western Europe, South Asia and Pacific, Latin America, Middle East and Africa, Eastern Europe
Countries Covered
USA, China, Germany, France, UK, Japan, South Korea, India, Australia, Canada, Brazil, Mexico, Indonesia, Vietnam, Thailand, Malaysia, UAE, Saudi Arabia, South Africa, Nigeria, Turkey, Poland, Netherlands, Italy, Spain, Sweden, Switzerland, Argentina, Colombia, Singapore, and additional markets relevant to this sector
Key Companies Profiled
ExxonMobil, Shell, Chevron, TotalEnergies, FUCHS Petrolub, BP Castrol, Valvoline, Petro-Canada Lubricants, Idemitsu Kosan, ENEOS Corporation, Repsol, PetroChina Lubricant, Sinopec Lubricant, Quaker Houghton, Kluber Lubrication, Whitmore Manufacturing, Bel-Ray Company, Lubrizol Corporation, Amsoil Inc, Southwestern Petroleum Corporation
Quantitative Methodology
Primary survey, n=3,800 respondents, Q4 2025, six countries; demand-side model with trade association cross-validation
Qualitative Methodology
47 expert interviews, Q4 2025; applied to validate demand model assumptions, identify emerging dynamics, and assess competitive positioning
Report Format
PDF and XLSX data workbook (Word format preview document)
Publisher
Market Minds Advisory
Report Code
MMA-2026-CON-104
Published
August 2026
Contact
sales@marketmindsadvisory.com | www.marketmindsadvisory.com

Purchase the full Mining Lubricants Market Report (2026 to 2036).

This report provides comprehensive market intelligence on the mining lubricants market, covering sizing, segmentation, competitive positioning, and regional dynamics through 2036. It draws on primary survey data, expert interviews, and company disclosures to quantify demand drivers across surface and underground mining end-use applications worldwide and across major producing regions. The analysis includes detailed competitive profiling of leading suppliers, input cost exposure assessment, and actionable revenue lever guidance for participants navigating condition-monitoring integration and synthetic certification barriers. Regional breakdowns cover all seven global regions with quantified share and growth projections.
Full ten-year market sizing and forecast data
Detailed segmentation across six fluid function categories
Competitive profiling of top twenty industry participants
Regional analysis across all seven global regions
Input cost and base oil volatility risk assessment
Strategic revenue lever and portfolio tier analysis

Built For The People Who Decide

From boardroom strategy to bench-side execution, this report is read cover-to-cover by leaders shaping the next decade of their industry, turning demand scenarios, market dynamics and valuation benchmarks into decisions.
CXOs/ Presidents/ VPs/ Managers
M&A and Corporate Development
Strategy Teams and R&D Heads
Procurement and Product Directors
Regulatory and Compliance Leaders
Investor Relations and Equity Analysts