Market Minds Advisory
Mining Equipment Market

Mining Equipment Market: Falling Grades, Electrifying Fleets, and the Aftermarket That Actually Pays

A commercial reading of mining machinery, where falling ore grades force more rock moved per tonne of metal, underground fleets electrify first on ventilation economics, and the aftermarket carries the margin.

Lead Analyst

David Horsley

Published

September 2026

Make Smarter Decisions with Customized Research Insights

Request a free sample report and evaluate market opportunities, growth trends, and competitive dynamics relevant to your business needs.

2025 MARKET VALUE$148.6BMarket Size 2025
2036 FORECAST VALUE$265.0BBase Case , 2026 to 2036
CAGR 2026 TO 20365.4 %Bull 6.7% / Bear 4.1%
INCREMENTAL OPPORTUNITY$108.4BNet 10- year value creation
EXPANSION MULTIPLE1.69x2036 value over 2026 base
Strategic Levers
M&A Pipeline
Regional Outlook
Country Rankings
Competitive Intelligence
Segmental Deep-dive
Call-Us : 91 93563 13602

Executive Snapshot and Market Trajectory

Nobody buys a haul truck because they want one. They buy it because the ore body demands more rock moved this year than last, and grades keep falling, so the tonnage needed to produce the same quantity of metal rises whether or not the mine ever expands its output.
The market stands at USD 148.6 billion in 2025 and reaches USD 265.01 billion by 2036 at a 5.4% CAGR. Underground equipment grows fastest at 7.6%, about 1.41 times the overall rate, because battery-electric machines pay back through ventilation savings that surface fleets simply cannot claim. East Asia holds 24% of value on Chinese coal and iron ore, and Indonesia posts the quickest national growth of any market at 9.2% on nickel and bauxite development.
Concentration is meaningful: the top five hold roughly 51% of equipment revenue, led by two diversified American and Japanese manufacturers, with the rest split between Nordic underground specialists and processing suppliers. Two forces are reshaping the field. Chinese manufacturers are now competitive on surface equipment price across emerging markets, while autonomy quietly binds fleets to whichever vendor's control system runs the mine plan.
Market Definition
The mining equipment market covers machinery used to extract, move, and process ore and overburden at mine sites, spanning surface mining equipment, underground mining equipment, crushing and grinding and mineral processing equipment, material handling and conveying equipment, and drilling and boring equipment, together with the parts and service revenue attached to those machines. Mine construction, exploration services, smelting and refining plant, and mine site power generation are excluded.
Base Year Value
$148.6B in 2025 (MMA Primary Research Dataset, August 2026)
Forecast Period
2026 to 2036, eleven discrete annual values
CAGR
5.4% base case. Bull 6.7%. Bear 4.1%.
Fastest Growth Segment
Underground Mining Equipment: 7.6% CAGR
Fastest Growth Country
Indonesia: 9.2% CAGR
Fastest Growth Region
South Asia and Pacific: 7.5% CAGR
Largest Region
East Asia: 24% of 2025 global value
Market Leaders
Caterpillar, Komatsu, Sandvik, Epiroc, Metso. Source: MMA Analysis based on company annual reports.
Primary Survey
n=3,800 procurement and R&D decision-makers, Q4 2025, six countries
Methodology
Demand-side build-up, cross-validated against public data, 47 expert interviews

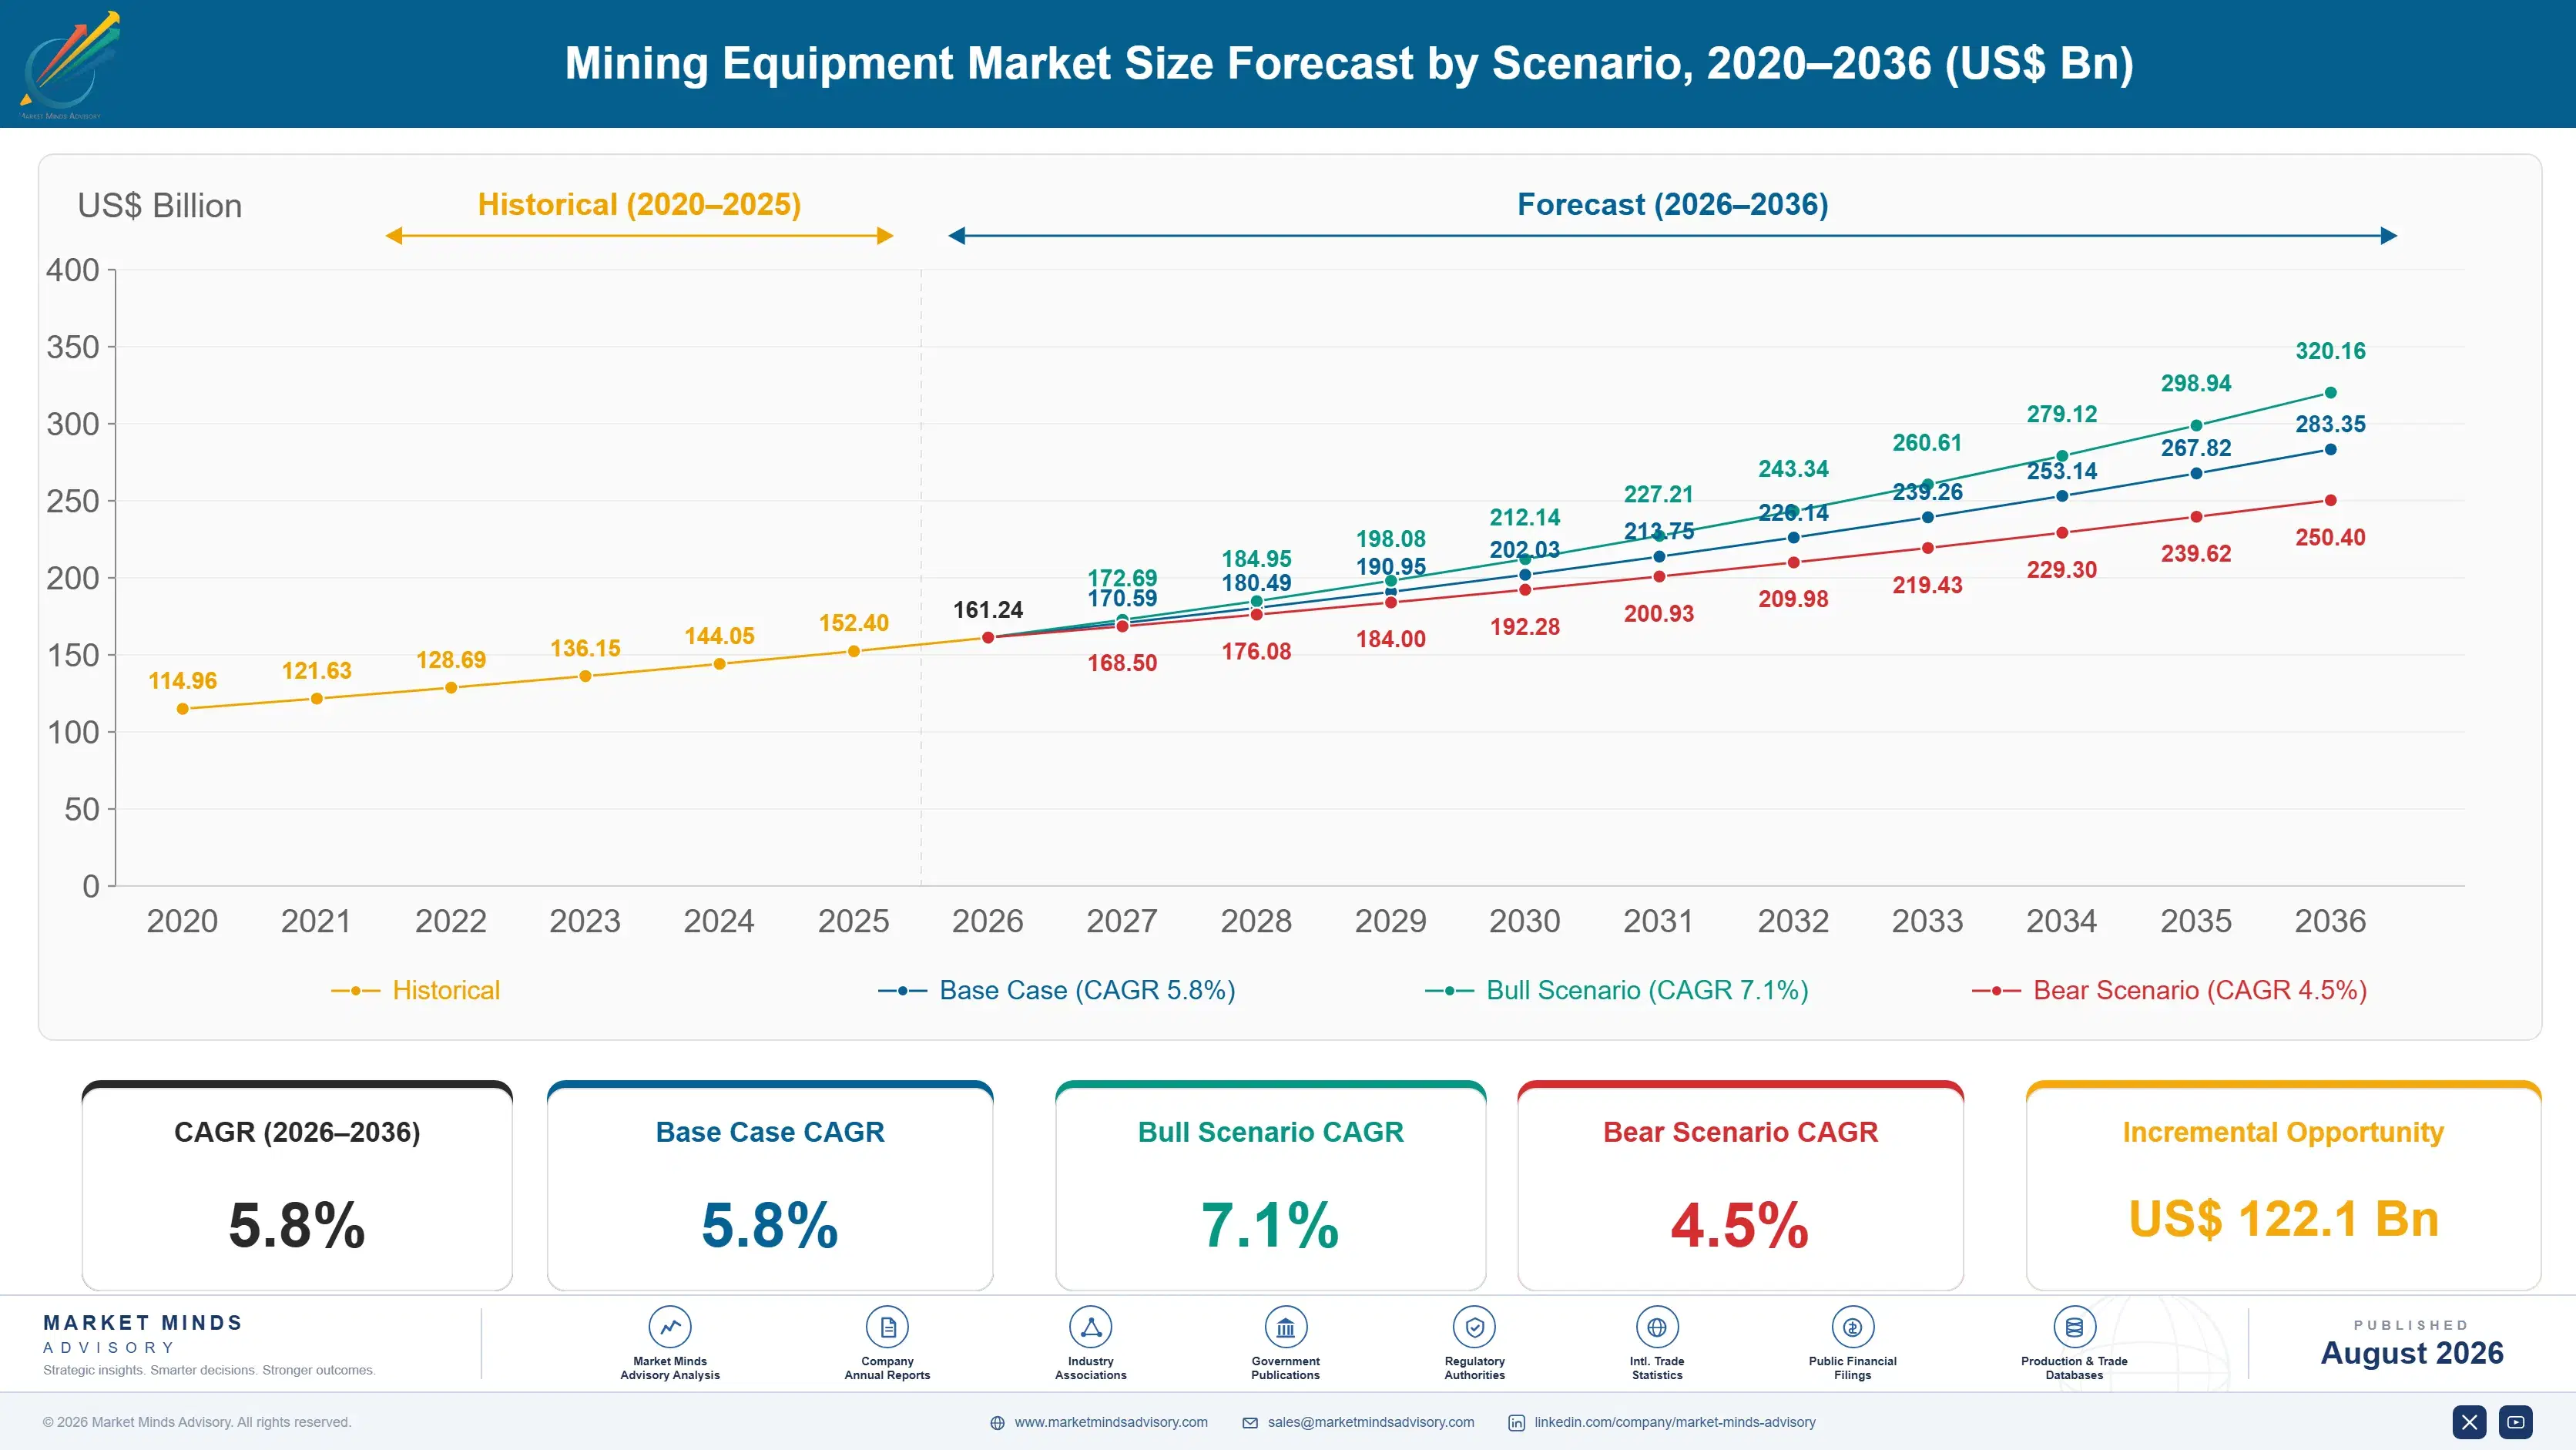
Mining Equipment Market Forecast Scenarios

mining-equipment-market-size-forecast-scenario-1787324359852
Growth from 2020 to 2025 compounded near 4.8%, held back early by pandemic capex freezes before commodity prices recovered sharply. Copper, lithium, and nickel investment cycles turned decisively upward from 2022, and miners that had deferred fleet replacement for years returned to purchasing at once, which is why the historical average understates the pace exiting the period.
Three mechanisms carry the base case to 5.8%. First, critical minerals capex: copper, lithium, nickel, and cobalt projects are expanding output regardless of near-term price swings because downstream demand commitments already exist. Second, automation retrofit: fleet operators are buying control systems onto existing iron rather than only onto new units, widening the addressable base considerably. Third, decarbonisation-driven replacement, as underground operators swap diesel units for battery-electric ones to cut ventilation capital cost.
The bull case at 7.1% assumes critical minerals capex holds through a full commodity cycle and automation retrofit spreads beyond the largest miners to mid-tier operators. The bear case at 4.5% assumes a copper or lithium price correction freezes discretionary capex again, and that underground electrification slows as battery costs and charging infrastructure investment prove harder to justify than ventilation savings alone suggest.

Why Falling Grades Sell More Machines

Three forces set demand. Ore grades keep declining across copper, gold, and nickel, so producing the same metal means moving more rock every year, which consumes fleet hours regardless of whether output rises. Critical mineral demand is funding genuine new mine development for the first time in a decade. And electrification plus autonomy is raising the price of each replacement machine well above the one it retires, lifting market value faster than unit volumes.
MARKET CONCENTRATIONCR5: 51%Five global manufacturers dominate a capital-intensive equipment field
FLEET REPLACEMENT CYCLE7 to 12 yearsWorking life before a haul truck is rebuilt or replaced
AFTERMARKET REVENUE SHAREAbout 45%Parts and service as a portion of total supplier revenue
EQUIPMENT AVAILABILITY70% to 85%Uptime achieved on well-maintained fleets at large operations
BATTERY-ELECTRIC FLEET SHAREUnder 3%Portion of the operating fleet running on battery power
ORDER LEAD TIME9 to 18 monthsInterval between order placement and machine delivery onsite
The commercial character is cyclical, capital-heavy, and unusually service-dependent. A large haul truck costs several million dollars and works a decade, but the parts and service attached to it over that life earn more than the original sale did. Miners buy on cost per tonne moved rather than on purchase price, which rewards suppliers who can prove availability. Downtime at a producing mine costs more per hour than most machines are worth.
The next decade turns on two contests. Whether battery-electric machines move from underground trials into surface production fleets, where the duty cycles are far harder to serve. And whether autonomy consolidates around a few fleet management systems, because a mine running one vendor's autonomous system faces real friction buying another vendor's trucks.
"Miners will tell you they buy on price. Watch what they actually do and it is availability, every time. A truck that costs 15% more and runs three more shifts a month wins the tender, and the finance director signs it without blinking."
Director, Mining and Heavy Equipment Practice · MMA Industrial Equipment / Minin

Market Trends

Battery-Electric Machines Reach Underground Production Fleets

Underground mining is where electrification pays first, and the reason is ventilation rather than fuel. A diesel machine underground requires forced air to dilute exhaust, and ventilation can consume a large share of a deep mine's total electricity, so removing diesel removes that load. Sandvik and Epiroc both sell battery-electric loaders and trucks into production fleets rather than trials, and several deep operations now specify battery machines as standard. Caterpillar has deployed battery-electric large mining trucks with customers under its Early Learner programme, though surface duty cycles remain far harder to serve than underground ones.
Market Impact: Copper demand doubles by 2040
Autonomous Haulage Moves From Pilot To Standard Specification

Autonomous haul trucks have passed the demonstration stage at the largest iron ore and copper operations, with fleets in the Pilbara and Chilean copper belt running under production conditions rather than trial protocols. The commercial consequence reaches past labour cost: an autonomous fleet runs on one vendor's control system, and adding a competitor's truck to it is technically possible but commercially awkward. Komatsu and Caterpillar both sell autonomy as an attached system rather than a standalone product, which turns a truck purchase into a decade-long platform decision for the mine.
Market Impact: Copper grades fell below 0.6%

Market Opportunities and Growth Drivers

Critical Mineral Demand Lifts Mine Development Capital

The IEA projects clean energy technologies will require several times today's volume of copper, lithium, nickel, and graphite by 2040, and meeting that means new mines rather than harder work at existing ones. Capital is flowing accordingly: Indonesian nickel, Chilean and Peruvian copper, Australian lithium, and African copper and cobalt have all seen genuine development commitments rather than study spending. New mines buy complete fleets rather than replacement units, which is a materially different order profile. This is the first sustained development cycle the industry has seen since the last commodity boom ended.
Market Impact: Orders fell over 30% in 2020

Ore Grades Fall, Forcing More Material Moved

Average copper head grades have declined steadily for decades, and gold and nickel show the same pattern, so producing a constant quantity of metal now demands substantially more rock excavated, hauled, crushed, and ground. That translates directly into fleet hours, tyre wear, and grinding media consumption, none of which depend on the mine expanding output at all. It also shifts value toward crushing and grinding equipment, since lower grade ore means more tonnes through the mill for the same metal recovered. Falling grades are the most dependable demand driver in this market.
Market Impact: Vacancies exceed 10% at remote site

Market Restraints and Challenges

Commodity Price Cycles Swing Equipment Orders Violently

Mining capital expenditure tracks commodity prices with a lag, and equipment orders amplify that swing rather than smoothing it. The root cause is that fleet renewal is deferrable: a miner facing weak prices runs machines past normal rebuild intervals and postpones replacement for a year or two without immediate production loss. That deferral is exactly what happened in 2015 and again in 2020, and both times orders fell far more than mine output did. Suppliers respond by building aftermarket revenue, which holds up through downturns because deferred machines need more parts, not fewer.
Market Impact: Ventilation is 40% of underground p

Skilled Operator And Technician Shortages Constrain Deployment

Mines cannot find enough qualified operators, maintenance technicians, and electricians, particularly at remote sites, and the shortage worsens as experienced staff retire. The root cause is location and demographics rather than pay: fly-in operations struggle to attract younger workers regardless of wage. The commercial impact reaches the supplier directly, since a mine that cannot staff a machine will not order it. Responses include autonomy, which removes the operator entirely, remote operating centres in cities rather than at the mine, and supplier-run maintenance contracts that bring the technicians with the equipment.
Market Impact: Autonomy lifts utilisation about 15
3 additional market trends, 4 additional growth drivers, and 2 additional restraints and challenges are covered in the full report. Contact sales@marketmindsadvisory.com to access the complete intelligence.

Segment CAGR and Growth Architecture

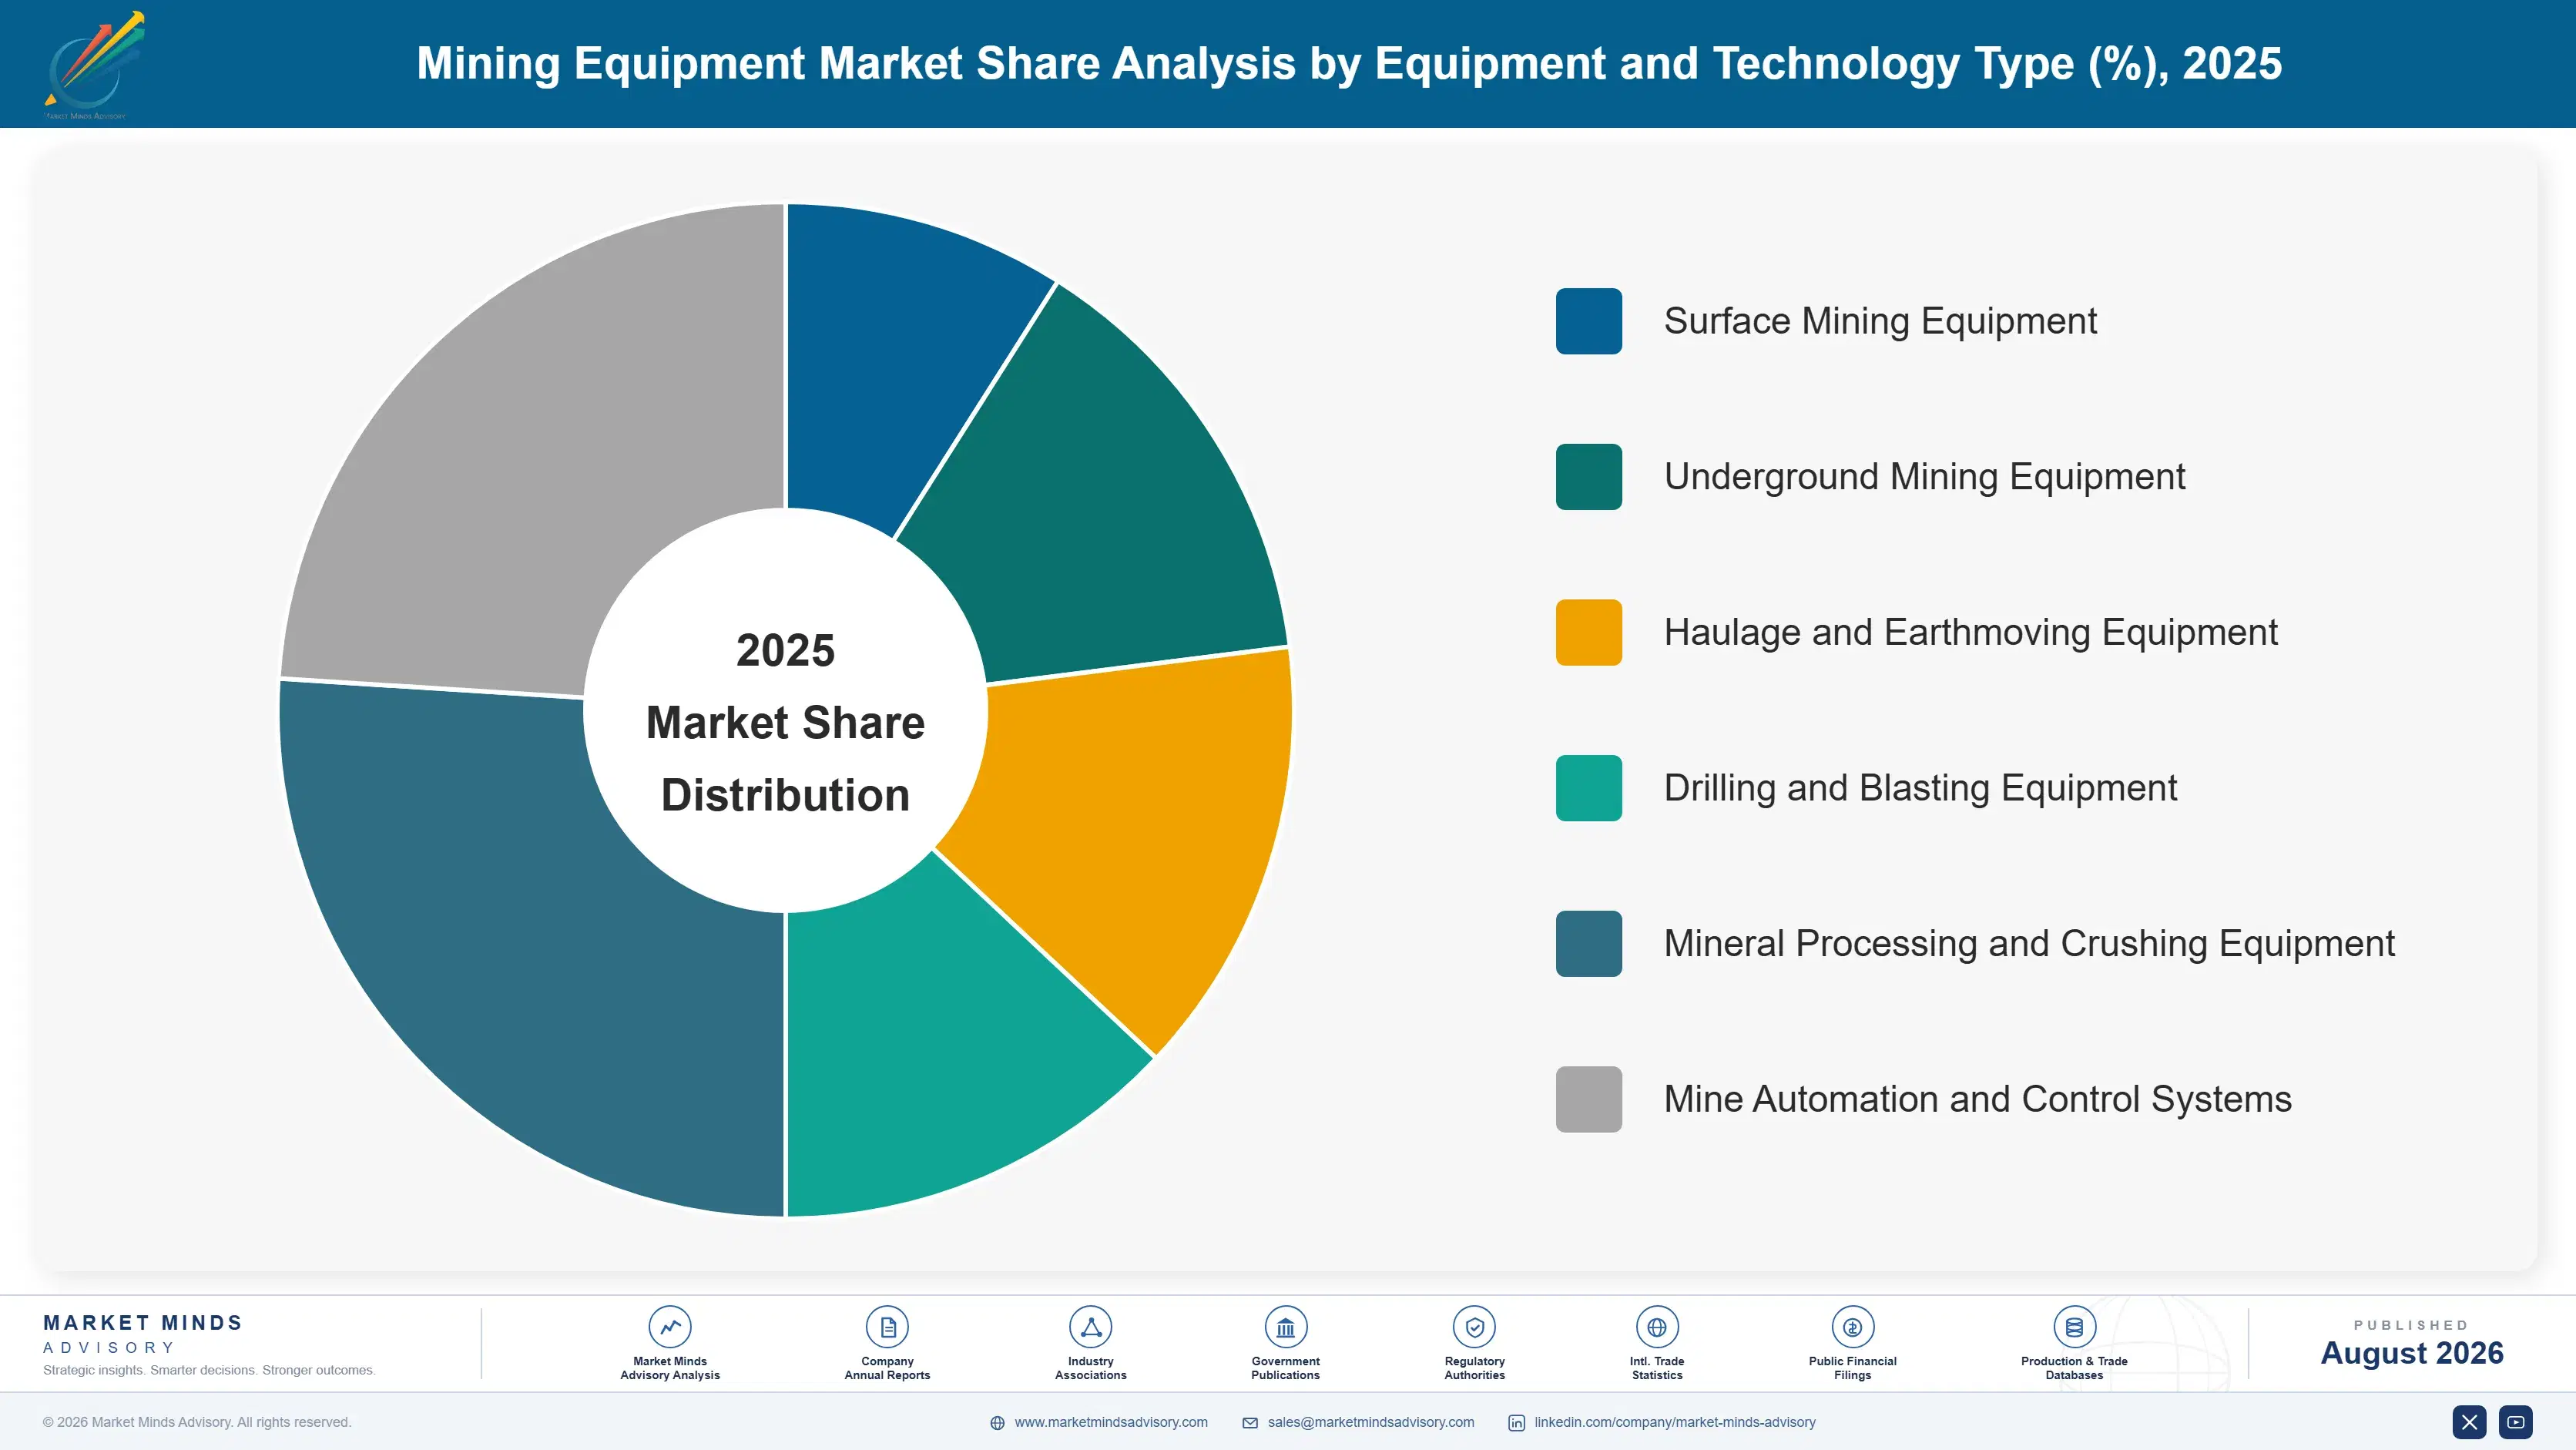
Segmentation follows equipment function, a single mechanical logic describing what the machine physically does to rock. Each function carries its own duty cycle, replacement interval, and competitive set, so commercial position tracks the machine rather than the commodity being mined. End-use mineral and the commercial model each appear separately within the framework as distinct dimensions.
mining-equipment-market-market-share-analysis-1787324360385

Underground Mining Equipment

Underground equipment grows fastest at 7.6%, about 1.41 times the overall 5.4% rate, covering load-haul-dump machines, underground trucks, development and production drill rigs, roof bolters, and continuous miners. Growth comes from two directions that reinforce each other. Deposits are getting deeper as near-surface ore is exhausted, pushing more production underground, and underground is where battery-electric machines pay back fastest because removing diesel removes the ventilation load that dilutes its exhaust. Sandvik and Epiroc lead a category where the Nordic specialists hold positions the diversified majors have never fully matched. Machines are smaller and replaced considerably more often than surface equipment does, which lifts unit turnover across the whole installed base.
CAGR 7.6%

Crushing, Grinding, and Mineral Processing Equipment

Crushing, grinding, and mineral processing equipment grows at 6.2%, the second-fastest function, spanning jaw and cone crushers, semi-autogenous and ball mills, screens, flotation cells, and separation equipment. Falling ore grades drive this category more directly than any other: lower grade means more tonnes through the mill for the same metal recovered, so throughput requirements rise even at flat production. Grinding also consumes an enormous share of a mine's electricity, which puts energy efficiency at the centre of every equipment decision. Metso, FLSmidth, and Weir all hold strong positions here, and the consumable wear parts attached to these machines generate steady revenue that is entirely independent of the mining capital cycle.
CAGR 6.2%
Full segment breakdown across 5 segments available in the complete report.

Regional Architecture and Country Demand Map

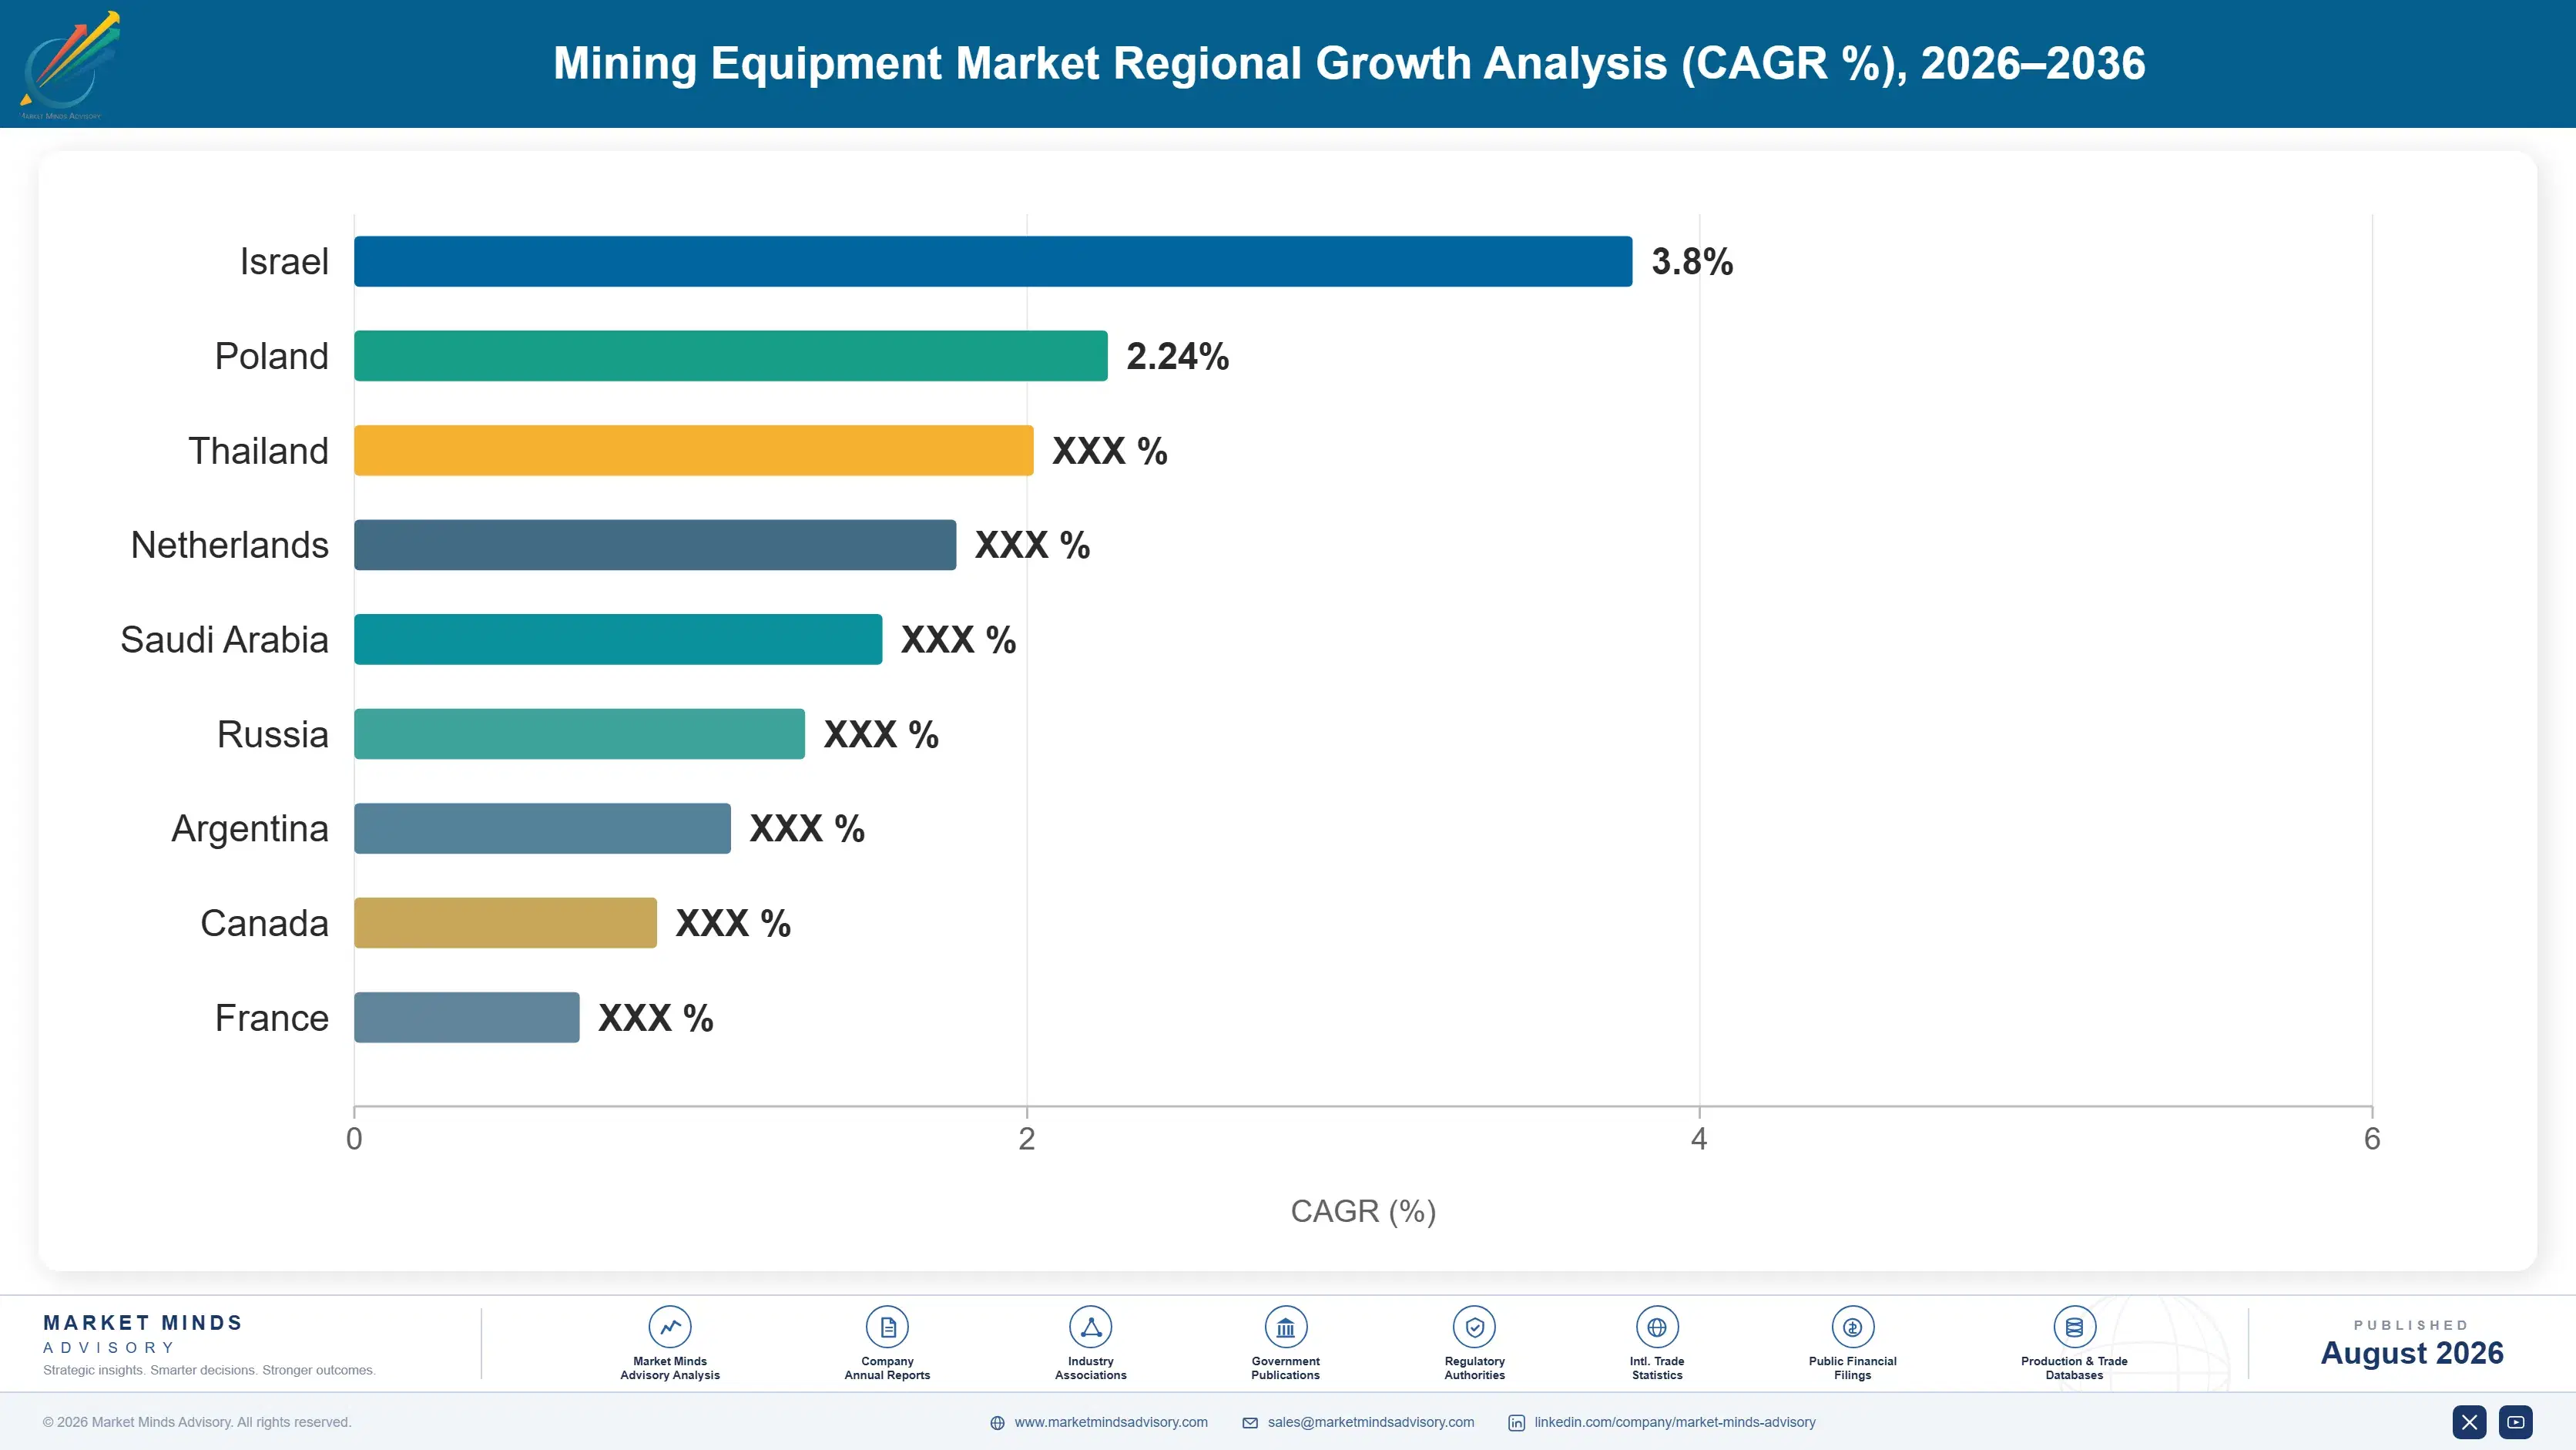
Demand follows ore bodies rather than population, so the distribution looks unlike most industrial markets. East Asia and North America lead on scale, but South Asia and Pacific, Latin America, and Africa run well above their usual weight because that is where the copper, iron ore, nickel, and gold are.

North America

Coal decline offset by copper, gold, and potash keeps North America at 22% of value, inside the 22 to 32% band. American and Canadian operations run some of the world's largest surface fleets, and Nevada gold, Arizona copper, and Saskatchewan potash all sustain steady replacement demand. Caterpillar headquarters here and holds a domestic position no competitor approaches, supported by a dealer network that is itself a barrier to entry. Canadian underground operations in Ontario and Quebec have been among the earliest adopters of battery-electric equipment, driven by deep mines where ventilation costs are punishing. Growth of 5.0% reflects a mature market where replacement and rebuild dominate over any new mine development.
Share: 22% | CAGR: 5.0% (2026 to 2036)

Western Europe

Manufacturing strength without matching demand explains Western Europe's 12% share, well below the 18 to 26% band, because the region hosts major equipment makers but relatively little mining. Sweden and Finland are the exceptions, with iron ore and base metal operations that have made Nordic underground mines the proving ground for battery-electric and automated equipment worldwide. Sandvik, Epiroc, Metso, and FLSmidth all headquarter in the region, and their engineering sits close to those demanding customers. Elsewhere European mining is limited by permitting difficulty and public opposition even where deposits exist. Growth of 3.8% is the slowest of the seven regions, reflecting a small and permitting-constrained domestic demand base rather than any weakness in the manufacturers themselves.
Share: 12% | CAGR: 3.8% (2026 to 2036)
Regional intelligence for 5 additional markets available in the complete report: East Asia, South Asia and Pacific, Latin America, Middle East and Africa, Eastern Europe. Contact sales@marketmindsadvisory.com.
mining-equipment-market-country-cagr-analysis-1787324360908

Where Equipment Makers Actually Defend Margin

Competing on machine list price against Chinese manufacturers is a contest Western suppliers increasingly lose on surface equipment. The four moves below shift earnings toward what a cheaper machine simply cannot deliver: guaranteed availability, the rebuild nobody else can perform, autonomy that binds the fleet, and electrification priced against the ventilation bill it eliminates.

Sell Machine Availability, Not Machine Capacity

A miner does not want a truck; it wants tonnes moved on schedule, and downtime at a producing operation costs more per hour than most machines are worth. Contracting against guaranteed availability rather than selling iron moves the conversation to the number the mine manager is actually measured on. Availability contracts on large fleets typically command 20% to 30% more lifetime revenue than transactional supply, and they transfer maintenance planning to the supplier, who is better placed to do it. They also lock the account for the machine's full working life rather than to the next tender.
Market Impact: Availability contracts lift lifetim

Own The Rebuild Before A Rival Does

A large mining machine is rebuilt once or twice across its working life, and each rebuild costs a substantial fraction of a new machine while carrying better margin than the original sale. Independent rebuild shops and component remanufacturers compete hard for that work, and once a miner uses one, the original manufacturer often loses the machine's remaining service life entirely. Suppliers should price the first rebuild aggressively to keep the asset inside their own service network, since a rebuild typically runs 40% to 60% of new machine cost while earning materially more margin per dollar.
Market Impact: Rebuild costs 40% to 60% of new mac

Attach Autonomy To The Fleet Management Contract

An autonomous haulage fleet runs on one vendor's control system, and adding a competitor's truck to that fleet is technically feasible but commercially awkward enough that most miners simply do not. That makes autonomy the strongest lock-in available in this market, stronger than any dealer relationship. Suppliers should price the autonomy system to win the installation even at thin margin, then recover across a decade of truck sales into a fleet that has effectively standardised. Autonomous operations also report utilisation gains near 15%, which funds the conversation on the mine's own numbers.
Market Impact: Autonomy raises fleet utilisation b

Price Electrification Against Ventilation Savings Underground

Battery-electric underground machines cost considerably more than diesel equivalents, and selling them on fuel savings alone fails the payback test at most operations. Selling them against ventilation is a different conversation entirely: forced air to dilute diesel exhaust can consume around 40% of a deep mine's electricity, and removing diesel removes that load along with the capital cost of ventilation infrastructure in new development. Suppliers should build the business case on total mine energy and development capital rather than on machine running cost, because that is where the payback genuinely sits.
Market Impact: Ventilation consumes about 40% of d

Who Controls the Margin Pool

Concentration is meaningful at 51%, and the field splits into three groups that barely compete on the same terms. Diversified majors selling surface fleets and dealer networks, Nordic specialists dominating underground and processing, and Chinese manufacturers competing on surface equipment price. All participants here are assessed on one basis, revenue from mining equipment and its attached parts and service.
Competition runs along three lines. First, dealer and service network density, since a machine that cannot be supported at a remote site will not be specified whatever its price. Second, autonomy and fleet management systems, which bind a mine to one vendor for the life of the installation. Third, aftermarket capture, where roughly 45% of supplier revenue sits and independent rebuild shops compete directly for work the original manufacturer would rather keep.

Pressure is building from two directions. Chinese manufacturers have taken domestic share and now compete credibly on surface equipment across Asia, Africa, and Latin America, where dealer expectations are lower and price matters more. Meanwhile the majors keep buying into processing and software, with Sandvik taking Schenck Process Mining and Weir acquiring Micromine. Rankings should favour suppliers holding autonomy platforms and dense service networks over those selling machines alone.
mining-equipment-market-company-positioning-matrix-1787324361428

Competitive Moat and Risk Dimensions

CATERPILLAR

Moat: Dealer network and installed base

Caterpillar's independent dealer network is the deepest in heavy equipment and reaches remote mine sites competitors cannot economically serve, which decides tenders before price is discussed. Its installed base across surface fleets generates parts and service revenue for decades, and its autonomous haulage system is deployed at production scale. Financing through Cat Financial removes a further obstacle for capital-constrained buyers.
CATERPILLAR

Risk: Cyclical exposure, Chinese price pressure

Revenue tracks mining capital expenditure closely, and that swings far harder than mine output when commodity prices fall. Chinese manufacturers are competitive on surface equipment price in exactly the emerging markets where Caterpillar's dealer premium is hardest to justify. Its underground position is also weaker than the Nordic specialists', leaving it exposed in the fastest-growing part of the market.
KOMATSU

Moat: Autonomy leadership plus underground scale

Komatsu pioneered autonomous haulage at production scale and holds deployed fleets across Australian and Chilean operations, giving it operating data rivals lack. The Joy Global acquisition added genuine underground and longwall depth, making it the only participant with real strength across both surface and underground. Its Japanese engineering base and global dealer coverage support both franchises.
KOMATSU

Risk: Coal exposure, currency sensitivity

A meaningful share of Komatsu's underground franchise sits in longwall coal equipment, which faces sustained decline in every market pursuing decarbonisation seriously. Yen movement swings reported results independently of operating performance. It also competes against Caterpillar's larger dealer network in surface equipment while facing the Nordic specialists in the underground segment where growth is strongest.

Players Tracked

Prominent Players

Caterpillar
Komatsu
Sandvik
Epiroc
Metso

Other Key Players

Liebherr
Hitachi Construction Machinery
Weir Group
FLSmidth
thyssenkrupp
Volvo Construction Equipment
XCMG
Zoomlion
Sany Heavy Industry
Terex
Astec Industries
Normet
Bell Equipment
BEML
Boart Longyear

Recent Developments

AUGUST 2023

Sandvik completes acquisition of Schenck Process Mining

Sandvik completed its acquisition of the Schenck Process Group mining business, an outright purchase rather than a joint venture or merger, valued near EUR 730 million. The deal added screening, feeding, and material handling capability, deepening Sandvik's position in mineral processing alongside its established rock excavation franchise.
Signal: The majors are buying into processing and
SEPTEMBER 2024

Weir Group completes acquisition of Micromine

Weir Group completed its acquisition of Micromine, an Australian mining software business, in an outright purchase rather than any joint venture arrangement. The transaction added mine planning and operations software to a portfolio that had previously been built entirely around slurry pumps, crushers, and wear-resistant components.
Signal: An equipment maker paying heavily for soft
OCTOBER 2024

Caterpillar deploys battery-electric large mining trucks with customers

Caterpillar placed battery-electric large mining trucks at customer sites under its Early Learner programme, working with several major miners on real production duty cycles. This was organic product deployment rather than any corporate transaction, and it moved surface battery equipment beyond controlled proving ground demonstration.
Signal: Surface electrification is now being teste

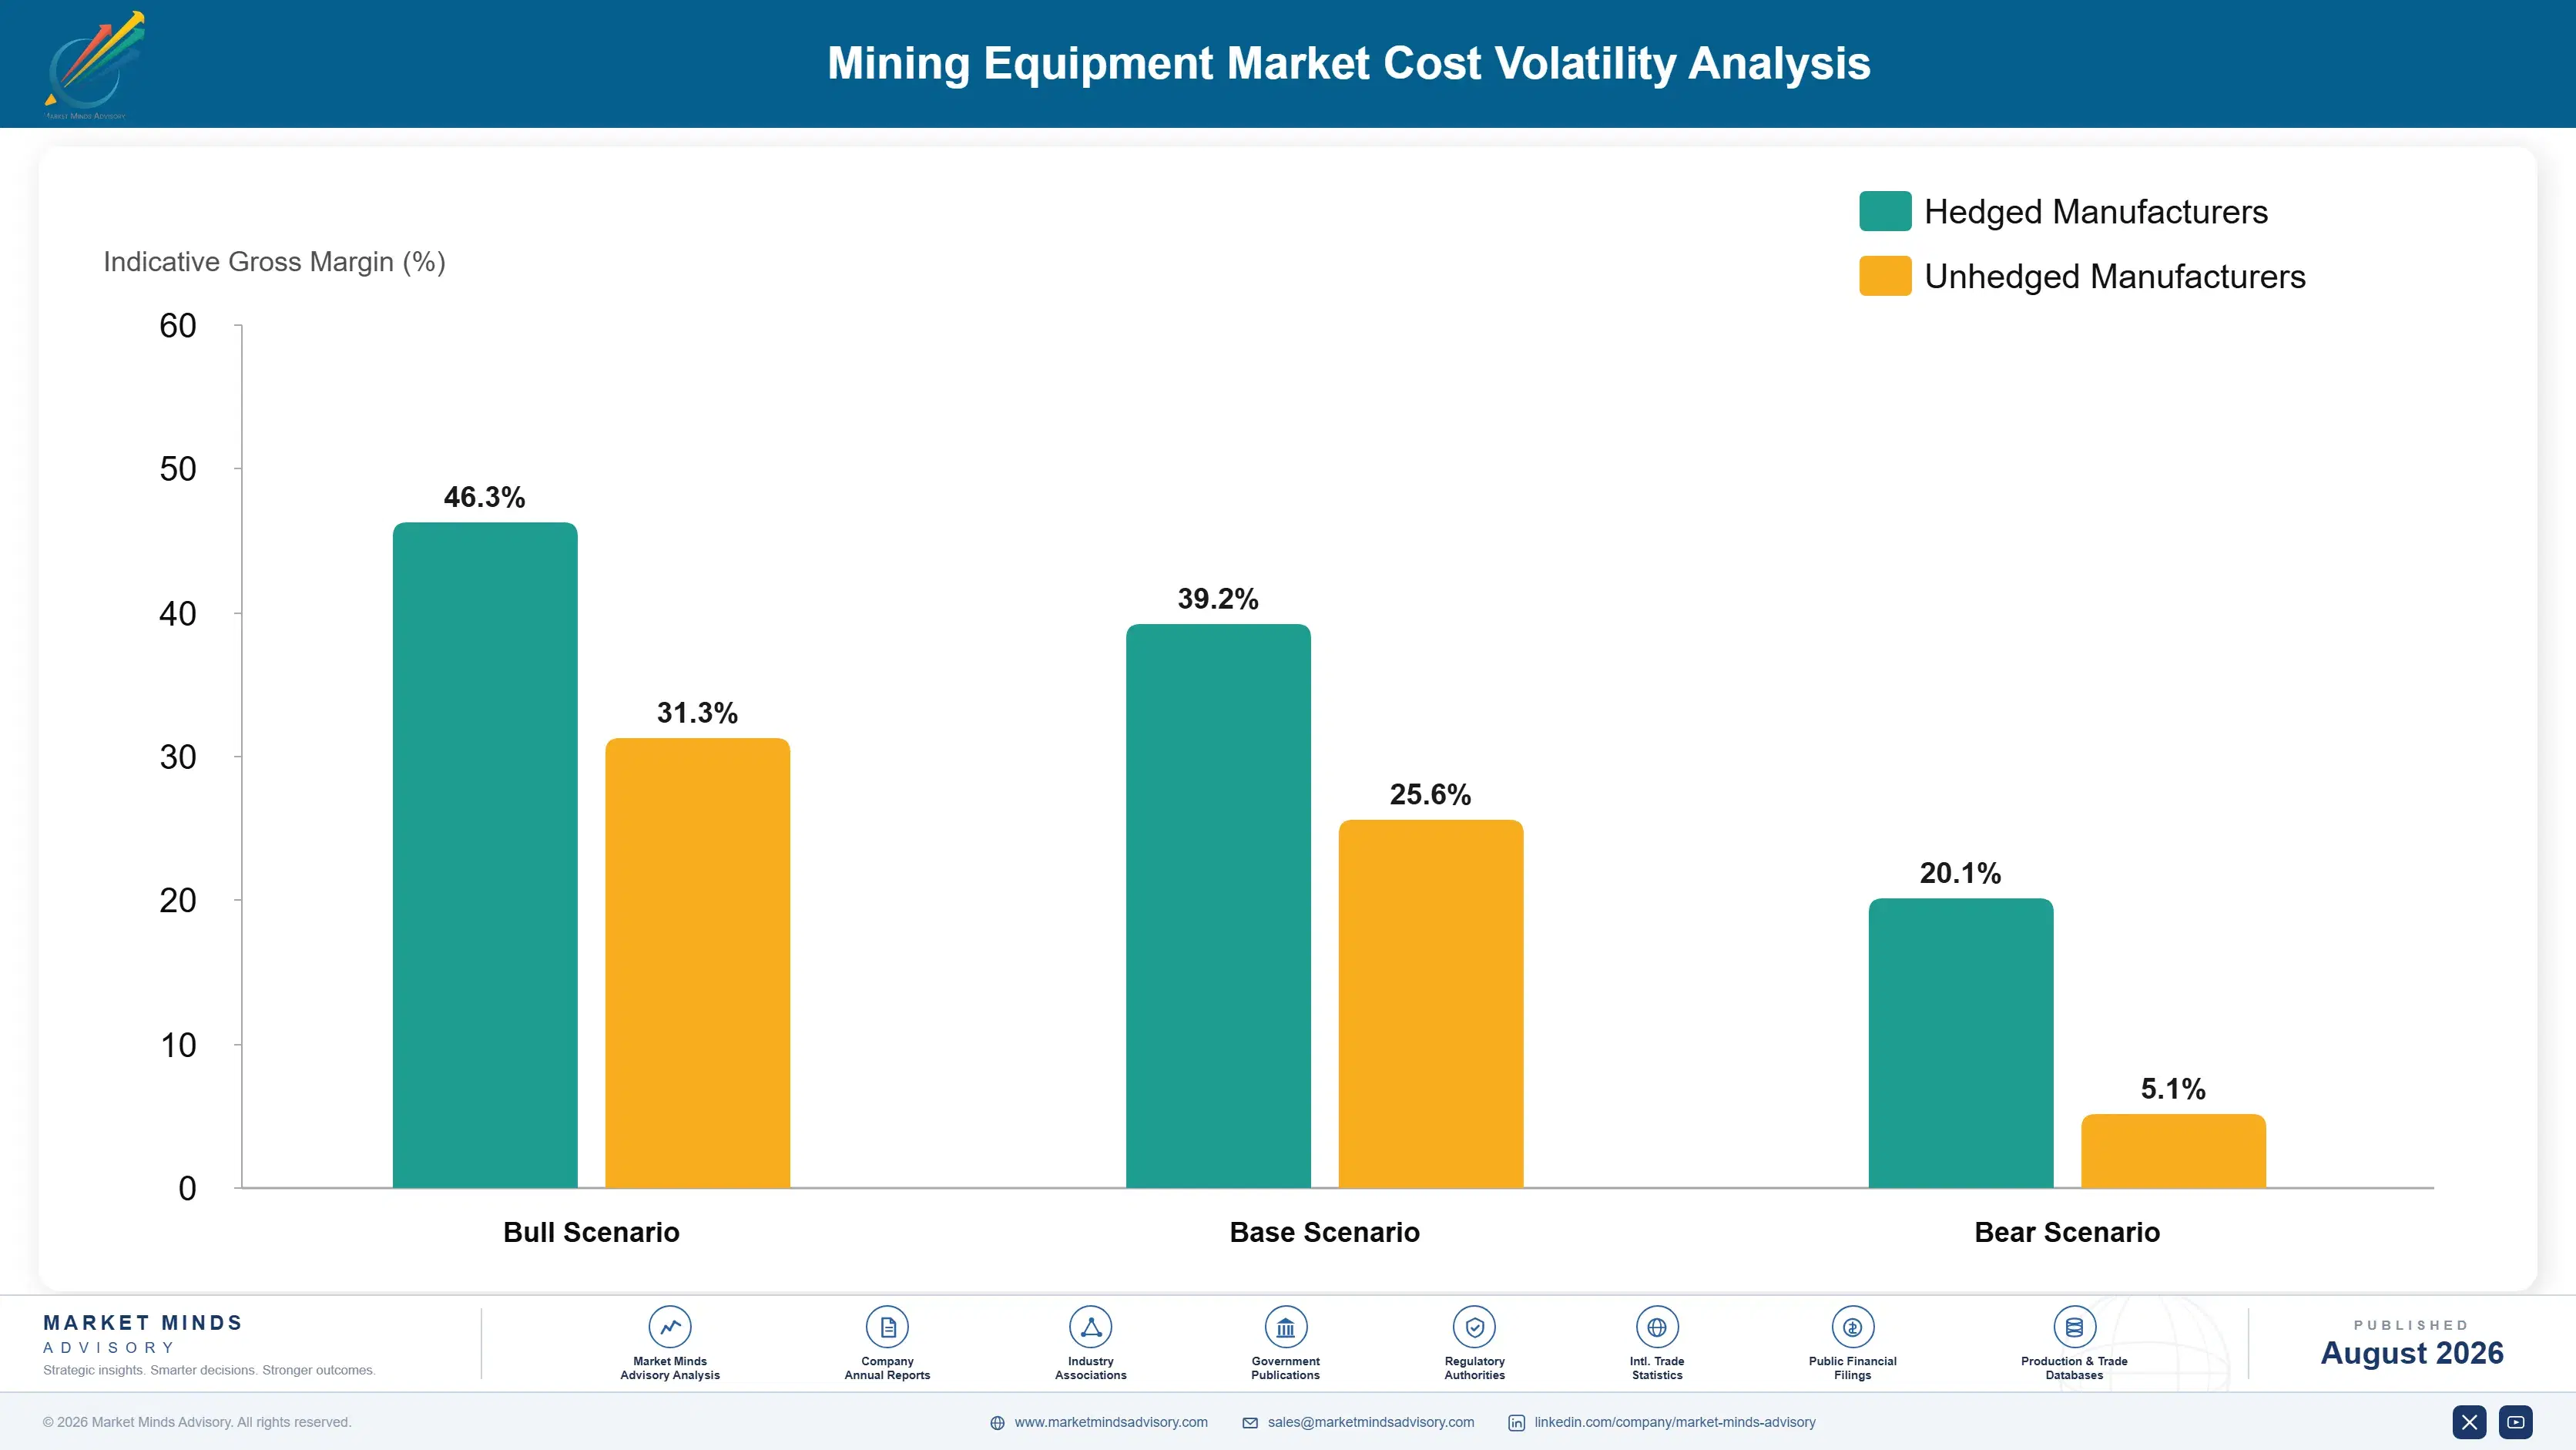
Steel, Castings, Engines, And Freight

Metal dominates the cost base. Steel plate, sections, and large castings run 30% to 38% of COGS, sourced from global mills with heavy castings concentrated in few foundries. Engines, drivetrains, and final drives take 18% to 25%, hydraulics and electrical systems 12% to 18%. Assembly labour absorbs 10% to 14%, with freight, warranty, and commissioning accounting for the remainder.
The 2021 and 2022 period showed the exposure sharply. Steel prices reached records as demand recovered faster than mills restarted, and EIA data recorded diesel and freight costs climbing through the same window, lifting both input cost and delivery expense together. Caterpillar and Komatsu both disclosed material manufacturing cost inflation in their 2022 annual reporting and raised prices to recover it. Large castings became a genuine bottleneck, with lead times on major components stretching well beyond normal.

Exposure separates the integrated from the assembled. Manufacturers with captive foundry and drivetrain capacity absorb metal price movement more comfortably than those buying major components on contract. Chinese producers carry a further advantage in domestic steel and casting cost that Western suppliers cannot close through purchasing terms. The hardest position is a mid-sized Western manufacturer buying externally.
mining-equipment-market-cost-volatility-analysis-1787324361627

Index long-term supply contracts to published steel and freight benchmarks

Fixed pricing across a multi-year machine order leaves the manufacturer carrying every metal price movement across the build period, which on large equipment can span more than a year. Indexing contracts to published steel and freight benchmarks passes input moves through without renegotiating the relationship. Mining customers accept the mechanism readily because they price their own output the same way.

Qualify second sources for large castings and structural components

Heavy castings for frames, axles, and mill shells come from a small number of foundries worldwide, and a single outage stretches lead times across an entire product line. Qualifying additional foundries across different regions costs engineering time and inspection cost, but it removes a single point of failure that no purchasing term can hedge against once it happens.

Grow remanufacturing to decouple parts revenue from raw metal pricing

A remanufactured engine, transmission, or final drive reuses the original casting rather than consuming newly refined metal, which strips a large share of commodity exposure from unit cost. Core return programmes also keep the machine inside the supplier's service network for its remaining life, protecting the aftermarket revenue that independent rebuild shops actively compete for.

Portfolio Architecture for Margin Defence

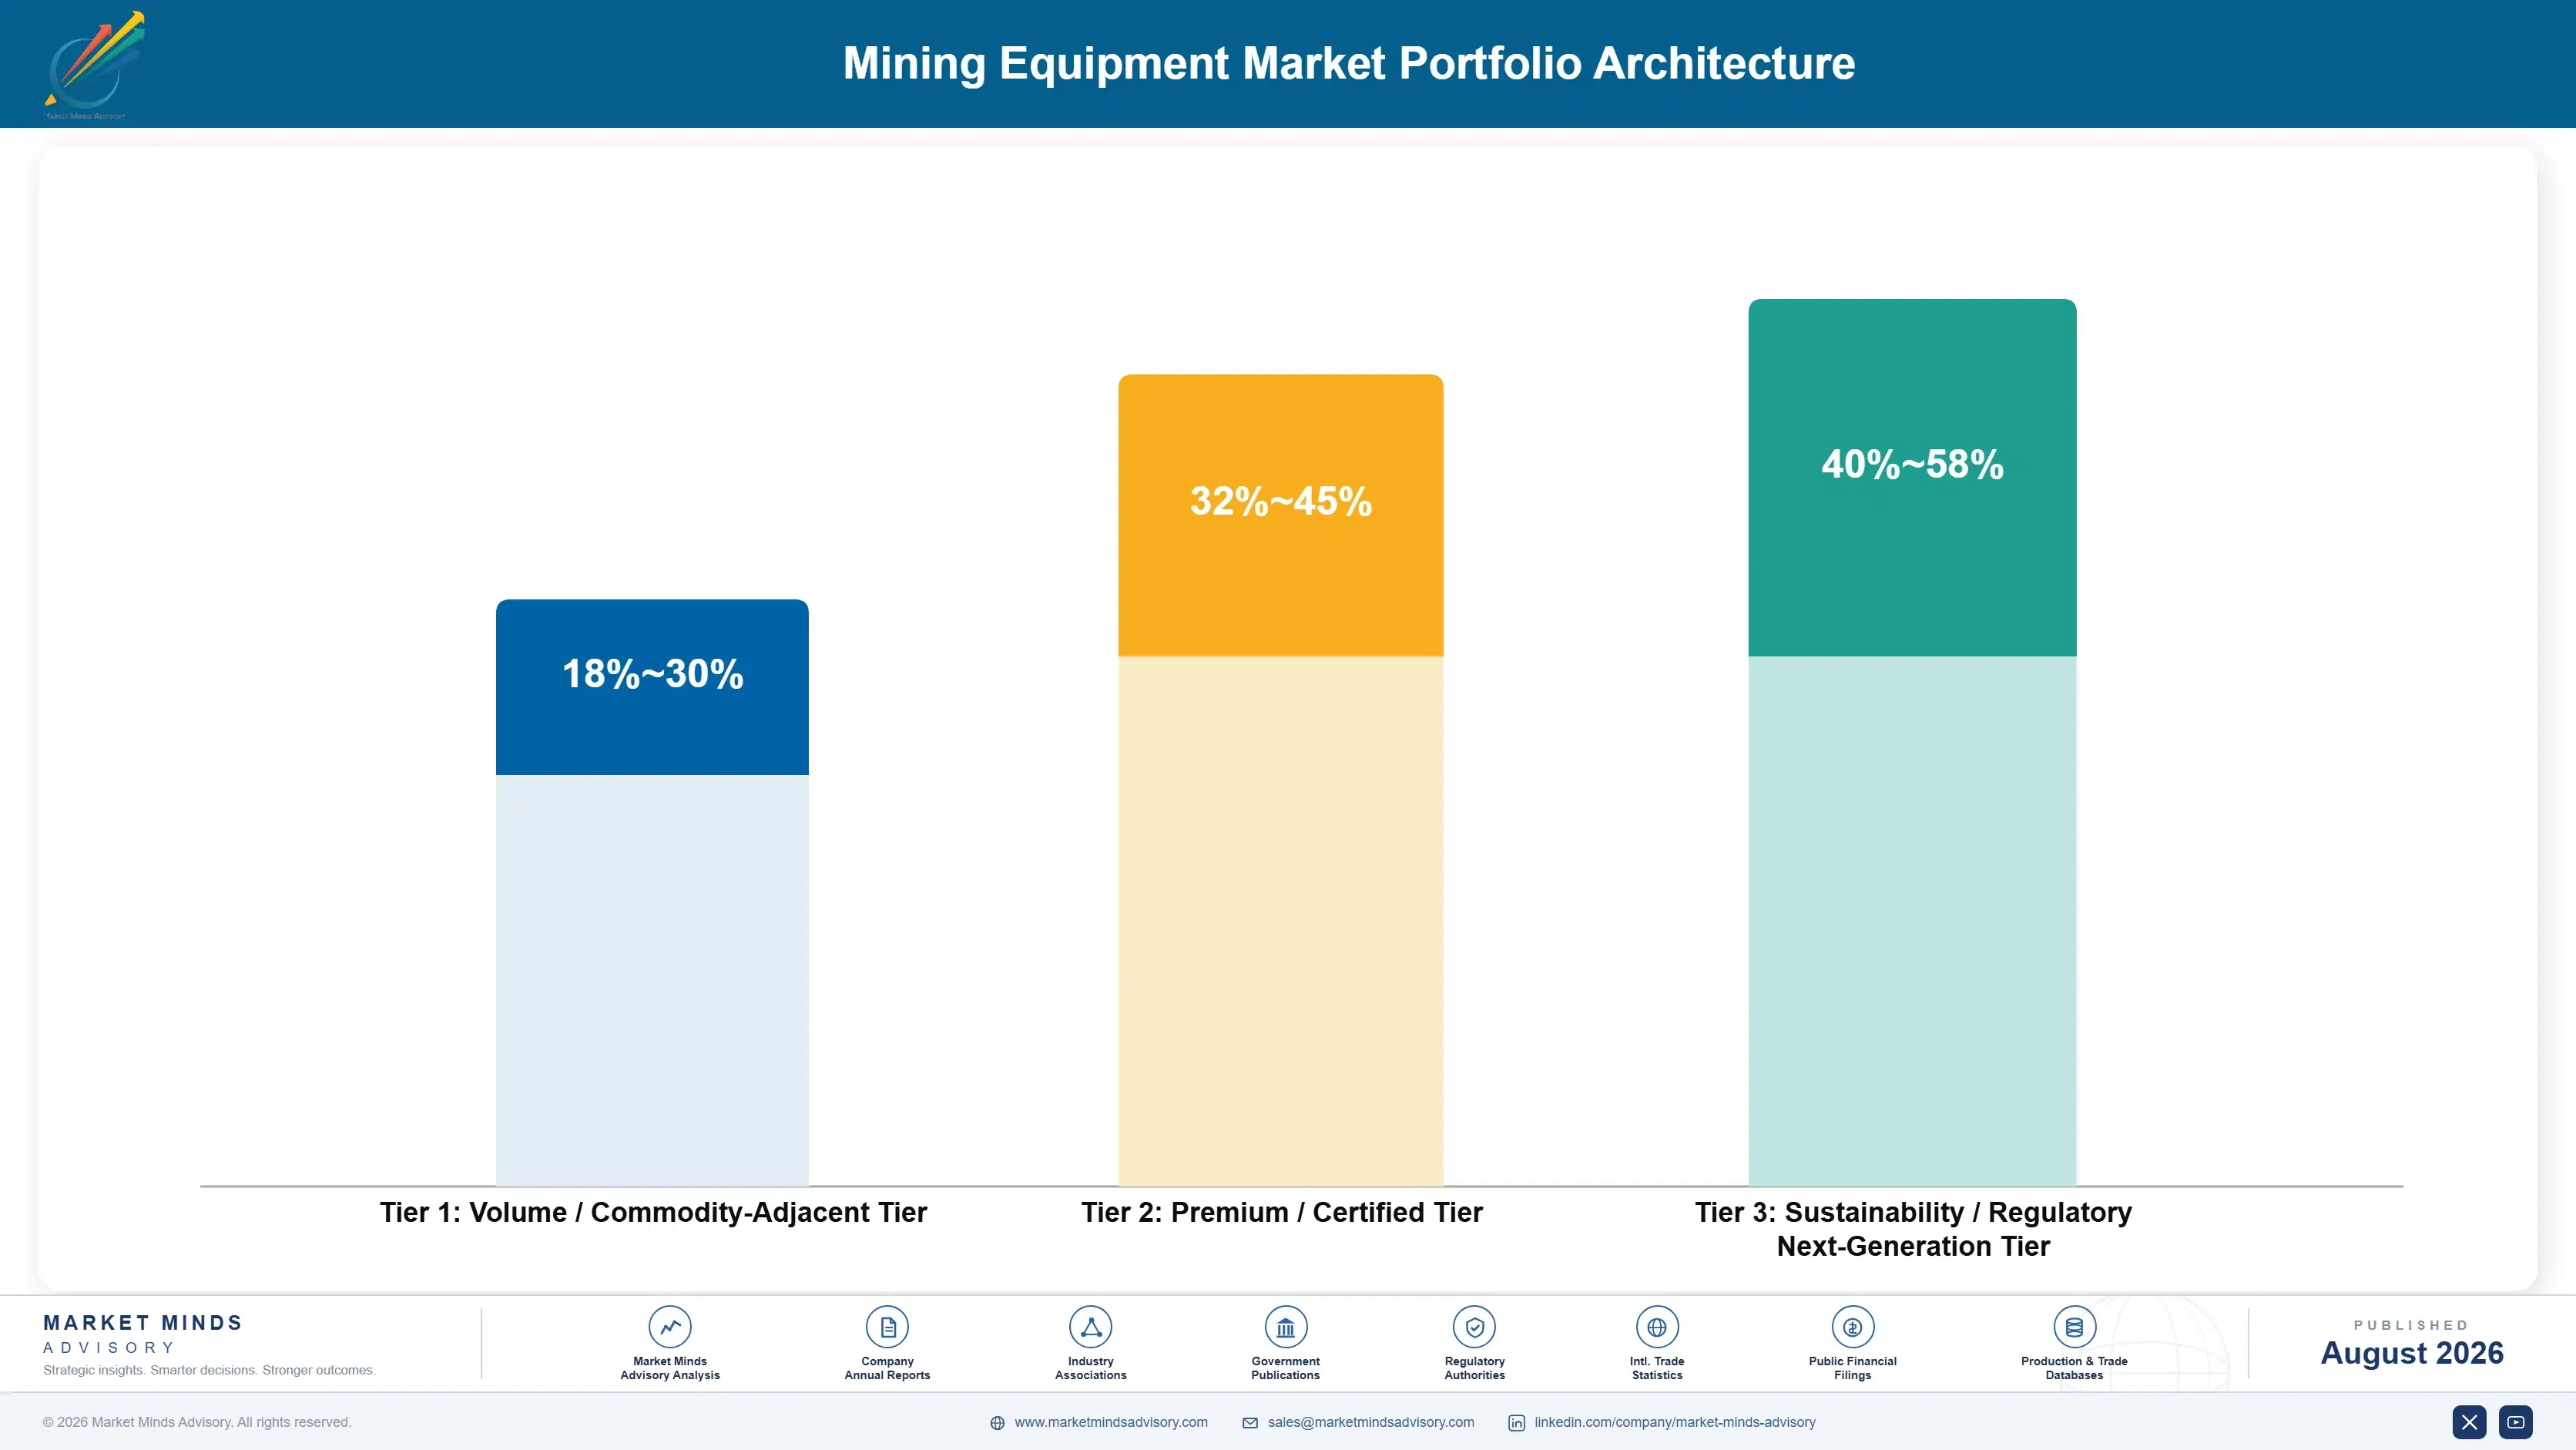
The portfolio splits into three tiers with clearly different economics. Volume equipment, standard surface machines and commodity wear parts, competes against Chinese manufacturers on delivered price and earns modestly. Certified premium equipment, meaning large mining trucks, shovels, and underground production machines, earns materially more because reliability at a producing mine outweighs purchase price. Autonomy, electrification, and rebuild work sit highest.
The tension runs between machine volume and service margin. Selling iron establishes the installed base that generates parts and service for a decade, and roughly 45% of supplier revenue sits in that aftermarket. Yet each machine sold at competitive tender price dilutes blended margin, and independent rebuild shops actively compete for the service work that was supposed to justify it. Suppliers treating the machine sale as an aftermarket acquisition cost manage this best.

High-value pools concentrate where downtime cost or technical barrier limits competition: autonomy systems binding a fleet for its working life, battery-electric underground machines sold against ventilation savings, and manufacturer rebuilds that keep an asset inside the service network. All three resist price substitution because the buyer is purchasing certainty rather than equipment. Machines sold purely on specification compete with everyone, including importers with far lower cost bases.

Volume / Commodity-Adjacent Tier

Standard surface equipment, utility machines, and commodity wear parts sold largely on delivered price. The range is wide because Chinese manufacturers price aggressively while established brands still hold a premium with operators valuing dealer support at remote sites.
Gross Margin: 18-28%

Premium / Certified Tier

Large mining trucks, electric rope shovels, underground production equipment, and primary crushing and grinding installations. The range is wide because reliability commands strong pricing at producing mines while competitive tenders on new developments compress it considerably.
Gross Margin: 28-38%

Sustainability / Regulatory / Next-Generation Tier

Battery-electric machines, autonomous haulage and fleet management systems, and manufacturer rebuild and remanufacturing programmes. The range is wide because autonomy licences earn very strongly while early battery equipment still carries development cost against limited deployed volume.
Gross Margin: 32-48%
mining-equipment-market-portfolio-architecture-1787324362136

High-value Sub-segments and Strategic Watch-out

Underground Mining Equipment

High value and high growth at 7.6%, the fastest function, as deposits deepen and battery-electric machines pay back through ventilation savings rather than fuel. Nordic specialists hold positions the diversified majors have never fully matched, and machines here replace considerably more often than surface equipment does.
Gross Margin: 30-42%

Crushing, Grinding, and Mineral Processing Equipment

High value with strong growth at 6.2%, driven directly by falling ore grades pushing more tonnes through the mill for the same metal recovered. Attached consumable wear parts generate steady revenue entirely independent of the mining capital cycle, which makes the whole category unusually defensive.
Gross Margin: 28-40%

Surface Mining Equipment

The volume core at 4.2% and the largest function by value, covering haul trucks, excavators, shovels, and dozers at open pit operations. Steady on replacement demand, but the most exposed of all to Chinese manufacturers competing credibly on price across Asian, African, and Latin American markets.
Gross Margin: 22-32%

Drilling and Boring Equipment

The strategic watch-out at 5.4%, tied more closely to exploration and development budgets than to production, which makes it the most violently cyclical function in the market. Orders can halve inside a single commodity downturn and recover just as sharply, punishing anyone who sizes capacity to peak.
Gross Margin: 26-36%

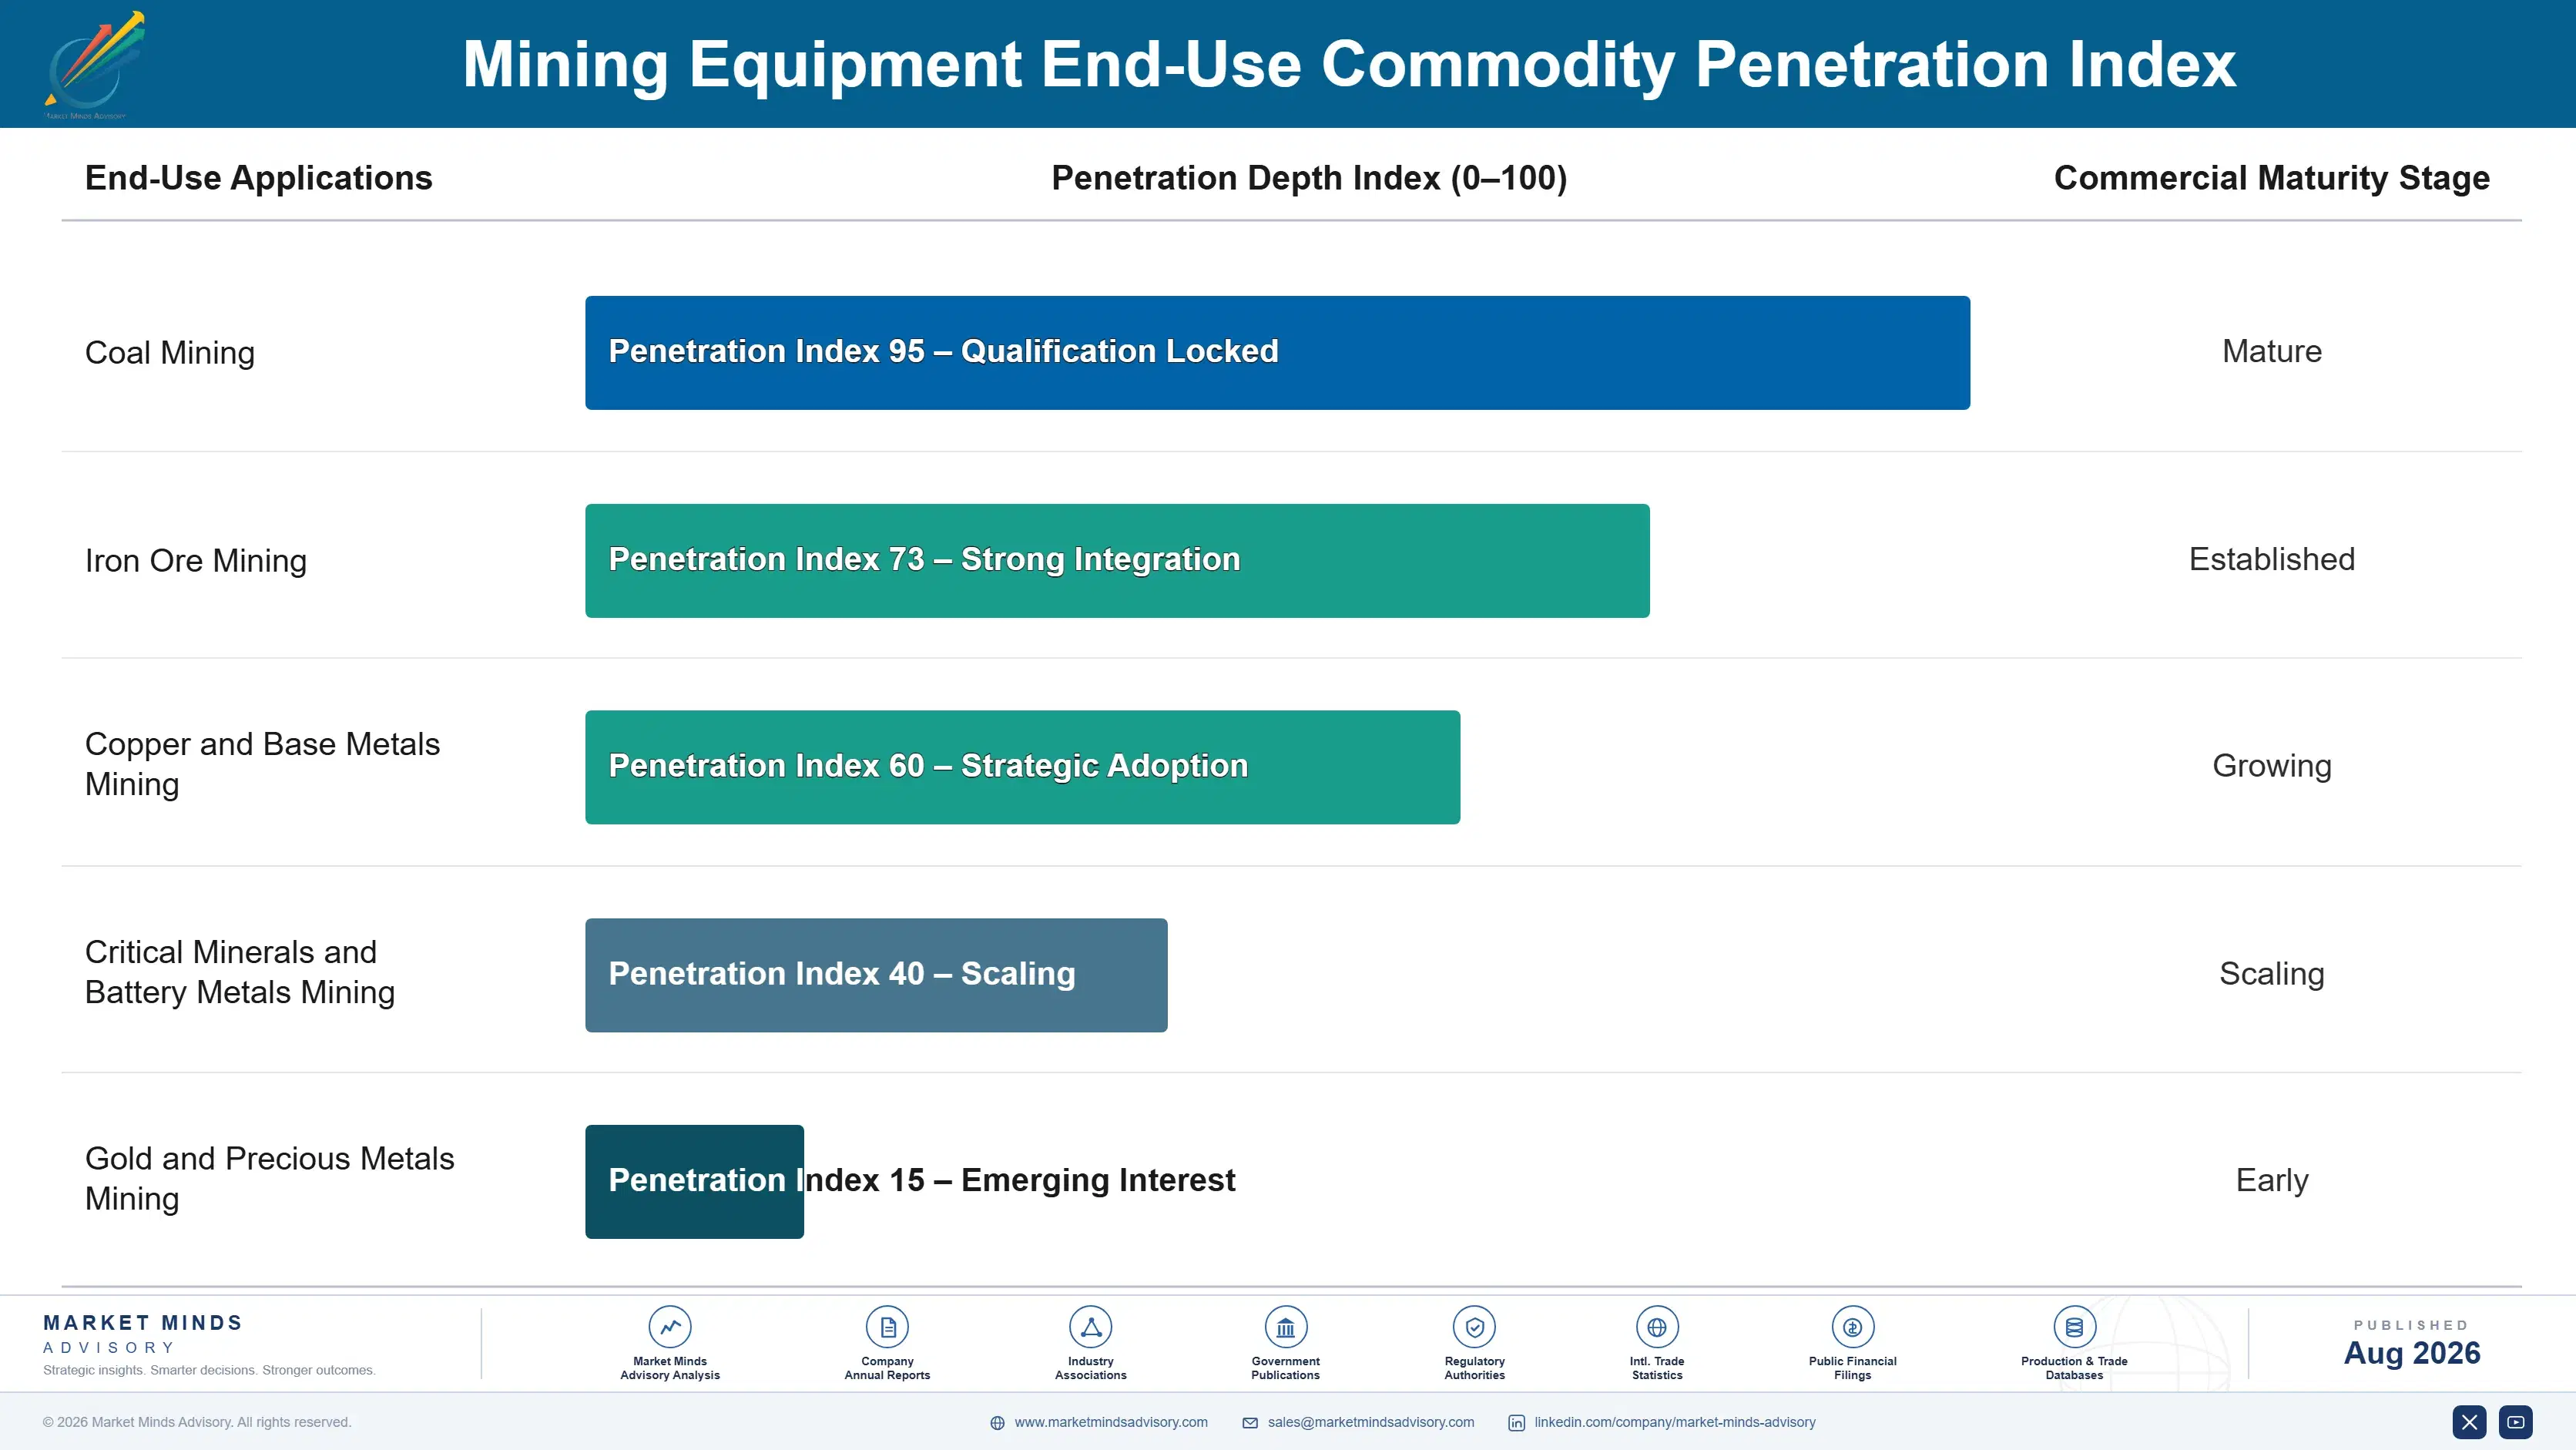
How Fleet Demand Actually Commits

Demand commits on the machine's working life, not the purchase order. A haul truck bought today generates parts and service revenue for seven to twelve years before rebuild, and roughly 45% of supplier revenue sits in that stream rather than in the original sale. Suppliers therefore fight hardest at specification, because winning a machine into a fleet wins a decade of consumables, components, and service that follows.
Adoption depth varies sharply by operation type. Large iron ore and copper producers commit deepest, running standardised fleets under supplier maintenance contracts with automation attached. Underground base metal operations follow, adopting battery-electric equipment fastest because the ventilation economics are compelling. Coal operations buy conservatively and hold machines longer. Contract miners sit apart, buying on lowest delivered cost and switching brands readily. Small operators are shallowest, favouring used equipment and independent service.

Buyer profiles have shifted from mine managers toward corporate procurement and sustainability functions. Fleet decisions that once sat with the site now route through group-level teams weighing standardisation, emissions commitments, and total cost per tonne. Younger mining engineers also expect autonomy and remote operation as defaults rather than options, having trained on operations where both were already normal practice.
mining-equipment-market-end-use-penetration-index-1787324362625

Our Call On Mining Equipment

These are among the four positions where our research anticipates prominent divergence between winners and laggards over the coming forecast period. Each is grounded in the demand model, the regulatory perimeter, and the announced capacity pipeline.
01 / UNDERGROUND ELECTRIFIES FIRST

Ventilation savings, not fuel, make the battery business case

Diesel machines underground require forced air to dilute exhaust, and that ventilation can consume around 40% of a deep mine's electricity, so removing diesel removes the load and the capital cost of ventilation infrastructure in new development. Fuel saving alone never clears the payback hurdle. Suppliers should therefore build the electrification case on total mine energy and development capital rather than on machine running cost alone, because surface duty cycles do not offer the same arithmetic and will convert considerably later than underground fleets do.
02 / AFTERMARKET CARRIES MARGIN

The machine sale is an acquisition cost for a decade of service

Roughly 45% of supplier revenue sits in parts and service attached to machines already sold, and that stream holds up through downturns because deferred equipment consumes more components rather than fewer. Independent rebuild shops compete directly for the same work. Suppliers should therefore price the first manufacturer rebuild aggressively in order to keep the asset inside their own service network, treating the original machine tender as the cost of acquiring a decade-long aftermarket annuity rather than as the profitable transaction itself.
03 / CYCLES PUNISH CAPACITY

Orders swing far harder than mine output ever does

Fleet renewal is deferrable in a way production is not, so miners facing weak commodity prices run machines past rebuild intervals and postpone replacement without losing immediate output. Orders fell over 30% in 2020 while mine production barely moved, and the same pattern held in 2015. Manufacturers should therefore size fixed capacity to trough demand rather than to peak, and build aftermarket depth deliberately, because service revenue is what carries a supplier through the downturns this market reliably and repeatedly delivers.
04 / AUTONOMY LOCKS FLEETS

The control system decides truck purchases for a decade

An autonomous haulage fleet runs on one vendor's control system, and introducing a competitor's truck into it is technically possible but commercially awkward enough that miners rarely bother. That makes autonomy the strongest lock-in available in this market, considerably stronger than any dealer relationship. Suppliers should therefore price the autonomy installation to win it even at very thin margin, then recover it across a decade of subsequent truck sales into a fleet that has by then effectively standardised around their own platform.

Engagement Snapshot From the Field

A live engagement with an industry participant carrying material or product regulatory and market exposure ahead of a defining policy shift, showing how our research translates into a defensible multi-year portfolio strategy.
MARKET MINDS ADVISORY · CLIENT ENGAGEMENT SUMMARY
Mining Equipment Producer Strategic Portfolio Review and Transition Roadmap 2026·Investment Scenario on Mining Equipment Exposure Evaluation 2025-26
CLIENT PROFILE
A diversified copper and gold producer operating six mines across two continents engaged MMA as its haul fleet approached a major replacement cycle. The client reported annual revenue near USD 7.4 billion, with mining equipment capital and maintenance running about 21% of operating cost and roughly 40% of its truck fleet due for rebuild or replacement within four years (client-reported, unverified by MMA).
STRATEGIC CHALLENGE
The board had committed publicly to emissions reduction targets that its diesel fleet could not meet, but battery-electric surface trucks were not commercially proven at the duty cycles its open pits demanded. Operations wanted like-for-like diesel replacement; the sustainability function wanted electric. Nobody had modelled what either choice cost across the fleet's full working life against the client's actual haul profiles.
MMA APPROACH
MMA modelled the client's haul cycles pit by pit, testing battery-electric feasibility against real gradients, distances, and shift patterns rather than manufacturer specifications. We separated the underground fleet, where ventilation savings change the arithmetic entirely, from surface haulage where they do not. We then priced three replacement paths against emissions commitments, capital availability, and realistic equipment availability dates.
KEY FINDINGS
  1. Underground battery-electric replacement cleared the payback hurdle comfortably once ventilation capital and power costs were included, while surface replacement did not at any modelled diesel price (client-reported, unverified by MMA).
  2. Two of the six operations had haul profiles that no announced battery truck could serve, meaning diesel replacement there was unavoidable regardless of the emissions commitment.
  3. Extending rebuild intervals on surface trucks by roughly two years bridged the gap to credible battery truck availability without introducing meaningful production risk.
  4. Autonomy delivered a larger near-term emissions reduction than electrification, through fuel efficiency and reduced idling, at materially lower capital cost (client-reported, unverified by MMA).
CLIENT PROFILE
A diversified copper and gold producer operating six mines across two continents engaged MMA as its haul fleet approached a major replacement cycle. The client reported annual revenue near USD 7.4 billion, with mining equipment capital and maintenance running about 21% of operating cost and roughly 40% of its truck fleet due for rebuild or replacement within four years (client-reported, unverified by MMA).
STRATEGIC CHALLENGE
The board had committed publicly to emissions reduction targets that its diesel fleet could not meet, but battery-electric surface trucks were not commercially proven at the duty cycles its open pits demanded. Operations wanted like-for-like diesel replacement; the sustainability function wanted electric. Nobody had modelled what either choice cost across the fleet's full working life against the client's actual haul profiles.
MMA APPROACH
MMA modelled the client's haul cycles pit by pit, testing battery-electric feasibility against real gradients, distances, and shift patterns rather than manufacturer specifications. We separated the underground fleet, where ventilation savings change the arithmetic entirely, from surface haulage where they do not. We then priced three replacement paths against emissions commitments, capital availability, and realistic equipment availability dates.
KEY FINDINGS
  1. Underground battery-electric replacement cleared the payback hurdle comfortably once ventilation capital and power costs were included, while surface replacement did not at any modelled diesel price (client-reported, unverified by MMA).
  2. Two of the six operations had haul profiles that no announced battery truck could serve, meaning diesel replacement there was unavoidable regardless of the emissions commitment.
  3. Extending rebuild intervals on surface trucks by roughly two years bridged the gap to credible battery truck availability without introducing meaningful production risk.
  4. Autonomy delivered a larger near-term emissions reduction than electrification, through fuel efficiency and reduced idling, at materially lower capital cost (client-reported, unverified by MMA).
RECOMMENDED STRATEGY
Phase 1: Phase 1 (0 to 12 months): Commit underground replacement to battery-electric equipment, where ventilation savings carry the business case without any emissions premium. Phase 2: Phase 2 (12 to 30 months): Extend surface truck rebuild intervals and deploy autonomy across the two largest pits, capturing emissions reduction ahead of battery availability. Phase 3: Phase 3 (30 to 60 months): Reassess surface electrification against proven duty cycle performance, replacing only where the modelled haul profile genuinely supports it.
OUTCOME
The client committed its underground replacement entirely to battery-electric machines, extended surface rebuild intervals, and deployed autonomy at its two largest pits. Fleet emissions fell materially ahead of the original schedule, capital was deferred rather than spent on unproven surface equipment, and the two operations with unsuitable haul profiles were removed from the electrification plan entirely (client-reported, unverified by MMA).

Frequently Asked Questions

Foundational context covering the market sizes, CAGR, scope, country, region and competition that inform every finding below. This section is provided to cover basics and most often pre-purchase conversations, answered from the MMA Primary Research Dataset.

What is the current size of the Mining Equipment Market?

The global mining equipment market is valued at USD 148.6 billion in 2025, covering surface and underground machinery, mineral processing equipment, material handling, and drilling, together with attached parts and service. Mine construction, exploration services, and smelting plant are excluded.

How large will the Mining Equipment Market be by 2036?

The market is forecast to reach USD 265.01 billion by 2036 in the base case, about 1.69 times the 2026 level. That represents incremental value of roughly USD 108.39 billion across the decade.

What is the CAGR for the Mining Equipment Market 2026 to 2036?

The market grows at a 5.4% CAGR in the base case, with bull and bear scenarios at 6.7% and 4.1%. The spread turns mainly on whether commodity prices sustain a genuine mine development cycle or trigger deferred replacement.

Which segment is growing fastest?

Underground mining equipment grows fastest at 7.6%, about 1.41 times the overall market rate, as deposits deepen and battery-electric machines pay back through ventilation savings. Crushing, grinding, and mineral processing equipment follows at 6.2%.

Who are the major companies in the Mining Equipment Market?

Leading manufacturers include Caterpillar, Komatsu, Sandvik, Epiroc, and Metso. The top five hold roughly 51% of equipment revenue, with Nordic specialists dominating underground and processing while the diversified majors lead surface fleets.

Which country is growing fastest?

Indonesia grows fastest at a 9.2% CAGR, driven by nickel laterite and bauxite development serving battery and aluminium supply chains. Australia remains the largest single national market on iron ore, coal, and lithium operations.

Report Segmentation Architecture

The full report scope spans multiple orthogonal segmentation dimensions, with cross-tabulated demand data provided for each dimension pair. Coverage extends further to regional breakdowns, trend trajectories, and the competitive detail needed to support segment-level decision-making.

By Equipment Function

  • Surface Mining Equipment
  • Underground Mining Equipment
  • Crushing, Grinding, and Mineral Processing Equipment
  • Material Handling and Conveying Equipment
  • Drilling and Boring Equipment

By End-Use Mineral

  • Copper and Base Metals
  • Iron Ore and Steelmaking Inputs
  • Coal and Thermal Minerals
  • Gold and Precious Metals
  • Battery Minerals and Industrial Minerals

By Commercial Model

  • Direct Capital Equipment Sale
  • Availability and Uptime Contracts
  • Rental and Contract Mining Supply
  • Rebuild and Remanufacturing Programmes

By Region

  • North America
  • Western Europe
  • East Asia
  • South Asia and Pacific
  • Latin America
  • Middle East and Africa
  • Eastern Europe

Scope, Methodology, and Coverage

Every figure in this report is reproducible from documented input assumptions. The scope below maps the historical period, the forecast horizon, the segmentation dimensions, and the countries covered, alongside the underlying primary and qualitative methodology.
Historical Period
2020 to 2025
Forecast Period
2026 to 2036
Base Year
2025 (USD billions; MMA Primary Research Dataset, August 2026)
Market Definition
The mining equipment market comprises machinery used to extract, transport, and process ore and overburden at mining operations, valued at manufacturer selling prices and including the parts, components, and service revenue attached to those machines across their working lives. It spans surface mining equipment, underground mining equipment, crushing, grinding and mineral processing equipment, material handling and conveying equipment, and drilling and boring equipment, across metals, coal, and industrial minerals. Mine construction and civil works, exploration drilling services, smelting and refining plant, mine site power generation, and standalone mining software sold independently of equipment are excluded.
Quantitative Units
USD billions (current prices); machine units shipped and fleet operating hours where applicable
Segmentation Dimensions
By Equipment Function; By End-Use Mineral; By Commercial Model; By Region
Regions Covered
North America, Western Europe, East Asia, South Asia and Pacific, Latin America, Middle East and Africa, Eastern Europe
Countries Covered
USA, China, Germany, France, UK, Japan, South Korea, India, Australia, Canada, Brazil, Mexico, Indonesia, Vietnam, Thailand, Malaysia, UAE, Saudi Arabia, South Africa, Nigeria, Turkey, Poland, Netherlands, Italy, Spain, Sweden, Switzerland, Argentina, Colombia, Singapore, and additional markets relevant to this sector
Key Companies Profiled
Caterpillar, Komatsu, Sandvik, Epiroc, Metso, Liebherr, Hitachi Construction Machinery, Weir Group, FLSmidth, thyssenkrupp, Volvo Construction Equipment, XCMG, Zoomlion, Sany Heavy Industry, Terex, Astec Industries, Normet, Bell Equipment, BEML, Boart Longyear
Quantitative Methodology
Primary survey, n=3,800 respondents, Q4 2025, six countries; demand-side model with trade association cross-validation
Qualitative Methodology
47 expert interviews, Q4 2025; applied to validate demand model assumptions, identify emerging dynamics, and assess competitive positioning
Report Format
PDF and XLSX data workbook (Word format preview document)
Publisher
Market Minds Advisory
Report Code
MMA-2026-CON-149
Published
August 2026
Contact
sales@marketmindsadvisory.com | www.marketmindsadvisory.com

Purchase the full Mining Equipment Market Report (2026 to 2036).

The full MMA Mining Equipment report sizes the market across five equipment functions, five end-use minerals, four commercial models, and seven regions through 2036. It profiles 20 manufacturers on a consistent basis of mining equipment and attached service revenue, scoring each on dealer network density, autonomy platform position, underground capability, and aftermarket capture. Scenario models quantify how ore grade decline, commodity price cycles, and fleet electrification move both machine demand and service revenue. The report also includes fleet replacement modelling by machine class, battery-electric payback analysis separating underground from surface duty cycles, autonomy lock-in economics, and a rebuild capture assessment for strategy and product teams.
Five-function and four-model market sizing to 2036
Twenty-manufacturer benchmark on consistent equipment and service revenue
Fleet replacement and rebuild cycle modelling by machine class
Battery-electric payback analysis separating underground from surface
Autonomy platform lock-in and fleet standardisation economics
Aftermarket capture assessment against independent rebuild competition

Built For The People Who Decide

From boardroom strategy to bench-side execution, this report is read cover-to-cover by leaders shaping the next decade of their industry, turning demand scenarios, market dynamics and valuation benchmarks into decisions.
CXOs/ Presidents/ VPs/ Managers
M&A and Corporate Development
Strategy Teams and R&D Heads
Procurement and Product Directors
Regulatory and Compliance Leaders
Investor Relations and Equity Analysts