Market Minds Advisory
Frozen Food Market

Frozen Food Market: Cold chain losses, Ramadan concentration and import dependence to 2036

Around a seventh of everything frozen is destroyed between the factory and the consumer's freezer, which is a far bigger number than any margin anybody in this category argues about.

Lead Analyst

Lisa Gevelber

Published

September 2026

Make Smarter Decisions with Customized Research Insights

Request a free sample report and evaluate market opportunities, growth trends, and competitive dynamics relevant to your business needs.

2025 MARKET VALUE$268.4BMarket Size 2025
2036 FORECAST VALUE$478.7BBase Case , 2026 to 2036
CAGR 2026 TO 20365.4 %Bull 6.6% / Bear 4.2%
INCREMENTAL OPPORTUNITY$195.8BNet 10- year value creation
EXPANSION MULTIPLE1.69x2036 value over 2026 base
Strategic Levers
M&A Pipeline
Regional Outlook
Country Rankings
Competitive Intelligence
Segmental Deep-dive
Call-Us : 91 93563 13602

Executive Snapshot and Market Trajectory

Roughly 14% of frozen product is lost between manufacture and the consumer's freezer across the Middle East and North Africa, in a climate where a cold chain break destroys a pallet within minutes. That loss dwarfs every margin argument anybody in this category is currently having. Nobody costs it.
Frozen ready meals and prepared dishes grow at 8.1%, half again the market rate of 5.4%, on urbanisation, working patterns and quick commerce delivery that frozen product is genuinely difficult to serve. East Asia holds 27% of global value on Chinese frozen prepared food at enormous scale. Regional household freezer penetration sits near 61%. A household without freezing capacity cannot buy this category at any price, which makes penetration the binding precondition.
Five manufacturers hold just 21% of global supply and regional fragmentation is greater still. The commercial fact that shapes everything across this region is Ramadan: around 22% of annual category sales occur in one month, which determines cold storage capacity, working capital, import scheduling and promotional planning simultaneously. No other food market concentrates like that. Two weeks of mistiming loses a fifth of the year irrecoverably.
Market Definition
This report covers frozen food products supplied through retail and foodservice channels, spanning frozen poultry and meat, frozen vegetables and fruit, frozen potato products, frozen ready meals and prepared dishes, frozen seafood, and frozen bakery and dough. The Middle East and North Africa market is the analytical centre, with global demand covered for context. Value is measured at manufacturer level. Excluded are ice cream and frozen desserts, chilled and ambient products, fresh produce, cold chain equipment and logistics services.
Base Year Value
$268.4B in 2025 (MMA Primary Research Dataset, August 2026)
Forecast Period
2026 to 2036, eleven discrete annual values
CAGR
5.4% base case. Bull 6.6%. Bear 4.2%.
Fastest Growth Segment
Frozen Ready Meals and Prepared Dishes: 8.1% CAGR
Fastest Growth Country
Saudi Arabia: 8.6% CAGR
Fastest Growth Region
South Asia and Pacific: 7.6% CAGR
Largest Region
East Asia: 27% of 2025 global value
Market Leaders
Nestle, BRF, Sunbulah Group, Al Kabeer Group and Almarai lead the market. Source: MMA Primary Research Dataset, July 2026.
Primary Survey
n=3,800 procurement and R&D decision-makers, Q4 2025, six countries
Methodology
Demand-side build-up, cross-validated against public data, 47 expert interviews

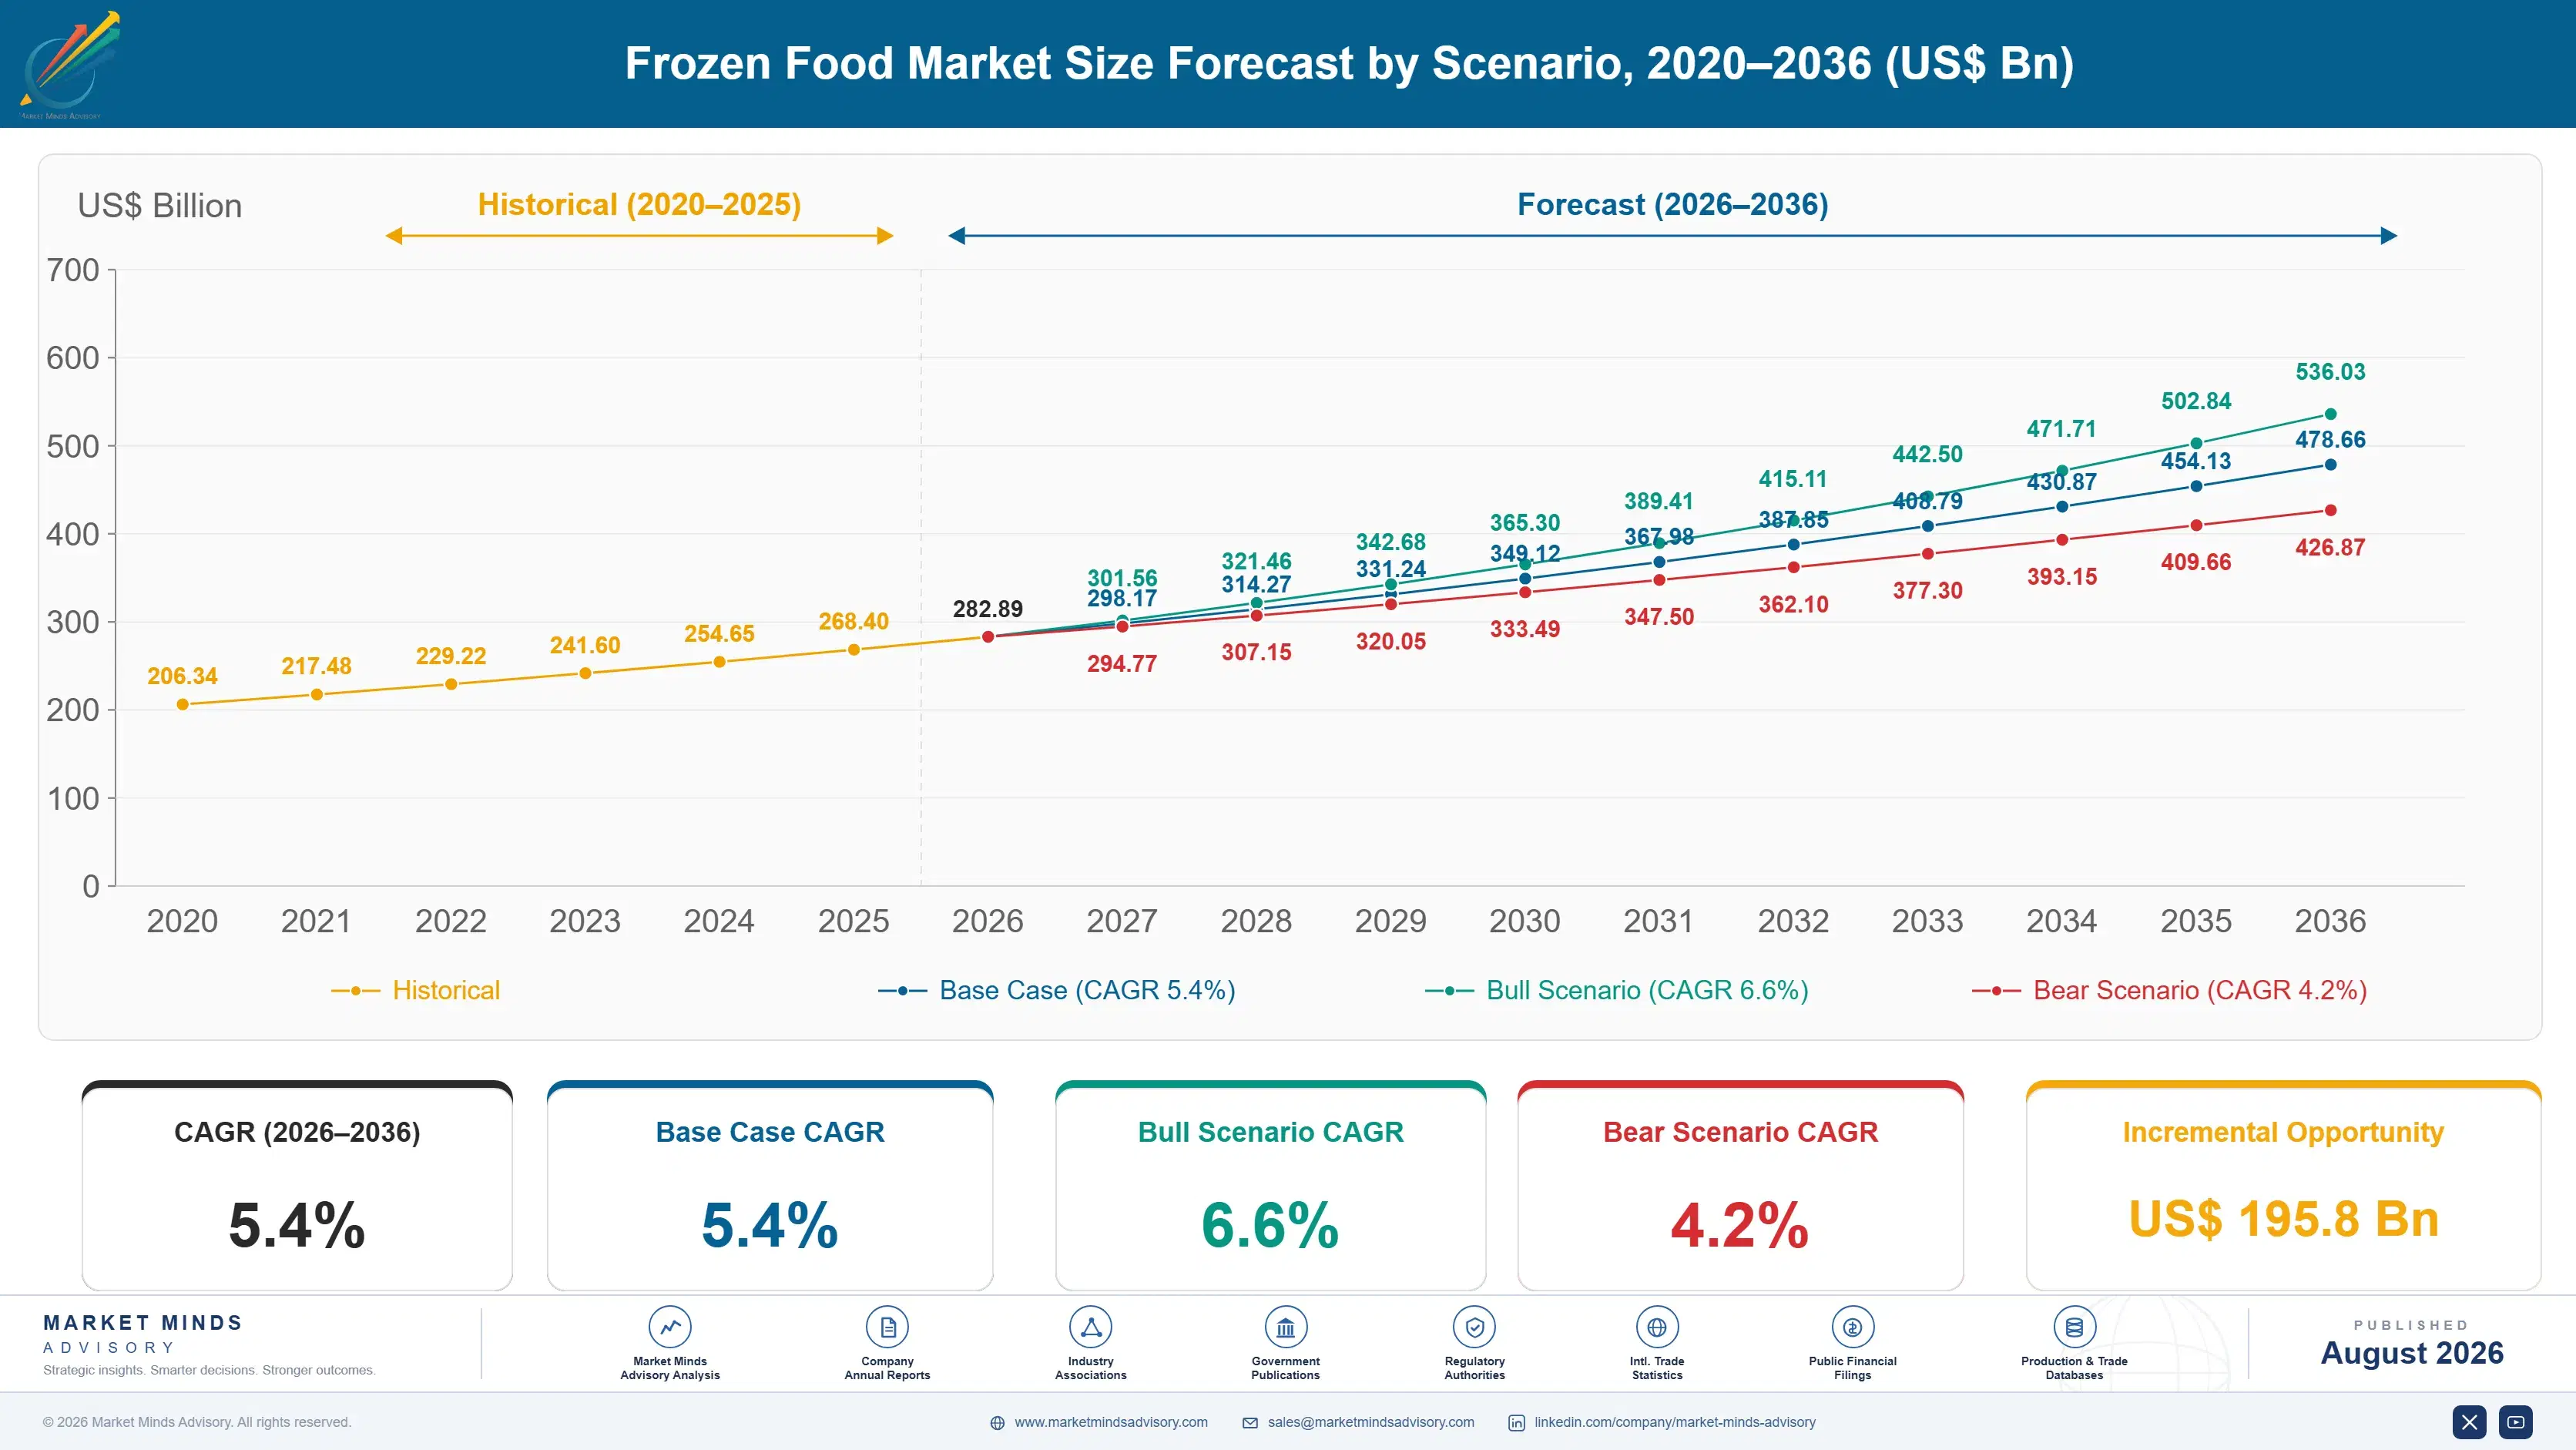
Frozen Food Market Forecast Scenarios

middle-east-north-africa-frozen-food-size-forecast-scenario-1787555639693
Growth ran at 4.4% between 2020 and 2025 and currency did more damage across this region than demand ever did. Lockdown stockpiling lifted frozen categories sharply through 2020 and 2021 as households discovered freezer storage properly. Egyptian devaluation then made imported frozen product dramatically more expensive across a very large population, shifting demand toward local production and cheaper proteins in ways that reshaped the regional category.
The 5.4% base case rests on three mechanisms. Household freezer penetration keeps rising with income and reliable electricity supply, which is the precondition for everything else in this category. Frozen ready meals keep growing at 8.1% on urbanisation, rising female labour force participation and quick commerce delivery. And Gulf food security programmes keep funding cold storage and local production capacity that raises what the region can physically handle. Penetration decides everything.
The 6.6% bull case is cold chain investment cutting the 14% loss rate materially, which would improve availability, quality and margin simultaneously without selling a single additional tonne. The 4.2% bear case is currency instability across the larger North African markets repeating, since 68% of regional consumption arrives imported and shelf prices follow exchange rates rather than any commercial decision.

The Loss Nobody Costs Properly

Every commercial conversation in this category should start with the loss rate and almost none of them do. Around 14% of frozen product is destroyed between manufacture and the consumer's freezer across the Middle East and North Africa, through warehouse gaps, transport failures, retail cabinets running warm and a last mile in ambient heat above forty five degrees. That number is larger than the margin manufacturers and retailers spend their negotiations arguing over, and reducing it improves availability, quality and profit at the same time.
TOP-FIVE CONCENTRATION21%Combined position across frozen food supply held by leading manufacturers
REGIONAL IMPORT DEPENDENCE68%Portion of frozen food consumed regionally that arrives imported
RAMADAN DEMAND CONCENTRATION22%Share of annual category sales occurring across one month
HOUSEHOLD FREEZER PENETRATION61%Portion of regional households owning dedicated freezing capacity
COLD CHAIN LOSS RATE14%Product spoiled between manufacture and the consumer's home
RAW MATERIAL COST SHARE58%Portion of manufacturer cost attributable to the food input
Ramadan concentrates this market in a way nothing else in global food does. Around 22% of annual category sales occur across a single month, with buying beginning weeks earlier as households stock up. That determines how much cold storage the region needs, when imports must arrive, how much working capital a distributor requires and when every promotion happens. Mistiming Ramadan inventory by two weeks loses a fifth of the year outright.
Import dependence at 68% means shelf prices follow exchange rates, shipping availability and origin country export policy rather than anything a manufacturer decides. Egyptian devaluation demonstrated exactly how quickly that translates into consumption shifting toward cheaper proteins.
"People in this category negotiate two points of trade margin and then lose fourteen percent of the product somewhere between the port and the customer's kitchen. Fixing the cold chain is worth more than every commercial negotiation this industry conducts in a year."
Director, Food Supply Chain and Frozen Category Practice · MMA Agriculture and Food Practice · August 2026

Market Trends

Quick commerce delivery cannot keep frozen product frozen

Delivery platforms promising fifteen to thirty minute arrival have expanded rapidly across Gulf and North African cities, and frozen product is the category they handle worst by a considerable margin. A rider carrying an uninsulated bag through forty five degree ambient temperature destroys frozen quality within minutes, and the customer who receives partially thawed product does not order it again. Commercially this is where a substantial share of the 14% loss rate concentrates. Operators investing in insulated last mile capability and dark store freezer capacity are capturing a category that competitors are actively teaching customers to avoid ordering.
Market Impact: Reaches 61% household penetration
Ramadan concentration determines every operational decision

Around 22% of annual frozen category sales occur across a single month, with household stocking beginning several weeks beforehand and foodservice demand shifting entirely as eating patterns change. That concentration dictates cold storage capacity requirements, import arrival scheduling, distributor working capital and promotional calendars across the whole year rather than merely during it. A manufacturer who mistimes inventory by a fortnight loses a fifth of annual sales with no possibility of recovery. Nothing in European or American frozen food behaves remotely like this, which is why imported commercial models consistently underperform here.
Market Impact: Drives 8.6% Saudi growth

Market Opportunities and Growth Drivers

Freezer penetration rises with income and reliable electricity

Household freezer ownership across the region sits near 61% and rises with income, housing quality and electricity supply reliability, which makes it the precondition for everything else in this category. A household without dedicated freezing capacity cannot buy frozen food regardless of price, availability or preference, and no amount of marketing changes that arithmetic. Gulf penetration is high and North African penetration considerably lower, which explains regional consumption differences better than income alone does. Every percentage point of penetration growth adds addressable households, and that expansion is happening steadily across Egypt, Morocco and Algeria.
Market Impact: Destroys 14% of product

Gulf food security programmes fund cold storage capacity

Saudi and Emirati food security strategies have committed capital to strategic reserves, cold storage capacity and domestic production, treating frozen food as infrastructure rather than as a commercial category. That investment raises how much product the region can physically handle and store, which has been the binding constraint on category growth more often than demand has. Saudi growth at 8.6% is the fastest of any country here and rests on programme funding alongside rising consumption. The capacity being built also improves the loss rate independently, since modern storage holds temperature that older facilities never did.
Market Impact: Imports 68% of consumption

Market Restraints and Challenges

Cold chain failure destroys a seventh of all product

Around 14% of frozen product is lost between manufacture and the consumer's freezer, through warehouse temperature excursions, transport failures, retail cabinets running warm and last mile delivery conducted in ambient heat exceeding forty five degrees. The root cause is infrastructure gaps rather than any single failure point, with each handover presenting an opportunity for temperature to rise. Commercially this destroys more value than the trade margins the industry negotiates over. Manufacturers are responding with temperature monitoring, retailer cabinet auditing and insulated last mile investment, none of which any single participant can implement alone.
Market Impact: Concentrates part of 14% losses

Import dependence transmits currency movement directly to shelves

Around 68% of regional frozen consumption arrives imported, which means shelf prices follow exchange rates, ocean freight availability and origin country export policy rather than anything a regional manufacturer or retailer controls. The root cause is that the region cannot produce the poultry, potato and vegetable volumes it consumes at competitive cost given water and land constraints. Commercially this produced severe demand disruption when Egyptian currency devalued, shifting consumption toward cheaper proteins abruptly. Participants are responding with local processing of imported bulk, longer forward cover and origin diversification across supplying countries.
Market Impact: Concentrates 22% into one month
3 additional market trends, 4 additional growth drivers, and 2 additional restraints and challenges are covered in the full report. Contact sales@marketmindsadvisory.com to access the complete intelligence.

Segment CAGR and Growth Architecture

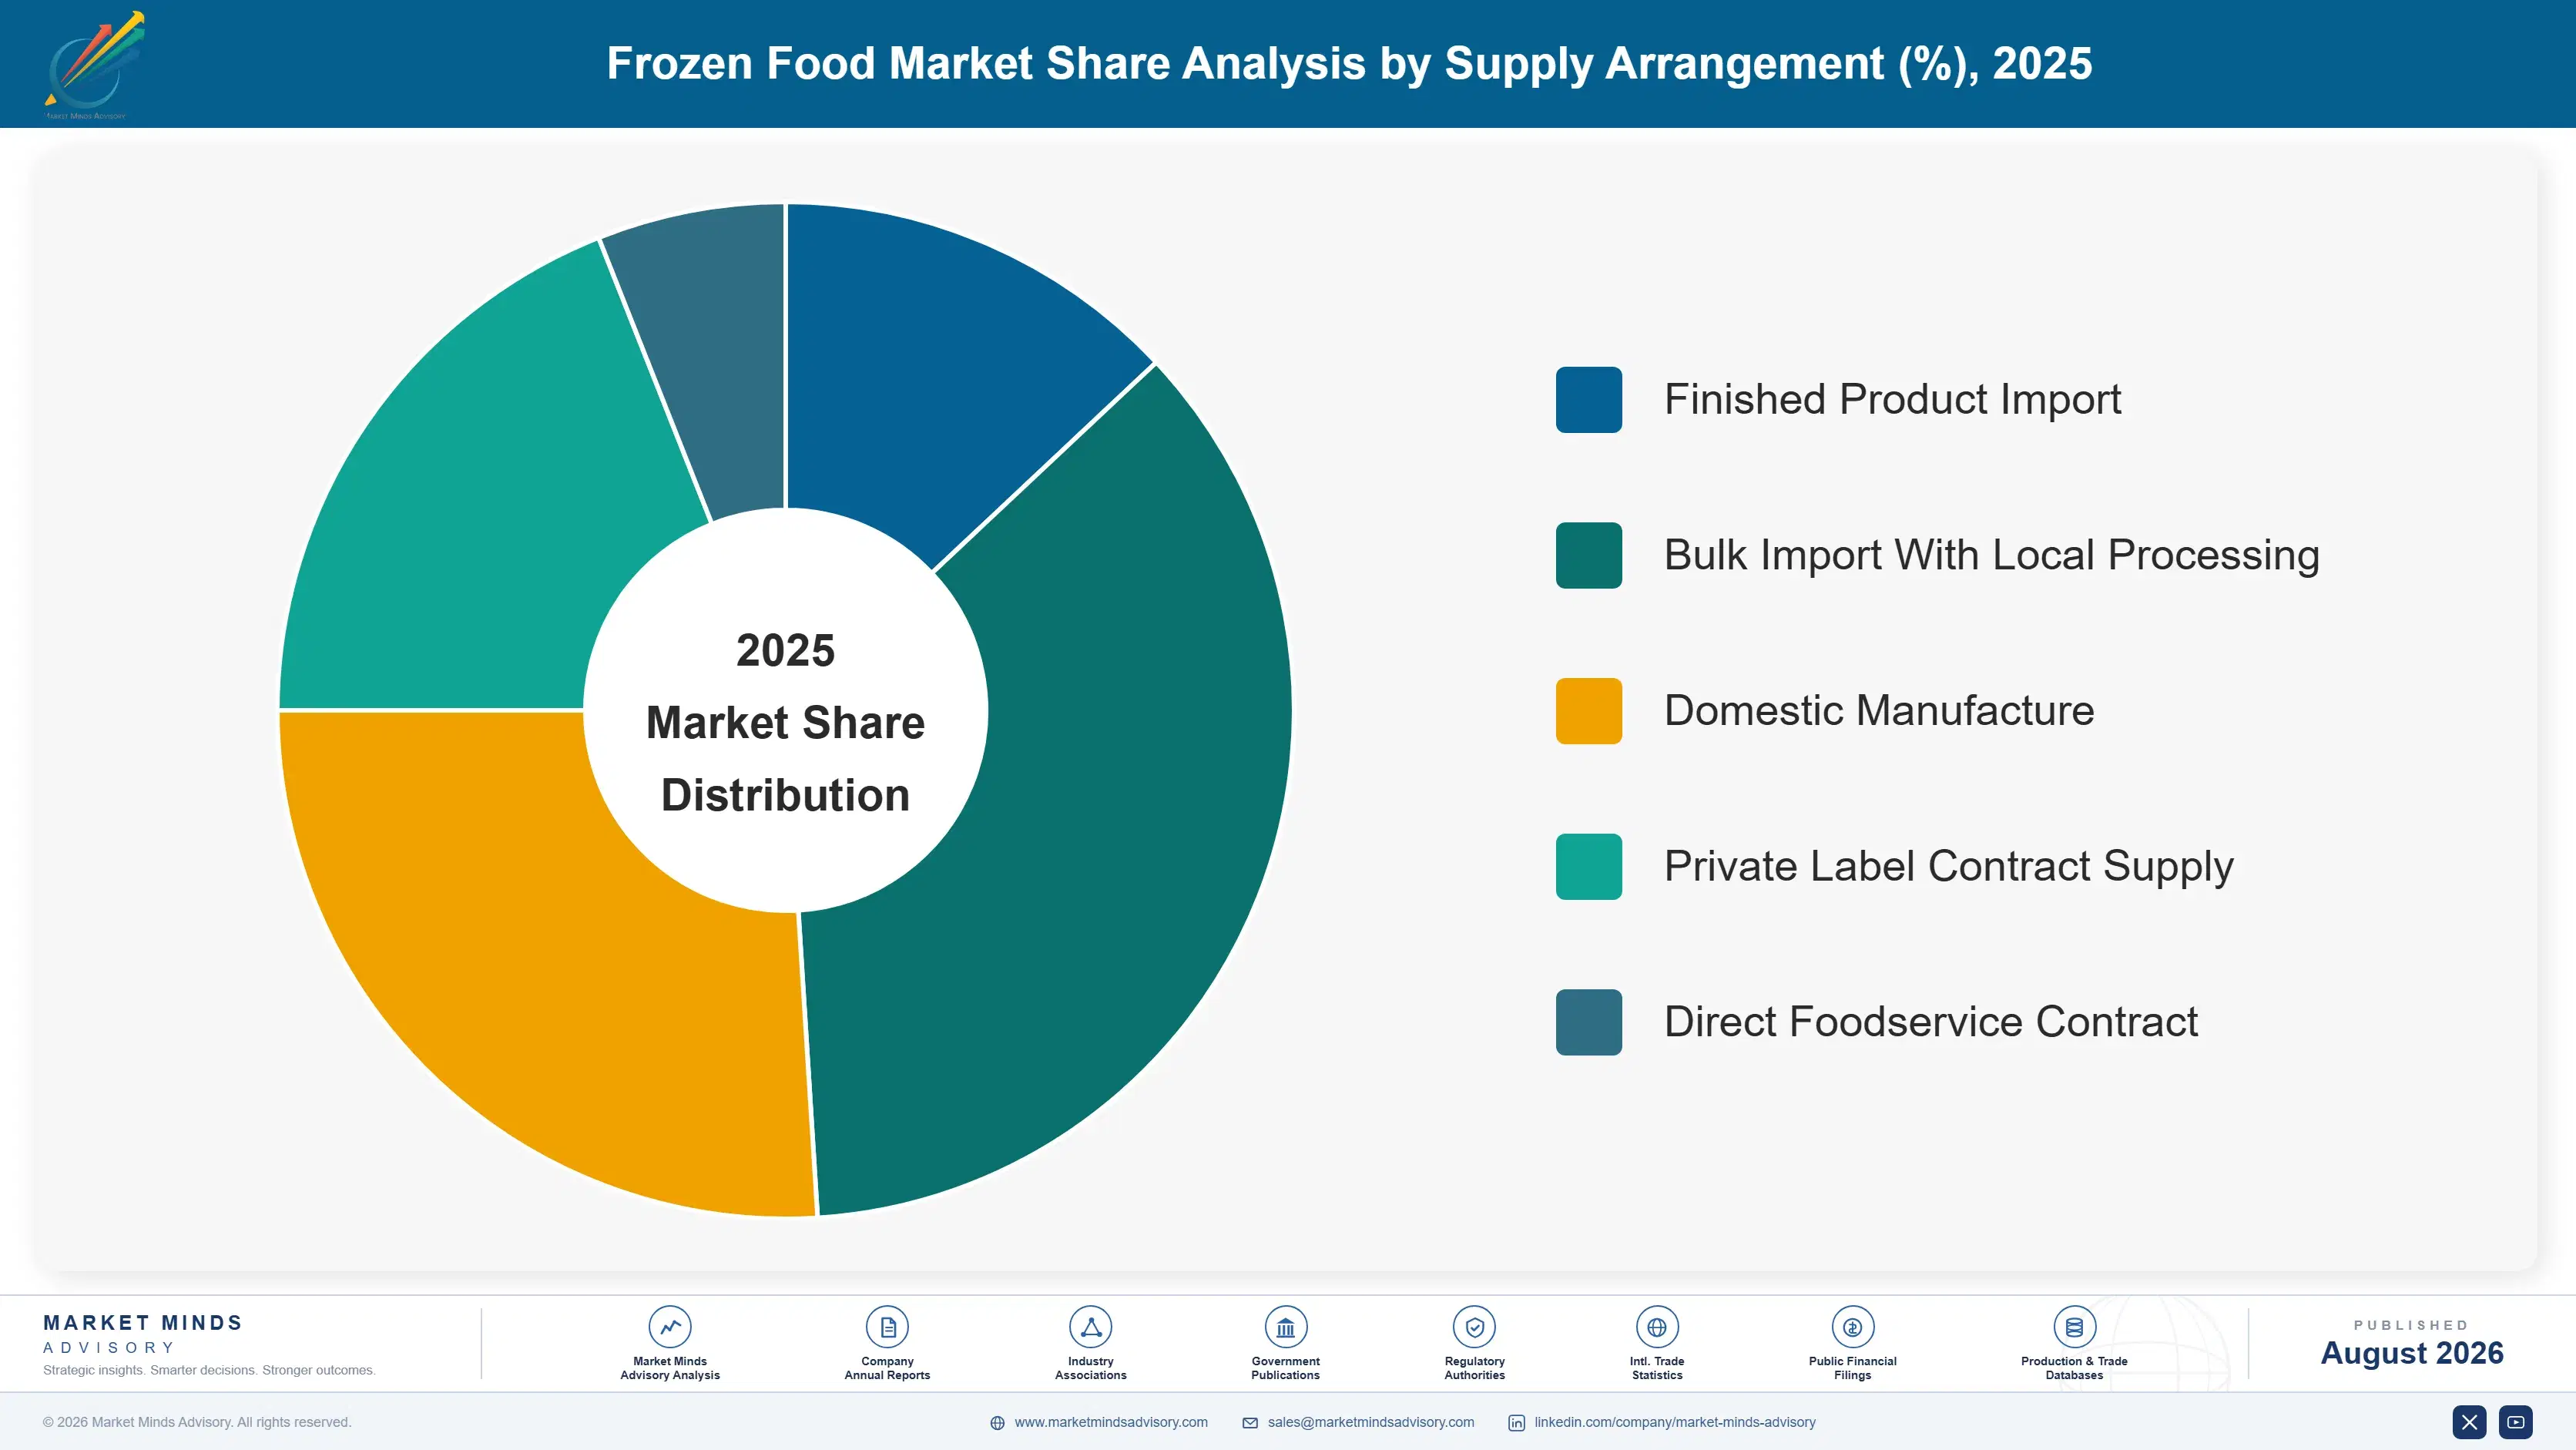
Products are classified here by food category, since that determines the sourcing origin, the cold chain sensitivity and the consumption occasion each serves. Distribution channel, pack format and consumer segment are handled separately in the framework, because one food category reaches retail, foodservice and delivery customers without changing what it is. Category decides sourcing and sensitivity.
middle-east-north-africa-frozen-food-market-share-analysis-1787555640282

Frozen Ready Meals and Prepared Dishes

Growing at 8.1%, half again the market rate, prepared frozen dishes follow urbanisation, rising female labour force participation and household sizes that keep shrinking across regional cities. Regional cuisine adaptation matters enormously and imported European formats consistently underperform, since a household buying frozen convenience still expects food it recognises. Local manufacturers producing regional dishes at scale have taken share from international brands repeatedly on exactly that point. The category is also the hardest to deliver through quick commerce, because prepared dishes suffer visibly from partial thawing in ways a bag of peas does not. That difficulty is where the loss rate concentrates most. Local manufacturers understood that first. International brands did not.
CAGR 8.1%

Frozen Bakery and Dough

Frozen dough and part-baked products let a bakery, supermarket or restaurant produce fresh bread without maintaining the skills, timing and waste that baking from scratch demands, which suits a region where bread consumption per head is among the highest anywhere. Growth at 7.2% follows in-store bakery expansion across modern retail and foodservice operators standardising output across many locations. The cold chain requirement is genuinely severe, since dough that partially thaws and refreezes produces bread that fails visibly rather than subtly. Manufacturers with reliable regional distribution hold positions that imported product cannot contest on freight and transit time alone. Bread consumption per head here is among the highest anywhere. Nothing else supplies it.
CAGR 7.2%
Full segment breakdown across 6 segments available in the complete report.

Regional Architecture and Country Demand Map

East Asia holds 27% of global value on Chinese frozen prepared food at a scale nothing else matches. The Middle East and North Africa holds 5%, importing 68% of what it consumes. Cold chain capability rather than appetite decides regional shares here. Appetite was never the constraint.

Middle East and Africa

This region is the analytical centre of the report and it presents commercial conditions no other frozen market approaches. Around 68% of consumption arrives imported because water and land constraints prevent regional production of the poultry, potato and vegetable volumes consumed. Ramadan concentrates roughly 22% of annual sales into one month, which determines storage, working capital and import scheduling for the entire year. Cold chain losses run near 14% in ambient temperatures that destroy product within minutes of a break. Gulf food security investment is building capacity while North African currency instability keeps disrupting demand. Ramadan and the cold chain between them explain more about this market than income does.
Share: 5% | CAGR: 5.8% (2026 to 2036)

East Asia

Chinese frozen prepared food operates at a scale nothing elsewhere matches, built on dumplings, hot pot ingredients and prepared dishes that suit both household cooking and the enormous foodservice sector. Cold chain infrastructure has improved dramatically over a decade and now supports categories that were previously impossible to distribute. Japanese frozen food is the most technically sophisticated anywhere, with quality standards and convenience formats other markets copy. Korean frozen convenience is expanding rapidly with household size reduction. Growth at 6.4% is the fastest large-region figure and combines category expansion with cold chain capability finally catching up to ambition. Cold chain capability finally caught up with category ambition, which took a decade.
Share: 27% | CAGR: 6.4% (2026 to 2036)
Regional intelligence for 5 additional markets available in the complete report: North America, Western Europe, South Asia and Pacific, Latin America, Eastern Europe. Contact sales@marketmindsadvisory.com.
middle-east-north-africa-frozen-food-country-cagr-analysis-1787555640797

Where Frozen Margin Actually Sits

Four moves matter for anybody operating where a seventh of the product never reaches a customer and a fifth of the year happens in one month. Two are about the losses nobody costs properly, and two are about the concentration and dependence that define this region. Negotiating trade margin is not among them. Nothing else compares.

Attack the loss rate before the trade terms

Around 14% of frozen product is destroyed between manufacture and the consumer's freezer, which is several times larger than the trade margin manufacturers and retailers spend their negotiations arguing about. Temperature monitoring through the chain, retailer cabinet auditing and insulated last mile investment each recover product that is currently thrown away. No single participant can fix it alone, which is precisely why nobody has, and why whoever organises a coordinated programme with retailers and distributors captures value competitors leave on the floor every single week. Nobody has organised it yet.
Market Impact: Recovers part of a 14% total product loss

Plan the entire year around Ramadan inventory

Around 22% of annual category sales occur across one month with household stocking beginning weeks beforehand, which makes Ramadan timing the single largest operational variable anybody in this region manages. Cold storage capacity, import arrival scheduling, distributor working capital and promotional calendars all follow from it. A fortnight of mistiming loses a fifth of the year irrecoverably. Manufacturers running European or American planning calendars consistently underperform here, and the ones who build the whole operating year backwards from Ramadan handle the remainder comfortably. Everything else follows from it. Nothing else compares in scale.
Market Impact: Manages a full 22% of annual category sales

Build insulated last mile before delivery platforms scale

Quick commerce promising fifteen to thirty minute delivery destroys frozen quality in ambient temperatures above forty degrees when riders carry uninsulated bags, and the customer who receives softened product simply stops ordering the category. That is teaching consumers that frozen and delivery do not mix, which damages the whole category rather than any single brand. Manufacturers and retailers funding insulated containers and dark store freezer capacity capture a growing channel while competitors actively train customers away from it. The investment is modest against the volume at stake. Roughly 40 degrees ambient destroys frozen quality within minutes of leaving a freezer.
Market Impact: Protects product against 40 degree ambient delivery heat

Process imported bulk locally rather than importing finished

Around 68% of regional consumption arrives imported, which transmits exchange rate movement, freight availability and origin export policy straight onto the shelf with nothing absorbing it. Importing bulk frozen material and processing, portioning and packing regionally shortens the exposed portion of the chain considerably and adds value locally. Egyptian devaluation demonstrated how brutally the finished import model transmits currency shocks to consumers. Regional processing also cuts cold chain handovers, which addresses the loss rate at the same time as the currency exposure rather than separately. Two problems, one investment. Both improve together.
Market Impact: Cuts exposure across 68% of all imported volume

Who Controls the Margin Pool

Five manufacturers hold just 21% of global frozen food supply, measured on retail and foodservice sales at manufacturer level, the basis used throughout this section. Regional fragmentation runs higher still, because frozen food is heavy, temperature-critical and expensive to move, which favours regional production and local brands over global scale. The gap between leaders and everybody else is cold chain reach rather than any manufacturing or formulation advantage. Weight and temperature favour regional players decisively.
Competition runs on three dimensions. Cold chain reliability, since a brand whose product arrives partially thawed loses customers permanently rather than temporarily. Regional recipe relevance, because households buying convenience still expect food they recognise. And Ramadan execution, which decides a fifth of the year. Price competes hardest in commodity frozen protein and vegetables where origin is interchangeable. Ramadan execution decides a fifth of the year.

Rankings shift where cold chain investment reaches markets that previously could not distribute frozen product reliably. Local manufacturers producing regional dishes keep taking share from international brands on recipe relevance. Quick commerce is redistributing positions toward whoever solved insulated delivery first, which is currently very few participants.
middle-east-north-africa-frozen-food-company-positioning-matrix-1787555641360

Competitive Moat and Risk Dimensions

BRF

Moat: Halal poultry origin position

BRF supplies halal poultry into Middle Eastern markets at volumes and certification depth that few origins can match, which matters because the region cannot produce the protein it consumes and halal compliance is not negotiable. That combination of scale, certification and established import relationships is genuinely difficult to displace regardless of price movements in any given season.
BRF

Risk: Currency and trade exposure

Revenue depends on importing markets whose purchasing power moves with currency and whose governments manage imports through licensing, tariffs and periodic restriction. Egyptian devaluation demonstrated how quickly consumption shifts to cheaper proteins when exchange rates move. Regional producers face none of that transmission, even where their cost base is genuinely higher.
SUNBULAH GROUP

Moat: Regional recipe and distribution

Sunbulah produces frozen products built around regional cuisine and distributes through cold chain infrastructure adapted to conditions imported models handle badly. Households buying convenience still expect food they recognise, and that recipe relevance has repeatedly taken share from international brands offering technically superior products nobody wanted to eat.
SUNBULAH GROUP

Risk: Imported raw material dependence

Regional manufacture still depends on imported raw material for most inputs, since water and land constraints prevent local production of the protein and vegetable volumes required. Currency exposure therefore reaches the cost base even where the finished product is made locally. Competitors integrated back to origin production carry that exposure differently.

Players Tracked

Prominent Players

Nestle
BRF
Sunbulah Group
Al Kabeer Group
Almarai

Other Key Players

Tyson Foods
Cargill
JBS
Lamb Weston
McCain Foods
Ardo
Greenyard
Dr. Oetker
Nomad Foods
Emborg
Seara
Bidfood
IFFCO
Halwani Bros
Americana Foods

Recent Developments

MARCH 2025

A Gulf retailer audited cold chain temperature across its network

A Gulf grocery retailer implemented continuous temperature monitoring across distribution and store display cabinets, following losses that internal review attributed to warm running equipment rather than to any supplier failure. This was an operational programme rather than any transaction between suppliers or retailers. Supplier blame proved misplaced.
Signal: Retailers are finally measuring where product is lost, which will reallocate blame and cost across the chain considerably
AUGUST 2025

A delivery platform introduced insulated frozen handling

A regional quick commerce platform introduced insulated containers and dark store freezer capacity for frozen categories, after customer complaints about partially thawed deliveries suppressed reordering across the category. This was an operational investment rather than any commercial arrangement with manufacturers or brands. Reordering had collapsed entirely.
Signal: Uninsulated delivery was teaching customers to avoid frozen entirely, which damages the category rather than any brand
DECEMBER 2025

A regional manufacturer opened local processing of imported bulk

A regional frozen food manufacturer commissioned capacity to process, portion and pack imported bulk frozen material locally rather than importing finished product, shortening the exposed supply chain and adding regional value. This was organic capital investment rather than any acquisition or partnership. Currency exposure shortened considerably.
Signal: Local processing of imported bulk cuts both currency exposure and cold chain handovers, which addresses two problems at once

What Moves Manufacturer Cost

Food inputs account for around 58% of manufacturer cost, dominated by imported poultry, potato, vegetable and seafood raw material priced in dollars regardless of where the product is finished. Freezing energy and cold storage are substantial and rise with ambient temperature. Packaging is modest. Cold chain distribution cost per tonne runs well above ambient food distribution and rises further with delivery fragmentation.
Global poultry and grain prices moved sharply through 2021 and 2022 on feed costs and supply disruption, and USDA trade data record the volume and price movements across the period. BRF noted input cost and currency pressure across its international operations in its Annual Report 2022. Regional manufacturers on retailer price agreements absorbed most of it, since a grocery chain sets shelf prices for a period.

Energy for freezing and cold storage behaves differently here than anywhere else, because ambient temperature determines how hard refrigeration works and regional ambient temperatures are extreme for months at a time. A cold store in Riyadh consumes substantially more energy per tonne than one in Rotterdam holding identical product at identical temperature. That cost belongs to the geography and no operational improvement removes it, though solar is changing the arithmetic.
middle-east-north-africa-frozen-food-cost-volatility-analysis-1787555641632

Contract imported protein across multiple origins and seasons

Around 68% of consumption arrives imported and origin countries manage exports through policy that changes without warning, which makes single-origin dependence a genuine availability risk rather than merely a pricing one. Contracting across Brazil, Ukraine, India and other origins secures supply when one closes. Diversification costs relationship effort rather than capital, which makes it cheap protection.

Generate cold store power from solar where sunshine is free

Refrigeration energy rises with ambient temperature and regional ambient temperatures are extreme for months, which makes cold storage energy a permanently higher cost here than in temperate geographies. The same climate delivers exceptional solar resource. Cold stores generating daytime power address a cost no efficiency touches, and payback improves yearly. The same climate delivers exceptional solar resource anyway.

Index retailer agreements to published protein benchmarks

Food inputs at 58% of cost price in dollars on global protein and grain markets that move for reasons entirely unconnected to regional demand, and fixed retailer pricing transfers that whole exposure to the manufacturer. Indexing to published benchmarks with periodic reset removes it. Retailers resist because shelf pricing is competitive, which makes this a real negotiation.

Portfolio Architecture for Margin Defence

Margin here tracks cold chain reliability and recipe relevance rather than manufacturing efficiency, because freezing food is straightforward and delivering it intact in this climate is not. Commodity frozen protein and vegetables run at gross margins in the low teens against interchangeable origins competing purely on landed price. Frozen potato and bakery products run better on processing value and distribution reliability. Prepared regional dishes and premium formats run considerably higher, because recipe relevance and brand trust both matter to a household buying convenience.
The tension is that commodity protein carries the volume through the supply chain while prepared dishes carry the margin, and the two need different manufacturing, different sourcing and different consumer understanding. A business built around importing and distributing frozen chicken has almost nothing in common with one developing regional prepared meals. Several participants have found the commodity volume consuming the working capital that product development required, particularly around Ramadan when inventory absorbs everything available.

High-value pools sit in regional prepared dishes, frozen bakery and any position that reduces the 14% loss rate. None of the three is where the imported tonnage is. Distribution scale by itself defends very little where the product arrives thawed.

Volume / Commodity-Adjacent

Imported frozen protein, seafood and vegetables competing on landed price across interchangeable origins with no differentiation beyond certification. The eight-point range separates importers with diversified origin contracts from those exposed to single-origin export policy changes.
Gross Margin: 11%-19%

Premium / Certified

Frozen potato products, bakery and dough where processing value and distribution reliability narrow the field considerably. The ten-point spread reflects cold chain capability, since dough that partially thaws produces bread that fails visibly rather than subtly.
Gross Margin: 22%-32%

Sustainability / Regulatory / Next-Generation

Regional prepared dishes, premium convenience formats and delivery-capable frozen product. The sixteen-point range is wide because recipe relevance and brand trust price against consumer preference rather than against any commodity benchmark available.
Gross Margin: 30%-46%
middle-east-north-africa-frozen-food-portfolio-architecture-1787555642312

High-value Sub-segments and Strategic Watch-out

Regional Prepared Dishes

Compounding at 8.1% on urbanisation and working patterns, and consistently winning against imported European formats because households buying convenience still expect food they actually recognise and want. Imported European formats have failed here repeatedly, which local manufacturers noticed first. That lesson cost several brands dearly.
Gross Margin: 32%-46%

Cold Chain Loss Recovery

Fourteen percent of product never reaches a customer, which is several times the trade margin everybody negotiates over. No single participant can fix it alone, which is exactly why nobody yet has. Coordinating retailers, distributors and delivery partners is the whole difficulty involved. Nobody owns the whole chain.
Gross Margin: 26%-44%

Imported Commodity Protein

The tonnage that fills the cold chain, competed on landed price across interchangeable origins and exposed directly to currency and export policy. Manage for origin diversity rather than for margin here. Origin export policy changes without warning and nobody in the region can influence it.
Gross Margin: 11%-19%

Frozen Bakery And Dough

Growing at 7.2% as in-store bakery expands across modern retail, in a region with among the highest bread consumption anywhere. Cold chain failure shows visibly in the finished loaf, which favours reliable regional distribution. Reliable regional distribution beats imported product on transit time alone. Transit time decides it.
Gross Margin: 24%-34%

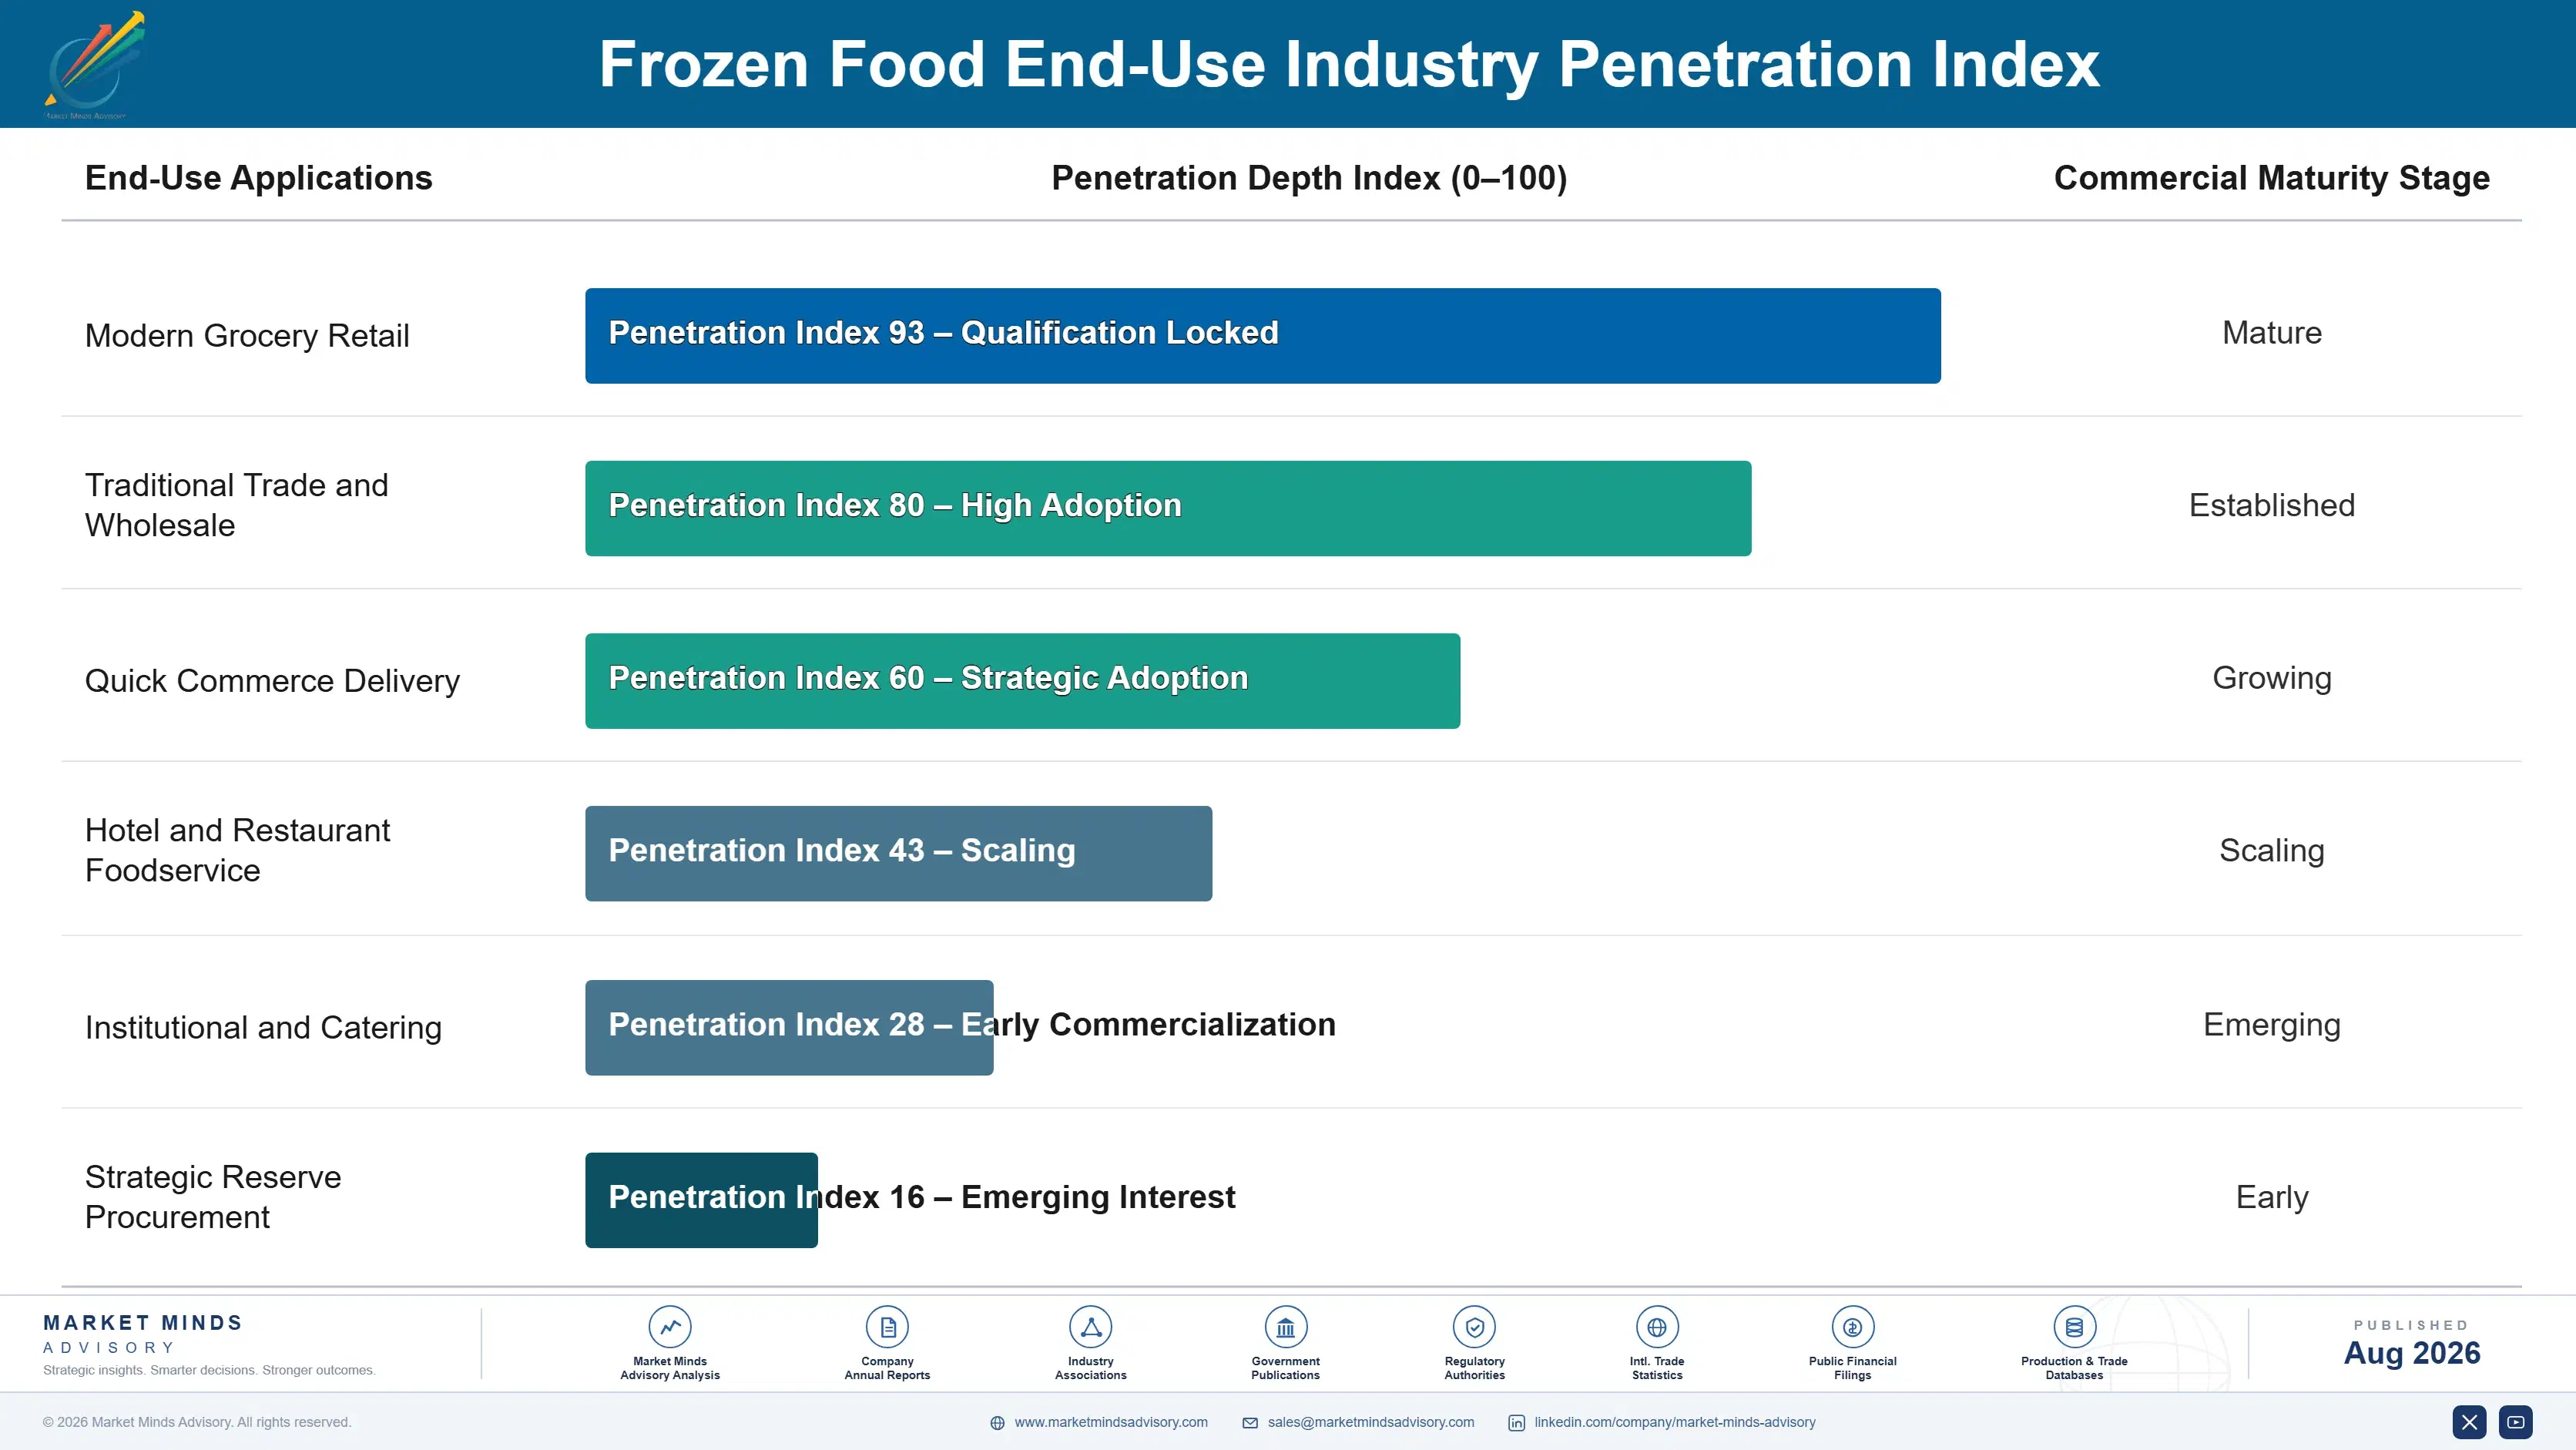
How Frozen Demand Renews

Demand renews weekly at the shopping trip and annually at Ramadan, and the second matters more than the first. Around 22% of category sales occur across one month, which means a household's frozen buying pattern is genuinely bimodal in a way no other food category experiences. The rest of the year is routine replenishment at modest volumes. Manufacturers planning around average weekly offtake consistently misjudge both the storage requirement and the promotional calendar.
Stickiness depends on whether the product arrived in good condition, which is not entirely within any brand's control. A household that opens a partially thawed pack blames the brand rather than the retailer cabinet or the delivery rider, and does not repurchase. That makes cold chain reliability a brand equity question rather than a logistics one. Regional recipe products retain better because the alternative genuinely tastes wrong to the household buying it.

The buyer is changing through channel rather than through demographics. Frozen food was bought in supermarkets by households with cars and freezers. It is increasingly ordered through delivery platforms by younger urban households, which places the product in the hands of a rider with an uninsulated bag and changes what arrives entirely.
middle-east-north-africa-frozen-food-end-use-penetration-index-1787555642837

Where To Place The Bet

These are among the four positions where our research anticipates prominent divergence between winners and laggards over the coming forecast period. Each is grounded in the demand model, the regulatory perimeter, and the announced capacity pipeline.
01 / LOSS RATE PRIORITY

Fix the cold chain before the trade terms

Around 14% of frozen product is destroyed between manufacture and the consumer's freezer through warehouse excursions, transport failures, retail cabinets running warm and last mile delivery conducted in ambient heat above forty degrees. That figure is several times larger than the trade margin manufacturers and retailers spend their annual negotiations arguing about, and recovering even part of it improves availability, quality and profit simultaneously. No single participant can fix it alone, which is exactly why nobody has and why a coordinated programme captures value everybody currently discards.
02 / RAMADAN PLANNING DISCIPLINE

Build the operating year backwards from Ramadan

Roughly 22% of annual frozen category sales occur across a single month, with household stocking beginning several weeks beforehand and foodservice demand shifting entirely as eating patterns change across the region. That concentration dictates cold storage capacity, import arrival scheduling, distributor working capital and promotional calendars for the whole year rather than merely for that month. A fortnight of mistiming loses a fifth of annual sales with no recovery available, and manufacturers running imported European planning calendars underperform here consistently.
03 / DELIVERY CHANNEL PROTECTION

Insulate the last mile or lose the channel

Quick commerce platforms promising fifteen to thirty minute delivery destroy frozen quality when riders carry uninsulated bags through ambient temperatures above forty degrees, and a customer receiving softened product stops ordering the category rather than switching brands. That is actively teaching a growing consumer segment that frozen and delivery are incompatible, which damages the entire category rather than any individual participant. Funding insulated containers and dark store freezer capacity is modest against the volume at stake and captures a channel competitors are surrendering.
04 / LOCAL PROCESSING SHIFT

Import the bulk and finish it regionally

Around 68% of regional frozen consumption arrives as finished imported product, which transmits exchange rate movement, ocean freight availability and origin country export policy directly onto the shelf with nothing at all absorbing the shock. Egyptian devaluation demonstrated exactly how brutally that model passes currency crises to consumers who then buy cheaper proteins instead. Importing bulk material and processing, portioning and packing regionally shortens the exposed chain, adds local value and cuts cold chain handovers, which addresses currency and loss rate together.

Engagement Snapshot From the Field

A live engagement with an industry participant carrying material or product regulatory and market exposure ahead of a defining policy shift, showing how our research translates into a defensible multi-year portfolio strategy.
MARKET MINDS ADVISORY · CLIENT ENGAGEMENT SUMMARY
Frozen Food Producer Strategic Portfolio Review and Transition Roadmap 2026·Investment Scenario on Frozen Food Exposure Evaluation 2025-26
CLIENT PROFILE
A Gulf frozen food distributor with annual revenue around USD 210 million (client-reported, unverified by MMA), importing and distributing frozen poultry, vegetables and prepared products across three markets. Cold chain ran through owned storage and contracted transport. Roughly 70% of volume was imported finished product. Quick commerce channel supply had begun without any insulated handling.
STRATEGIC CHALLENGE
Margins had compressed across two years (client-reported, unverified by MMA) and management proposed renegotiating supplier terms and retailer trade margins. Nobody had quantified product loss through the chain, which meant the negotiation targeted a number considerably smaller than the one being discarded weekly through temperature failures. Loss had never been measured across the chain.
MMA APPROACH
MMA measured temperature continuity across the client's chain from port arrival to retail cabinet rather than accepting margin as the only variable, using data loggers across representative routes. Loss was quantified at each handover. Quick commerce delivery outcomes were assessed through customer reorder data, and local processing economics were modelled against finished import for the largest volume lines.
KEY FINDINGS
  1. Measured product loss through the client's chain substantially exceeded the trade margin management was negotiating over, and most of it occurred at retail cabinets and in last mile delivery.
  2. Quick commerce customers who received partially thawed product reordered frozen categories at a small fraction of the rate of those who did not, which nobody had measured before.
  3. Local processing of imported bulk for the three largest volume lines would have cut currency exposure and removed two cold chain handovers at once, improving both problems together.
  4. Retail cabinet temperature failures were concentrated in a minority of stores, which meant a targeted intervention rather than a network programme would recover most of the loss.
CLIENT PROFILE
A Gulf frozen food distributor with annual revenue around USD 210 million (client-reported, unverified by MMA), importing and distributing frozen poultry, vegetables and prepared products across three markets. Cold chain ran through owned storage and contracted transport. Roughly 70% of volume was imported finished product. Quick commerce channel supply had begun without any insulated handling.
STRATEGIC CHALLENGE
Margins had compressed across two years (client-reported, unverified by MMA) and management proposed renegotiating supplier terms and retailer trade margins. Nobody had quantified product loss through the chain, which meant the negotiation targeted a number considerably smaller than the one being discarded weekly through temperature failures. Loss had never been measured across the chain.
MMA APPROACH
MMA measured temperature continuity across the client's chain from port arrival to retail cabinet rather than accepting margin as the only variable, using data loggers across representative routes. Loss was quantified at each handover. Quick commerce delivery outcomes were assessed through customer reorder data, and local processing economics were modelled against finished import for the largest volume lines.
KEY FINDINGS
  1. Measured product loss through the client's chain substantially exceeded the trade margin management was negotiating over, and most of it occurred at retail cabinets and in last mile delivery.
  2. Quick commerce customers who received partially thawed product reordered frozen categories at a small fraction of the rate of those who did not, which nobody had measured before.
  3. Local processing of imported bulk for the three largest volume lines would have cut currency exposure and removed two cold chain handovers at once, improving both problems together.
  4. Retail cabinet temperature failures were concentrated in a minority of stores, which meant a targeted intervention rather than a network programme would recover most of the loss.
RECOMMENDED STRATEGY
Phase 1: Phase one: pause the trade margin negotiation and run a targeted retail cabinet intervention at the minority of stores accounting for most measured loss. Phase 2: Phase two: fund insulated containers for quick commerce delivery partners, since the reorder data shows the channel is being destroyed rather than developed. Phase 3: Phase three: commission local processing of imported bulk for the three largest lines, addressing currency exposure and cold chain handovers simultaneously.
OUTCOME
Cabinet intervention completed at the identified stores with measured loss falling materially. Insulated delivery handling operates with two platforms and reorder rates have recovered. Local processing is under construction, and the client reports margin improving without any renegotiation (client-reported, unverified by MMA). Terms were never reopened at all.

Frequently Asked Questions

Foundational context covering the market sizes, CAGR, scope, country, region and competition that inform every finding below. This section is provided to cover basics and most often pre-purchase conversations, answered from the MMA Primary Research Dataset.

What is the current size of the Frozen Food Market?

The market was valued at USD 268.4 billion in 2025, rising to an estimated USD 282.89 billion in 2026. East Asia holds the largest regional share at 27% of value.

How large will the Frozen Food Market be by 2036?

MMA forecasts USD 478.66 billion by 2036 under the base case, an expansion multiple of 1.69 times the 2026 value. That represents USD 195.77 billion of incremental value.

What is the CAGR for the Frozen Food Market 2026 to 2036?

The base case runs at 5.4% compound annual growth between 2026 and 2036, with a bull case at 6.6% and a bear case at 4.2%. Historical growth from 2020 to 2025 was 4.4%.

Which segment is growing fastest?

Frozen ready meals and prepared dishes lead at 8.1%, half again the market rate, on urbanisation and changing working patterns. Frozen bakery follows at 7.2%.

Who are the major companies in the Frozen Food Market?

Nestle, BRF, Sunbulah Group, Al Kabeer Group and Almarai hold just 21% of supply between them. Cold chain reach rather than manufacturing scale sustains those positions.

Which country is growing fastest?

Saudi Arabia leads at 8.6%, driven by food security programmes funding cold storage capacity alongside consumption that rises steadily with income and household freezer ownership.

Report Segmentation Architecture

The full report scope spans multiple orthogonal segmentation dimensions, with cross-tabulated demand data provided for each dimension pair. Coverage extends further to regional breakdowns, trend trajectories, and the competitive detail needed to support segment-level decision-making.

By Food Category

  • Frozen Poultry and Meat
  • Frozen Vegetables and Fruit
  • Frozen Potato Products
  • Frozen Ready Meals and Prepared Dishes
  • Frozen Seafood
  • Frozen Bakery and Dough

By End-Use Industry

  • Modern Grocery Retail
  • Traditional Trade and Wholesale
  • Quick Commerce Delivery
  • Hotel and Restaurant Foodservice
  • Institutional and Catering
  • Strategic Reserve Procurement

By Supply Arrangement

  • Finished Product Import
  • Bulk Import With Local Processing
  • Domestic Manufacture
  • Private Label Contract Supply
  • Direct Foodservice Contract

By Region

  • North America
  • Western Europe
  • East Asia
  • South Asia and Pacific
  • Latin America
  • Middle East and Africa
  • Eastern Europe

Scope, Methodology, and Coverage

Every figure in this report is reproducible from documented input assumptions. The scope below maps the historical period, the forecast horizon, the segmentation dimensions, and the countries covered, alongside the underlying primary and qualitative methodology.
Historical Period
2020 to 2025
Forecast Period
2026 to 2036
Base Year
2025 (USD billions; MMA Primary Research Dataset, August 2026)
Market Definition
The market comprises frozen food products supplied through retail, foodservice and delivery channels, covering frozen poultry and meat, frozen vegetables and fruit, frozen potato products, frozen ready meals and prepared dishes, frozen seafood, and frozen bakery and dough. The Middle East and North Africa market is treated as the analytical centre, with global demand and supply covered for comparative context. Value is measured at manufacturer level across import, domestic manufacture and private label channels. Ice cream and frozen desserts, chilled and ambient products, fresh produce, cold chain equipment and logistics services fall outside scope.
Quantitative Units
USD billions (current prices); million tonnes of product supplied annually; USD per tonne by food category
Segmentation Dimensions
By Food Category; By End-Use Industry; By Supply Arrangement; By Region
Regions Covered
North America, Western Europe, East Asia, South Asia and Pacific, Latin America, Middle East and Africa, Eastern Europe
Countries Covered
Saudi Arabia, United Arab Emirates, Egypt, Morocco, Algeria, Kuwait, Qatar, Oman, Jordan, Tunisia, United States, Canada, Mexico, Brazil, Argentina, Chile, Germany, France, United Kingdom, Netherlands, Belgium, Spain, Poland, Ukraine, China, Japan, South Korea, India, Thailand, Australia
Key Companies Profiled
Nestle, BRF, Sunbulah Group, Al Kabeer Group, Almarai, Tyson Foods, Cargill, JBS, Lamb Weston, McCain Foods, Ardo, Greenyard, Dr. Oetker, Nomad Foods, Emborg, Seara, Bidfood, IFFCO, Halwani Bros, Americana Foods
Quantitative Methodology
Primary survey, n=3,800 respondents, Q4 2025, six countries; demand-side model with trade association cross-validation
Qualitative Methodology
47 expert interviews, Q4 2025; applied to validate demand model assumptions, identify emerging dynamics, and assess competitive positioning
Report Format
PDF and XLSX data workbook (Word format preview document)
Publisher
Market Minds Advisory
Report Code
MMA-2026-AGR-112
Published
August 2026
Contact
sales@marketmindsadvisory.com | www.marketmindsadvisory.com

Purchase the full Frozen Food Market Report (2026 to 2036).

The full report sizes the global frozen food market to 2036 across six food categories and seven regions, with the Middle East and North Africa as the analytical centre and global demand covered for context. It quantifies cold chain loss at each handover rather than treating it as an operational footnote, since the figure exceeds the trade margins the industry negotiates. Competitive analysis covers 20 participants evaluated on manufacturer sales value, with moat and risk assessment for the two leaders. Ramadan demand concentration is modelled against storage, working capital and import scheduling requirements. Four quantified revenue levers close the analysis.
Six-category segment sizing with segment-level growth rates
Seven-region share and growth breakdown to 2036
Twenty-participant competitive map on one sales basis
Cold chain loss quantified at every handover in the chain
Ramadan concentration modelled against storage and working capital
Four quantified revenue levers with commercial impact ranges

Built For The People Who Decide

From boardroom strategy to bench-side execution, this report is read cover-to-cover by leaders shaping the next decade of their industry, turning demand scenarios, market dynamics and valuation benchmarks into decisions.
CXOs/ Presidents/ VPs/ Managers
M&A and Corporate Development
Strategy Teams and R&D Heads
Procurement and Product Directors
Regulatory and Compliance Leaders
Investor Relations and Equity Analysts