Market Minds Advisory
Bio-Stimulants Market

Bio-Stimulants Market: Abiotic stress response, registration gaps and product verification to 2036

This is the one region where these products hold their strongest technical case alongside their weakest commercial infrastructure anywhere, which attracts serious science and outright fraud in roughly equal measure.

Lead Analyst

Bilal Shaikh

Published

September 2026

Make Smarter Decisions with Customized Research Insights

Request a free sample report and evaluate market opportunities, growth trends, and competitive dynamics relevant to your business needs.

2025 MARKET VALUE$4.2BMarket Size 2025
2036 FORECAST VALUE$12.2BBase Case , 2026 to 2036
CAGR 2026 TO 203610.2 %Bull 11.5% / Bear 8.9%
INCREMENTAL OPPORTUNITY$7.6BNet 10- year value creation
EXPANSION MULTIPLE2.64x2036 value over 2026 base
Strategic Levers
M&A Pipeline
Regional Outlook
Country Rankings
Competitive Intelligence
Segmental Deep-dive
Call-Us : 91 93563 13602

Executive Snapshot and Market Trajectory

Biostimulants deliver around 18% yield improvement where abiotic stress limits a crop and far less where it does not. Heat, salinity and degraded soils give this region the strongest technical case anywhere, alongside the weakest regulation. Almost nobody verifies what they buy. Nothing stops them.
Microbial inoculants grow at 15.3%, half again the market rate of 10.2%, because living organisms improving nutrient uptake and stress tolerance address exactly what limits yield across the region. Western Europe holds 26% of global value because regulation created a legal category there. Regional irrigation water runs near 3 decisiemens per metre of salinity. Salinity tolerance is the clearest and most defensible claim available to anybody selling here.
Five manufacturers hold just 28% of supply and fragmentation is the least of the category's problems. Only about 12% of products sold across the region hold any formal approval, and roughly 23% of agri-input samples fail composition verification entirely. A genuine technical case with no registration requirement produces serious agronomy and products containing nothing. A grower cannot tell them apart. Nothing requires them to. Regulation would fix it and nobody has written any.
Market Definition
This report covers biostimulant products enhancing plant nutrient efficiency, abiotic stress tolerance and crop quality independently of nutrient content, spanning humic and fulvic substances, seaweed and botanical extracts, protein hydrolysates and amino acids, microbial inoculants, inorganic and silicon-based products, and chitosan and biopolymer products. The Middle East and Africa market is the analytical centre, with global demand covered for context. Excluded are conventional fertilisers, crop protection products, biopesticides, soil amendments sold on nutrient content, and seed treatments.
Base Year Value
$4.2B in 2025 (MMA Primary Research Dataset, August 2026)
Forecast Period
2026 to 2036, eleven discrete annual values
CAGR
10.2% base case. Bull 11.5%. Bear 8.9%.
Fastest Growth Segment
Microbial Inoculants: 15.3% CAGR
Fastest Growth Country
Saudi Arabia: 14.2% CAGR
Fastest Growth Region
South Asia and Pacific: 12.4% CAGR
Largest Region
Western Europe: 26% of 2025 global value
Market Leaders
UPL, Syngenta Biologicals, Yara International, Corteva Agriscience and Haifa Group lead the market. Source: MMA Primary Research Dataset, July 2026.
Primary Survey
n=3,800 procurement and R&D decision-makers, Q4 2025, six countries
Methodology
Demand-side build-up, cross-validated against public data, 47 expert interviews

Bio-Stimulants Market Forecast Scenarios

middle-east-and-africa-bio-stimulants-market-size-forecast-scenario-1787555616508
Growth ran at 8.8% between 2020 and 2025 and European regulation did more for the global category than any agronomic development. The Fertilising Products Regulation created a legal biostimulant classification with defined claims, which gave the category commercial legitimacy it had never previously held anywhere. Regional growth came from Gulf food security investment and commercial farming in South Africa, Kenya and Morocco rather than from smallholders.
The 10.2% base case rests on three mechanisms. Abiotic stress keeps intensifying across the region as temperatures rise, irrigation water salinises and soils degrade, which is precisely the condition where these products deliver measurable response. Gulf controlled environment agriculture keeps expanding under food security programmes and buys inputs on trial evidence rather than on price. And microbial inoculants keep taking share at 15.3% as formulation stability improves enough for hot climate distribution.
The 11.5% bull case is regional registration frameworks emerging, which would separate genuine products from the roughly 23% of samples failing verification and let serious manufacturers charge for quality. The 8.9% bear case is counterfeit incidence discrediting the category with growers who try an adulterated product, see nothing happen and conclude the whole category does not work.

Strongest Case, Weakest Rules

Biostimulants work best where plants are struggling, which is the single most useful thing to understand about the category. Yield response runs around 18% under genuine abiotic stress and falls to something difficult to measure where conditions are already good. That makes the Middle East and Africa the strongest technical case anywhere: heat, irrigation water running near 3 decisiemens per metre of salinity, drought and soils degraded by decades of cultivation are exactly the conditions where these products earn their cost several times over.
TOP-FIVE CONCENTRATION28%Combined position across biostimulant supply held by leading manufacturers
YIELD RESPONSE UNDER STRESS18%Typical improvement where abiotic stress limits crop performance
REGIONAL PRODUCT REGISTRATION RATE12%Share of products sold holding any formal regional approval
IRRIGATION WATER SALINITY3 dS/mConductivity level across much of regional agricultural water supply
ACTIVE INGREDIENT COST SHARE46%Portion of manufacturer cost attributable to the biological input
COUNTERFEIT PRODUCT INCIDENCE23%Portion of regional agri-input samples failing composition verification
The commercial infrastructure does not match the agronomic case at all. Around 12% of products sold across the region hold any formal registration, because most jurisdictions have no biostimulant category to register into and treat these products as fertilisers, adjuvants or nothing in particular. Roughly 23% of agri-input samples fail composition verification. A category with genuine technical merit and no regulatory gate attracts serious agronomy companies and people selling coloured water in equal proportion, and a grower cannot easily distinguish them.
European regulation is the reference point everybody else eventually uses. The Fertilising Products Regulation created a legal biostimulant classification with defined claims and conformity requirements, which turned a category of assertions into one of approvals.
"A grower in Kenya or Egypt who buys an adulterated biostimulant, sees nothing happen and concludes the category is nonsense has been lost permanently, and he tells his neighbours. Counterfeit product is doing more damage to this market than any competitor could manage."
Director, Crop Inputs and Agricultural Biologicals Practice · MMA Agriculture and Food Practice · August 2026

Market Trends

Salinity tolerance becomes the region's decisive product claim

Irrigation water across much of the Middle East and North Africa runs near 3 decisiemens per metre and rising, as aquifers deplete, desalinated supply carries residual salts and drainage returns concentrate what remains. Salt stress limits yield through osmotic effect and ion toxicity together, and biostimulants improving root architecture, osmolyte accumulation and ion exclusion address it measurably rather than generally. That gives a manufacturer something specific to demonstrate in a trial rather than a vague claim about plant health. It is the clearest argument available here, and remarkably few products are positioned around it.
Market Impact: Drives 14.2% Saudi growth
Counterfeit product damages the category faster than competitors

Around 23% of regional agri-input samples fail composition verification, meaning the product contains materially less active than declared or nothing recognisable at all. Because no registration gate exists across most of the region, anybody can package and sell a biostimulant with no obligation to demonstrate what is in it. A grower who tries an adulterated product and observes no response concludes the category does not work, tells neighbours and does not return. Commercially that destroys addressable market permanently rather than merely diverting a sale, and it hurts legitimate manufacturers considerably more than the counterfeiters themselves.
Market Impact: Delivers 18% stress yield response

Market Opportunities and Growth Drivers

Gulf food security programmes buy inputs on evidence

Saudi and Emirati food security investment has created controlled environment and high-value open field agriculture that operates on economics closer to pharmaceutical manufacture than to conventional farming, with yields, water efficiency and quality all measured continuously. Those operations buy inputs on demonstrated trial response rather than on price per litre, which is precisely the customer a serious biostimulant manufacturer wants and rarely finds. Saudi growth at 14.2% is the fastest of any country here and it rests on national programmes rather than on commodity economics. Hectarage is small and value per hectare is extraordinary.
Market Impact: Registers only 12% of products

Soil degradation raises response across African commercial farming

Decades of cultivation without organic matter return have depleted soil biology and structure across much of African commercial and smallholder farming, which reduces nutrient use efficiency and leaves crops less able to withstand drought periods. Biostimulants improving root development, microbial activity and nutrient uptake respond strongly in exactly those conditions, delivering yield improvements around 18% where stress genuinely limits performance. South African, Kenyan and Moroccan commercial farms are adopting steadily and measuring results. The agronomic case is stronger here than in any well-managed European soil, which is the opposite of where the category actually sells most.
Market Impact: Constrains 15.3% segment growth

Market Restraints and Challenges

No registration framework exists across most of the region

Only around 12% of biostimulant products sold regionally hold any formal approval, because most jurisdictions lack a biostimulant category entirely and classify these products as fertilisers, adjuvants or nothing at all. The root cause is regulatory: legislators have not created a definition, so no gate exists to pass through. Commercially this means quality carries no formal signal and a serious manufacturer competes on price against products containing nothing. Manufacturers are responding by carrying European conformity marking into the region as a voluntary quality signal, which works with sophisticated buyers and not with smallholders.
Market Impact: Addresses 3 decisiemens salinity levels

Living products need cold chain hot climates cannot provide

Microbial inoculants contain living organisms whose viability declines with temperature and time, and distribution across the Middle East and Africa routinely involves ambient temperatures and storage that no cold chain reaches. The root cause is biological rather than commercial and it limits the fastest-growing segment precisely where the agronomic need is greatest. Commercially this means a product tested successfully in a trial may deliver nothing after distribution. Manufacturers are responding with spore-forming strains, dried and encapsulated formulations and shorter local supply chains, all of which help without solving it entirely.
Market Impact: Fails 23% of verification samples
3 additional market trends, 4 additional growth drivers, and 2 additional restraints and challenges are covered in the full report. Contact sales@marketmindsadvisory.com to access the complete intelligence.

Segment CAGR and Growth Architecture

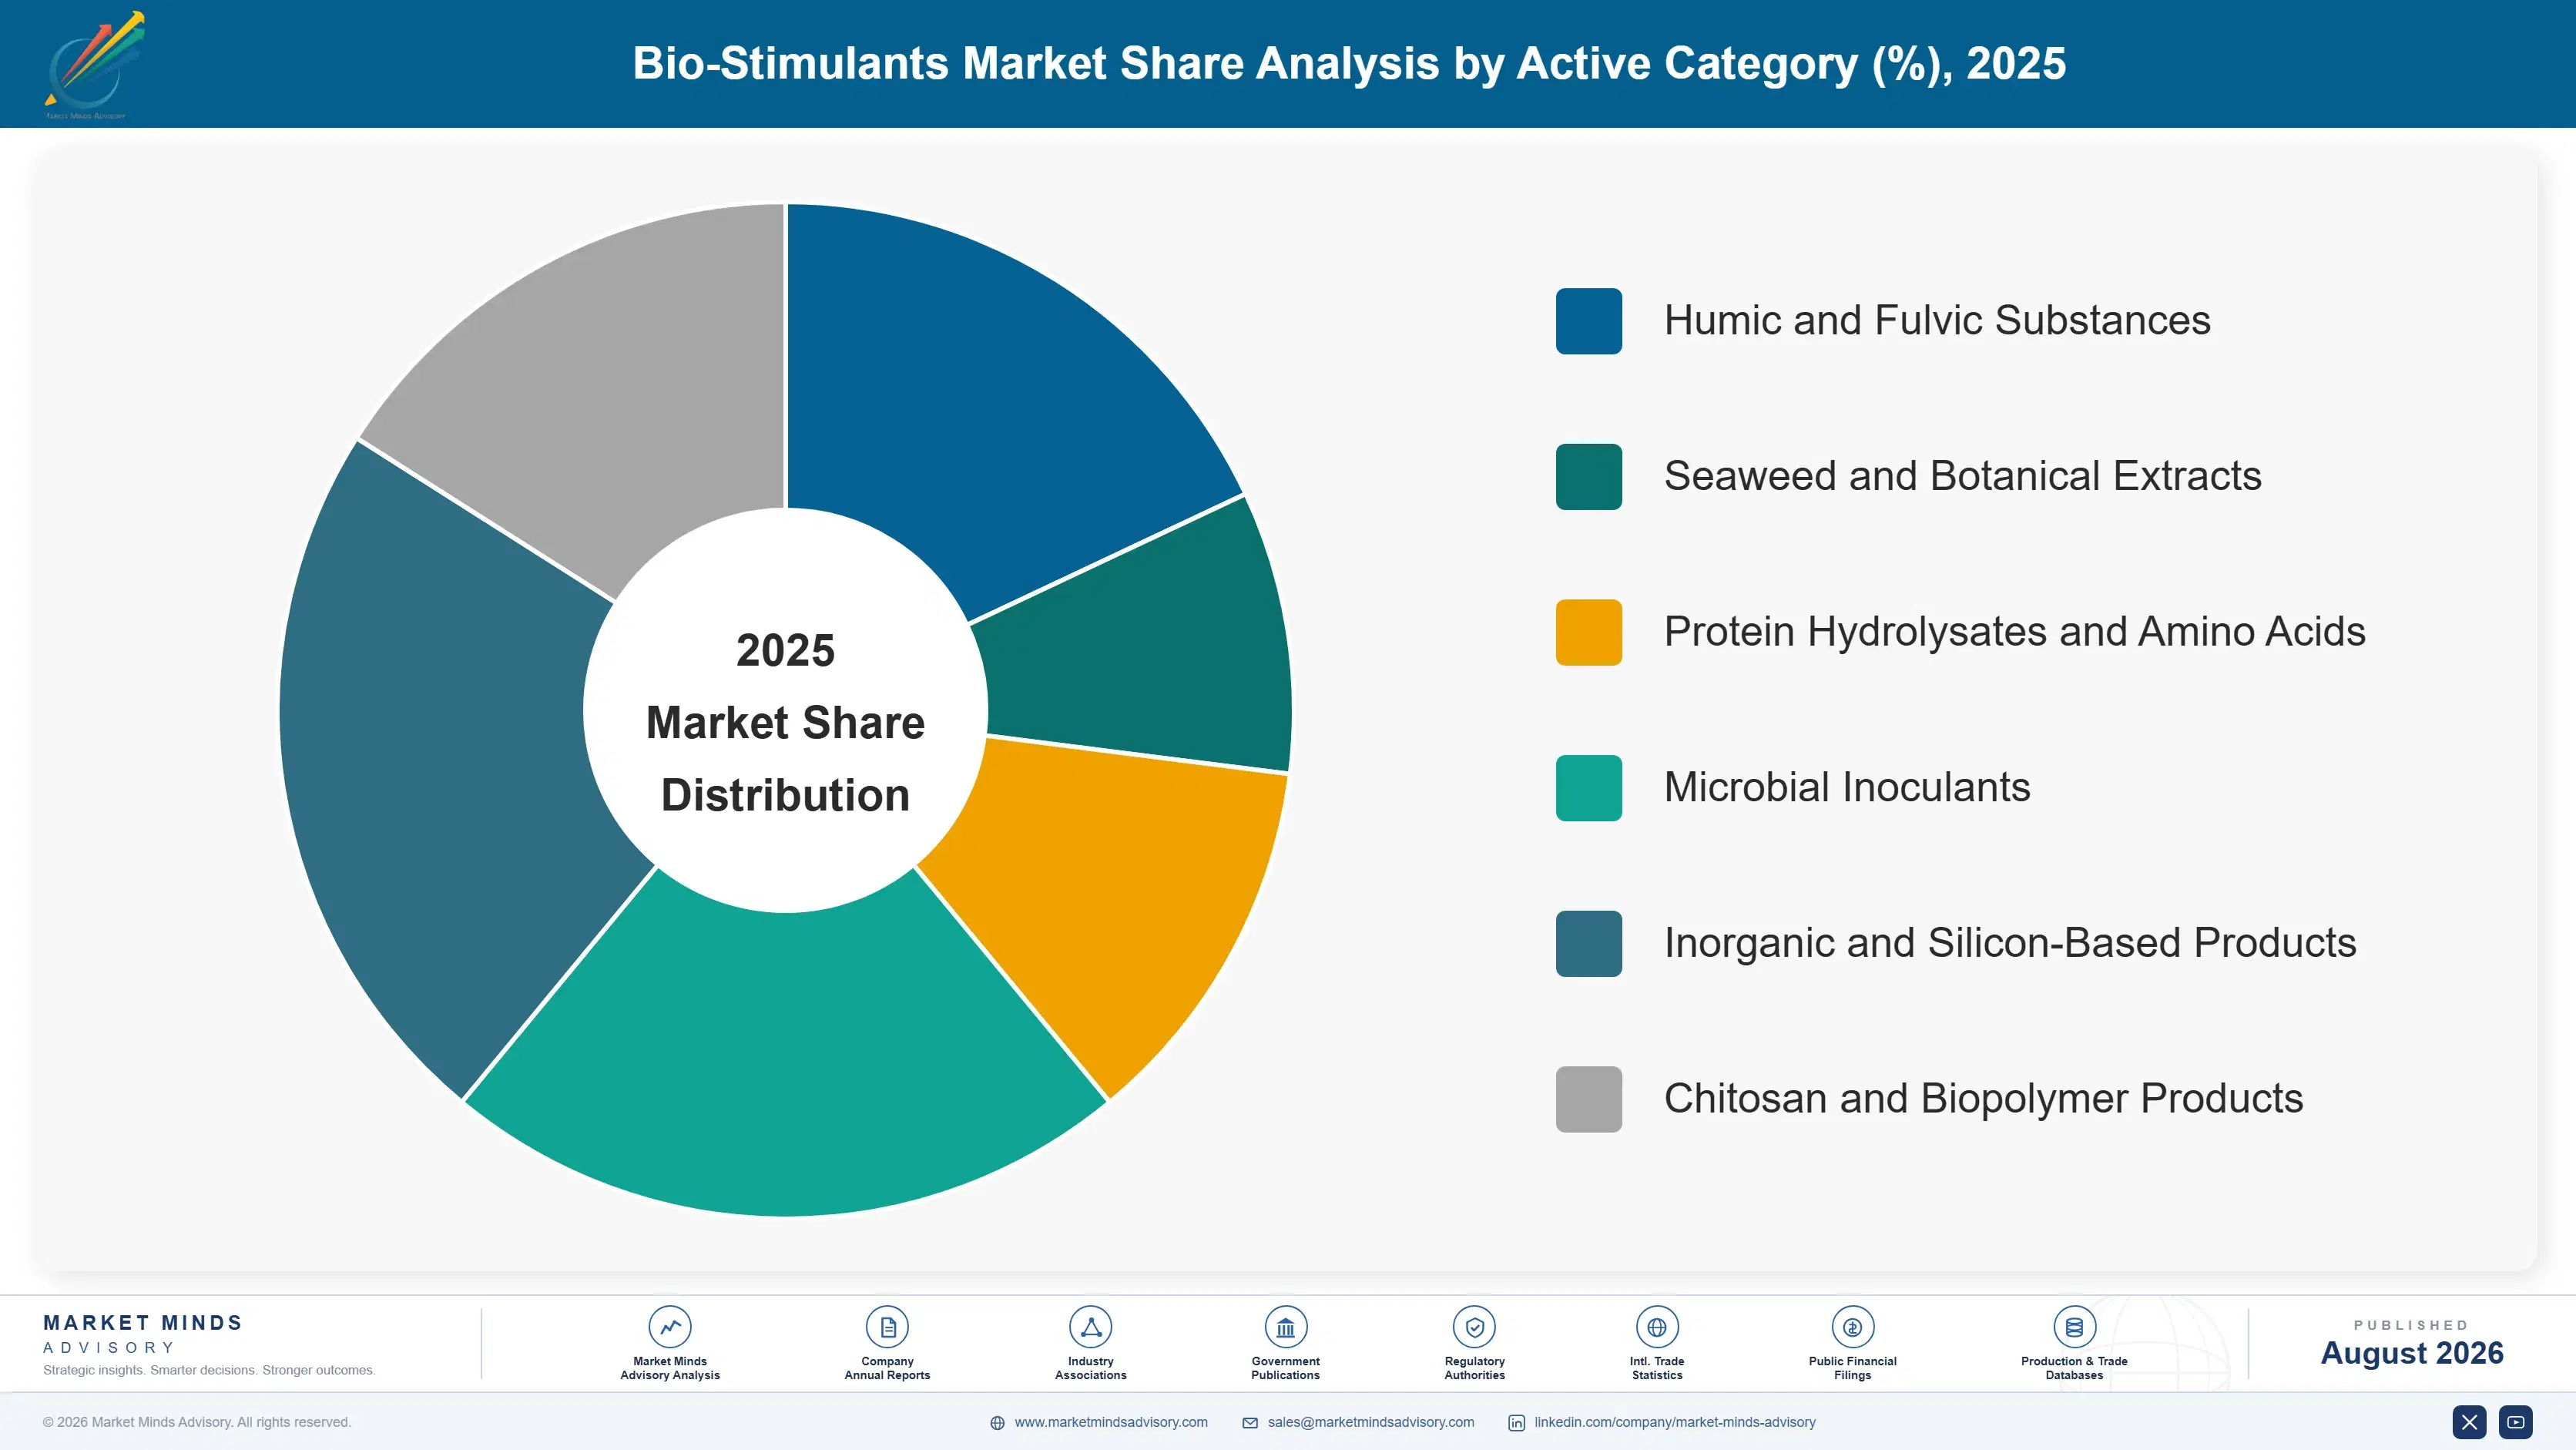
Products are classified here by active category, since that determines the mode of action, the formulation stability and what a manufacturer can credibly demonstrate in a trial. Crop type, application method and distribution arrangement are handled separately in the framework, because one active category serves several crops and application routes without change. Active category decides everything.
middle-east-and-africa-bio-stimulants-market-market-share-analysis-1787555617044

Microbial Inoculants

Growing at 15.3%, half again the market rate, microbial products deliver the strongest and most measurable response in exactly the degraded and stressed soils this region has most of. Mycorrhizal fungi extend effective root surface enormously, rhizobacteria mobilise phosphorus and produce growth regulators, and both improve drought and salinity tolerance through mechanisms that trials can demonstrate rather than assert. The constraint is that these are living organisms whose viability falls with heat and time, and regional distribution routinely involves conditions no cold chain reaches. A product that worked in a trial may deliver nothing after three months in a warehouse. Spore-forming strains and encapsulation help considerably without resolving it. Nobody has solved it.
CAGR 15.3%

Inorganic and Silicon-Based Products

Silicon strengthens cell walls, improves water use efficiency and reduces both salt uptake and pest damage, and unlike the biological categories it is entirely stable in any storage condition the region can produce. That stability advantage matters enormously where cold chain does not exist and warehouses reach temperatures that kill microbial products outright. Growth at 12.6% follows salinity and drought stress directly, since silicon's mechanisms address both. The products are also cheap to manufacture and difficult to counterfeit meaningfully, because the active is verifiable by simple analysis rather than requiring viability testing. In a market where 23% of samples fail verification, that is a genuine commercial advantage. Verifiability is a commercial advantage here.
CAGR 12.6%
Full segment breakdown across 6 segments available in the complete report.

Regional Architecture and Country Demand Map

Western Europe holds 26% of global value because regulation created a legal category there and growers pay for approved inputs. The Middle East and Africa holds 6% while presenting the strongest agronomic case anywhere. Need and spending sit in different places entirely. That mismatch defines this market.

Middle East and Africa

This region is the analytical centre of the report and it presents the sharpest contrast in the category: the strongest agronomic case anywhere against the weakest commercial infrastructure. Heat, irrigation salinity near 3 decisiemens per metre and degraded soils produce yield responses around 18% that European conditions rarely match. Gulf food security programmes fund high-value production buying on trial evidence, while African smallholder farming presents enormous potential need and almost no purchasing capacity. Roughly 23% of agri-input samples fail composition verification and only 12% of products hold any registration. The 6% share reflects spending rather than need. Need and purchasing capacity have almost no relationship to each other across the region.
Share: 6% | CAGR: 10.6% (2026 to 2036)

Western Europe

European regulation created the modern biostimulant category by defining it legally with permitted claims and conformity requirements, which converted a collection of assertions into a market with approvals somebody can verify. That is why this region holds the largest share of global value despite agronomic conditions where response is smallest, since well-managed European soils and reliable water leave less stress for a biostimulant to relieve. Italian, Spanish and French manufacturers hold the deepest formulation capability. Growth at 8.6% is the weakest of the seven regions and reflects a mature market where the easy adoption already happened. Well-managed soils and reliable water leave less stress for a biostimulant to relieve, which is why response is smallest exactly where spending is largest.
Share: 26% | CAGR: 8.6% (2026 to 2036)
Regional intelligence for 5 additional markets available in the complete report: North America, East Asia, South Asia and Pacific, Latin America, Eastern Europe. Contact sales@marketmindsadvisory.com.
middle-east-and-africa-bio-stimulants-market-country-cagr-analysis-1787555617564

Where Biostimulant Margin Actually Sits

Four moves matter in a region where the agronomy works better than anywhere and the commercial infrastructure works worse. Two are about making quality visible where no regulator does it for you, and two are about the stress conditions that give these products their strongest case. Competing on price against unverified product is not among them.

Carry European conformity marking as a quality signal

Only around 12% of regionally sold products hold any registration and roughly 23% of samples fail composition verification, which means a grower has no way to distinguish serious product from coloured water. European Fertilising Products conformity marking is the only recognised quality standard available and carrying it into the region costs compliance work rather than new formulation. Sophisticated buyers including Gulf controlled environment operations and African commercial farms recognise and value it immediately. It does nothing for smallholders, which is a separate problem requiring a different answer entirely. Smallholders need a different answer.
Market Impact: Separates from the 23% failing any composition verification

Position explicitly on salinity rather than plant health

Irrigation water across much of the region runs near 3 decisiemens per metre and rising as aquifers deplete and drainage returns concentrate salts. Salt stress limits yield measurably through osmotic effect and ion toxicity, and products improving root architecture and ion exclusion address it in ways a trial can demonstrate rather than assert. Most manufacturers sell general plant health, which is unfalsifiable and therefore unconvincing to anybody comparing products. Positioning on a specific measurable stress gives a grower something to verify on his own farm, which is worth considerably more than any claim.
Market Impact: Addresses the 3 decisiemens of irrigation water salinity

Sell silicon where cold chain does not exist

Microbial inoculants deliver the strongest response and contain living organisms that die in warehouses reaching temperatures normal across this region, which means a product proven in trial may deliver nothing after distribution. Silicon-based products address salinity and drought through cell wall strengthening and water use efficiency, remain entirely stable in any storage condition and are verifiable by simple analysis rather than viability testing. Growth at 12.6% reflects that practicality. In a market where 23% of samples fail verification, being easy to test is a commercial advantage rather than merely a technical one.
Market Impact: Stays stable where the 15.3% segment simply fails

Serve Gulf programmes that buy on trial evidence

Saudi and Emirati food security investment funds controlled environment and high-value production measuring yield, water efficiency and quality continuously, which makes those operations the rare customer that buys biostimulants on demonstrated response rather than on price. Saudi growth at 14.2% is the fastest of any country here. Hectarage is small and value per hectare is extraordinary, which suits a manufacturer with genuine trial data and disadvantages one without. Manufacturers organised around volume distribution are ignoring the only regional customer segment that can properly evaluate what they sell. Very few manufacturers try.
Market Impact: Enters a market now growing at 14.2% annually

Who Controls the Margin Pool

Five manufacturers hold just 28% of biostimulant supply, measured on product revenue at manufacturer level, the basis used throughout this section. That fragmentation reflects a category with low barriers to entry and, across most of this region, no registration requirement to clear before selling. The gap between leaders and everybody else is trial evidence and formulation stability rather than any manufacturing advantage, since blending a biostimulant requires very little. Blending requires very little. Barriers to entry are almost nonexistent here.
Competition runs on three dimensions. Demonstrable trial response, which separates products that work from products that assert. Formulation stability under regional distribution conditions, particularly for living organisms. And distribution reach into farming systems ranging from Gulf glasshouses to African smallholdings that share no commercial characteristics at all. Price competes hardest where growers cannot verify anything. Nothing about those buyers overlaps.

Rankings shift where registration frameworks emerge, since formal approval would separate serious manufacturers from unverified product overnight. Large agricultural input companies have acquired biostimulant specialists repeatedly. Counterfeit product suppresses everybody's position by damaging category credibility rather than by taking share from any particular participant. Credibility damage suppresses everybody at once.
middle-east-and-africa-bio-stimulants-market-company-positioning-matrix-1787555618084

Competitive Moat and Risk Dimensions

UPL

Moat: Emerging market distribution reach

UPL holds distribution into farming systems across Africa, Asia and Latin America that Western manufacturers have spent decades failing to build, reaching growers through networks adapted to smallholder purchasing rather than to commercial agriculture. In a category where product quality cannot be verified by the buyer, an established supplier relationship carries the trust that regulation would otherwise provide.
UPL

Risk: Quality signal dilution risk

Serving markets with no registration requirement means competing against unverified product on price at the smallholder end, which pulls formulation and claims toward what the market will pay rather than what agronomy supports. Manufacturers positioned entirely on trial evidence and conformity marking avoid that pressure. Category credibility damage from counterfeits reaches broad distributors most directly.
SYNGENTA BIOLOGICALS

Moat: Trial data and agronomy depth

Syngenta applies crop protection trial methodology to biostimulants, generating replicated multi-site evidence that most participants in this category have never produced for any product. That evidence is exactly what sophisticated buyers demand and what distinguishes a working product from an assertion in a market with no regulatory gate to do the distinguishing.
SYNGENTA BIOLOGICALS

Risk: Cost structure against local blenders

Trial programmes, formulation development and regulatory work carry costs that a local blender packaging humic acid simply does not incur, and in price-driven segments the evidence commands no premium at all. The advantage applies to buyers capable of evaluating it, which excludes most of the regional hectarage. Local competitors serve that hectarage profitably and permanently.

Players Tracked

Prominent Players

UPL
Syngenta Biologicals
Yara International
Corteva Agriscience
Haifa Group

Other Key Players

BASF
Bayer
ICL Group
Koppert Biological Systems
Biolchim
Tradecorp
Acadian Plant Health
Lallemand Plant Care
Symborg
Rovensa
Andermatt Group
Omex Agrifluids
Agrinos
Humintech
Kimitec

Recent Developments

FEBRUARY 2025

A Gulf food security programme specified trial-verified biostimulant inputs

A Gulf food security programme required demonstrated trial response before approving biostimulant products for use across its funded production operations, applying evidence standards that regional markets have never previously imposed on this category. This was a procurement requirement rather than any commercial transaction. Nobody else imposes any.
Signal: A buyer imposing evidence standards where regulators impose none creates the quality gate this category has always lacked
AUGUST 2025

Regional testing found widespread agri-input composition failures

Regional agricultural input testing across several African markets found a substantial proportion of sampled products containing materially less active ingredient than declared, or nothing identifiable at all. This was a survey finding rather than any commercial announcement or transaction between market participants. Legitimate manufacturers bear the damage.
Signal: Published verification failures damage the whole category, which harms legitimate manufacturers considerably more than any counterfeiter
DECEMBER 2025

A manufacturer launched encapsulated microbial products for hot climates

A biostimulant manufacturer introduced encapsulated and spore-forming microbial formulations designed to retain viability through ambient distribution in high temperature conditions, addressing shelf life failures that undermine trial results after products leave controlled storage. This was organic product development rather than any transaction. Trial results survive distribution now.
Signal: Formulation stability rather than efficacy is the limiting factor in hot markets, and manufacturers are finally engineering for it

What Moves Manufacturer Cost

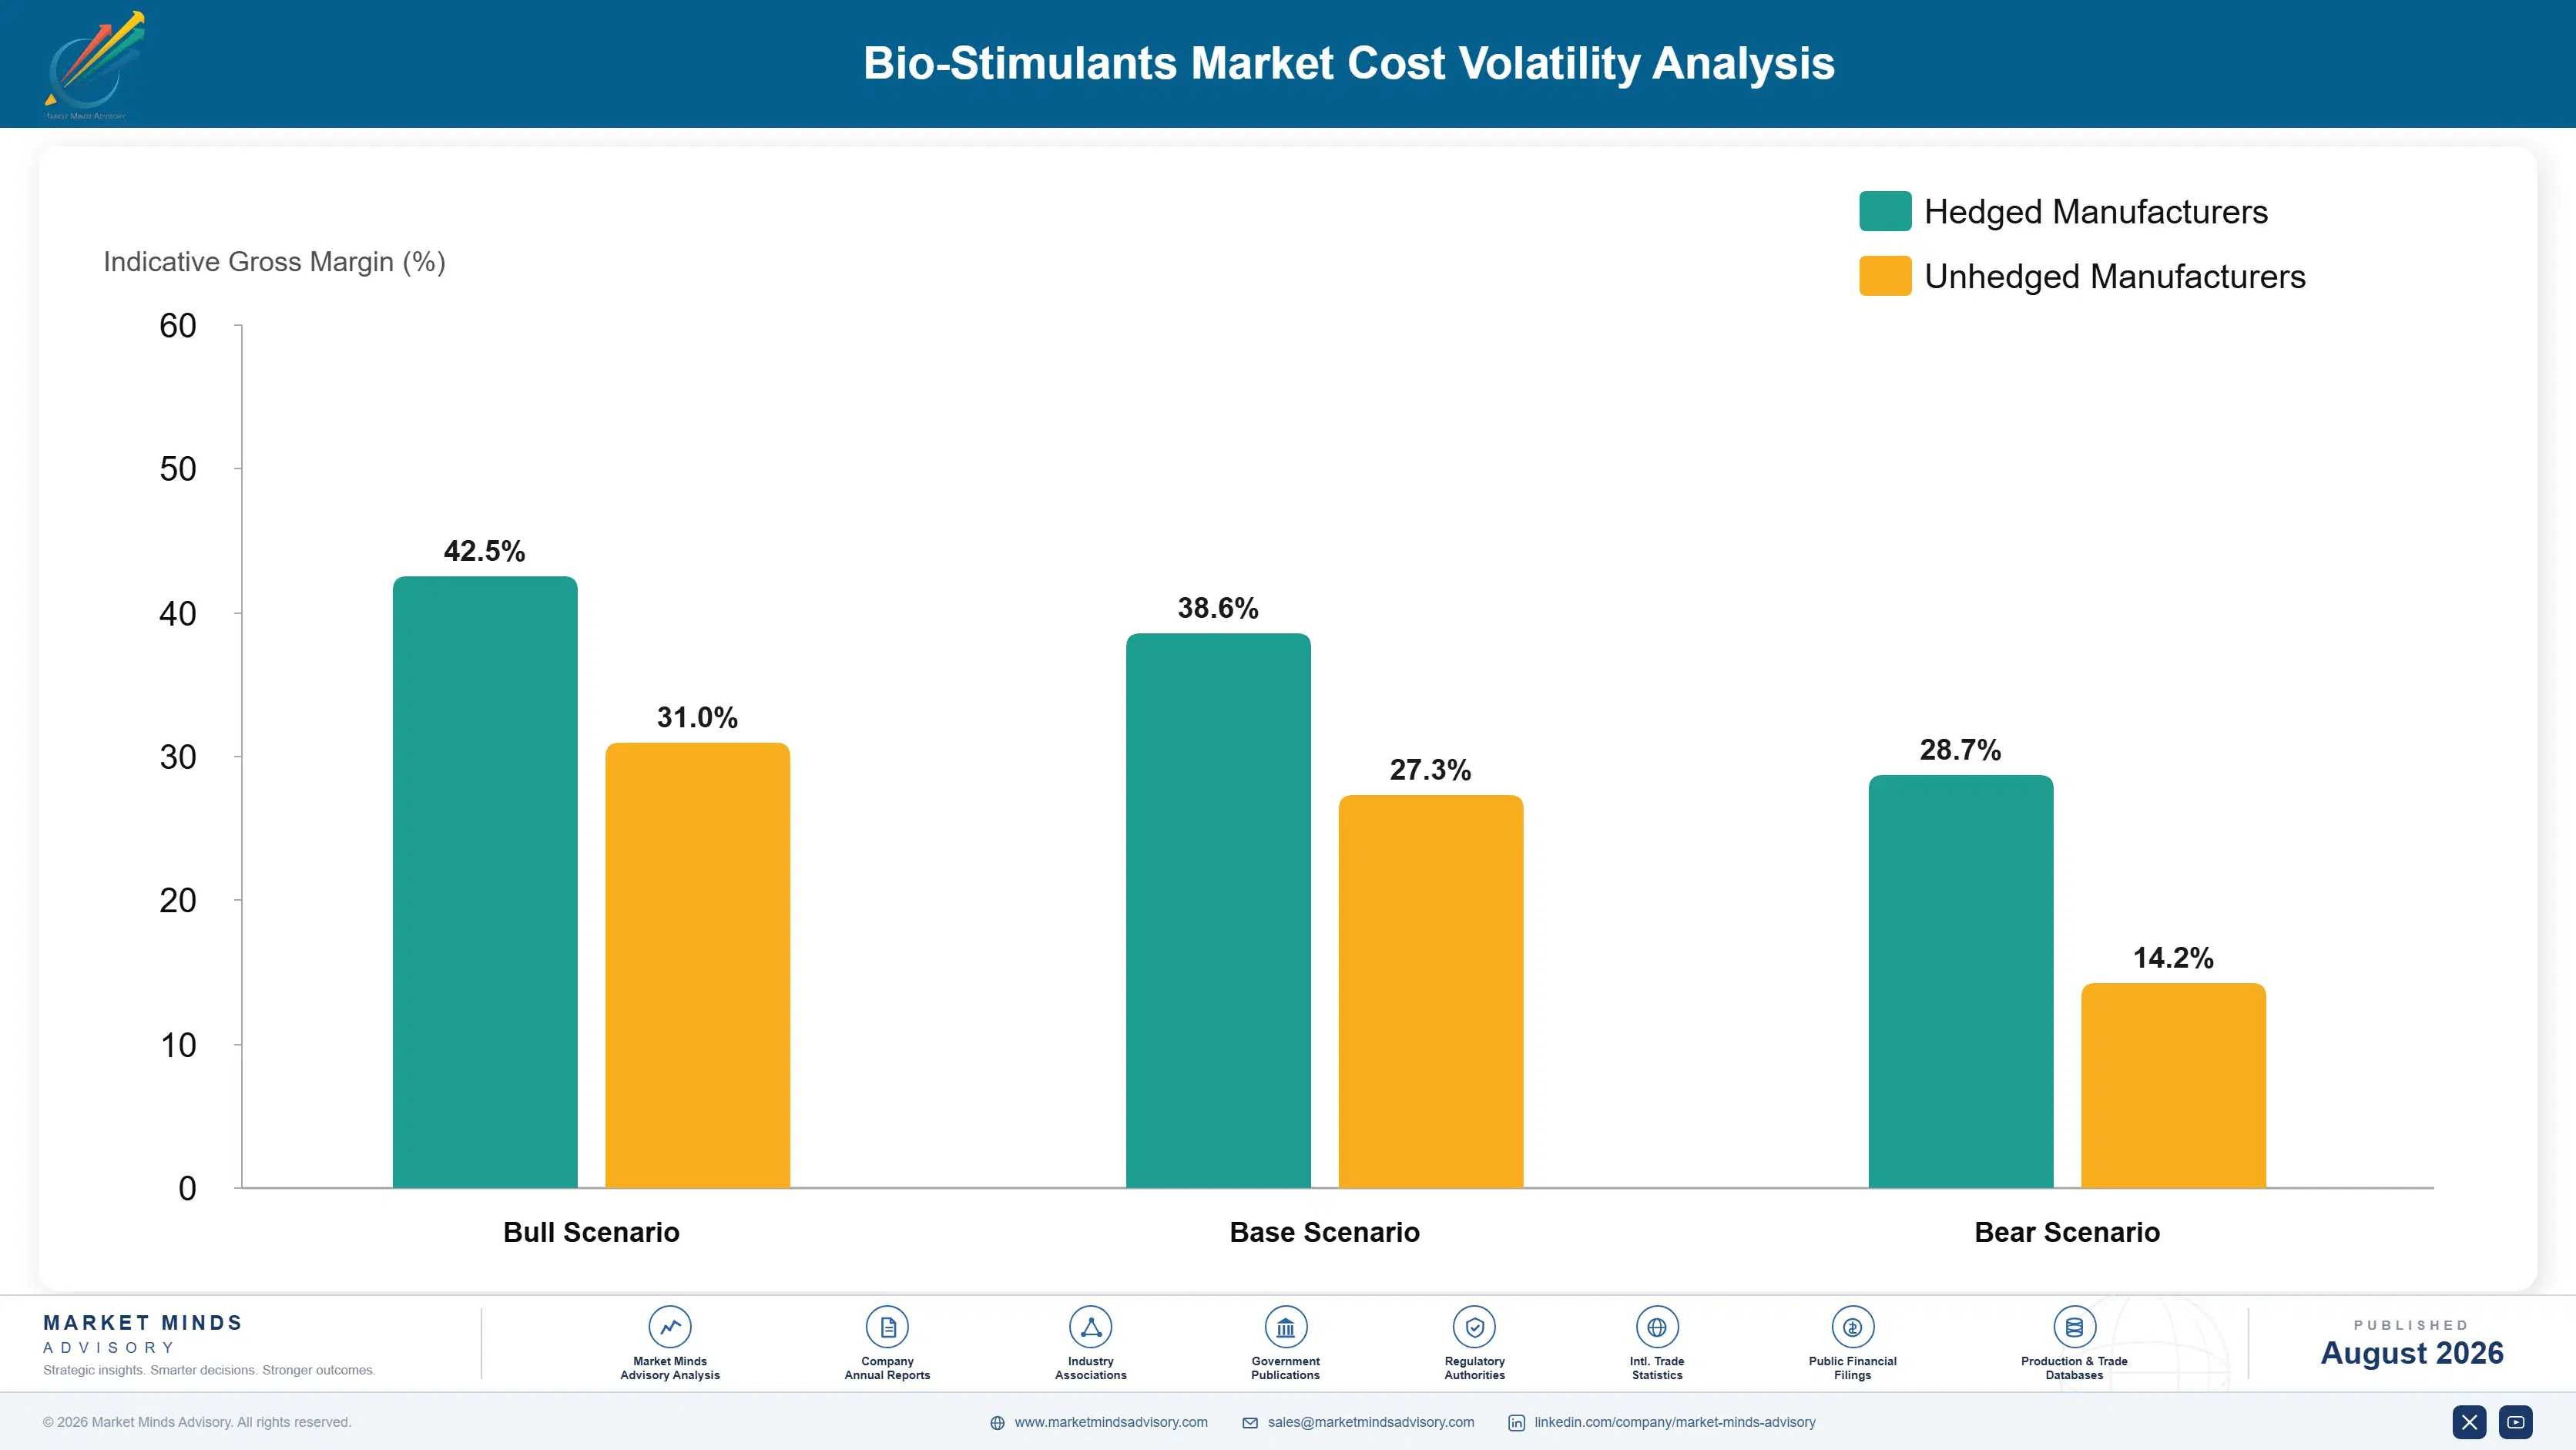
Active biological inputs account for around 46% of manufacturer cost, spanning seaweed harvest, fermentation for microbial products, protein hydrolysis feedstock and mined humic substances. Formulation, stabilisation and packaging make up most of the remainder. Trial programmes and registration work sit outside cost of goods entirely and consume budget that unverified competitors never spend at all.
Seaweed harvest volumes and protein feedstock prices moved through 2021 and 2022 on harvest conditions and freight, and USDA and national agricultural data record the variability across those seasons. Yara noted input cost and logistics pressure across its crop nutrition operations in its Annual Report 2022. Manufacturers holding annual distributor pricing absorbed most of the movement, since regional distribution agreements set prices for a season and rarely reopen them mid-year.

The cost that determines competitive position is trial evidence, and it appears nowhere in a product comparison. Replicated multi-site trials cost considerably more than the formulation they test, and a competitor packaging humic acid with no evidence at all sells alongside at a lower price. Where only 12% of products hold registration, the manufacturer investing in proof subsidises a market that cannot read it.
middle-east-and-africa-bio-stimulants-market-cost-volatility-analysis-1787555618279

Run trials on customer farms rather than research stations

Replicated trials at research stations cost a great deal and convince fewer growers than a demonstration strip on a neighbour's farm, particularly across regions where formal evidence carries limited cultural weight. On-farm trials cost far less, generate locally credible results and create the distributor relationships that sell product. Manufacturers spending only on formal trials buy evidence nobody local reads.

Contract seaweed and feedstock supply across seasons

Seaweed harvest and protein hydrolysis feedstock behave like agriculture, with availability and price moving on conditions no manufacturer influences. Multi-season contracts convert that into a known cost and secure supply when harvests disappoint. Smaller manufacturers lacking scale should aggregate through toll processors holding better positions than they can obtain independently on their own. Availability matters more than price here.

Formulate for ambient stability before entering hot markets

Microbial viability falls with heat and time across distribution that reaches no cold chain anywhere in this region, which means a product proven in trial can deliver nothing to the grower who buys it. Spore-forming strains, drying and encapsulation cost more per unit and preserve the result the trial demonstrated. Exporting temperate formulations into hot distribution destroys your own evidence.

Portfolio Architecture for Margin Defence

Margin here tracks whether a buyer can verify what they purchased, which is an unusual determinant and the decisive one across this region. Undifferentiated humic and extract products run at gross margins in the high twenties against unverified competition selling on price alone. Formulated blends and quality-marked products run considerably better where buyers are sophisticated enough to care. Microbial inoculants, silicon products and trial-evidenced formulations run higher again, because response is demonstrable and the buyer has something to check.
The tension is that the buyers who can evaluate evidence represent a small fraction of regional hectarage while the buyers who cannot represent nearly all of it. Serving both from one commercial organisation means maintaining trial programmes that the larger customer base neither values nor pays for. Several manufacturers have found the smallholder channel pulling formulation and claims toward what price permits rather than what agronomy supports, which erodes exactly the credibility the evidence was meant to build.

High-value pools sit in Gulf programme supply, salinity-positioned products and stable formulations for hot distribution. None of the three depends on regional registration existing. Formulation capability by itself defends very little where nobody verifies anything.

Volume / Commodity-Adjacent

Undifferentiated humic substances and basic extracts sold on price into markets where buyers cannot verify composition and 23% of samples fail testing. The eight-point range separates manufacturers with contracted feedstock from those buying spot against variable harvests.
Gross Margin: 26%-34%

Premium / Certified

Formulated blends and products carrying European conformity marking as a voluntary quality signal in markets with no registration requirement. The twelve-point spread reflects buyer sophistication, since the same product earns very differently depending on who is purchasing it.
Gross Margin: 38%-50%

Sustainability / Regulatory / Next-Generation

Microbial inoculants, silicon products and formulations backed by replicated trial evidence for stress conditions. The eighteen-point range is wide because these price against demonstrated response rather than against any competing product a buyer could benchmark.
Gross Margin: 46%-64%
middle-east-and-africa-bio-stimulants-market-portfolio-architecture-1787555618780

High-value Sub-segments and Strategic Watch-out

Gulf Programme Supply

Saudi growth at 14.2% rests on food security operations measuring yield and water efficiency continuously, which makes them the rare regional buyer able to evaluate trial evidence properly. Hectarage is small and value per hectare is extraordinary here. Trial evidence is what they buy on, which suits serious manufacturers.
Gross Margin: 48%-64%

Salinity Positioned Products

Irrigation water near 3 decisiemens per metre gives a manufacturer something specific and measurable to demonstrate rather than a general plant health claim nobody can falsify. Remarkably few products are positioned explicitly around it. A grower can verify it on his own farm, which beats any claim.
Gross Margin: 44%-58%

Undifferentiated Extract Volume

The tonnage sold where buyers cannot verify anything and 23% of samples fail composition testing outright. Manage for feedstock cost and distribution reach rather than margin, since quality carries no price signal here. Feedstock cost and distribution reach are the only levers available. Quality earns nothing.
Gross Margin: 26%-34%

Ambient Stable Formulations

Microbial products at 15.3% deliver the strongest response and die in warehouses that reach temperatures normal across this region. Spore-forming and encapsulated formats preserve what the trial demonstrated, which very few manufacturers engineer for. Engineering for it protects the response the trial demonstrated originally. Very few bother.
Gross Margin: 42%-56%

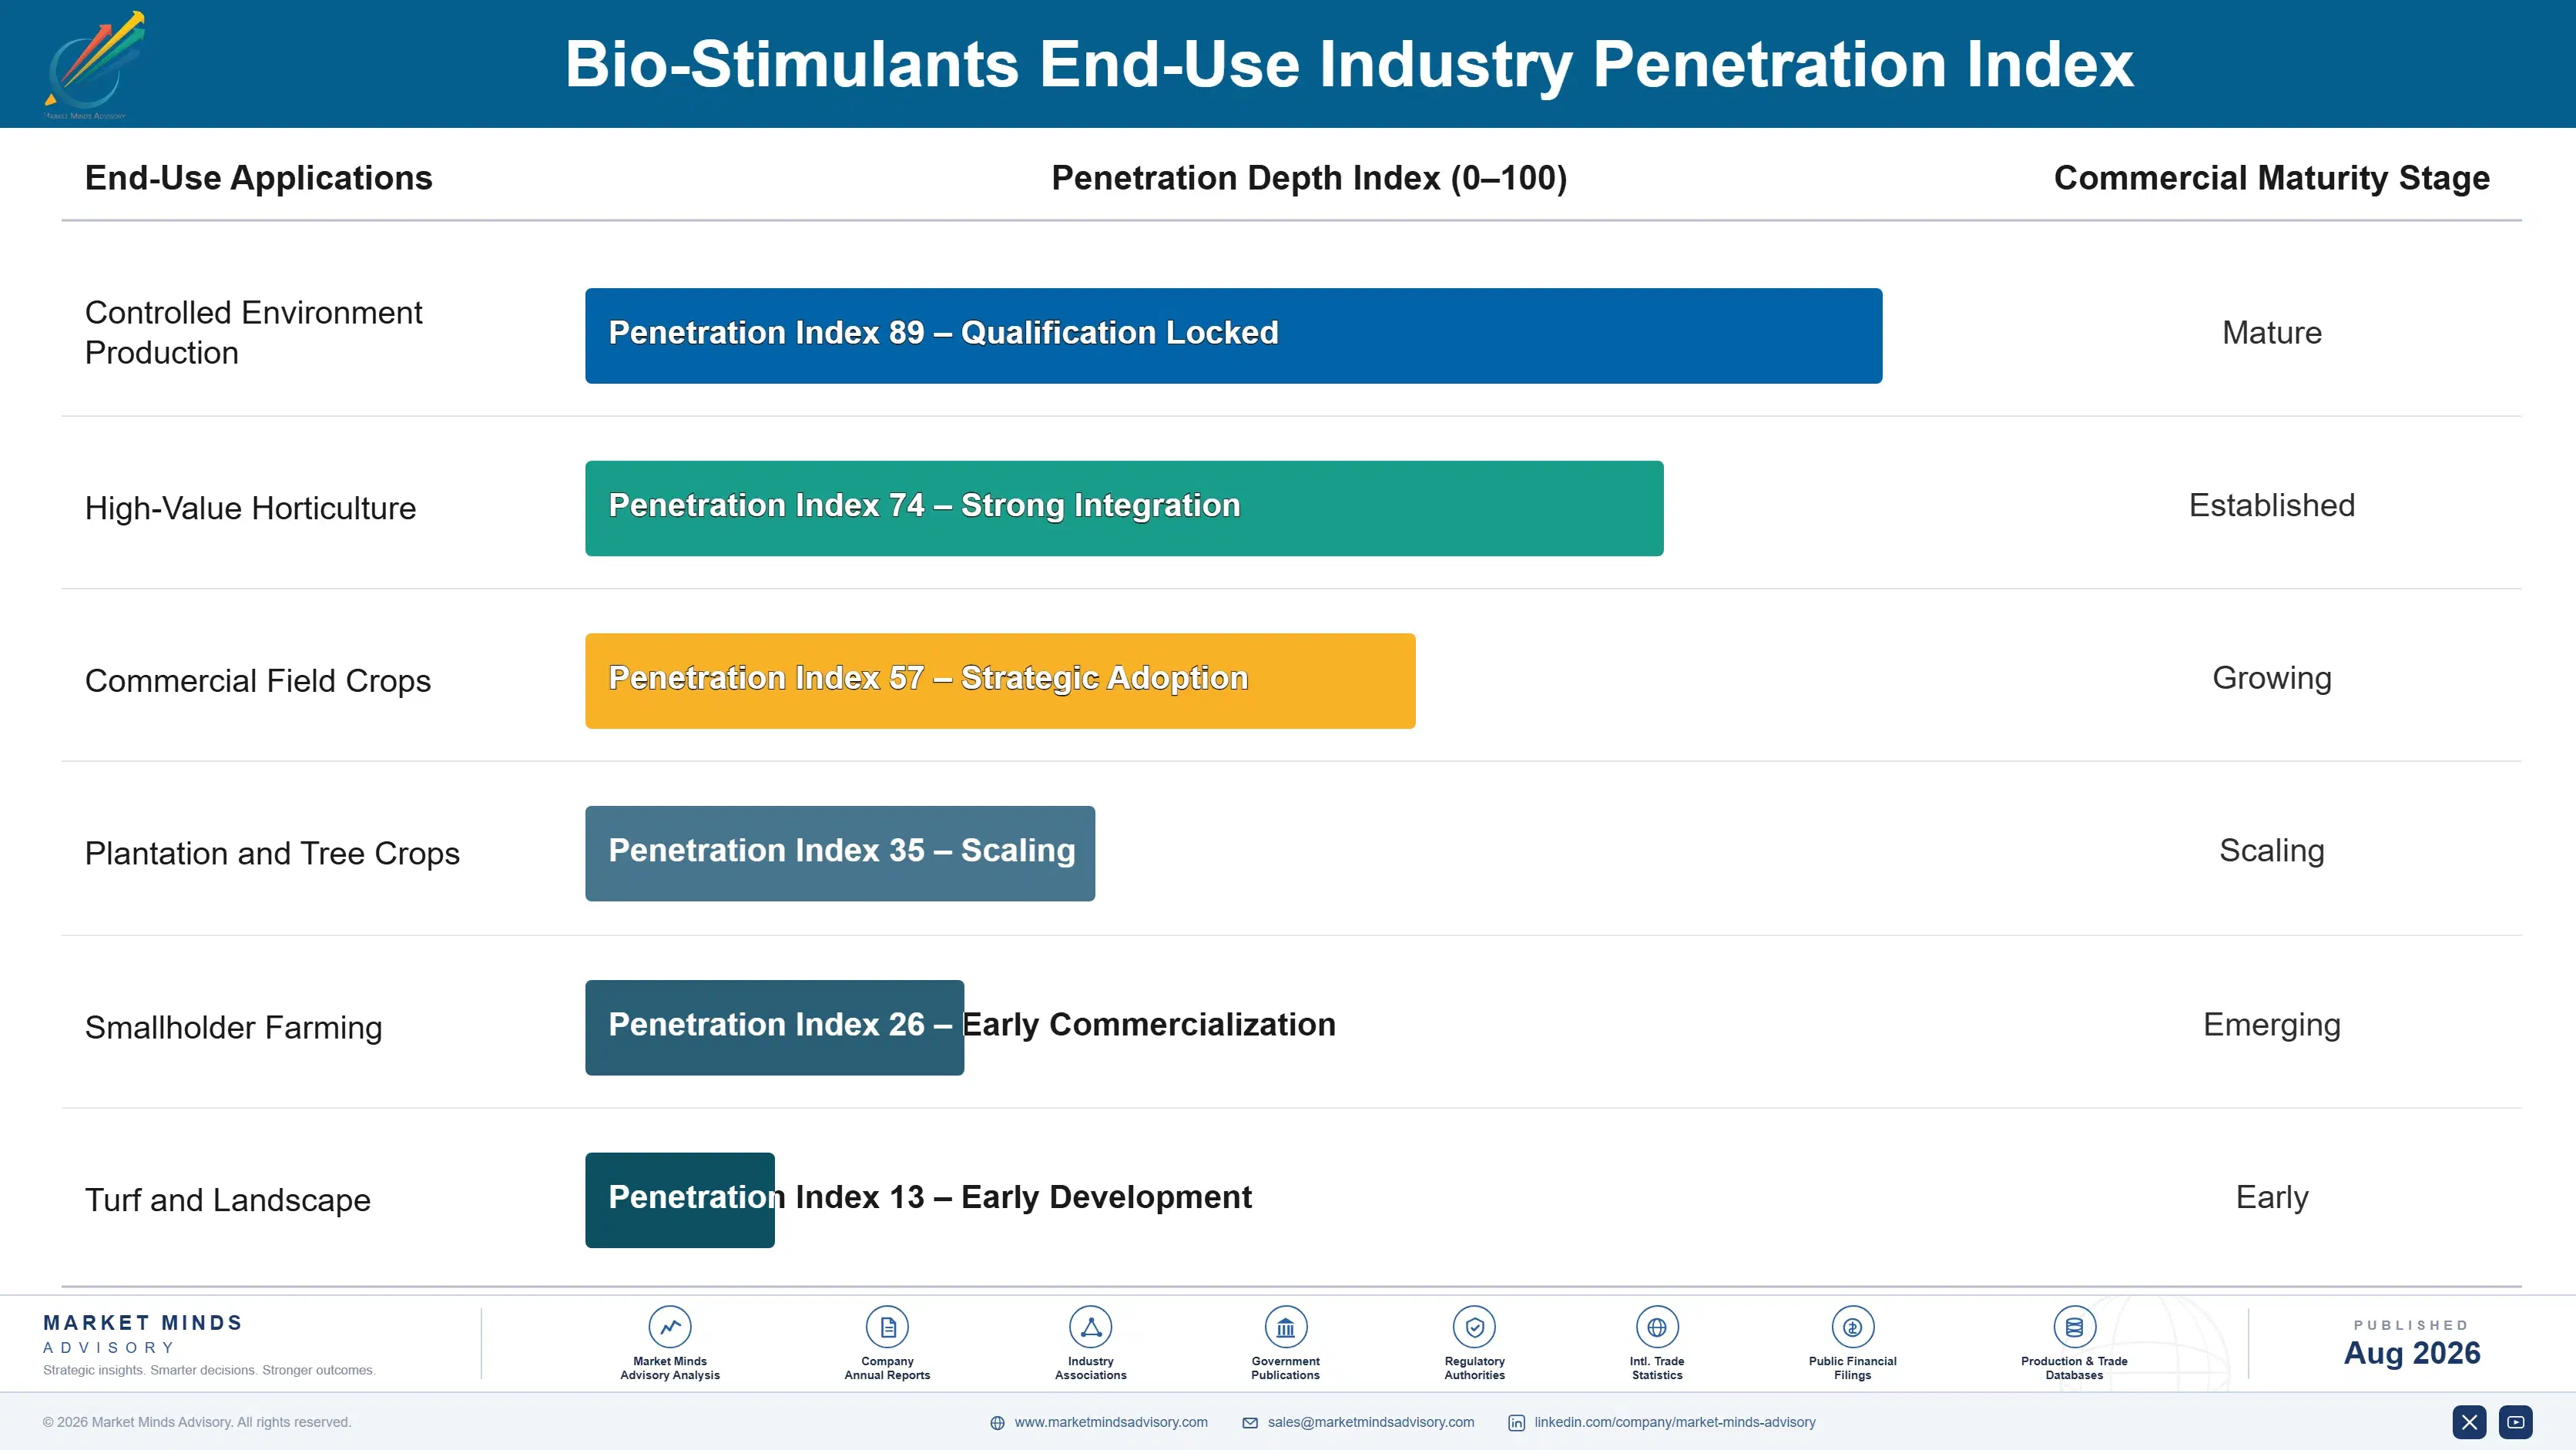
How Biostimulant Demand Renews

Demand renews on the growing season and every season is a fresh decision. A grower applies a product, observes the crop and decides next year based on what he believes he saw, with no contract, no switching cost and considerable uncertainty about whether any difference was the product or the weather. That makes repeat purchase unusually fragile, and explains why counterfeit product causes such disproportionate damage.
Stickiness depends entirely on whether response was visible. A grower who saw a genuine difference under stress conditions returns and tells neighbours, which is how this category actually spreads across farming communities regardless of any marketing programme. A grower who saw nothing does the same in reverse. Gulf programme buyers are stickier because they measure rather than observe, and their conclusions survive a bad season that would end a smallholder relationship. Measurement beats observation entirely.

The buyer varies more within this region than anywhere else in agriculture. A Gulf controlled environment operation employs agronomists reading trial protocols, and a smallholder two thousand kilometres away buys from a stockist on price and packaging. Manufacturers build for one and then try serving both identically.
middle-east-and-africa-bio-stimulants-market-end-use-penetration-index-1787555619265

Where To Place The Bet

These are among the four positions where our research anticipates prominent divergence between winners and laggards over the coming forecast period. Each is grounded in the demand model, the regulatory perimeter, and the announced capacity pipeline.
01 / QUALITY SIGNAL ADOPTION

Import the standard no regulator here provides

Only around 12% of biostimulant products sold across this region hold any formal registration and roughly 23% of sampled agricultural inputs fail composition verification entirely, which leaves a grower no reliable way to distinguish serious product from coloured water. European Fertilising Products conformity marking is the only recognised standard available anywhere, and carrying it regionally costs compliance work rather than any reformulation. Gulf operations and African commercial farms recognise and value it immediately, though it does nothing whatever for smallholders who need a different answer.
02 / SALINITY CLAIM POSITIONING

Sell a measurable stress, not general health

Irrigation water across much of the Middle East and North Africa runs near 3 decisiemens per metre and rising as aquifers deplete and drainage returns concentrate whatever salt remains behind. Salt stress limits yield through osmotic effect and ion toxicity together, and products improving root architecture and ion exclusion address it in ways a field trial can genuinely demonstrate rather than merely assert. Most manufacturers sell general plant health, which is unfalsifiable and therefore unconvincing, while a specific measurable stress gives the grower something he can check himself.
03 / STABILITY ENGINEERING PRIORITY

Protect the response after the product ships

Microbial inoculants compound at 15.3% and deliver the strongest measurable response in exactly the degraded stressed soils this region has most of, and they contain living organisms that lose viability in warehouses reaching temperatures entirely normal across the region. A product that performed in a replicated trial may deliver nothing at all to the grower who eventually buys it months later. Spore-forming strains, drying and encapsulation cost more per unit and preserve the result the trial demonstrated, and manufacturers exporting temperate formulations are destroying their own evidence.
04 / EVIDENCE BUYER FOCUS

Serve the customers who can actually evaluate you

Saudi and Emirati food security programmes fund controlled environment and high-value production measuring yield, water efficiency and crop quality continuously, which makes them the rare regional customer capable of buying biostimulants on demonstrated response rather than on price per litre. Saudi growth at 14.2% is the fastest of any country covered here, on small hectarage carrying extraordinary value per hectare. Manufacturers organised entirely around volume distribution are ignoring the only regional buyers who can properly assess what they are selling.

Engagement Snapshot From the Field

A live engagement with an industry participant carrying material or product regulatory and market exposure ahead of a defining policy shift, showing how our research translates into a defensible multi-year portfolio strategy.
MARKET MINDS ADVISORY · CLIENT ENGAGEMENT SUMMARY
Bio-Stimulants Producer Strategic Portfolio Review and Transition Roadmap 2026·Investment Scenario on Bio-Stimulants Exposure Evaluation 2025-26
CLIENT PROFILE
A European biostimulant manufacturer with annual revenue around EUR 58 million (client-reported, unverified by MMA), producing seaweed extracts, microbial inoculants and formulated blends carrying European conformity marking. Regional sales into the Middle East and Africa ran through general agricultural distributors. Products shipped in temperate formulations. Trial evidence was European rather than regional. Regional viability was never tested.
STRATEGIC CHALLENGE
Regional sales had grown slowly and repeat purchase was poor (client-reported, unverified by MMA) despite strong European performance. Management proposed price reductions to compete with local products. Nobody had established whether the products were still working by the time growers applied them, which made the price explanation an assumption rather than a finding.
MMA APPROACH
MMA tested product viability at the point of sale rather than at dispatch, sampling microbial products from regional distributor stock across several markets. Buyer sophistication was mapped across the client's regional customer base. Gulf programme procurement requirements were assessed through the expert interview programme, and competitor positioning was reviewed against salinity and stress claims specifically.
KEY FINDINGS
  1. Microbial viability at the point of sale had fallen far below specification across every sampled distributor, which meant growers were applying products that could not deliver the trial response.
  2. The client's conformity marking was invisible to distributors and growers alike, because nobody had explained what it meant or why it distinguished the product from cheaper alternatives.
  3. Gulf food security programme procurement required demonstrated trial response, and the client held European trial data that had never been repeated under regional stress conditions.
  4. No competitor in the client's markets positioned explicitly on salinity tolerance, despite irrigation water conductivity making it the most commercially relevant stress in the region.
CLIENT PROFILE
A European biostimulant manufacturer with annual revenue around EUR 58 million (client-reported, unverified by MMA), producing seaweed extracts, microbial inoculants and formulated blends carrying European conformity marking. Regional sales into the Middle East and Africa ran through general agricultural distributors. Products shipped in temperate formulations. Trial evidence was European rather than regional. Regional viability was never tested.
STRATEGIC CHALLENGE
Regional sales had grown slowly and repeat purchase was poor (client-reported, unverified by MMA) despite strong European performance. Management proposed price reductions to compete with local products. Nobody had established whether the products were still working by the time growers applied them, which made the price explanation an assumption rather than a finding.
MMA APPROACH
MMA tested product viability at the point of sale rather than at dispatch, sampling microbial products from regional distributor stock across several markets. Buyer sophistication was mapped across the client's regional customer base. Gulf programme procurement requirements were assessed through the expert interview programme, and competitor positioning was reviewed against salinity and stress claims specifically.
KEY FINDINGS
  1. Microbial viability at the point of sale had fallen far below specification across every sampled distributor, which meant growers were applying products that could not deliver the trial response.
  2. The client's conformity marking was invisible to distributors and growers alike, because nobody had explained what it meant or why it distinguished the product from cheaper alternatives.
  3. Gulf food security programme procurement required demonstrated trial response, and the client held European trial data that had never been repeated under regional stress conditions.
  4. No competitor in the client's markets positioned explicitly on salinity tolerance, despite irrigation water conductivity making it the most commercially relevant stress in the region.
RECOMMENDED STRATEGY
Phase 1: Phase one: abandon the price reduction and reformulate microbial products for ambient stability, since viability failure explains the poor repeat purchase entirely. Phase 2: Phase two: run regional trials under local salinity and heat stress, and reposition the range explicitly around salinity tolerance rather than general plant health. Phase 3: Phase three: approach Gulf food security programmes directly with regional trial data, rather than continuing to work through general agricultural distributors.
OUTCOME
Ambient stable microbial formulations shipped from mid 2026 and distributor stock viability now meets specification. Regional salinity trials are running at four sites. Two Gulf programme relationships are in development, and the client reports repeat purchase improving materially (client-reported, unverified by MMA). Price was never the problem.

Frequently Asked Questions

Foundational context covering the market sizes, CAGR, scope, country, region and competition that inform every finding below. This section is provided to cover basics and most often pre-purchase conversations, answered from the MMA Primary Research Dataset.

What is the current size of the Bio-Stimulants Market?

The market was valued at USD 4.2 billion in 2025, rising to an estimated USD 4.63 billion in 2026. Western Europe holds the largest regional share at 26% of value.

How large will the Bio-Stimulants Market be by 2036?

MMA forecasts USD 12.22 billion by 2036 under the base case, an expansion multiple of 2.64 times the 2026 value. That represents USD 7.59 billion of incremental value.

What is the CAGR for the Bio-Stimulants Market 2026 to 2036?

The base case runs at 10.2% compound annual growth between 2026 and 2036, with a bull case at 11.5% and a bear case at 8.9%. Historical growth from 2020 to 2025 was 8.8%.

Which segment is growing fastest?

Microbial inoculants lead at 15.3%, half again the market rate, delivering the strongest response in degraded and stressed soils. Silicon-based products follow closely at 12.6%.

Who are the major companies in the Bio-Stimulants Market?

UPL, Syngenta Biologicals, Yara, Corteva Agriscience and Haifa Group hold just 28% between them. Trial evidence and distribution reach rather than manufacturing scale sustain those positions.

Which country is growing fastest?

Saudi Arabia leads at 14.2%, driven by food security programmes funding high-value production that buys agricultural inputs on demonstrated trial evidence rather than on price.

Report Segmentation Architecture

The full report scope spans multiple orthogonal segmentation dimensions, with cross-tabulated demand data provided for each dimension pair. Coverage extends further to regional breakdowns, trend trajectories, and the competitive detail needed to support segment-level decision-making.

By Active Category

  • Humic and Fulvic Substances
  • Seaweed and Botanical Extracts
  • Protein Hydrolysates and Amino Acids
  • Microbial Inoculants
  • Inorganic and Silicon-Based Products
  • Chitosan and Biopolymer Products

By End-Use Industry

  • Controlled Environment Production
  • High-Value Horticulture
  • Commercial Field Crops
  • Plantation and Tree Crops
  • Smallholder Farming
  • Turf and Landscape

By Distribution Arrangement

  • Agricultural Distributor Channel
  • Direct Commercial Farm Supply
  • Government Programme Procurement
  • Cooperative and Aggregator Supply
  • Retail Stockist Channel

By Region

  • North America
  • Western Europe
  • East Asia
  • South Asia and Pacific
  • Latin America
  • Middle East and Africa
  • Eastern Europe

Scope, Methodology, and Coverage

Every figure in this report is reproducible from documented input assumptions. The scope below maps the historical period, the forecast horizon, the segmentation dimensions, and the countries covered, alongside the underlying primary and qualitative methodology.
Historical Period
2020 to 2025
Forecast Period
2026 to 2036
Base Year
2025 (USD billions; MMA Primary Research Dataset, August 2026)
Market Definition
The market comprises biostimulant products enhancing plant nutrient use efficiency, abiotic stress tolerance and crop quality traits independently of nutrient content, covering humic and fulvic substances, seaweed and botanical extracts, protein hydrolysates and amino acids, microbial inoculants, inorganic and silicon-based products, and chitosan and biopolymer products. The Middle East and Africa market is treated as the analytical centre, with global demand covered for comparative context. Value is measured at manufacturer level. Conventional fertilisers, crop protection products, biopesticides, soil amendments sold on nutrient content and seed treatments fall outside scope.
Quantitative Units
USD billions (current prices); thousand tonnes of product supplied annually; USD per hectare treated by active category
Segmentation Dimensions
By Active Category; By End-Use Industry; By Distribution Arrangement; By Region
Regions Covered
North America, Western Europe, East Asia, South Asia and Pacific, Latin America, Middle East and Africa, Eastern Europe
Countries Covered
Saudi Arabia, United Arab Emirates, Egypt, Morocco, Israel, Turkey, Kenya, South Africa, Nigeria, Ethiopia, Italy, Spain, France, Netherlands, Germany, United Kingdom, Poland, Romania, Ukraine, Hungary, United States, Canada, Mexico, Brazil, Chile, Peru, China, Japan, India, Australia
Key Companies Profiled
UPL, Syngenta Biologicals, Yara International, Corteva Agriscience, Haifa Group, BASF, Bayer, ICL Group, Koppert Biological Systems, Biolchim, Tradecorp, Acadian Plant Health, Lallemand Plant Care, Symborg, Rovensa, Andermatt Group, Omex Agrifluids, Agrinos, Humintech, Kimitec
Quantitative Methodology
Primary survey, n=3,800 respondents, Q4 2025, six countries; demand-side model with trade association cross-validation
Qualitative Methodology
47 expert interviews, Q4 2025; applied to validate demand model assumptions, identify emerging dynamics, and assess competitive positioning
Report Format
PDF and XLSX data workbook (Word format preview document)
Publisher
Market Minds Advisory
Report Code
MMA-2026-AGR-105
Published
August 2026
Contact
sales@marketmindsadvisory.com | www.marketmindsadvisory.com

Purchase the full Bio-Stimulants Market Report (2026 to 2036).

The full report sizes the global biostimulant market to 2036 across six active categories and seven regions, with the Middle East and Africa as the analytical centre and global demand covered for context. It treats abiotic stress intensity as the determinant of response and quantifies yield improvement against stress conditions rather than averaging across geographies. Competitive analysis covers 20 participants evaluated on product revenue, with moat and risk assessment for the two leaders. Product verification failure and registration gaps are quantified as commercial constraints rather than treated as compliance footnotes. Four quantified revenue levers close the analysis.
Six-category segment sizing with segment-level growth rates
Seven-region share and growth breakdown to 2036
Twenty-participant competitive map on one revenue basis
Yield response quantified against measured abiotic stress conditions
Registration gaps and verification failures sized by market
Four quantified revenue levers with commercial impact ranges

Built For The People Who Decide

From boardroom strategy to bench-side execution, this report is read cover-to-cover by leaders shaping the next decade of their industry, turning demand scenarios, market dynamics and valuation benchmarks into decisions.
CXOs/ Presidents/ VPs/ Managers
M&A and Corporate Development
Strategy Teams and R&D Heads
Procurement and Product Directors
Regulatory and Compliance Leaders
Investor Relations and Equity Analysts