Market Minds Advisory
Microturbines Market

Microturbines Market: One Moving Part, And A Fuel Problem Nobody Else Wants

A single rotating assembly on air bearings, no lubricant, no coolant, and tolerance for gas that would wreck a reciprocating engine. That last property is the only reason this technology survived.

Lead Analyst

David Horsley

Published

September 2026

Make Smarter Decisions with Customized Research Insights

Request a free sample report and evaluate market opportunities, growth trends, and competitive dynamics relevant to your business needs.

2025 MARKET VALUE$0.4BMarket Size 2025
2036 FORECAST VALUE$1.1BBase Case , 2026 to 2036
CAGR 2026 TO 20369.4 %Bull 10.7% / Bear 8.1%
INCREMENTAL OPPORTUNITY$0.6BNet 10- year value creation
EXPANSION MULTIPLE2.43x2036 value over 2026 base
Strategic Levers
M&A Pipeline
Regional Outlook
Country Rankings
Competitive Intelligence
Segmental Deep-dive
Call-Us : 91 93563 13602

Executive Snapshot and Market Trajectory

Microturbines lost the general distributed generation argument to reciprocating engines twenty years ago on cost and efficiency alike. What kept them alive is dirty fuel. They run on gas that would destroy a piston engine, and that niche is now growing steadily. The market reaches USD 0.4 billion in 2025.
Hydrogen and blended fuel units grow fastest at 15.2%, roughly 1.62 times the market rate, because a lean premix combustor tolerates hydrogen fractions that reciprocating engines cannot approach without knock. North America holds 30% of value on landfill gas, digester gas, and oilfield associated gas. Middle East and Africa takes 8%, above the band this framework applies, on flare gas capture across Gulf and North African fields.
Concentration is extreme at 74% across the top five, with Capstone alone accounting for most of the global installed base. Competition turns on documented fuel tolerance, on the reach of the service network, and on emissions performance achieved without any aftertreatment at all. The commercial weakness is unchanged and effectively permanent: electrical efficiency of around 33% loses to almost any reciprocating engine wherever the available gas happens to be clean pipeline quality.
Market Definition
The microturbines market covers gas turbine generating sets rated below one megawatt using a single-shaft recuperated cycle with air bearings or equivalent oil-free architecture, together with the heat recovery, controls, and service contracts supplied with them. Reciprocating gas and diesel gensets, fuel cells, industrial gas turbines above one megawatt, turbochargers, turboexpanders, and micro combined heat and power units using external combustion are excluded.
Base Year Value
$0.4B in 2025 (MMA Primary Research Dataset, August 2026)
Forecast Period
2026 to 2036, eleven discrete annual values
CAGR
9.4% base case. Bull 10.7%. Bear 8.1%.
Fastest Growth Segment
Hydrogen and Blended Fuel Microturbines: 15.2% CAGR
Fastest Growth Country
Saudi Arabia: 12.4% CAGR
Fastest Growth Region
South Asia and Pacific: 11.2% CAGR
Largest Region
North America: 30% of 2025 global value
Market Leaders
Capstone Green Energy, Ansaldo Energia, Kawasaki Heavy Industries, Bladon Micro Turbine, FlexEnergy Solutions. Source: MMA Primary Research Dataset, July 2026.
Primary Survey
n=3,800 procurement and R&D decision-makers, Q4 2025, six countries
Methodology
Demand-side build-up, cross-validated against public data, 47 expert interviews

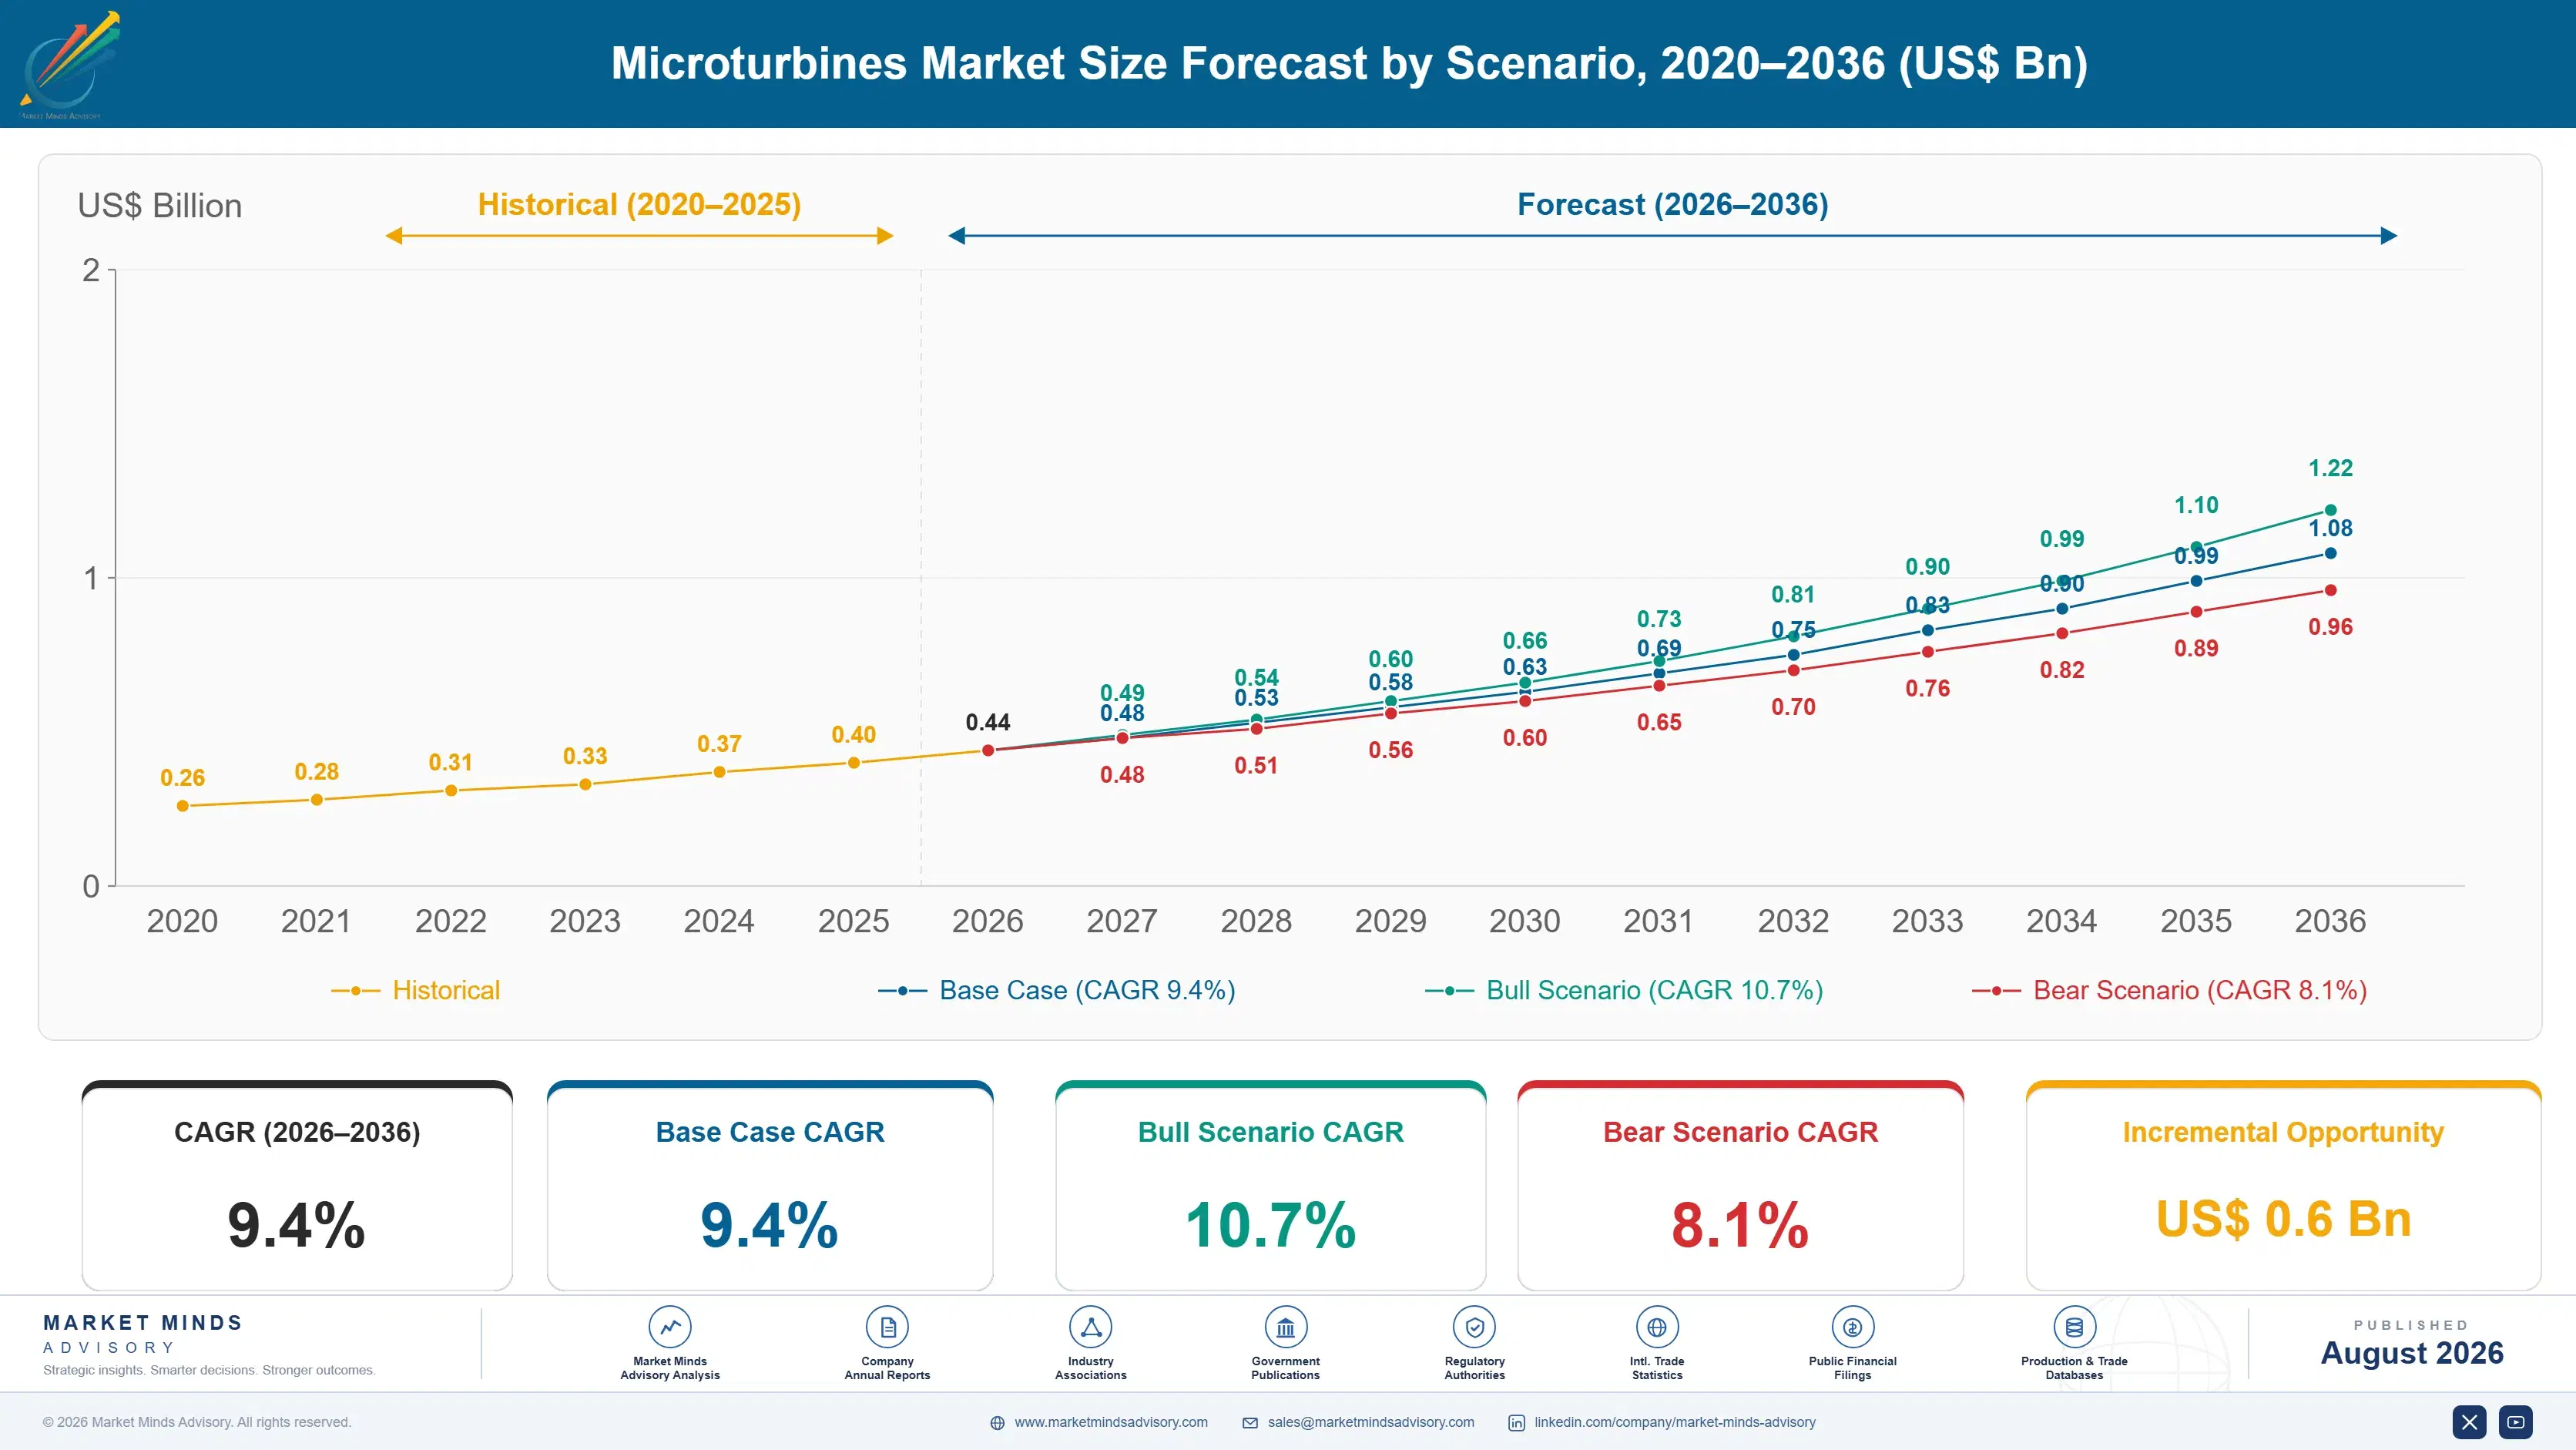
Microturbines Market Forecast Scenarios

microturbines-market-size-forecast-scenario-1787334160147
The 2020 to 2025 period was survival followed by a narrower and better business. Capstone restructured through Chapter 11 in 2023 and emerged focused on service revenue and rental fleets rather than on volume unit sales. Oil and gas customers cut spending in 2020 and returned from 2022. An 8.2% historical CAGR hides a collapse in unit shipments offset by service and rental income that grew throughout.
Three mechanisms carry the 9.4% base case. Flare and associated gas capture is the largest, since regulators in the United States, Nigeria, Iraq, and the Gulf are tightening routine flaring rules and microturbines burn that gas where nothing else reliably will. Biogas and digester gas is the second, growing with wastewater and food waste treatment capacity. And hydrogen readiness is the third, opening projects where a decarbonisation commitment rules out a reciprocating engine.
The 10.7% bull case depends on flaring enforcement actually biting, particularly in Iraq and Nigeria where committed elimination dates keep moving. The 8.1% bear case is reciprocating engine makers extending their own fuel tolerance far enough to take the dirty gas niche, which would remove the one commercial argument microturbines currently hold on their own.

One Rotating Assembly, No Oil, Difficult Fuel

The engineering case for a microturbine is genuinely elegant. One rotating assembly on air bearings, no lubricating oil, no coolant, no vibration worth mentioning, and maintenance intervals measured in tens of thousands of hours. Emissions are low enough to meet strict limits without any aftertreatment at all. On paper it should have displaced small reciprocating gensets entirely, and for a while everybody assumed it would.
TOP FIVE CONCENTRATION74%One supplier accounts for most of the global installed base
ELECTRICAL EFFICIENCY33%Recuperated cycle output before any heat recovery is counted
INSTALLED COST PER KILOWATTUSD 2,400Delivered and commissioned cost for a typical packaged unit
MAJOR OVERHAUL INTERVAL40,000 hoursOperating hours between scheduled hot section replacement events
SERVICE REVENUE SHARE38%Supplier turnover from contracts, parts, and rental fleets
TYPICAL UNIT RATING200 kilowattsCommon single-package electrical rating across most installed applications today
It did not, because electrical efficiency sits around 33% against 40% or better for a comparable reciprocating engine, and capital cost per kilowatt is higher on top of that. On clean pipeline gas that arithmetic loses every time, which is why the general distributed generation market went elsewhere and has stayed there since.
What saved the technology is fuel that other machines cannot handle. Landfill gas with siloxanes, digester gas with hydrogen sulphide, wellhead associated gas with variable heating value and liquids carryover: all of these wreck piston engines and a microturbine tolerates them with modest conditioning. That is a narrow market, but it is a defensible one and it is growing faster than the alternative was ever going to.
"Every few years somebody rediscovers that microturbines are elegant and tries to sell them against reciprocating engines on clean gas. It fails, every time. The business is in fuel nobody else will touch, and that is not a consolation prize."
Director, Distributed Generation Practice · MMA Energy Practice ·

Market Trends

Flaring Rules Convert Wasted Gas Into Generation

Regulators across the United States, Nigeria, Iraq, and the Gulf states have tightened routine flaring restrictions, and operators need somewhere for associated gas that was previously burned at the wellhead. That gas has variable heating value, liquids carryover, and contaminants that destroy reciprocating engines within hundreds of hours. Microturbines handle it with modest conditioning and produce power the field can use for artificial lift, water handling, and camp loads. The fuel costs nothing and the alternative is a regulatory penalty, which makes the economics unusually straightforward for a distributed generation project.
Market Impact: Digester capacity grows 6% annually
Hydrogen Blending Suits Lean Premix Combustion

Lean premix combustors tolerate hydrogen fractions that reciprocating engines cannot approach without knock and derating, and several manufacturers now offer units certified for substantial hydrogen content with pure hydrogen designs in development. That capability matters less for the fuel available today than for the projects it qualifies for, since a decarbonisation commitment increasingly rules out equipment that cannot accept hydrogen later. Buyers are specifying readiness rather than immediate use. It is the fastest-growing part of an otherwise small market, and it is growing on optionality rather than on delivered volume.
Market Impact: Service carries 38% of revenue

Market Opportunities and Growth Drivers

Biogas Treatment Capacity Expands With Waste Regulation

Wastewater treatment plants and anaerobic digesters produce gas continuously and increasingly must use it rather than flare it, and that gas carries hydrogen sulphide and siloxanes that shorten reciprocating engine life dramatically. Microturbines run on it with simpler conditioning and meet emission limits without selective catalytic reduction, which matters at plants sited near housing. European separate biowaste collection and North American organics diversion rules are both adding digester capacity. Each new plant is a candidate installation with fuel already on site and a disposal obligation attached to it. The fuel is already there and already a problem.
Market Impact: Efficiency gap reaches 7 percentage

Service And Rental Revenue Rebuilt The Business Model

After restructuring, the industry shifted weight from unit sales toward long-term service contracts, factory protection plans, and rental fleets, and service now carries around 38% of supplier revenue. That income is contracted, recurring, and considerably less exposed to the capital spending cycles that historically made this business unpredictable. It also gives suppliers the field data needed to improve fuel tolerance on the applications that matter. Customers accept it because a microturbine with a factory service agreement has availability figures a self-maintained reciprocating engine rarely reaches. That shift has changed what this industry actually sells.
Market Impact: One supplier holds over 50% share

Market Restraints and Challenges

Efficiency Gap Rules Out Clean Gas Applications

Electrical efficiency around 33% against 40% or better from a comparable reciprocating engine is a permanent arithmetic problem wherever fuel is bought at market price. The root cause is thermodynamic: a small recuperated Brayton cycle cannot reach the compression ratios and combustion temperatures that make larger machines efficient, and no incremental development changes that. Commercially it confines microturbines to applications where fuel is free, waste, or otherwise unusable. Suppliers are mitigating through combined heat and power configurations that lift total fuel use above 80%, and through recuperator improvements that add a few points.
Market Impact: Flaring wastes 140 billion cubic me

Single Supplier Dominance Worries Institutional Buyers

One manufacturer accounts for most of the global installed base, and it went through Chapter 11 restructuring in 2023, which utilities and municipal buyers remember clearly. The root cause is that the market was never large enough to support several manufacturers at scale, so consolidation was inevitable. Commercially it makes procurement committees hesitate on twenty-year assets, and it strengthens the case for a reciprocating engine from a supplier nobody doubts. Participants are mitigating through independent service networks, parts availability guarantees, and rental options that reduce the buyer's exposure to any single manufacturer.
Market Impact: Units certified to 30% hydrogen
3 additional market trends, 2 additional growth drivers, and 4 additional restraints and challenges are covered in the full report. Contact sales@marketmindsadvisory.com to access the complete intelligence.

Segment CAGR and Growth Architecture

Segmentation follows fuel input, because in this market the fuel is the entire reason that the machine ever gets bought at all. Combustor design, conditioning requirement, service interval, and the whole commercial case all change with what is being burned, and nothing else in the specification matters anywhere near as much as that does.
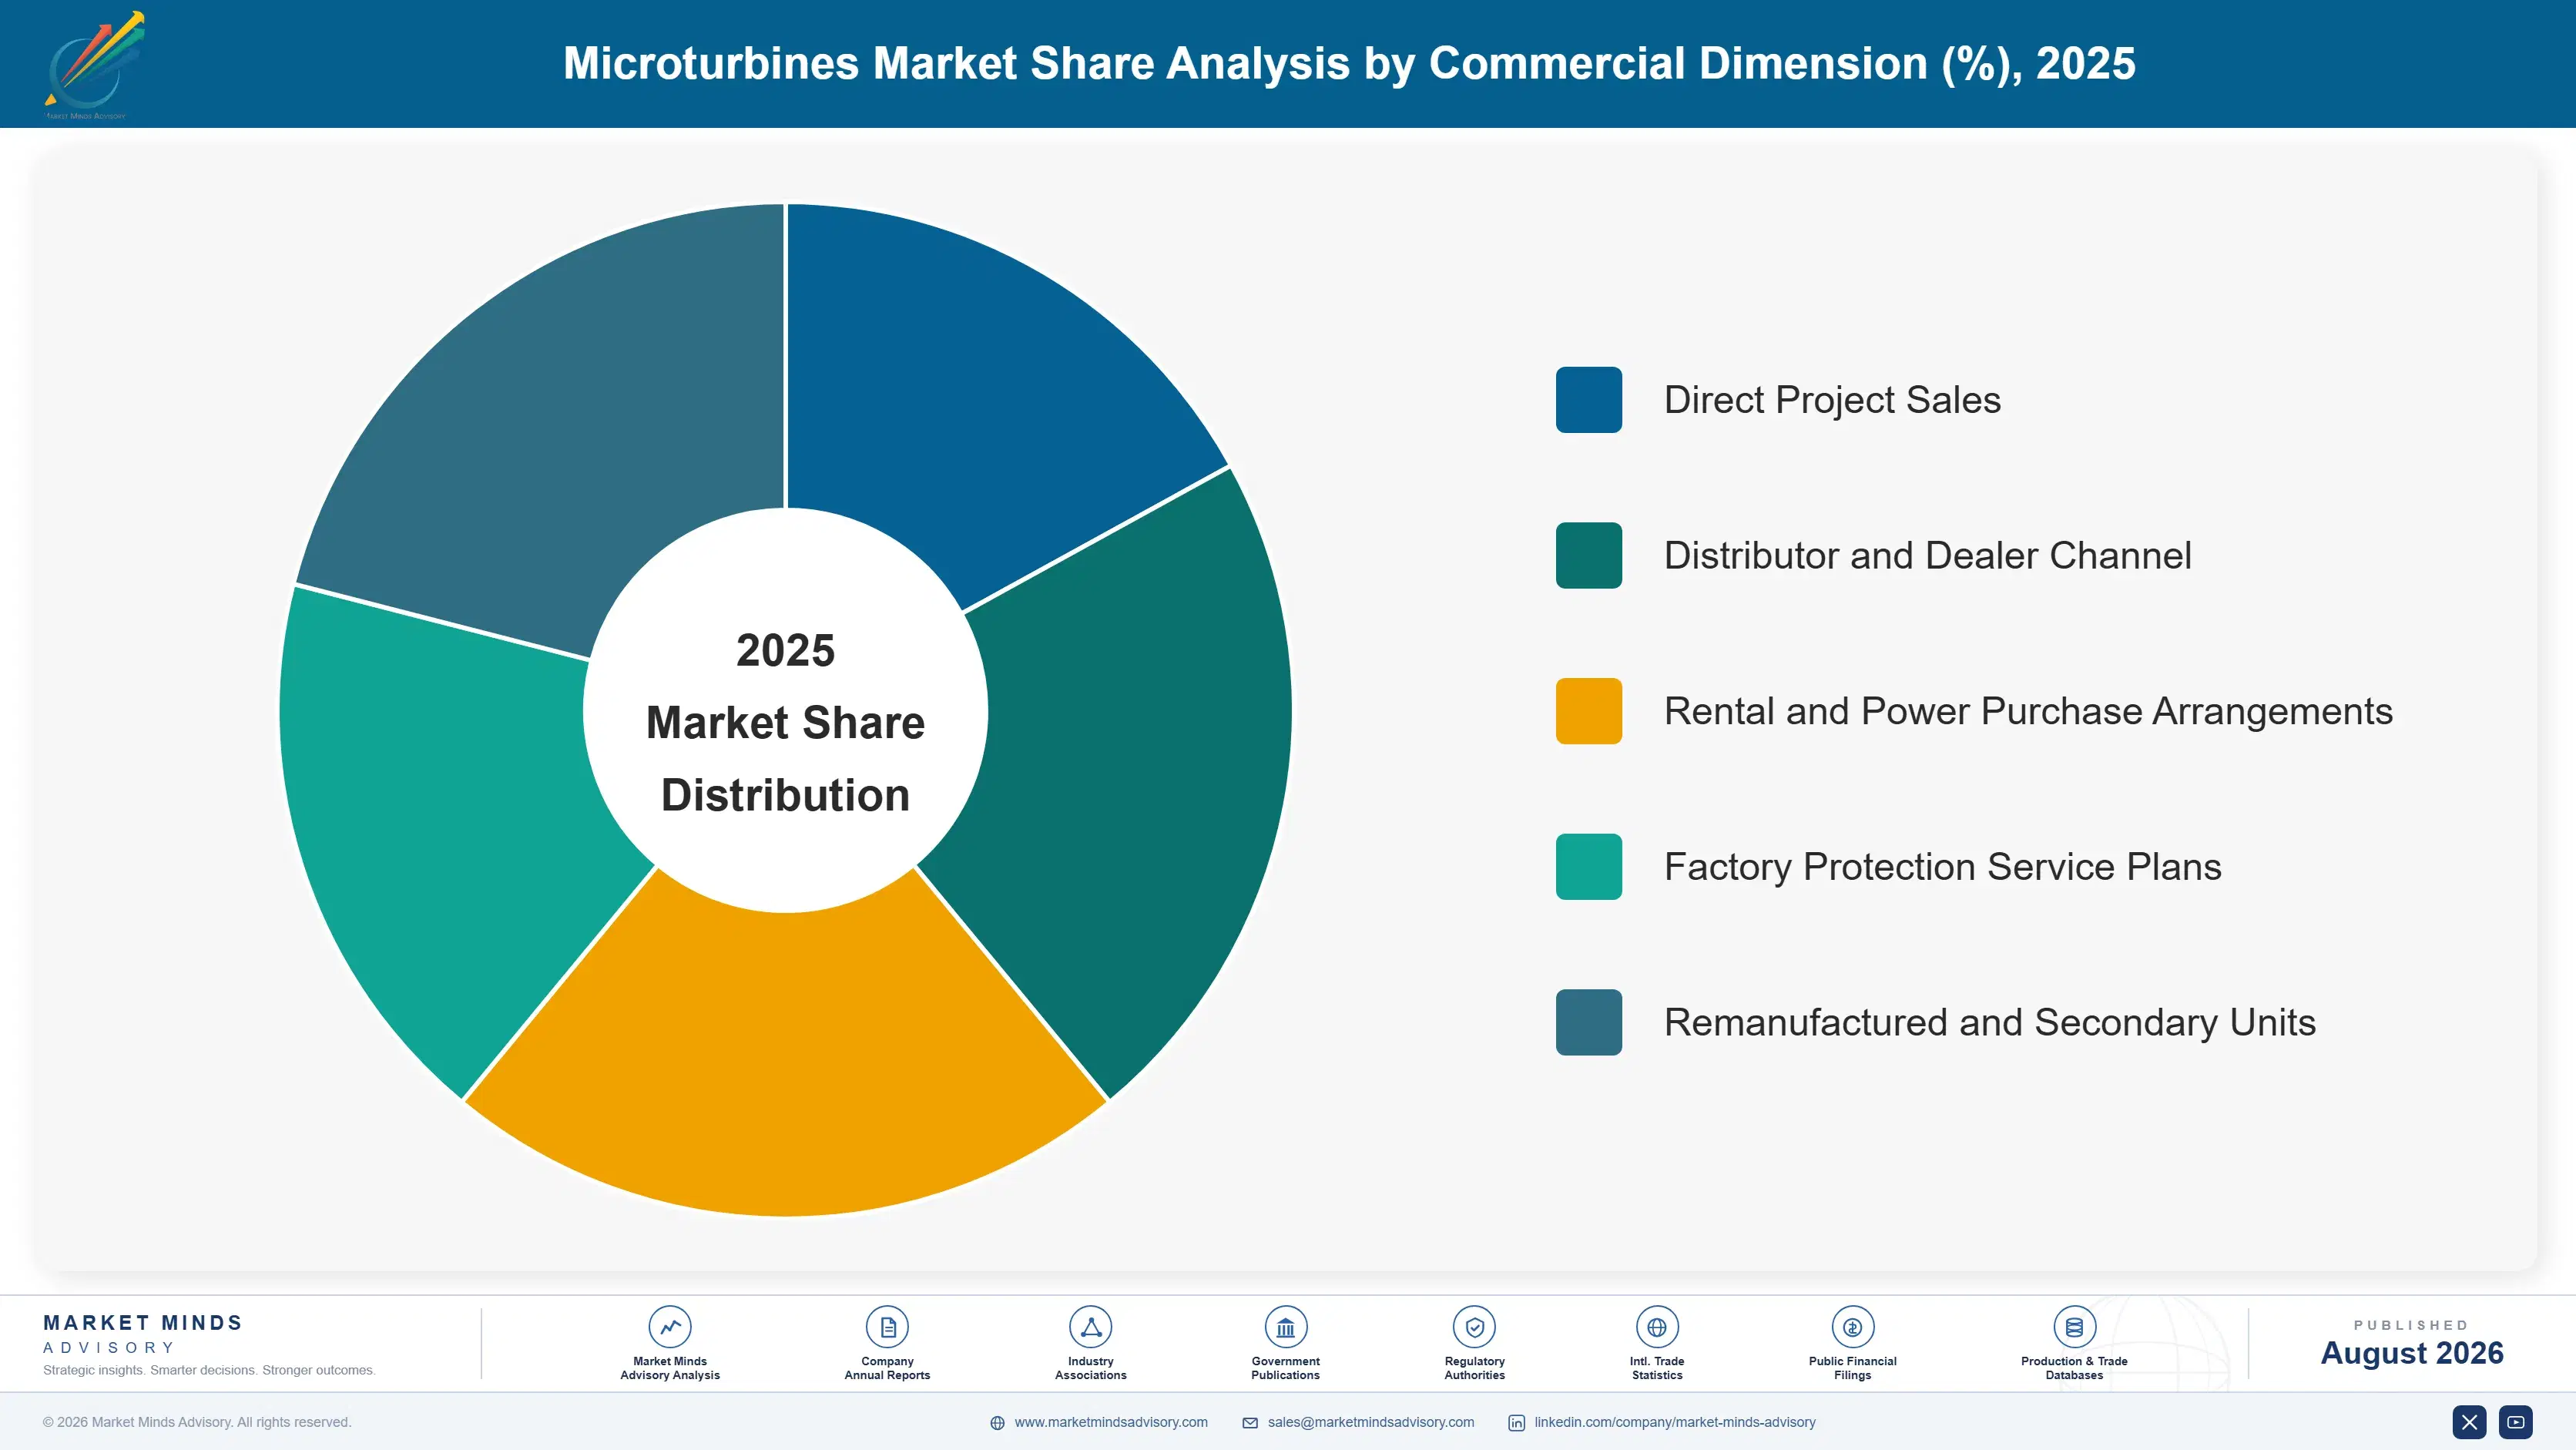
microturbines-market-market-share-analysis-1787334160676

Hydrogen and Blended Fuel Microturbines

Hydrogen and blended fuel units grow fastest at 15.2%, about 1.62 times the market rate, from a base small enough that the percentage overstates the tonnage. Lean premix combustion accepts hydrogen fractions that make a reciprocating engine knock and derate, and several manufacturers now certify substantial blends with pure hydrogen designs in development. Most buyers are not burning hydrogen today. They are buying equipment that will still be permitted when their decarbonisation commitments come due, which is a different purchase and one that rewards certification over delivered performance. Growth here is optionality being priced rather than fuel being consumed. Delivered hydrogen volumes remain negligible across the whole installed base. That gap is unlikely to close soon.
CAGR 15.2%

Biogas and Landfill Gas Microturbines

Biogas and landfill gas units grow at 11.8% and represent the most established defensible application this technology has. Digester and landfill gas carries hydrogen sulphide, siloxanes, and moisture that shorten reciprocating engine life to a fraction of rated hours, while a microturbine runs on it with modest conditioning and no aftertreatment. Wastewater plants and landfills sited near housing value emissions performance as much as availability, since a permit condition is harder to negotiate than a maintenance budget. Waste regulation across Europe and North America keeps adding digester capacity, and each new plant arrives with fuel already on site. Fuel supply and disposal obligation arrive together, which simplifies the case. Few applications are this well matched.
CAGR 11.8%
Full segment breakdown across 7 segments available in the complete report.

Regional Architecture and Country Demand Map

Regional shares here follow where unusable gas is actually produced, and not at all where electricity demand happens to be greatest. Landfills, digesters, and oilfields generate the fuel that makes this technology economic, and installations cluster tightly around those sources rather than around load centres.

North America

North America holds 30% of value, and three separate fuel streams explain it. Landfill gas projects across the United States remain the largest installed application, supported by renewable energy credits and by methane rules that make venting increasingly expensive. Oilfield associated gas in the Permian and Bakken feeds units powering artificial lift and water handling where grid connection would cost more than the gas is worth. Wastewater digester installations add a steady municipal stream. Capstone's home service network is denser here than anywhere else, which matters enormously for an asset requiring scheduled hot section work. Growth at 9.0% sits close to the global rate on flaring enforcement and organics diversion together.
Share: 30% | CAGR: 9.0% (2026 to 2036)

Middle East and Africa

Middle East and Africa takes 8% of value against a 6% ceiling in this framework, and routine flaring is the reason for the breach. Iraq, Nigeria, Algeria, and the Gulf producers flare enormous volumes of associated gas, and commitments to eliminate that practice have created a genuine equipment requirement at remote wellheads with no pipeline and no grid. Microturbines burn wellhead gas with liquids carryover and variable heating value that would destroy a piston engine within months. Saudi and Emirati operators are the most systematic buyers. Enforcement rather than economics determines the pace here, which makes the forecast more political than commercial. Growth at 9.8% exceeds the global rate. Very little of this demand is discretionary.
Share: 8% | CAGR: 9.8% (2026 to 2036)
Regional intelligence for 5 additional markets available in the complete report: Western Europe, East Asia, South Asia and Pacific, Latin America, Eastern Europe. Contact sales@marketmindsadvisory.com.
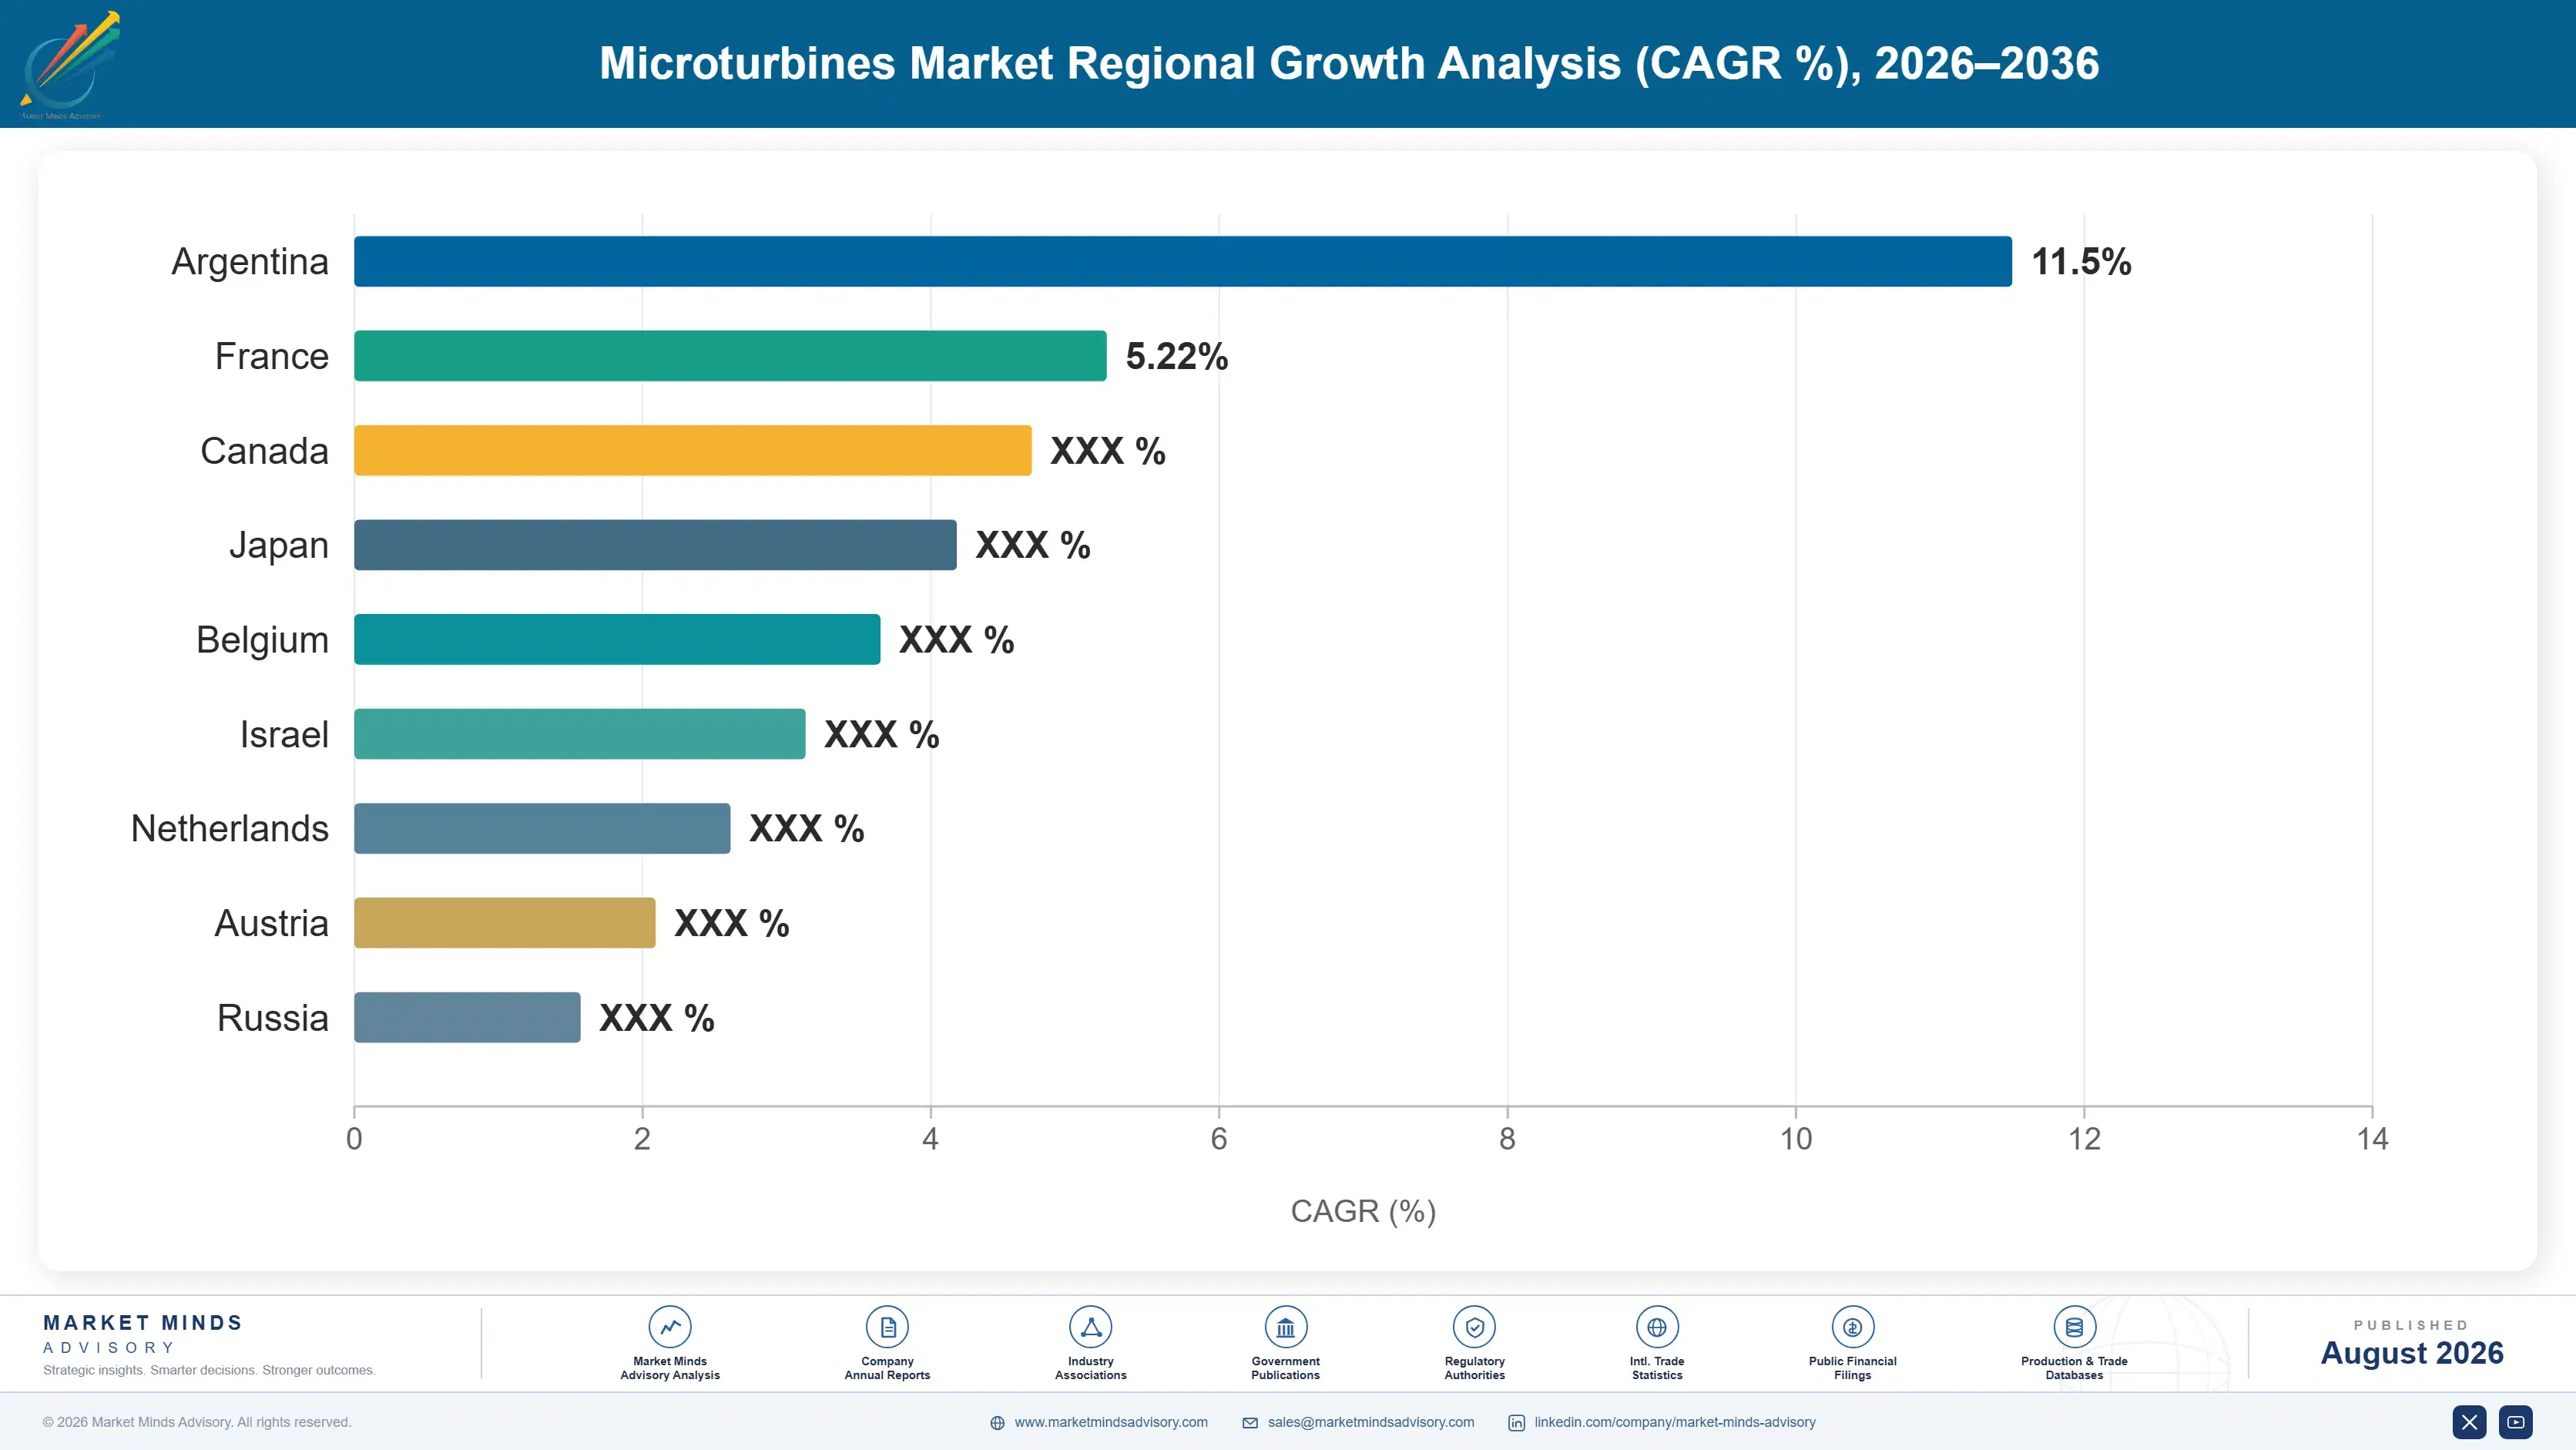
microturbines-market-country-cagr-analysis-1787334161196

Where Microturbine Money Actually Comes From

Selling microturbines against reciprocating engines on efficiency alone is a losing argument that this industry has already lost once before. What earns money is the service contract across a twenty-year asset life, the rental fleet that removes capital risk from the buyer, and being the only machine that will burn a particular customer's gas.

Contract The Whole Asset Life, Not The Machine

A microturbine needs scheduled hot section replacement every 40,000 hours and a customer who neglects it destroys the availability figures the technology is sold on. Factory protection plans covering parts, labour, and remote monitoring already carry around 38% of supplier revenue, recovering 6% to 9% of installed value annually at margins above the equipment sale. Customers accept it readily because a maintained unit reaches availability a self-serviced reciprocating engine rarely matches. The data those contracts generate also feeds fuel tolerance improvements that no laboratory programme would produce. Few equipment businesses have a recurring stream this predictable.
Market Impact: Service recovers 6 to 9 percent of

Rent The Fleet Where Capital Approval Stalls

Oilfield and industrial customers frequently want the power without the capital request, particularly on sites with uncertain production life where a twenty-year asset makes no sense. Rental and power purchase arrangements convert a stalled sale into monthly revenue at yields of 25% to 35% of unit value annually, and the machine returns to the fleet when the site closes. It also removes the single supplier concern that slows institutional procurement. Fleet utilisation is the discipline that decides whether this works, and it is the number most operators track least carefully.
Market Impact: Rental yields 25 to 35 percent of v

Sell Fuel Tolerance As Documented Capability

Buyers with difficult gas rarely know whether their specific composition will run, and suppliers rarely tell them precisely. Published tolerance envelopes covering siloxane loading, hydrogen sulphide concentration, heating value swing, and liquids carryover convert a technical conversation into a qualification exercise that reciprocating engine vendors cannot enter at all. Sites that publish gas analyses can then be targeted directly. Suppliers doing this reach projects worth USD 300,000 to USD 900,000 that never went to tender, because the customer did not know a suitable machine existed. Almost nobody in this industry publishes those numbers today.
Market Impact: Untendered projects worth 300,000 t

Who Controls the Margin Pool

Concentration is extreme at 74% across the top five measured on microturbine revenue, and that is a consequence of a market too small to support many manufacturers. Capstone Green Energy accounts for most of the global installed base by a wide margin, with Ansaldo Energia holding the strongest European position through the Turbec line it acquired. Kawasaki, Bladon, and FlexEnergy follow at some distance. The gap between the leader and the field is installed base and service reach.
Competition currently turns on documented fuel tolerance, service network density near the site, and whether the supplier will take rental or availability risk. Efficiency comparisons rarely feature, because customers who care about efficiency bought a reciprocating engine before the conversation started. Price matters less than an institutional buyer's confidence that parts will exist in fifteen years.

Pressure is building from two directions. Reciprocating engine makers are extending fuel tolerance and hydrogen capability into territory microturbines held alone, and fuel cell suppliers are targeting the same biogas sites with better efficiency and worse fuel tolerance. Rankings will shift wherever a competitor establishes credible service coverage, which is currently the strongest barrier the incumbent holds.
microturbines-market-company-positioning-matrix-1787334161720

Competitive Moat and Risk Dimensions

CAPSTONE GREEN ENERGY

Moat: Installed base and service network

Capstone has installed more units than every competitor combined and supports them through a distributor network with parts availability no rival approaches. For an asset needing scheduled hot section work over twenty years, that network is the product as much as the machine is, and a competitor would need a decade of installations before it could offer anything comparable.
CAPSTONE GREEN ENERGY

Risk: Restructuring memory deters buyers

Chapter 11 restructuring in 2023 is recent enough that utility and municipal procurement committees still raise it, and single supplier dominance turns any doubt about the company into doubt about the technology. Institutional buyers evaluating twenty-year assets weight supplier continuity heavily, and no amount of current financial performance settles the question quickly.
ANSALDO ENERGIA

Moat: European manufacturing and utility credibility

Ansaldo builds microturbines in Italy inside a much larger power generation business, which gives European buyers a supplier whose continuity nobody questions. That balance sheet credibility is worth real money in municipal and utility procurement, where the counterparty assessment often carries more weight than the machine specification does in the final decision.
ANSALDO ENERGIA

Risk: Microturbines are peripheral

Microturbines are a small line inside a business dominated by large gas turbines and service, which shapes how development budget and sales attention get allocated internally. A dedicated competitor can out-invest Ansaldo in this specific technology without matching its overall scale, and the product roadmap has moved slowly by comparison with the attention larger units receive.

Players Tracked

Prominent Players

Capstone Green Energy
Ansaldo Energia
Kawasaki Heavy Industries
Bladon Micro Turbine
FlexEnergy Solutions

Other Key Players

Micro Turbine Technology BV
Aurelia Turbines
Brayton Energy
IHI Power Systems
Elliott Group
Toyota Turbine and Systems
Samad Power
Calnetix Technologies
Enertwin
Vericor Power Systems
Global Microturbine
E-Quad Power Systems
Bowman Power Group
Yanmar
Baker Hughes

Recent Developments

FEBRUARY 2025

Manufacturer certified units for higher hydrogen blend operation

A microturbine manufacturer certified part of its range for operation on natural gas blended with substantial hydrogen content, extending several years of earlier validation work on lean premix combustion. The certification targets buyers whose decarbonisation commitments require equipment that will remain permitted across the whole asset life.
Signal: Customers are buying certification for fue
AUGUST 2024

Oilfield operator deployed associated gas units across remote wellheads

An oilfield operator deployed microturbine packages across remote wellheads to convert associated gas into power for artificial lift and water handling, replacing routine flaring. The gas carries liquids and variable heating value that reciprocating engines cannot tolerate for more than a few hundred operating hours.
Signal: Regulation rather than economics is creati
NOVEMBER 2024

Supplier expanded rental fleet for short-duration industrial sites

A microturbine supplier expanded its rental and power purchase fleet, targeting industrial and oilfield sites where production life is uncertain and capital approval for a twenty-year asset is difficult to obtain at all. Units simply return to the fleet when the site eventually closes down.
Signal: Rental removes both the capital request an

Alloys, Recuperators, And Power Electronics

High temperature nickel alloys for the turbine wheel and hot section carry roughly 26% to 34% of cost of goods, bought from specialty alloy producers in the United States, Europe, and Japan. Stainless steel recuperator cores add 18% to 24% and are the single most cost-sensitive component. Power electronics, permanent magnet generators, and controls account for most of the balance, with rare earth magnet content a small but exposed item.
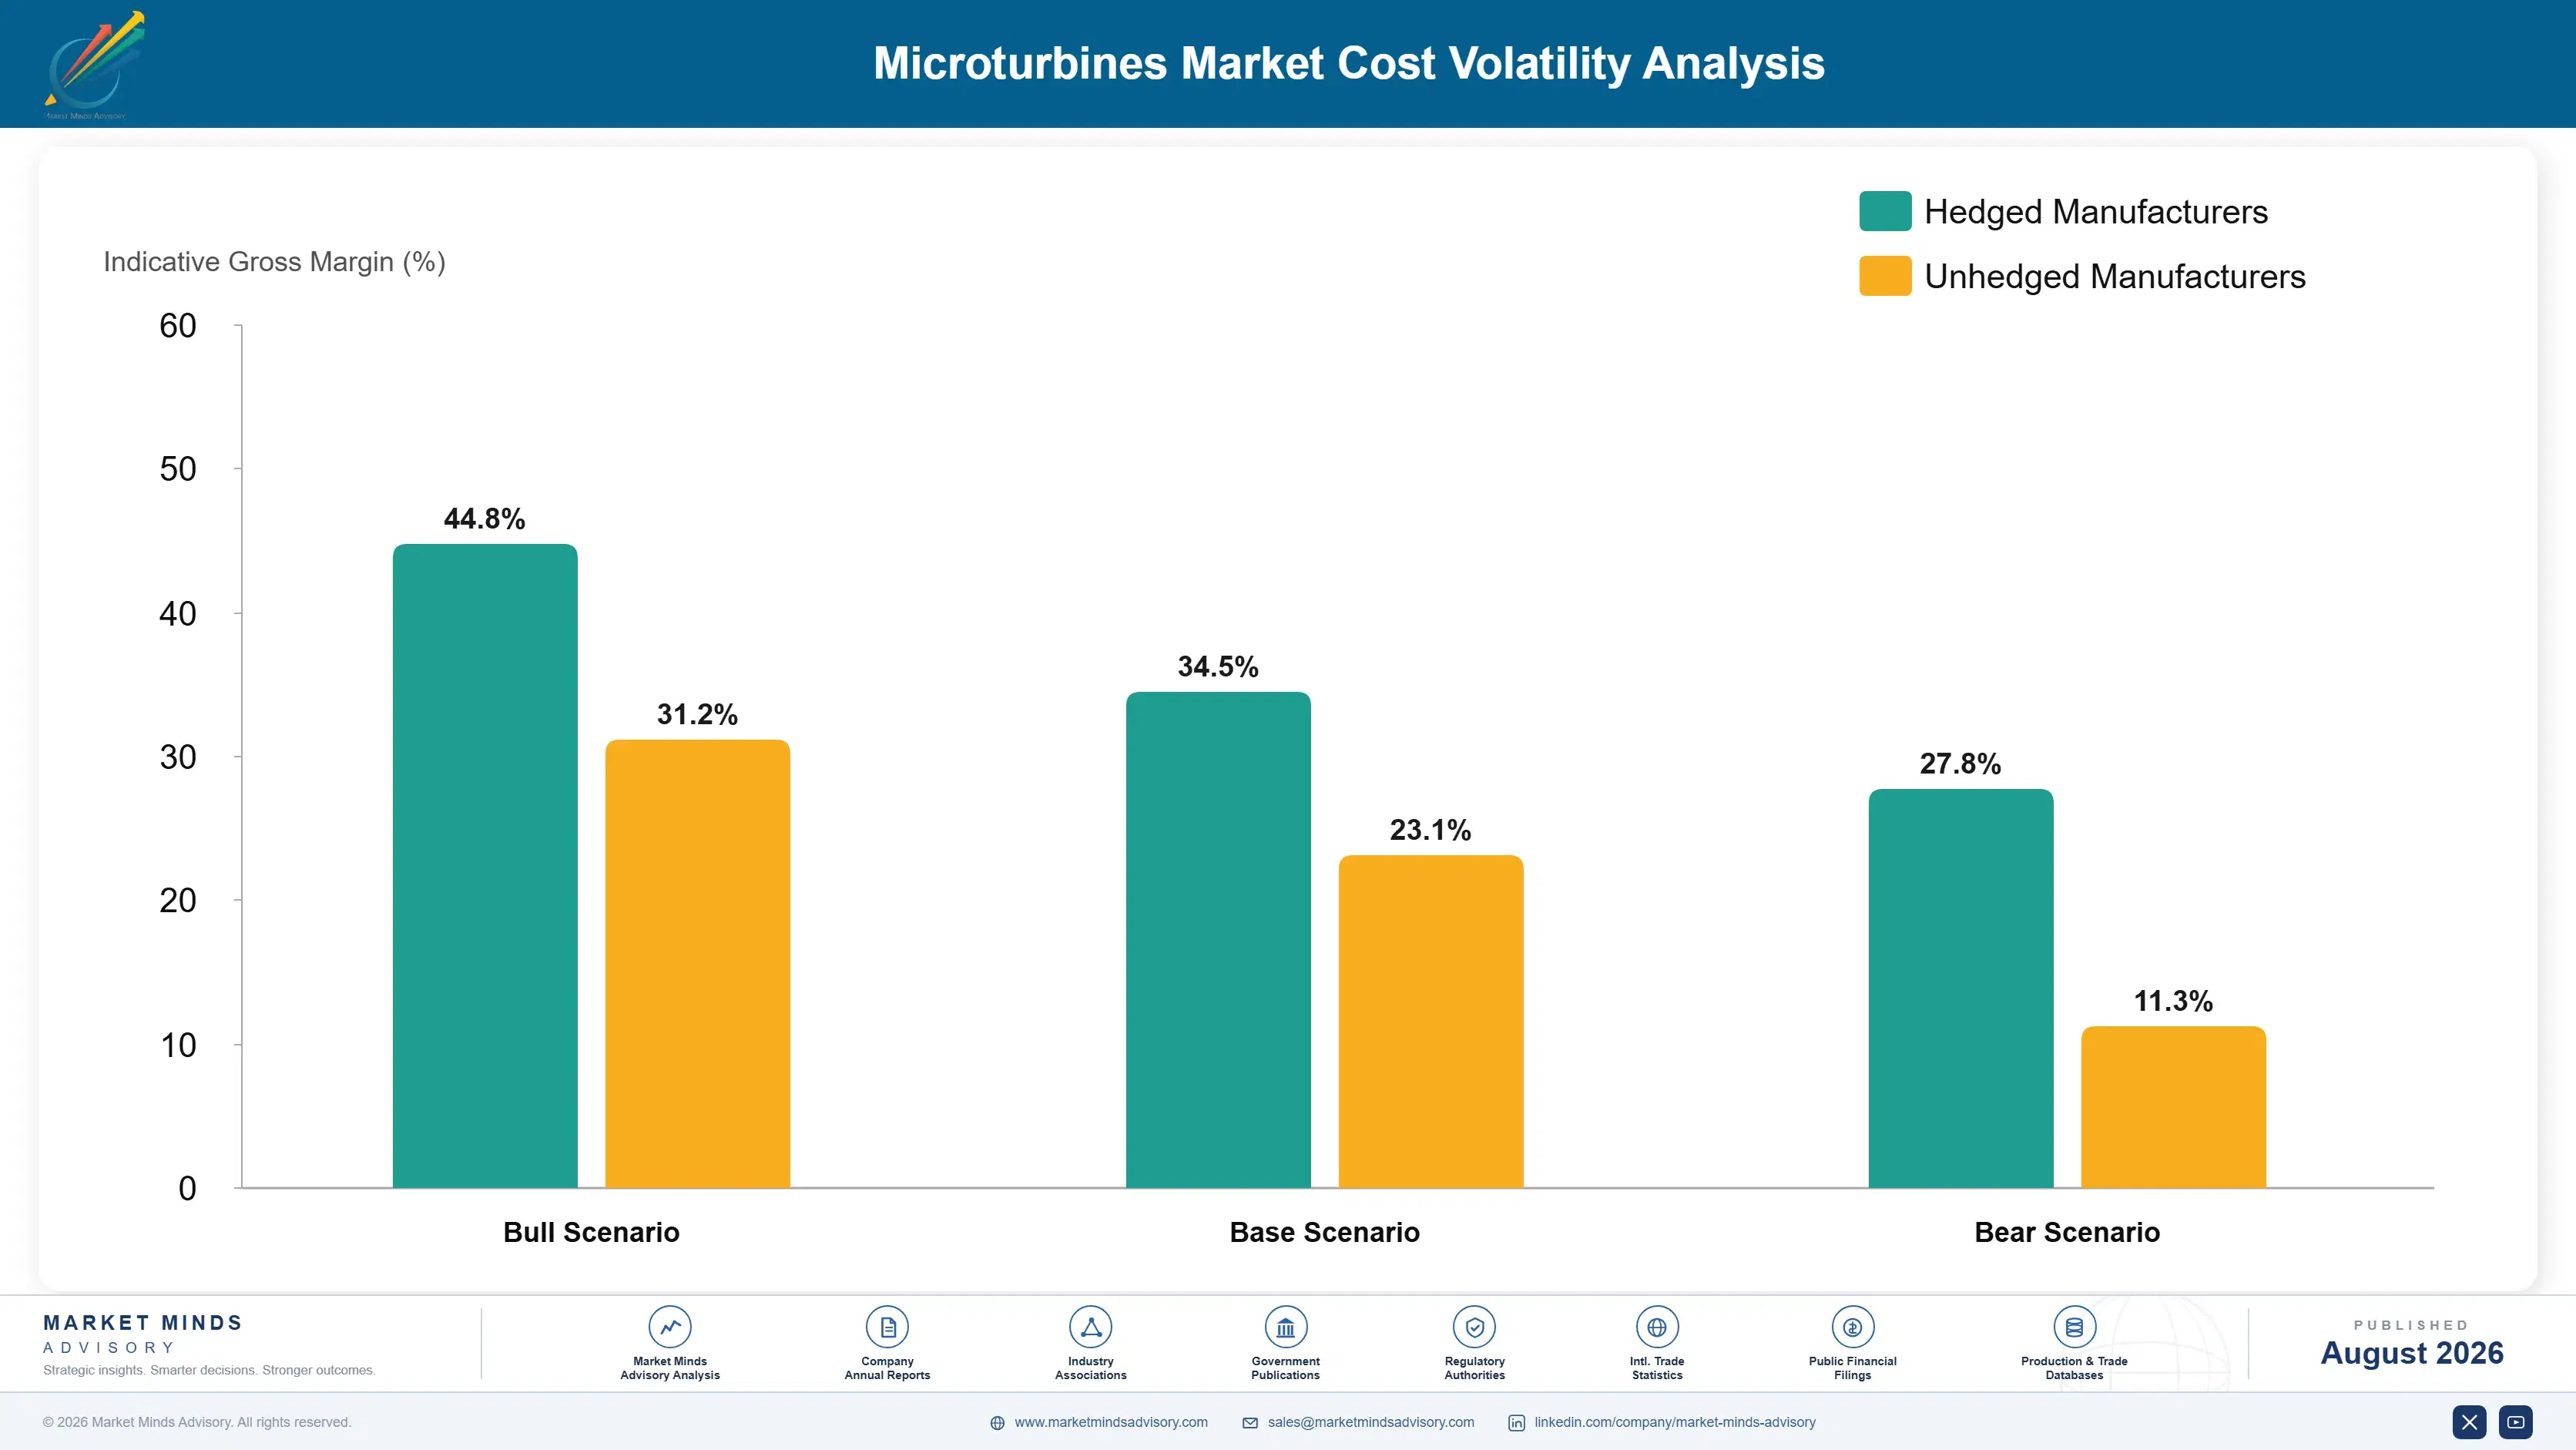
Nickel prices spiked violently in March 2022 when the London Metal Exchange suspended and cancelled trades, reaching around USD 100,000 per tonne intraday, and hot section alloy pricing followed with a lag. Capstone disclosed input cost pressure and supply constraint in its filings across that period. Producers holding firm quotes on multi-unit orders absorbed the difference, because a project priced against a utility tariff cannot be repriced upward.

Exposure divides by order structure rather than by geography. Suppliers selling single units through distributors reprice each season and pass movement through within months. Those bidding multi-unit oilfield or municipal projects with long approval cycles carry it between quote and delivery. Rental operators sit differently again, exposed to overhaul parts cost across a fleet they already own.
microturbines-market-cost-volatility-analysis-1787334161916

Index multi-unit project quotes to alloy benchmarks

Building a nickel index adjustment into multi-unit project pricing shifts the risk between quote and delivery back to the buyer, which is where it belongs on approval cycles running past a year. Buyers accept it more readily than the risk premium a supplier would otherwise add, and the mechanism is already standard practice across specialty alloy supply chains.

Design recuperators toward lower alloy content

Recuperator cores are the most cost-sensitive component and small changes in surface geometry can hold thermal performance while cutting stainless content meaningfully. The engineering effort is substantial and the qualification testing longer still, but the saving repeats on every unit built afterwards. It also reduces the weight that drives freight cost on packaged systems shipped worldwide.

Pool overhaul parts demand across the service fleet

Hot section parts consumption across a large installed base is far more predictable than new unit volume, which makes it genuinely forecastable and therefore hedgeable through forward alloy purchasing. Suppliers with service contracts across thousands of units can commit to volumes that unit sales alone would never support, and buy considerably better than spot pricing allows.

Portfolio Architecture for Margin Defence

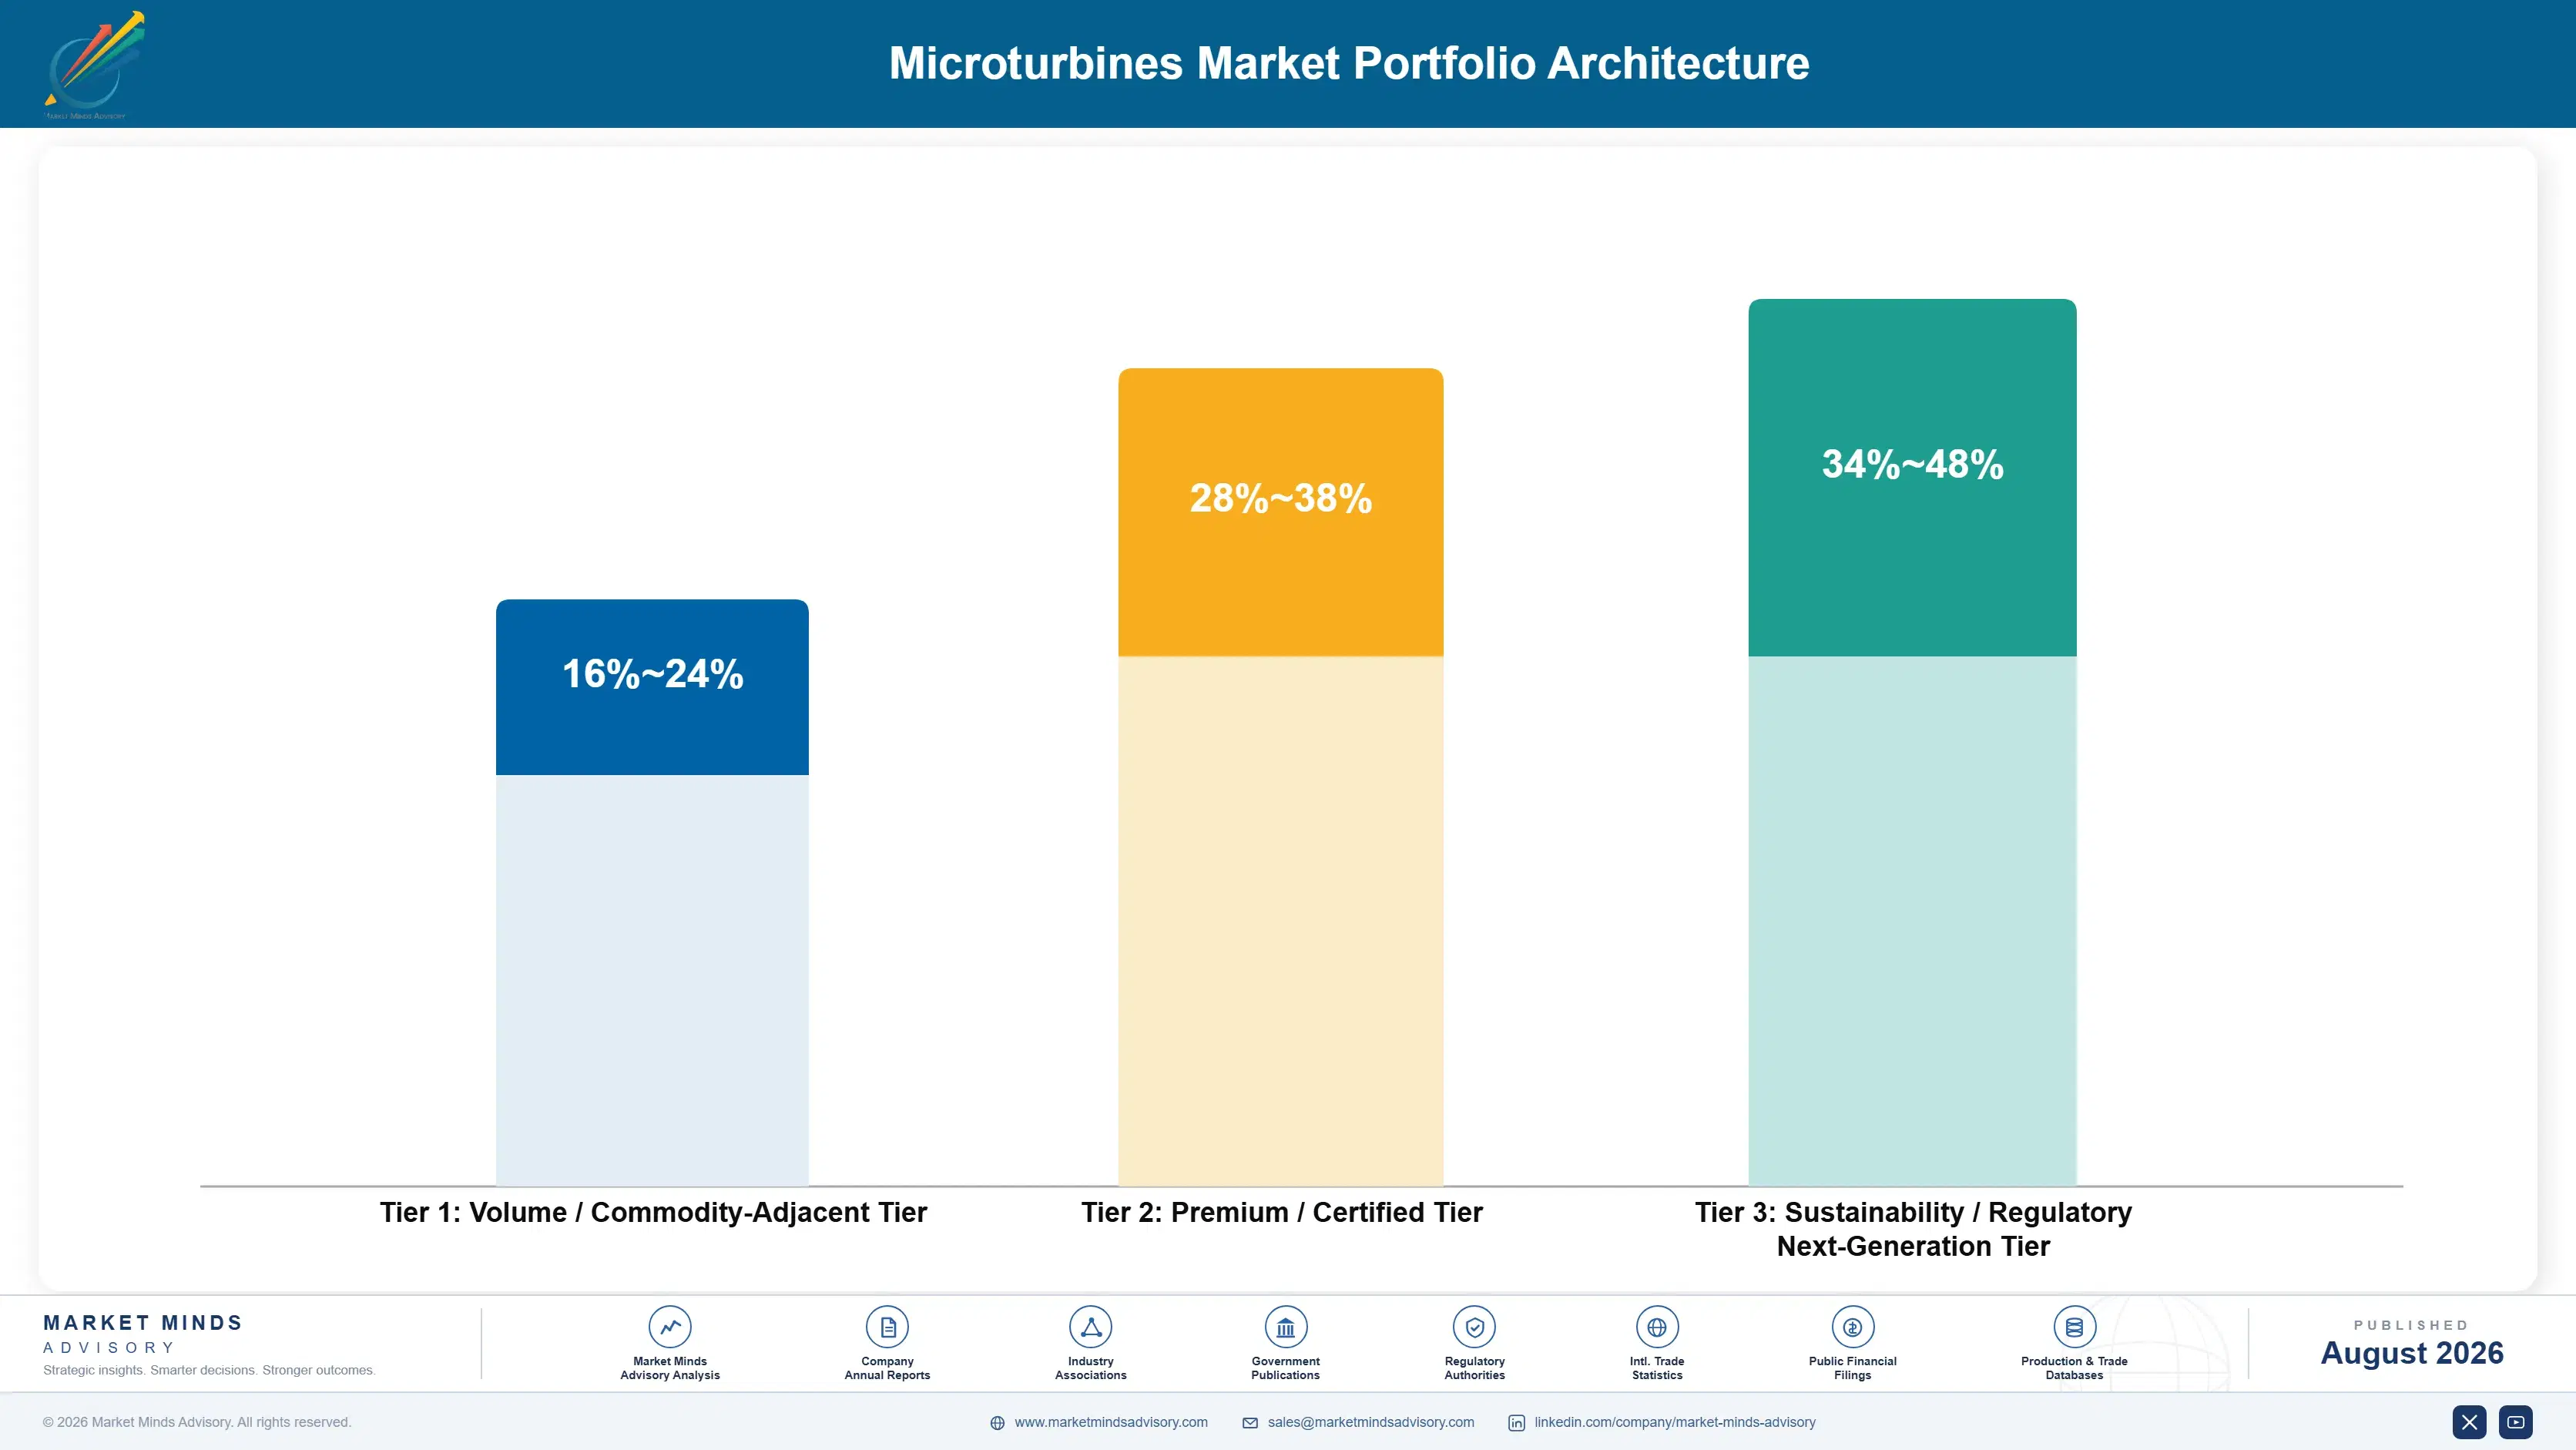
Margin here tracks how difficult the customer's fuel actually is. Clean natural gas installations compete against reciprocating engines that win on efficiency and on capital cost, and pricing reflects a losing position. Landfill, digester, and wellhead gas installations compete against nothing at all, because no alternative machine survives the fuel for long, and pricing reflects that scarcity instead.
The volume tension is unusual for an equipment business. New unit sales are lumpy, capital-approval dependent, and thin on margin, while service contracts and rental income are recurring, predictable, and considerably more profitable across the cycle. The industry has already shifted weight toward the second after learning painfully what dependence on the first does through a downturn, and that shift is not finished yet.

High-value pools sit in three places. Factory protection plans across the whole installed base, rental and power purchase arrangements on sites with uncertain production life, and hydrogen-certified units bought purely for optionality rather than for any fuel available today. None of those three is really an equipment sale at all, which tells you exactly where this business has ended up after two difficult decades.

Volume / Commodity-Adjacent Tier

Standard natural gas packages sold through distributors into combined heat and power applications. They compete directly against reciprocating engines on efficiency and cost, and the range reflects how much channel margin sits in the sale.
Gross Margin: 16-24%

Premium / Certified Tier

Units configured for landfill, digester, and wellhead gas with fuel conditioning and documented tolerance envelopes. Scarcity of any alternative machine rather than manufacturing cost supports the margin at these sites.
Gross Margin: 28-38%

Sustainability / Regulatory / Next-Generation Tier

Hydrogen-certified packages, factory protection plans, and rental and power purchase arrangements. The wide range reflects genuinely different economics between certified hardware, contracted service, and fleet rental yield on owned assets.
Gross Margin: 34-48%
microturbines-market-portfolio-architecture-1787334162410

High-value Sub-segments and Strategic Watch-out

Factory Protection Service Plans

Recovering 6% to 9% of installed value annually across a twenty-year asset, at margins the equipment sale never reaches. It also produces the field data on fuel tolerance that no laboratory programme generates, which feeds directly back into product credibility. Nothing else in this business is as predictable.
Gross Margin: 38-50%

Hydrogen-Certified Packages

Growing at 15.2% on optionality rather than on any fuel actually being burned in the field today. Buyers are purchasing equipment that will still be permitted when their own decarbonisation commitments come due, which rewards certification work far more than it ever rewards delivered field performance.
Gross Margin: 34-46%

Natural Gas Combined Heat And Power

The historic volume base and the weakest competitive position, losing to reciprocating engines wherever fuel is bought at market price. It still funds distributor networks and factory utilisation, and it remains the route into accounts that later need difficult fuel handled. It is a volume base, not a profit base.
Gross Margin: 16-24%

Oilfield Associated Gas Units

Growing on flaring enforcement rather than on economics, which makes this particular forecast political rather than commercial in its character. The watch-out is that committed flaring elimination dates in Iraq and Nigeria have already moved repeatedly without any visible consequence at all for the operators involved.
Gross Margin: 30-42%

What The Unit Earns After Commissioning

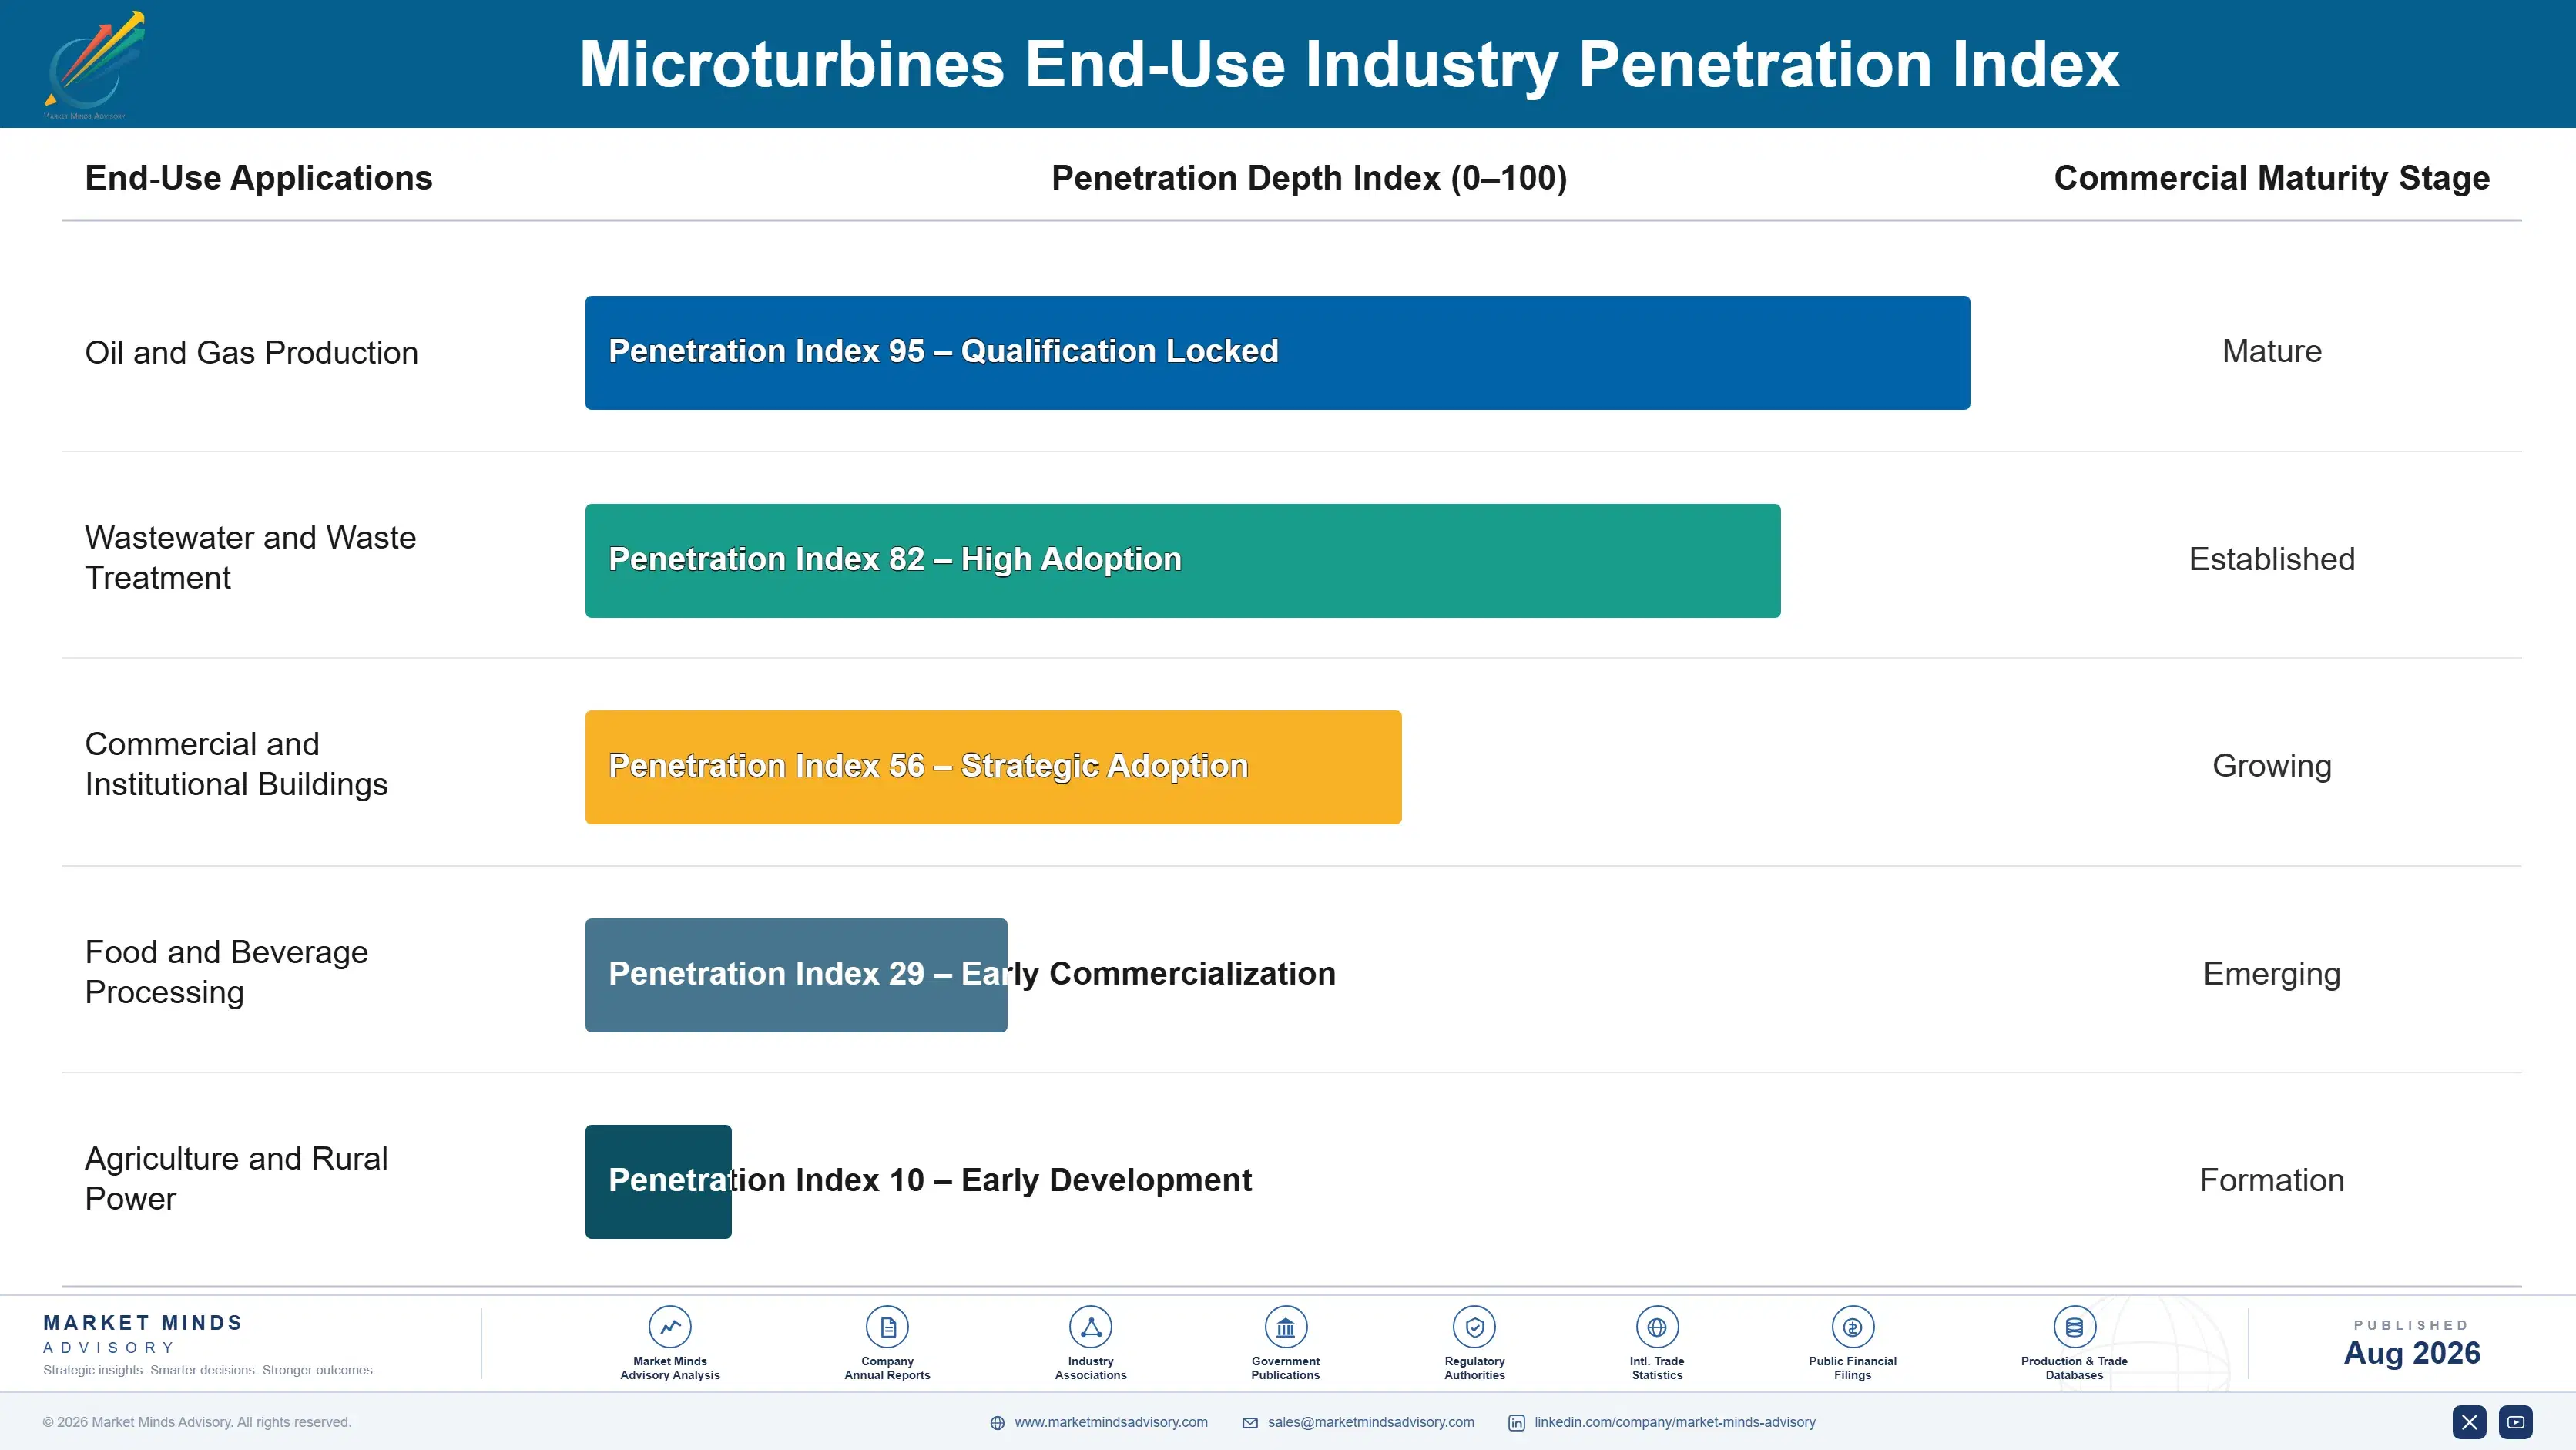
Microturbines produce annuity income that now exceeds what the hardware earns. Scheduled hot section replacement every 40,000 hours, filters, controls, and remote monitoring recur across a twenty-year life, and factory protection plans already carry around 38% of supplier revenue. That income is contracted and largely independent of the capital cycles that historically made this business unpredictable, which is precisely why the industry restructured around it.
Stickiness varies by fuel more than by customer type. Sites running difficult gas are locked in almost completely, because no alternative machine tolerates their fuel and switching means changing the plant rather than the supplier. Clean natural gas users are the least loyal and frequently replace with reciprocating engines at end of life. Rental customers occupy a middle position, committed for the site's production life but free afterwards.

Buyer profiles have moved toward operations and compliance. The decision used to sit with an engineer comparing efficiency and capital cost, a comparison microturbines lose. It increasingly sits with whoever carries responsibility for a flaring permit, an emissions limit, or a gas disposal obligation, and that person is buying a solution to a regulatory problem rather than a generating set.
microturbines-market-end-use-penetration-index-1787334162900

Where To Compete Here

These are among the four positions where our research anticipates prominent divergence between winners and laggards over the coming forecast period. Each is grounded in the demand model, the regulatory perimeter, and the announced capacity pipeline.
01 / DIFFICULT FUEL POSITIONING

Compete only where the fuel is unusable

On clean pipeline gas a reciprocating engine wins on both efficiency and capital cost every single time, and twenty years of determined effort has not changed that arithmetic by any meaningful margin at all. Landfill, digester, and wellhead gas is the only ground where no alternative machine survives the fuel for long, and it is therefore the only ground genuinely worth holding onto. Suppliers still pitching general distributed generation are spending scarce sales effort on comparisons they are certain to lose.
02 / SERVICE CONTRACT DENSITY

Sell the twenty years, not the machine

Factory protection plans already carry around 38% of supplier revenue and recover 6% to 9% of installed value annually, at margins the hardware sale itself never comes anywhere close to reaching. That contracted income survives the capital spending downturns which have twice damaged this industry badly enough to force a complete restructuring of how it sells. It also generates the fuel tolerance data that becomes the technical argument for the next sale, which no laboratory programme would produce as cheaply.
03 / RENTAL FLEET DISCIPLINE

Rent where capital approval will not come

Oilfield and industrial sites with genuinely uncertain production life cannot justify a twenty-year asset, and the sale therefore stalls in capital committee rather than on any technical grounds at all. Rental converts that stalled sale into monthly revenue at yields of a quarter to a third of unit value annually, and the machine simply returns to the fleet when the site closes. Fleet utilisation is the discipline deciding whether the model works, and most operators track it far too loosely.
04 / FUEL ENVELOPE PUBLICATION

Publish what the machine will actually burn

Buyers with difficult gas rarely know whether their own specific composition will actually run in a given machine, and suppliers rarely say precisely enough for anybody to check the claim beforehand. Published tolerance envelopes covering siloxanes, sulphur content, heating value swing, and liquids carryover turn a vague technical conversation into a straightforward qualification exercise that competing engine vendors simply cannot enter at all. It reaches projects worth several hundred thousand dollars each that would otherwise never have reached open tender.

Engagement Snapshot From the Field

A live engagement with an industry participant carrying material or product regulatory and market exposure ahead of a defining policy shift, showing how our research translates into a defensible multi-year portfolio strategy.
MARKET MINDS ADVISORY · CLIENT ENGAGEMENT SUMMARY
Microturbines Producer Strategic Portfolio Review and Transition Roadmap 2026·Investment Scenario on Microturbines Exposure Evaluation 2025-26
CLIENT PROFILE
An independent onshore oil producer operating roughly 400 wells across two North American basins, with annual revenue near USD 620 million (client-reported, unverified by MMA). A substantial share of those wells produced associated gas with no pipeline takeaway at all, and tightening state and federal methane rules had made continued routine flaring commercially and legally untenable.
STRATEGIC CHALLENGE
The producer needed a disposal route for associated gas at wells too remote for pipeline connection and too small for gathering investment. Reciprocating gensets had been trialled and failed within months on liquids carryover. Grid export was impossible at most locations, and the economics had to work without any assumed value for the gas itself.
MMA APPROACH
MMA analysed gas composition and volume variability across the well population, grouping sites by whether onsite electrical load could absorb generated power. Equipment options were assessed on demonstrated tolerance to the measured compositions rather than on manufacturer claims, and rental against purchase economics were modelled against expected remaining well life at each location.
KEY FINDINGS
  1. Roughly 60% of the wells had onsite artificial lift and water handling load sufficient to absorb generated power without any grid export arrangement.
  2. Reciprocating genset failures traced entirely to liquids carryover rather than to gas composition, a condition microturbines tolerated in field trials at comparable sites.
  3. Expected remaining production life at 140 of the wells fell below eight years, making purchase economics unattractive against rental at those specific locations.
  4. Avoided flaring penalties and reduced diesel purchases together exceeded USD 9 million annually (client-reported, unverified by MMA) across the addressable well population.
CLIENT PROFILE
An independent onshore oil producer operating roughly 400 wells across two North American basins, with annual revenue near USD 620 million (client-reported, unverified by MMA). A substantial share of those wells produced associated gas with no pipeline takeaway at all, and tightening state and federal methane rules had made continued routine flaring commercially and legally untenable.
STRATEGIC CHALLENGE
The producer needed a disposal route for associated gas at wells too remote for pipeline connection and too small for gathering investment. Reciprocating gensets had been trialled and failed within months on liquids carryover. Grid export was impossible at most locations, and the economics had to work without any assumed value for the gas itself.
MMA APPROACH
MMA analysed gas composition and volume variability across the well population, grouping sites by whether onsite electrical load could absorb generated power. Equipment options were assessed on demonstrated tolerance to the measured compositions rather than on manufacturer claims, and rental against purchase economics were modelled against expected remaining well life at each location.
KEY FINDINGS
  1. Roughly 60% of the wells had onsite artificial lift and water handling load sufficient to absorb generated power without any grid export arrangement.
  2. Reciprocating genset failures traced entirely to liquids carryover rather than to gas composition, a condition microturbines tolerated in field trials at comparable sites.
  3. Expected remaining production life at 140 of the wells fell below eight years, making purchase economics unattractive against rental at those specific locations.
  4. Avoided flaring penalties and reduced diesel purchases together exceeded USD 9 million annually (client-reported, unverified by MMA) across the addressable well population.
RECOMMENDED STRATEGY
Phase 1: Phase one: deploy purchased units at the wells with the longest remaining production life and the steadiest onsite electrical demand profile. Phase 2: Phase two: use rental arrangements at the shorter-life wells rather than committing capital to assets that would outlast the production itself. Phase 3: Phase three: negotiate fleet-wide service and parts terms across both purchased and rented units to hold overhaul cost predictable throughout.
OUTCOME
The producer deployed units across both purchased and rented arrangements, reporting avoided flaring penalties and diesel savings of approximately USD 7 million in the first full year (client-reported, unverified by MMA). Reliability at the trial sites held through a full year of operation, and the fleet-wide service agreement fixed overhaul cost across the whole deployment.

Frequently Asked Questions

Foundational context covering the market sizes, CAGR, scope, country, region and competition that inform every finding below. This section is provided to cover basics and most often pre-purchase conversations, answered from the MMA Primary Research Dataset.

What is the current size of the Microturbines Market?

The market reached USD 0.4 billion in 2025 and is forecast at USD 0.44 billion for 2026. Demand concentrates on applications where the available fuel would damage a reciprocating engine.

How large will the Microturbines Market be by 2036?

MMA forecasts USD 1.07 billion by 2036, an increase of USD 0.63 billion over 2026. That represents an expansion multiple of 2.43 times across the forecast period.

What is the CAGR for the Microturbines Market 2026 to 2036?

The base case CAGR is 9.4%, with a bull case at 10.7% and a bear case at 8.1%. The bull case depends on flaring enforcement actually being applied in Iraq and Nigeria.

Which segment is growing fastest?

Hydrogen and blended fuel microturbines grow fastest at 15.2%, about 1.62 times the market rate. Most buyers are purchasing certification for future compliance rather than burning hydrogen today.

Who are the major companies in the Microturbines Market?

Capstone Green Energy, Ansaldo Energia, Kawasaki Heavy Industries, Bladon Micro Turbine, and FlexEnergy Solutions lead the market. The top five hold roughly 74% of microturbine revenue, with one supplier accounting for most of the installed base.

Which country is growing fastest?

Saudi Arabia grows fastest at 12.4%, driven by associated gas capture at remote wellheads under commitments to end routine flaring. The gas is free and the alternative is a regulatory penalty.

Report Segmentation Architecture

The full report scope spans multiple orthogonal segmentation dimensions, with cross-tabulated demand data provided for each dimension pair. Coverage extends further to regional breakdowns, trend trajectories, and the competitive detail needed to support segment-level decision-making.

By Fuel Input

  • Hydrogen and Blended Fuel Microturbines
  • Biogas and Landfill Gas Microturbines
  • Associated and Flare Gas Microturbines
  • Natural Gas Microturbines
  • Liquid Fuel Microturbines

By End-Use Industry

  • Oil and Gas Production
  • Wastewater and Waste Treatment
  • Commercial and Institutional Buildings
  • Food and Beverage Processing
  • Agriculture and Rural Power

By Commercial Dimension

  • Direct Project Sales
  • Distributor and Dealer Channel
  • Rental and Power Purchase Arrangements
  • Factory Protection Service Plans
  • Remanufactured and Secondary Units

By Region

  • North America
  • Middle East and Africa
  • Western Europe
  • East Asia
  • South Asia and Pacific
  • Latin America
  • Eastern Europe

Scope, Methodology, and Coverage

Every figure in this report is reproducible from documented input assumptions. The scope below maps the historical period, the forecast horizon, the segmentation dimensions, and the countries covered, alongside the underlying primary and qualitative methodology.
Historical Period
2020 to 2025
Forecast Period
2026 to 2036
Base Year
2025 (USD billions; MMA Primary Research Dataset, August 2026)
Market Definition
The microturbines market comprises packaged gas turbine generating sets rated below one megawatt built on a single-shaft recuperated cycle with air bearings or equivalent oil-free architecture, valued at manufacturer selling prices to end users, distributors, project developers, and rental operators. It spans units configured for natural gas, biogas and landfill gas, oilfield associated and flare gas, liquid fuels, and hydrogen blends, together with the heat recovery modules, fuel conditioning skids, controls, factory protection service plans, and rental and power purchase arrangements attached to them. Reciprocating gas and diesel generating sets, fuel cells, industrial gas turbines rated above one megawatt, turbochargers, turboexpanders, auxiliary power units for aviation, and external combustion micro combined heat and power units are excluded.
Quantitative Units
USD billions (current prices); volume in units shipped and megawatts installed
Segmentation Dimensions
By Fuel Input; By End-Use Industry; By Commercial Dimension; By Region
Regions Covered
North America, Middle East and Africa, Western Europe, East Asia, South Asia and Pacific, Latin America, Eastern Europe
Countries Covered
USA, Canada, Mexico, Saudi Arabia, United Arab Emirates, Iraq, Oman, Nigeria, Algeria, Egypt, South Africa, Italy, Germany, UK, Netherlands, France, Spain, Sweden, Denmark, Switzerland, Austria, Japan, South Korea, China, Taiwan, India, Australia, Indonesia, Malaysia, Thailand, Brazil, Chile, Colombia, Argentina, Poland, Czechia, Romania, Hungary, and additional markets relevant to this sector
Key Companies Profiled
Capstone Green Energy, Ansaldo Energia, Kawasaki Heavy Industries, Bladon Micro Turbine, FlexEnergy Solutions, Micro Turbine Technology BV, Aurelia Turbines, Brayton Energy, IHI Power Systems, Elliott Group, Toyota Turbine and Systems, Samad Power, Calnetix Technologies, Enertwin, Vericor Power Systems, Global Microturbine, E-Quad Power Systems, Bowman Power Group, Yanmar, Baker Hughes
Quantitative Methodology
Primary survey, n=3,800 respondents, Q4 2025, six countries; demand-side model with trade association cross-validation
Qualitative Methodology
47 expert interviews, Q4 2025; applied to validate demand model assumptions, identify emerging dynamics, and assess competitive positioning
Report Format
PDF and XLSX data workbook (Word format preview document)
Publisher
Market Minds Advisory
Report Code
MMA-2026-ENE-589
Published
August 2026
Contact
sales@marketmindsadvisory.com | www.marketmindsadvisory.com

Purchase the full Microturbines Market Report (2026 to 2036).

The full report examines microturbine demand across seven regions and five fuel inputs, with particular attention to why this technology competes only where the available gas would destroy a reciprocating engine. It quantifies the flaring enforcement pipeline, the biogas capacity build, and the hydrogen certification demand that is running ahead of any fuel supply. Competitive analysis covers twenty participants assessed on microturbine revenue, including how service contracts and rental fleets have replaced unit sales as the commercial core. Regional chapters map fuel availability against installed base and service coverage.
Seven-region fuel availability and installed base analysis
Five fuel input segmentation with growth rates
Twenty participant competitive assessment and service coverage mapping
Flaring enforcement pipeline and addressable wellhead sizing
Service contract and rental fleet economics benchmarking
Fuel tolerance envelope comparison against reciprocating alternatives

Built For The People Who Decide

From boardroom strategy to bench-side execution, this report is read cover-to-cover by leaders shaping the next decade of their industry, turning demand scenarios, market dynamics and valuation benchmarks into decisions.
CXOs/ Presidents/ VPs/ Managers
M&A and Corporate Development
Strategy Teams and R&D Heads
Procurement and Product Directors
Regulatory and Compliance Leaders
Investor Relations and Equity Analysts